1
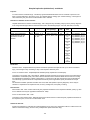
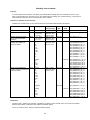
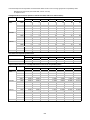
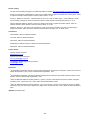
Statistical methods:
The age-standardised deaths at home rate utilises the indirect method of standardisation. The direct method was
found not to be robust as it was affected by small numerator and denominator counts in specific age groups.
Indirect standardisation requires the computation of the ratio of an area’s observed number of events to its
expected number of events if it had experienced the standard age-specific rates. This age-standardised ratio can
be converted into a rate by multiplying it by the crude rate of the standard population.
The standard rates used are those of England for the respective calendar year(s). Male and female rates have
been standardised separately. The rate for persons is standardised for both age and sex.
This methodology is similar to that used for the Clinical Indicators and is described in detail in:
Annex 3: Explanations of statistical methods used in the Compendium (under the sections entitled “Indirectly
Standardised Rates For Clinical Indicators” and “Confidence Intervals Of Indirectly Standardised Rates For Clinical
Indicators”).
Interpretation of indicators:
Type of Indicator - This is a condition-specific cross-sectional comparative indicator reflecting events which act as
a proxy for outcome (quality of dying). In the absence of an absolute standard, comparative data are useful for
monitoring in relation to rates achieved in comparable areas.
Quality of indicator – Annex 12 describes the criteria that should be used to judge the quality of this indicator. The
application of the criteria is dependent on the context (e.g. describing a single organisation, comparing several
organisations) and the level (e.g. national / regional with large numbers of events, local with small numbers of
events) at which the data are to be used.
Confidence Intervals - 95%. Some of the values and factors influencing them may be chance occurrences, with
values fluctuating at random between organisations and from year to year. Numbers of deaths may be small at
individual organisational level. The results should therefore be interpreted with caution and with the aid of
confidence intervals. The 95% confidence interval provides a measure of the statistical precision of the rate for an
area or institution. It indicates a range which, with 95% probability, will contain the underlying value of the
indicator. If the confidence interval for an organisation’s rate is outside the range of the national confidence
intervals, the difference between the two rates is considered statistically significant. If the confidence intervals for
two rates overlap, in most cases the difference between the rates would not be considered statistically significant.
Effect of Case-Mix / severity - Severity of the cancer and need for hospital care have implications for those who
wish to die at home being able to do so. The data available do not allow adjustment for these factors.
Other Potential Confounding Factors - A number of factors outside the control of the NHS such as personal
choice, availability of hospices, and family/community support may contribute to the variation shown by the
indicator.
Relevant National initiatives:
1.
2.
3.
4.
Department of Health. End of life care strategy : Promoting high quality care for all adults at the end of life.
London: Department of Health , 2008.
http://www.dh.gov.uk/en/Publicationsandstatistics/Publications/PublicationsPolicyAndGuidance/DH_086277
Department of Health. The NHS cancer plan and the new NHS: Providing a patient-centred service. London:
Department of Health, 2004.
Department of Health. Pioneering Schemes Named Best of the Best. NHS Beacons – Part of a Concerted
Campaign to Improve Cancer Services. Department of Health, 1999. Press release: reference 1999/0375
Commission for Health Improvement. NHS Cancer Care in England and Wales. National Service Framework
Assessments No.1. London: Commission for Health Improvement, 2001.
Further reading:
1.
2.
3.
Higginson IJ, Thompson M. Children and young people who die from cancer: epidemiology and place of death
in England (1995-9). British Medical Journal 2003; 327: 478-479.
Grande G.E, Todd C.J, Barclay SIG, Farquhar MC. Does hospital at home for palliative care facilitate death at
home? Randomised controlled trial. British Medical Journal 1999; 319: 1472-1475.
Higginson IJ, Jarman B, Astin P, Dolan S. Do social factors affect where patients die: an analysis of 10 years
of cancer deaths in England. Journal of Public Health Medicine 1999; 21(1): 23-28.
Updated: March 2011
238