1
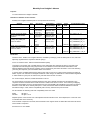
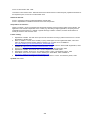
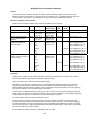
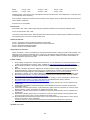
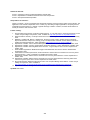
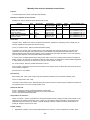
Source of denominator data - ONS.
Comments on denominator data - Data are based on the latest revisions of ONS mid-year population estimates for
the respective years, current as at 24 November 2010.
Statistical methods:
Annex 2: Changes to Office for National Statistics mortality data
Annex 3: Explanations of statistical methods used in the Compendium
Interpretation of indicators:
Quality of indicator - Annex 12 describes the criteria that should be used to judge the quality of this indicator. The
application of the criteria is dependent on the context (e.g. describing a single organisation, comparing several
organisations) and the level (e.g. national / regional with large numbers of events, local with small numbers of
events) at which the data are to be used.
Further reading:
1.
2.
3.
4.
5.
6.
7.
8.
Department of Health. The NHS cancer plan and the new NHS: Providing a patient-centred service. London:
Department of Health, 2004.
NHS Executive. Manual of Cancer Services Standards. London: NHS Executive, 2000.
Department of Health. NHS Cancer Plan. London: Department of Health, 2000.
Department of Health. Saving lives: Our Healthier Nation. London: The Stationery Office, 1999.
World Bank. Economics of Tobacco Control. Washington: World Bank, 1999.
http://www1.worldbank.org/tobacco/book/pdf/tobacco.pdf
Department of Health. Smoking kills – a White Paper on tobacco. London: The Stationery Office, 1998.
Brock A, Griffiths C. Trends in the mortality of young adults aged 15-44 in England and Wales, 1961-2001.
Office for National Statistics Health Statistics Quarterly, No. 19, 2003: 22-31. Available at:
http://www.statistics.gov.uk/downloads/theme_health/HSQ19.pdf
World Health Organization. WHO Framework on Tobacco Control. Geneva: World Health Organization, 2005.
Updated: March 2011
330