1
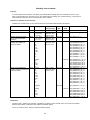
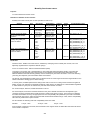
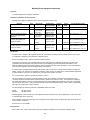
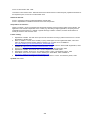
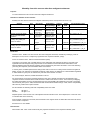
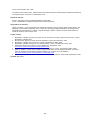
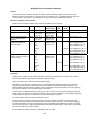
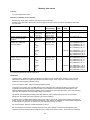
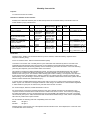
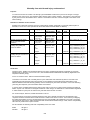
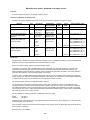
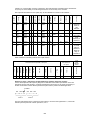
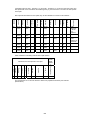
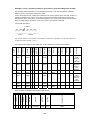
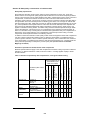
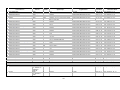
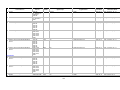
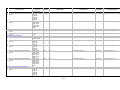
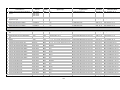
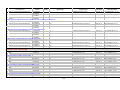
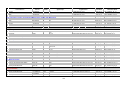
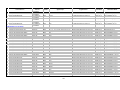
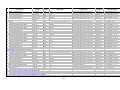
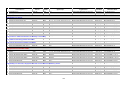
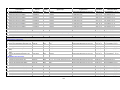
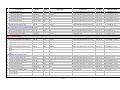
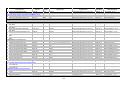
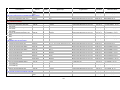
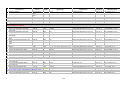
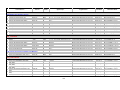
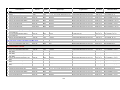
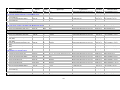
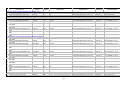
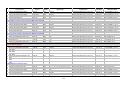
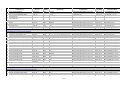
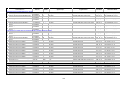
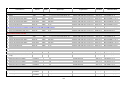
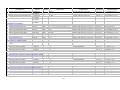
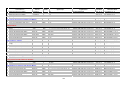
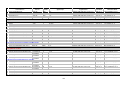
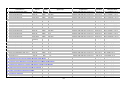
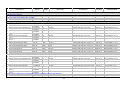
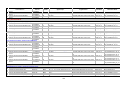
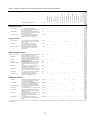
Acute sickness
Purpose:
To reduce levels of sickness and ill health.
Definition of indicator and its variants:
The prevalence of self-reported acute sickness among adults in the two weeks preceding a survey interview.
Statistic
Sex
Age group
Organisation
(see glossary)
Number, percent and
age-standardised percent
MFP
16+
E, GOR, ONS area,
SHA, CTY
Period
Current
data
2001-03
2002-04
2003-05
2004-06
2005-07
2006-08
File_worksheet Name
Trend
data
03H_303VSP1_08_V1
1998-08
03H_303VSP2_08_V1
Numerator:
Numerator data - The number of persons aged 16+ reporting acute sickness in the two weeks preceding the
survey interview, in a sample survey of the health of the population of England.
Source of numerator data - Health Survey for England (HSE), commissioned by the Department of Health and
since April 2005 The Information Centre for health and social care and carried out by the Joint Health Surv*ey Unit
of Social and Community Planning Research and of the Department of Epidemiology and Public Health at
University College, London.
Comments on numerator data - Acute sickness was defined as having to cut down, in the two weeks preceding the
interview, on usual activities (in the house, at school, at work or in free time) due to illness or injury. In order to
assess its severity, those who reported having acute sickness were asked on how many days in the past two
weeks had they been affected.
Denominator:
Denominator data - Respondents aged 16+ in a sample survey of the health of the population of England.
Source of denominator data - See “Numerator data”.
Comments on denominator data - The HSE is a series of annual surveys that began in 1991 with the aim of
monitoring the health of the population. It was designed to measure health and health related behaviours in adults
and children living in private households in England. For each participant, the survey included an interview and a
physical examination by a nurse, at which various physical measurements, tests, and samples of blood and saliva
were collected. These measurements provided biomedical information about known risk factors associated with
disease and objective validation for self-reported health behaviour.
Statistical methods:
The figures have been provided for three-year periods (based on three-year moving averages) and for calendar
years. All calculations of sub-national observed estimates at Government Office Region, ONS area, Strategic
Health Authority and County levels, age-standardised rates, confidence intervals and significance tests were
carried out by the National Centre for Social Research (see Annex 9 for details).
Further reading:
1.
2.
3.
Sproston K and Primatesta P Eds. Health Surveyfor England 2003, National Centre for Social Research,
London: TSO, 2004. Available at:
http://www.archive2.official-documents.co.uk/document/deps/doh/survey03/card/card01.htm
Scholes S, Prescott A and Bajekal M. Health and lifestyle indicators for Strategic Health Authorities, 19942002, London: National Centre for Social Research, 2004. Available at:
http://www.dh.gov.uk/assetRoot/04/07/77/31/04077731.pdf
Joint Health Surveys Unit, National Centre for Social Research and Department of Epidemiology and Public
Health, the Royal Free and University College Medical School, London. The Health Survey for England Cardiovascular disease. London: Her Majesty’s Stationery Office, 1998.
Updated: November 2010
84