1
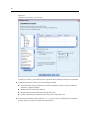
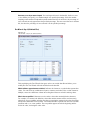
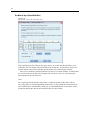
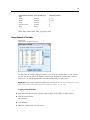
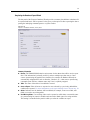
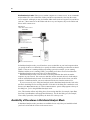
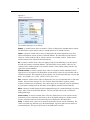
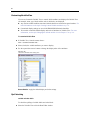
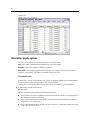
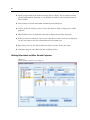
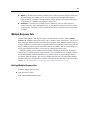
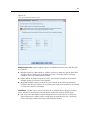
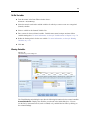
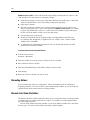
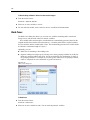
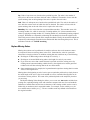
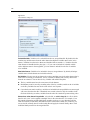
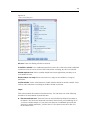
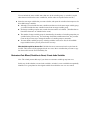
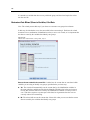
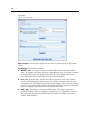
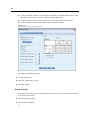
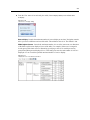
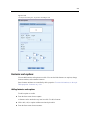
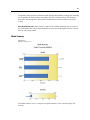
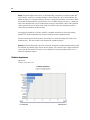
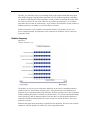
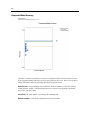
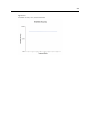
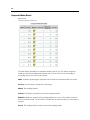
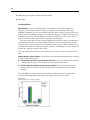
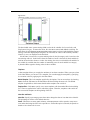
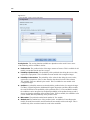
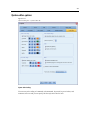
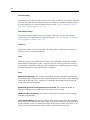
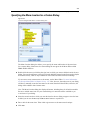
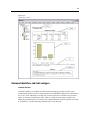
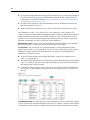
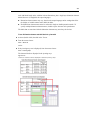
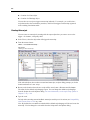
258
Chapter 12
Component Model Accuracy
Figure 12-8
Component Model Accuracy view
The chart is a dot plot of predictive accuracy for component models. Each dot represents one or
more component models with the level of accuracy plotted on the y-axis. Hover over any dot to
obtain information on the corresponding individual component model.
Reference lines. The plot displays color coded lines for the ensemble as well as the reference
model and naïve models. A checkmark appears next to the line corresponding to the model
that will be used for scoring.
Interactivity. The chart updates if you change the combining rule.
Boosted ensembles. A line chart is displayed for boosted ensembles.