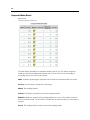
1
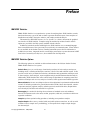
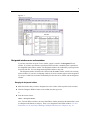
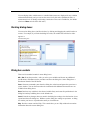
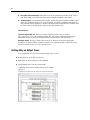
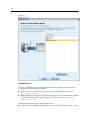
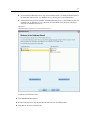
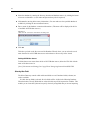
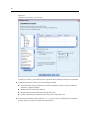
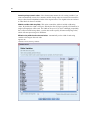
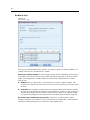
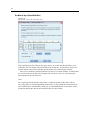
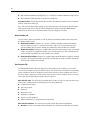
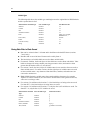
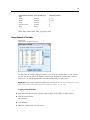
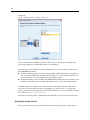
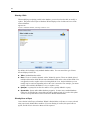
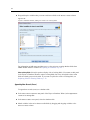
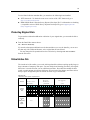
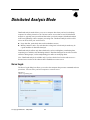
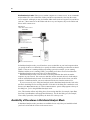
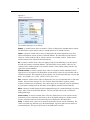
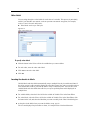
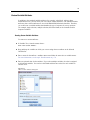
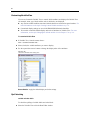
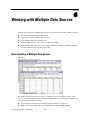
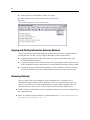
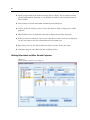
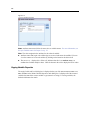
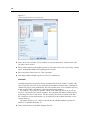
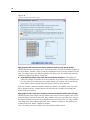
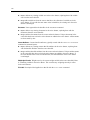
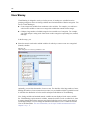
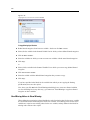
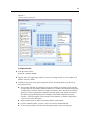
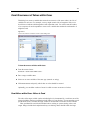
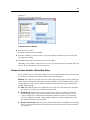
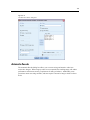
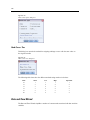
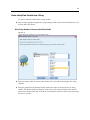
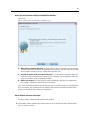
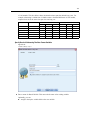
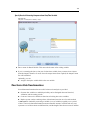
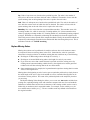
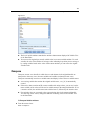
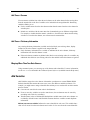
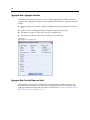
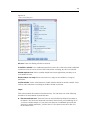
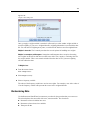
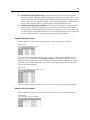
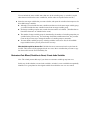
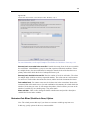
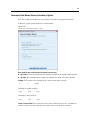
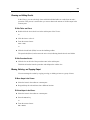
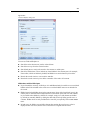
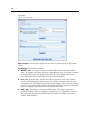
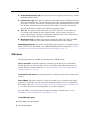
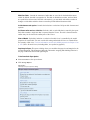
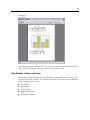
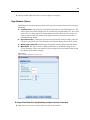
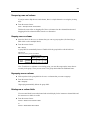
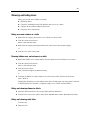
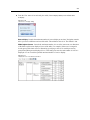
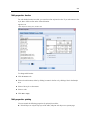
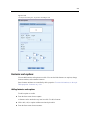
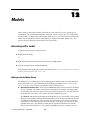
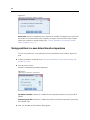
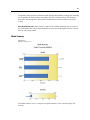
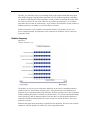
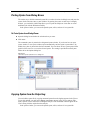
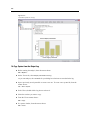
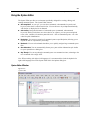
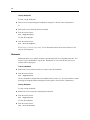
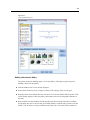
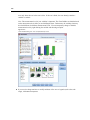
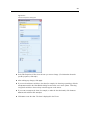
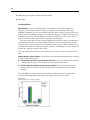
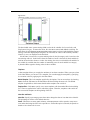
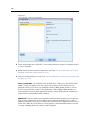
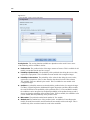
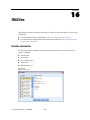
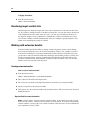
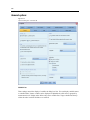
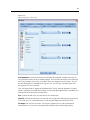
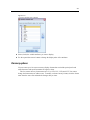
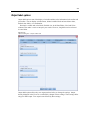
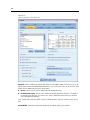
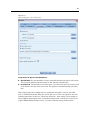
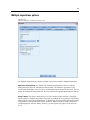
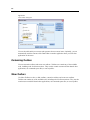
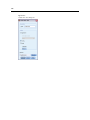
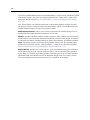
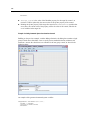
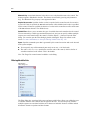
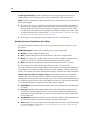
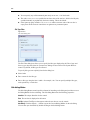
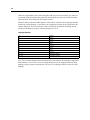
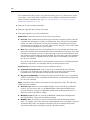
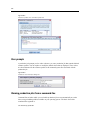
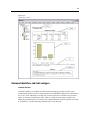
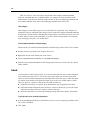
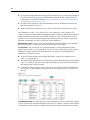
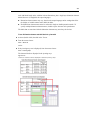
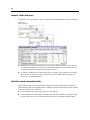
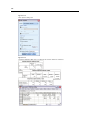
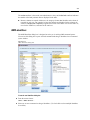
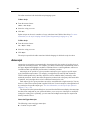
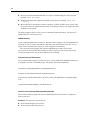
Chapter Working with Output 10 When you run a procedure, the results are displayed in a window called the Viewer. In this window, you can easily navigate to the output that you want to see. You can also manipulate the output and create a document that contains precisely the output that you want. Viewer Results are displayed in the Viewer. You can use the Viewer to: Browse results Show or hide selected tables and charts Change the display order of results by moving selected items Move items between the Viewer and other applications Figure 10-1 Viewer The Viewer is divided into two panes: The left pane contains an outline view of the contents. The right pane contains statistical tables, charts, and text output. You can click an item in the outline to go directly to the corresponding table or chart. You can click and drag the right border of the outline pane to change the width of the outline pane. © Copyright SPSS Inc. 1989, 2010 202