1
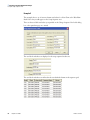
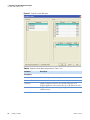
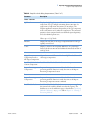
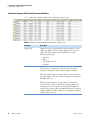
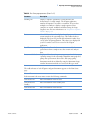
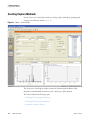
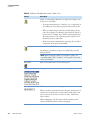
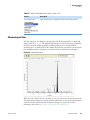
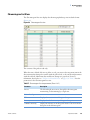
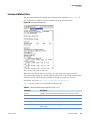
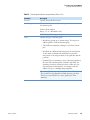
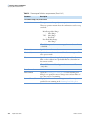
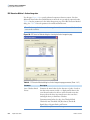
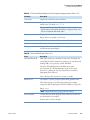
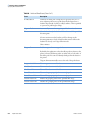
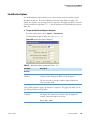
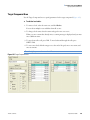
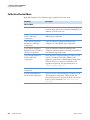
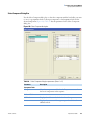
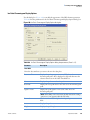
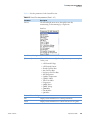
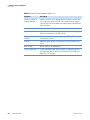
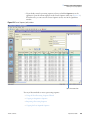
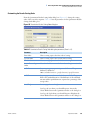
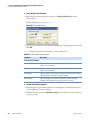
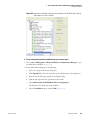
4
Creating a Processing Method
Data Views
Table 104. Spectrum view parameters
Parameter
Description
Arrows
The left and right arrows move through scans in the raw file,
incrementing or decrementing by a single scan.
Item Selector List Options (Survey and Review All Results views only)
ISTD
Displayed spectrum is from the current component’s ISTD.
Component
Displayed spectrum is from the current component.
Shortcut Menu
Open Raw File
[Create Method view only] Opens the Select Raw File dialog box
where you can select the raw file to load.
Lock against All
Change
Specifies that changes to a raw file or parameters (such as retention
time selection) in other panes have no effect on this pane. The
lock icon is red and the lock is closed.
Unlock
Specifies that changes to raw files and relevant parameters cause an
update to occur in this pane, using the new settings. The lock icon
is green and the lock is open.
Spectrum at Peak Apex Displays the spectrum at the selected component peak’s apex.
When more than one chromatogram peak is currently displayed in
the pane, the first chromatogram in the list is used for setting the
RT.
Spectrum at Peak Left
Edge
Displays the spectrum at the selected component peak’s left edge.
When more than one chromatogram peak is currently displayed in
the pane, the first chromatogram in the list is used for setting the
RT.
Spectrum at Peak Right Displays the spectrum at the selected component peak’s right edge.
Edge
When more than one chromatogram peak is currently displayed in
the pane, the first chromatogram in the list is used for setting the
RT.
276
LCquan User Guide
Display Options
Displays the Spectrum Display Options dialog box where you can
modify the appearance of the spectrum in the Spectrum pane. For
more information, see “Spectrum Display Options dialog box
parameters” on page 95 in Chapter 2, “Preparing to Perform
Quantitative Analysis.”
Reset Scaling
Resets the x-axis and y-axis ranges in the Chromatogram pane or
the Spectrum pane to their default values.
Copy to Clipboard
Copies a chromatogram, mass spectrum, or calibration curve to
the Clipboard. You can then paste the data from the Clipboard
buffer into a document.
Thermo Scientific