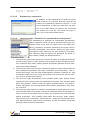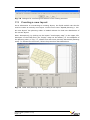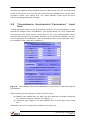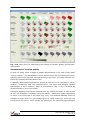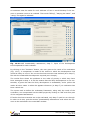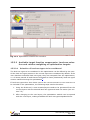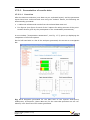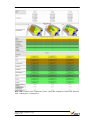
1
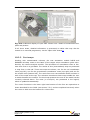
weighting factor for indicator I = priority value for associated problem total number of indicators of associated problem A separate figure is generated for each of the above listed priority values (see e.g. Fig. 17.9). In addition, there is a further figure containing results when no prioritisation is taken into account (weighting factor for all indicators is identical; =1). Each of the figures contains all the diagrams described above; however, the indicator values of the sustainability assessment and the aggregated overall result differ. Thus: # red : weighting factor for indicator I negatively evaluated indicators I # amber : weighting factor for indicator I neutrally evaluated indicators # green : weighting factor for indicator I positively evaluated indicators I I Fig. 17.9 Diagrams generated for the data sets of land-use layouts ScALayout1, ScBLayout1, ScCLayout1 (demo data set) with sustainability assessment results weighted by the median of the priorities. User’s Guide (Version 1.2.0) Page 17-11