1
PeriView Reference Manual
(Software Release 2.1)
Avaya Business Communications Manager
Release 6.0
Document Status: Standard
Document Number: P0602566
Document Version: 2.7
Date: June 2010
© 2010 Avaya Inc.
All Rights Reserved.
Notices
While reasonable efforts have been made to ensure that the information in this document is complete and accurate at the time of printing,
Avaya assumes no liability for any errors. Avaya reserves the right to make changes and corrections to the information in this document
without the obligation to notify any person or organization of such changes.
Documentation disclaimer
Avaya shall not be responsible for any modifications, additions, or deletions to the original published version of this documentation
unless such modifications, additions, or deletions were performed by Avaya. End User agree to indemnify and hold harmless Avaya,
Avaya’s agents, servants and employees against all claims, lawsuits, demands and judgments arising out of, or in connection with,
subsequent modifications, additions or deletions to this documentation, to the extent made by End User.
Link disclaimer
Avaya is not responsible for the contents or reliability of any linked Web sites referenced within this site or documentation(s) provided by
Avaya. Avaya is not responsible for the accuracy of any information, statement or content provided on these sites and does not
necessarily endorse the products, services, or information described or offered within them. Avaya does not guarantee that these links will
work all the time and has no control over the availability of the linked pages.
Warranty
Avaya provides a limited warranty on this product. Refer to your sales agreement to establish the terms of the limited warranty. In
addition, Avaya’s standard warranty language, as well as information regarding support for this product, while under warranty, is
available to Avaya customers and other parties through the Avaya Support Web site: http://www.avaya.com/support
Please note that if you acquired the product from an authorized reseller, the warranty is provided to you by said reseller and not by Avaya.
Licenses
THE SOFTWARE LICENSE TERMS AVAILABLE ON THE AVAYA WEBSITE, HTTP://SUPPORT.AVAYA.COM/LICENSEINFO/
ARE APPLICABLE TO ANYONE WHO DOWNLOADS, USES AND/OR INSTALLS AVAYA SOFTWARE, PURCHASED FROM
AVAYA INC., ANY AVAYA AFFILIATE, OR AN AUTHORIZED AVAYA RESELLER (AS APPLICABLE) UNDER A
COMMERCIAL AGREEMENT WITH AVAYA OR AN AUTHORIZED AVAYA RESELLER. UNLESS OTHERWISE AGREED TO
BY AVAYA IN WRITING, AVAYA DOES NOT EXTEND THIS LICENSE IF THE SOFTWARE WAS OBTAINED FROM ANYONE
OTHER THAN AVAYA, AN AVAYA AFFILIATE OR AN AVAYA AUTHORIZED RESELLER, AND AVAYA RESERVES THE
RIGHT TO TAKE LEGAL ACTION AGAINST YOU AND ANYONE ELSE USING OR SELLING THE SOFTWARE WITHOUT A
LICENSE. BY INSTALLING, DOWNLOADING OR USING THE SOFTWARE, OR AUTHORIZING OTHERS TO DO SO, YOU,
ON BEHALF OF YOURSELF AND THE ENTITY FOR WHOM YOU ARE INSTALLING, DOWNLOADING OR USING THE
SOFTWARE (HEREINAFTER REFERRED TO INTERCHANGEABLY AS "YOU" AND "END USER"), AGREE TO THESE
TERMS AND CONDITIONS AND CREATE A BINDING CONTRACT BETWEEN YOU AND AVAYA INC. OR THE
APPLICABLE AVAYA AFFILIATE ("AVAYA").
Copyright
Except where expressly stated otherwise, no use should be made of the Documentation(s) and Product(s) provided by Avaya. All content
in this documentation(s) and the product(s) provided by Avaya including the selection, arrangement and design of the content is owned
either by Avaya or its licensors and is protected by copyright and other intellectual property laws including the sui generis rights relating
to the protection of databases. You may not modify, copy, reproduce, republish, upload, post, transmit or distribute in any way any
content, in whole or in part, including any code and software. Unauthorized reproduction, transmission, dissemination, storage, and or
use without the express written consent of Avaya can be a criminal, as well as a civil offense under the applicable law.
Third Party Components
Certain software programs or portions thereof included in the Product may contain software distributed under third party agreements
("Third Party Components"), which may contain terms that expand or limit rights to use certain portions of the Product ("Third Party
Terms"). Information regarding distributed Linux OS source code (for those Products that have distributed the Linux OS source code),
and identifying the copyright holders of the Third Party Components and the Third Party Terms that apply to them is available on the
Avaya Support Web site: http://support.avaya.com/Copyright.
Trademarks
The trademarks, logos and service marks ("Marks") displayed in this site, the documentation(s) and product(s) provided by Avaya are the
registered or unregistered Marks of Avaya, its affiliates, or other third parties. Users are not permitted to use such Marks without prior
written consent from Avaya or such third party which may own the Mark. Nothing contained in this site, the documentation(s) and
product(s) should be construed as granting, by implication, estoppel, or otherwise, any license or right in and to the Marks without the
express written permission of Avaya or the applicable third party. Avaya is a registered trademark of Avaya Inc. All non-Avaya
trademarks are the property of their respective owners.
Downloading documents
For the most current versions of documentation, see the Avaya Support. Web site: http://www.avaya.com/support
Contact Avaya Support
Avaya provides a telephone number for you to use to report problems or to ask questions about your product. The support telephone
number is 1-800-242-2121 in the United States. For additional support telephone numbers, see the Avaya Web site: http://
www.avaya.com/support
Table of Contents
Table of Contents
Preface . . . . . . . . . . . . . . . . . . . . . . . . . . . . . . . . . . . . . . . . . . . ix
Scope . . . . . . . . . . . . . . . . . . . . . . . . . . . . . . . . . . . . . . . . . . . . . . . x
Intended Audience . . . . . . . . . . . . . . . . . . . . . . . . . . . . . . . . . . . . . x
How to Use This Manual . . . . . . . . . . . . . . . . . . . . . . . . . . . . . . . . x
Organization of This Manual . . . . . . . . . . . . . . . . . . . . . . . . . . . . xi
Conventions Used in This Manual . . . . . . . . . . . . . . . . . . . . . . . . xii
Solaris and Windows 2000 Conventions . . . . . . . . . . . . . . . . . . xiii
Trademark Conventions . . . . . . . . . . . . . . . . . . . . . . . . . . . . . . . xiii
Working with PeriView . . . . . . . . . . . . . . . . . . . . . . . . . . . . . . 1
Introduction to PeriView . . . . . . . . . . . . . . . . . . . . . . . . . . . . . . . . 2
PeriView Work Environment . . . . . . . . . . . . . . . . . . . . . . . . . . . . . 4
Configurations and Naming Conventions. . . . . . . . . . . . . . . . . 4
Single Processing Server . . . . . . . . . . . . . . . . . . . . . . . . . . 4
MPS Network Configuration . . . . . . . . . . . . . . . . . . . . . . . 4
Components in the MPS . . . . . . . . . . . . . . . . . . . . . . . . . . . . . . 5
Types of Components . . . . . . . . . . . . . . . . . . . . . . . . . . . . 5
Start PeriView and Login . . . . . . . . . . . . . . . . . . . . . . . . . . . . . . . . 7
Client Based . . . . . . . . . . . . . . . . . . . . . . . . . . . . . . . . . . . . . . . 7
Startup . . . . . . . . . . . . . . . . . . . . . . . . . . . . . . . . . . . . . . . . 7
Browser Based . . . . . . . . . . . . . . . . . . . . . . . . . . . . . . . . . . . . . 7
Startup . . . . . . . . . . . . . . . . . . . . . . . . . . . . . . . . . . . . . . . . 7
Login. . . . . . . . . . . . . . . . . . . . . . . . . . . . . . . . . . . . . . . . . . . . 10
Understanding PeriView. . . . . . . . . . . . . . . . . . . . . . . . . . . . . . . . 11
Navigating PeriView. . . . . . . . . . . . . . . . . . . . . . . . . . . . . . . . . . . 12
Toolbars . . . . . . . . . . . . . . . . . . . . . . . . . . . . . . . . . . . . . . . . . 12
Menus . . . . . . . . . . . . . . . . . . . . . . . . . . . . . . . . . . . . . . . . . . . 12
Right-click Menus. . . . . . . . . . . . . . . . . . . . . . . . . . . . . . . . . . 12
Screen Tips . . . . . . . . . . . . . . . . . . . . . . . . . . . . . . . . . . . . . . . 12
PeriView Toolbars . . . . . . . . . . . . . . . . . . . . . . . . . . . . . . . . . 13
Management Toolbar . . . . . . . . . . . . . . . . . . . . . . . . . . . . 13
Status Toolbar . . . . . . . . . . . . . . . . . . . . . . . . . . . . . . . . . 13
Alarms Toolbar . . . . . . . . . . . . . . . . . . . . . . . . . . . . . . . . 14
PeriView Menus . . . . . . . . . . . . . . . . . . . . . . . . . . . . . . . . . . . 15
The File Menu . . . . . . . . . . . . . . . . . . . . . . . . . . . . . . . . . 15
The Window Menu . . . . . . . . . . . . . . . . . . . . . . . . . . . . . 17
The Help Menu . . . . . . . . . . . . . . . . . . . . . . . . . . . . . . . . 18
The Navigation Pane. . . . . . . . . . . . . . . . . . . . . . . . . . . . . . . . 19
Lines . . . . . . . . . . . . . . . . . . . . . . . . . . . . . . . . . . . . . . . . . 19
Clusters . . . . . . . . . . . . . . . . . . . . . . . . . . . . . . . . . . . . . . 19
Spans . . . . . . . . . . . . . . . . . . . . . . . . . . . . . . . . . . . . . . . . 19
Domains . . . . . . . . . . . . . . . . . . . . . . . . . . . . . . . . . . . . . . 19
Nodes . . . . . . . . . . . . . . . . . . . . . . . . . . . . . . . . . . . . . . . . 19
# P0602566 Ver: 2.7
Page iii
PeriView Reference Manual
Components . . . . . . . . . . . . . . . . . . . . . . . . . . . . . . . . . . . 19
Applications . . . . . . . . . . . . . . . . . . . . . . . . . . . . . . . . . . . 20
Tree Objects and Their States . . . . . . . . . . . . . . . . . . . . . . . . . . . . 21
Tree Objects . . . . . . . . . . . . . . . . . . . . . . . . . . . . . . . . . . . . . . 21
Tree Object States . . . . . . . . . . . . . . . . . . . . . . . . . . . . . . . . . . 22
Browser-based PeriView and the Java Cache. . . . . . . . . . . . . . . . 23
User Manager . . . . . . . . . . . . . . . . . . . . . . . . . . . . . . . . . . . . . 25
Launching the User Manager Plugin . . . . . . . . . . . . . . . . . . . . . . 26
Introduction to User Manager. . . . . . . . . . . . . . . . . . . . . . . . . . . . 26
User Manager—User Tab . . . . . . . . . . . . . . . . . . . . . . . . . . . . . . . 27
Add a new User. . . . . . . . . . . . . . . . . . . . . . . . . . . . . . . . . . . . 27
Remove a User . . . . . . . . . . . . . . . . . . . . . . . . . . . . . . . . . . . . 31
Setting User Properties . . . . . . . . . . . . . . . . . . . . . . . . . . . . . . 32
Setting User Privileges . . . . . . . . . . . . . . . . . . . . . . . . . . . . . . 36
Membership Management . . . . . . . . . . . . . . . . . . . . . . . . . . . 39
User’s Advanced Properties . . . . . . . . . . . . . . . . . . . . . . . . . . 42
Detailed Description of the Fault Priority of User screen 44
Setting Password. . . . . . . . . . . . . . . . . . . . . . . . . . . . . . . . . . . 45
Configuring Global Properties . . . . . . . . . . . . . . . . . . . . . . . . 46
Detailed Description of the Global Properties screen . . . 46
User Manager—Group Tab . . . . . . . . . . . . . . . . . . . . . . . . . . . . . 48
Adding a new Group. . . . . . . . . . . . . . . . . . . . . . . . . . . . . . . . 48
Remove a Group . . . . . . . . . . . . . . . . . . . . . . . . . . . . . . . . . . . 50
Setting Group Properties. . . . . . . . . . . . . . . . . . . . . . . . . . . . . 51
Setting Group Privileges . . . . . . . . . . . . . . . . . . . . . . . . . . . . . 54
Member Management . . . . . . . . . . . . . . . . . . . . . . . . . . . . . . . 57
Group’s Advanced Properties . . . . . . . . . . . . . . . . . . . . . . . . . 60
Application Configuration . . . . . . . . . . . . . . . . . . . . . . . . . . 63
Launching the Application Configuration Plug-in . . . . . . . . . . . 64
Introduction to Application Configuration . . . . . . . . . . . . . . . . . 65
Configurations Options. . . . . . . . . . . . . . . . . . . . . . . . . . . . . . 65
File Requirements . . . . . . . . . . . . . . . . . . . . . . . . . . . . . . 65
Configure Standard Applications . . . . . . . . . . . . . . . . . . . . . . 66
Application . . . . . . . . . . . . . . . . . . . . . . . . . . . . . . . . . . . . 66
Application Type . . . . . . . . . . . . . . . . . . . . . . . . . . . . . . . 66
Configuration Type . . . . . . . . . . . . . . . . . . . . . . . . . . . . . 66
Configuration Options . . . . . . . . . . . . . . . . . . . . . . . . . . . 66
Save or Deploy . . . . . . . . . . . . . . . . . . . . . . . . . . . . . . . . . 66
The Application Configuration Window . . . . . . . . . . . . . . . . 67
Identify the Application to Configure . . . . . . . . . . . . . . . 68
Define the Application Type . . . . . . . . . . . . . . . . . . . . . . 68
Define the Configuration Type . . . . . . . . . . . . . . . . . . . . 69
Define Custom Configurations . . . . . . . . . . . . . . . . . . . . 70
Page iv
# P0602566 Ver: 2.7
Table of Contents
Save . . . . . . . . . . . . . . . . . . . . . . . . . . . . . . . . . . . . . . . . . 72
Deploy . . . . . . . . . . . . . . . . . . . . . . . . . . . . . . . . . . . . . . . 72
Configuration Options’ Categories . . . . . . . . . . . . . . . . . . . . . 73
Data Processing Options . . . . . . . . . . . . . . . . . . . . . . . . . 74
Shared Libraries . . . . . . . . . . . . . . . . . . . . . . . . . . . . . . . . 78
Host Communications Options . . . . . . . . . . . . . . . . . . . . 81
Execution Options . . . . . . . . . . . . . . . . . . . . . . . . . . . . . . 84
Diagnostic Options . . . . . . . . . . . . . . . . . . . . . . . . . . . . . 97
Vocabulary Options . . . . . . . . . . . . . . . . . . . . . . . . . . . . 100
Configure VoiceXML Applications . . . . . . . . . . . . . . . . . . . . . . 104
Define Custom Configurations . . . . . . . . . . . . . . . . . . . 105
Save the Configuration . . . . . . . . . . . . . . . . . . . . . . . . . 105
Deploy the Application . . . . . . . . . . . . . . . . . . . . . . . . . 105
Application Manager . . . . . . . . . . . . . . . . . . . . . . . . . . . . . . 107
Launching the Application Management Plug-in . . . . . . . . . . . 108
Introduction to Application Management . . . . . . . . . . . . . . . . . 109
Application Configuration . . . . . . . . . . . . . . . . . . . . . . . 109
Enter Locations Information . . . . . . . . . . . . . . . . . . . . . 110
Designate the Assign, Start and Restart Order . . . . . 111
Enter Applications Information . . . . . . . . . . . . . . . . . . . 112
Define the Termination Type . . . . . . . . . . . . . . . . . . . . . 113
Expand and Collapse the Tree . . . . . . . . . . . . . . . . . . . . . . . 115
Tree Object Information . . . . . . . . . . . . . . . . . . . . . . . . . . . . 116
Types of Applications . . . . . . . . . . . . . . . . . . . . . . . . . . . . . . 118
Types of Phone Lines . . . . . . . . . . . . . . . . . . . . . . . . . . . . . . 119
File Location Requirements . . . . . . . . . . . . . . . . . . . . . . . . . 120
Application Management Actions . . . . . . . . . . . . . . . . . . . . . . . 122
Assign Action . . . . . . . . . . . . . . . . . . . . . . . . . . . . . . . . . . . . 123
Assign/Start Order . . . . . . . . . . . . . . . . . . . . . . . . . . . . . 123
Configuration File Requirements . . . . . . . . . . . . . . . . . . 123
Assign Lines Window Icons . . . . . . . . . . . . . . . . . . . . . 123
Start the Assign Lines Action . . . . . . . . . . . . . . . . . . . . 124
Assign Lines Progress . . . . . . . . . . . . . . . . . . . . . . . . . . 125
Start and Restart Action . . . . . . . . . . . . . . . . . . . . . . . . . . . . 125
Start/Restart Order . . . . . . . . . . . . . . . . . . . . . . . . . . . . . 125
Configuration File Requirements . . . . . . . . . . . . . . . . . . 125
Start and Restart Window Icons . . . . . . . . . . . . . . . . . . 125
Start or Restart Lines Action . . . . . . . . . . . . . . . . . . . . . 126
Start and Restart Lines Progress . . . . . . . . . . . . . . . . . . 127
Terminate or Unassign Action . . . . . . . . . . . . . . . . . . . . . . . 127
File Maintenance . . . . . . . . . . . . . . . . . . . . . . . . . . . . . . 127
Terminate/Unassign Window Icons . . . . . . . . . . . . . . . . 128
Start the Terminate or Unassign Lines Action . . . . . . . . 128
Window Icons . . . . . . . . . . . . . . . . . . . . . . . . . . . . . . . . 129
# P0602566 Ver: 2.7
Page v
PeriView Reference Manual
Terminate and Unassign Actions . . . . . . . . . . . . . . . . . . 129
Select Terminate/Unassign Options . . . . . . . . . . . . . . . . 129
Terminate and Unassign Lines . . . . . . . . . . . . . . . . . . . 131
Terminate/Un-Assign Lines Progress . . . . . . . . . . . . . . 133
Reorder Action . . . . . . . . . . . . . . . . . . . . . . . . . . . . . . . . . . . 133
How are applications assigned to the list? . . . . . . . . . . . 134
What determines the assigned/started order? . . . . . . . . . 134
Why reorder the list? . . . . . . . . . . . . . . . . . . . . . . . . . . . 134
What affects the order of items on the list? . . . . . . . . . . 135
Where is the information stored? . . . . . . . . . . . . . . . . . . 135
How do I reorder the list? . . . . . . . . . . . . . . . . . . . . . . . 135
Application Management Options . . . . . . . . . . . . . . . . . . . . . . . 137
Application Management Event Cycle . . . . . . . . . . . . . . . . . . . . 139
Status Tools . . . . . . . . . . . . . . . . . . . . . . . . . . . . . . . . . . . . . . 145
Introduction to the Status Tools . . . . . . . . . . . . . . . . . . . . . . . . . 146
Working with the Status Tools . . . . . . . . . . . . . . . . . . . . . . . . . . 147
Tree Objects Without Phone Lines . . . . . . . . . . . . . . . . . . . . 148
Overview. . . . . . . . . . . . . . . . . . . . . . . . . . . . . . . . . . . . . . . . . . . 149
Phone Line Status . . . . . . . . . . . . . . . . . . . . . . . . . . . . . . . . . . . 150
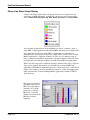
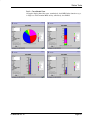
Phone Line Status Graph Display . . . . . . . . . . . . . . . . . . . . . . . . 152
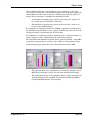
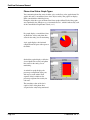
Phone Line Status Graph Types . . . . . . . . . . . . . . . . . . . . . . 154
Consolidated versus Individual Viewpoints . . . . . . . . . . . . . 156
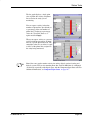
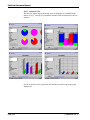
Linked Application Status Bar Graph. . . . . . . . . . . . . . . . . . . . . 159
Linked Application Status Graph Display . . . . . . . . . . . . . . 159
Linked Graph Properties . . . . . . . . . . . . . . . . . . . . . . . . . . . . 163
Component Span Status . . . . . . . . . . . . . . . . . . . . . . . . . . . . . . . 167
Component Span Status Information . . . . . . . . . . . . . . . . . . 168
Component Host Status . . . . . . . . . . . . . . . . . . . . . . . . . . . . . . . 173
Component Host Status Information . . . . . . . . . . . . . . . . . . 175
MPS Control Center . . . . . . . . . . . . . . . . . . . . . . . . . . . . . . 179
Introduction to MPS Control Center . . . . . . . . . . . . . . . . . . . . . 180
MMDP Configuration. . . . . . . . . . . . . . . . . . . . . . . . . . . . . . . . . 181
Launching the MMDP Configuration Tool . . . . . . . . . . . . . 181
MMDP Configurator—Action Buttons . . . . . . . . . . . . . 182
Adding a Data Provider . . . . . . . . . . . . . . . . . . . . . . . . . . . . 182
Adding a Consolidator Data Provider . . . . . . . . . . . . . . 183
Adding a Service Data Provider . . . . . . . . . . . . . . . . . . 186
Removing Data Provider . . . . . . . . . . . . . . . . . . . . . . . . . . . 188
Create a Data Provider Connection . . . . . . . . . . . . . . . . . . . 189
Remove a Data Provider Connection . . . . . . . . . . . . . . . . . . 191
Adding Monitored System . . . . . . . . . . . . . . . . . . . . . . . . . . 192
Removing Monitored System . . . . . . . . . . . . . . . . . . . . . . . . 193
Supporting Data Replication in MMDP . . . . . . . . . . . . . . . . 194
Page vi
# P0602566 Ver: 2.7
Table of Contents
MPS Configuration . . . . . . . . . . . . . . . . . . . . . . . . . . . . . . . . 197
Function . . . . . . . . . . . . . . . . . . . . . . . . . . . . . . . . . . . . . 198
MMF Configuration . . . . . . . . . . . . . . . . . . . . . . . . . . . . . . . 204
Function . . . . . . . . . . . . . . . . . . . . . . . . . . . . . . . . . . . . . 204
VOS Configuration . . . . . . . . . . . . . . . . . . . . . . . . . . . . . . . . 206
VpsHosts Configuration . . . . . . . . . . . . . . . . . . . . . . . . . . . . 207
Cluster Configuration . . . . . . . . . . . . . . . . . . . . . . . . . . . . . . 208
IPML Configuration . . . . . . . . . . . . . . . . . . . . . . . . . . . . . . . 208
Choose the Packages to Configure . . . . . . . . . . . . . . . . . . . . 208
Telephony Link Server . . . . . . . . . . . . . . . . . . . . . . . . . . . . . . . . 215
CCT-IVR Integration . . . . . . . . . . . . . . . . . . . . . . . . . . . . . . . . . 220
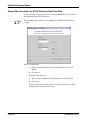
SCCS Host Data Exchange (Bi-Directional) Interface. . . . . . . . 223
Server Side Connection for SCCS Server for Real-Time Stats . 226
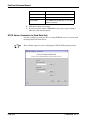
SCCS Server Connection to Send Data Only . . . . . . . . . . . . . . . 228
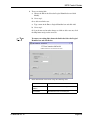
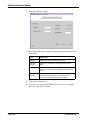
TAPI Server Connection to Symposium Microsoft TAPI server 231
CTI Connection to the IVR. . . . . . . . . . . . . . . . . . . . . . . . . . . . . 234
Real-Time Agent Stats Connection to the IVR . . . . . . . . . . . . . 237
TAPI SCCS Connection to the IVR . . . . . . . . . . . . . . . . . . . . . . 240
TAPI Connection to the IVR . . . . . . . . . . . . . . . . . . . . . . . . . . . 243
Alarm Viewer . . . . . . . . . . . . . . . . . . . . . . . . . . . . . . . . . . . . 247
Introduction to the Alarm Viewer . . . . . . . . . . . . . . . . . . . . . . . 248
Working with an Alarm Filter in the Alarm Viewer . . . . . . . . . 249
Source of Alarm Information . . . . . . . . . . . . . . . . . . . . . . . . . . . 251
Live Alarms . . . . . . . . . . . . . . . . . . . . . . . . . . . . . . . . . . . . . 251
Default Alarm Log Files . . . . . . . . . . . . . . . . . . . . . . . . . . . . 251
Alarm Viewer Window. . . . . . . . . . . . . . . . . . . . . . . . . . . . . . . . 253
Alarm Information . . . . . . . . . . . . . . . . . . . . . . . . . . . . . . . . 253
Data Format . . . . . . . . . . . . . . . . . . . . . . . . . . . . . . . . . . 253
Source of Alarm Information . . . . . . . . . . . . . . . . . . . . . 253
Alarm Message Length . . . . . . . . . . . . . . . . . . . . . . . . . 254
View Live Alarms. . . . . . . . . . . . . . . . . . . . . . . . . . . . . . . . . . . . 255
View Default Alarm Log Files . . . . . . . . . . . . . . . . . . . . . . . . . . 256
Filter Alarms . . . . . . . . . . . . . . . . . . . . . . . . . . . . . . . . . . . . . . . . 258
Creating a Filter . . . . . . . . . . . . . . . . . . . . . . . . . . . . . . . . . . . . . 259
Simple Filter . . . . . . . . . . . . . . . . . . . . . . . . . . . . . . . . . . . . . 259
Simple Filter Parameters . . . . . . . . . . . . . . . . . . . . . . . . 259
Advanced Filter. . . . . . . . . . . . . . . . . . . . . . . . . . . . . . . . . . . 261
Advanced Filter Parameters . . . . . . . . . . . . . . . . . . . . . . 261
Saving a Filter . . . . . . . . . . . . . . . . . . . . . . . . . . . . . . . . . . . . . . . 264
Filtering Alarm Log Files . . . . . . . . . . . . . . . . . . . . . . . . . . . . . . 265
Configuring Data Provider for PeriView . . . . . . . . . . . . . . 267
Introduction . . . . . . . . . . . . . . . . . . . . . . . . . . . . . . . . . . . . . . . . 268
# P0602566 Ver: 2.7
Page vii
PeriView Reference Manual
Netscape for Solaris Installation . . . . . . . . . . . . . . . . . . . . . 269
Introduction . . . . . . . . . . . . . . . . . . . . . . . . . . . . . . . . . . . . . . . . 270
Installing Netscape 4.7X for Solaris/SPARC . . . . . . . . . . . . 270
Installing Java Plug-in . . . . . . . . . . . . . . . . . . . . . . . . . . . . . 270
Index . . . . . . . . . . . . . . . . . . . . . . . . . . . . . . . . . . . . . . . . . . . 271
Page viii
# P0602566 Ver: 2.7
Preface
PeriView Reference Manual
Scope
PeriView is a Graphical User Interface (GUI) tool that is used with the Avaya Media
Processing Server Series (hereafter, known as Processing Server).
The PeriView Reference Manual provides information on how to use PeriView and its
subset of tools. A companion document, PeriView Quick Start Guide offers a
concentrated version of this material.
In addition to these documents, refer to the Processing Server reference material,
available through the Reference Material link.
Intended Audience
This document is useful to any person who uses PeriView to interact with the
Processing Server systems. It is expected that you complete the training programs
conducted as part of the initial system installation. In addition, it is important to be
familiar with site-specific procedures relating to the Processing Servers. Basic
knowledge of the Solaris and/or Windows 2000 operating system(s) is assumed.
How to Use This Manual
This manual uses many standard terms relating to computer system and software
application functions. However, it contains some terminology that can only be
explained in the context of the Avaya Media Processor Server (Avaya MPS) system.
Refer to the Glossary of Avaya MPS Terminology for definitions of MPS specific
terms.
Initially, you should read this manual at least once, from start to finish. Later, you can
use the Table of Contents to locate topics of interest for reference and review.
If you are reading this document online, use the cross-reference links (shown in blue)
to quickly locate related topics. <LEFT> click once with your mouse while positioned
with your cursor over the cross-reference link. Click on any point in a Table of
Contents entry to move to that topic. Click on the page number of any Index entry to
access that topic page.
To familiarize yourself with various specialized textual references within the manual,
see Conventions Used in This Manual on page xii.
Periphonics is part of Avaya. The name Periphonics, and variations thereof, appear in
this manual only where it is referred to in a product. (For examples, a PeriProducer
application, the PERImps package, the perirev command, etc.)
Page x
# P0602566 Ver: 2.7
Preface
Organization of This Manual
This manual contains eight chapters which familiarize you with the PeriView, and 2
appendices that give detailed information on more technical topics.
Chapter 1 — Working with Periview
This chapter introduces you to the PeriView tool. It helps you in understanding the
suite of graphical tools that Periview offers to administer, operate and control the
Avaya Media Processing Series (Avaya MPS).
Chapter 2 — User Manager
This chapter allows you to understand the working of the User Manager. It also briefly
explains the procedure to add/delete accounts and change user/group privileges and
properties.
Chapter 3 — Application Configuration
This chapter helps you to understand the usage of the Configure Applications tool to
create a file that defines the execution parameters and the run-time environment for an
application.
Chapter 4 — Application Manager
This chapter introduces you to the Application Manager (also known as APPMAN)
tool. It also helps you in understanding the usage of the APPMAN tool to manage
applications in the network.
Chapter 5 — Status Tools
This chapter helps you to use the Status tools to monitor the activity in the
environment. It helps you in monitoring the application phone line status with a set of
graphs that you launch using the tree objects.
Chapter 6 — MPS Control Center
This chapter introduces you to the rich set of tools provided by the MPS Control
Center.
Chapter 7 — Alarm Viewer
This chapter provides information on how to use the Alarm Viewer to view the live
and logged alarms. It also provides an insight into the Alarm filter tool.
Appendix A — Netscape for Solaris Installation
This appendix provides you the details for installing Netscape and Java plug-in.
# P0602566 Ver: 2.7
Page xi
PeriView Reference Manual
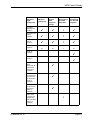
Conventions Used in This Manual
This manual uses different fonts and symbols to differentiate between document
elements and types of information. These conventions are summarized in the
following table.
Conventions Used in This Manual Sheet 1 of 2
Notation
Description
Normal text
Normal text font is used for most of the document.
important term
The Italics font is used to introduce new terms, to highlight
meaningful words or phrases, or to distinguish specific terms from
nearby text.
system
command
This font indicates a system command and/or its arguments. Such
keywords are to be entered exactly as shown (i.e., users are not to
fill in their own values).
command,
condition
and alarm
Command, Condition and Alarm references appear on the screen
in magenta text and reference the Command Reference Manual,
the PeriProducer User’s Guide, or the Alarm Reference Manual,
respectively. Refer to these documents for detailed information
about Commands, Conditions, and Alarms.
file name /
directory
This font is used for highlighting the names of disk directories, files,
and extensions for file names. It is also used to show displays on
text-based screens (e.g., to show the contents of a file.)
on-screen field
This font is used for field labels, on-screen menu buttons, and
action buttons.
<KEY NAME>
A term that appears within angled brackets denotes a terminal
keyboard key, a telephone keypad button, or a system mouse
button.
Book Reference
This font indicates the names of other publications referenced
within the document.
cross reference
A cross reference appears on the screen in blue text. Click on the
cross reference to access the referenced location. A cross
reference that refers to a section name accesses the first page of
that section.
The Note icon identifies notes, important facts, and other keys to
understanding.
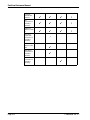
!
Page xii
The Caution icon identifies procedures or events that require
special attention. The icon indicates a warning that serious
problems may arise if the stated instructions are improperly
followed.
# P0602566 Ver: 2.7
Preface
Conventions Used in This Manual Sheet 2 of 2
Notation
Description
The flying Window icon identifies procedures or events that apply
to the Windows 2000 operating system only. (1)
The Solaris icon identifies procedures or events that apply to the
Solaris operating system only. (2)
(1): Windows 2000 and the flying Window logo are either trademarks or registered
trademarks of the Microsoft Corporation.
(2): Solaris is a trademark or registered trademark of Sun Microsystems, Inc. in the
United States and other countries.
Solaris and Windows 2000 Conventions
This manual depicts examples (command line syntax, configuration files, and screen
shots) in Solaris format. In certain instances Windows 2000 specific commands,
procedures, or screen shots are shown where required. The following table lists
examples of general operating system conventions to keep in mind when using this
manual with either the Solaris or Windows 2000 operating system.
Solaris
Windows 2000
Environment
$MPSHOME
%MPSHOME%
Paths
$MPSHOME/common/etc
%MPSHOME%\common\etc
Command
<command> &
start /b <command>
Trademark Conventions
The following trademark information is presented here and applies throughout for
third party products discussed within this manual. Trademarking information is not
repeated hereafter.
Solaris is a trademark or registered trademark of Sun Microsystems, Inc. in the United
States and other countries.
Microsoft, Windows, Windows 2000, Internet Explorer, and the Flying Windows logo
are either trademarks or registered trademarks of Microsoft Corporation.
Netscape® and Netscape Navigator® are registered trademarks of Netscape
Communications Corporation in the United States and other countries. Netscape's
logos and Netscape product and service names are also trademarks of Netscape
Communications Corporation, which may be registered in other countries.
# P0602566 Ver: 2.7
Page xiii
PeriView Reference Manual
This page has been intentionally left blank.
Page xiv
# P0602566 Ver: 2.7
Working with
PeriView
This chapter covers:
1. Introduction to PeriView
2. PeriView Work Environment
3. Start PeriView and Login
4. Understanding PeriView
5. Navigating PeriView
6. Tree Objects and their States
7. Browser based PeriView and
the Java Cache
PeriView Reference Manual
Introduction to PeriView
PeriView is the suite of graphical tools that you use for administration, operation, and
control of the Avaya Media Processing Server ( Avaya MPS) Series.
PeriView can be used to manipulate and view network activity and to develop and
maintain applications in a GUI (Graphical User Interface) environment. The palate of
tools display on the tool bar when you log onto PeriView.
PeriView provides for distributive control over network activity. It lets you define
virtual environments and operate within them.
The PeriView plugins are as follows:
Page 2
•
Application Configuration
The Application Configuration tool is used to create the file that defines an
application’s execution parameters and run-time environment.
•
Application Management
The Application Management tool is used to manage applications in the
network.
# P0602566 Ver: 2.7
Working with PeriView
•
User Manager
The User Manager tool allows the PeriView administrator (or a PeriView user
with administrative privileges) to add/delete accounts, and change user/group
privileges and properties.
•
MPS Control Center
The MPS Control Center tool is used to display the PeriView configuration
utilities.
Each tool is launched individually. To work with multiple tools, the tools can be
launched sequentially. Each tool offers a wide range of customization.
Once you launch a tool, you can minimize it and restore it to view when you need it.
This flexibility permits simultaneous interaction with multiple PeriView operations
and allows for network awareness and control in the operating environment. For
example, you can view alarms in the Alarm Viewer and monitor applications in the
Activity Monitor while you are assigning, starting, or terminating applications.
# P0602566 Ver: 2.7
Page 3
PeriView Reference Manual
PeriView Work Environment
The MPS systems consists of the hardware and software required to support
interactive call processing functions for both voice and Web (Internet) interaction.
Configurations and Naming Conventions
The following description illustrates the MPS system concepts and naming
conventions used in the PeriView Reference Manual and Quick Start Guide.
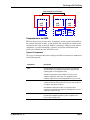
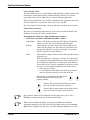
Single Processing Server
A single node is the building block in the Processing
Server configuration. It is configured with one MPS
component which consists of:
•
TMS (Telephony Media Server) hardware.
•
ASE (Application Services Environment) and the
VOS (Voice Operating Software) software
processes executing on a node.
Processing Server
Node
MPS
ASE
VOS
TMS
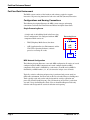
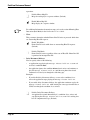
MPS Network Configuration
The following diagram illustrates a two node MPS configuration. It consists of a node
configured with one MPS component and a node configured with two MPS
components. Each node is identified by a node name (A and B) and each MPS is
identified by an MPS number (1, 2, & 3) that must be unique across all nodes.
Typically, statistics collection and processing is performed only on one node in a
multi-node environment. PeriView tools reside on each node. However, PeriReporter
Tools typically reside only on the node designated for statistics collection and
processing (Node B in this diagram). You can launch any of PeriView’s tools from
any node, except for PeriReporter Tools. You can launch PeriReporter Tools only
from the node designated for statistical collection and reporting.
Page 4
# P0602566 Ver: 2.7
Working with PeriView
Processing Server Network
Node A
Node B
MPS 1
MPS 2
MPS 3
ASE
VOS
ASE
VOS
ASE
VOS
TMS
TMS
TMS
Components in the MPS
MPS can consist of one or more nodes. Components provide specific functionality to
the network and reside on nodes. A node provides the central point of control for the
components that reside on the node. While it is possible to configure a node without
components (a specific functionality), all nodes are PeriView workstations from
which you can launch the suite of PeriView tools.
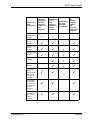
Types of Components
The types of components that can be configured in MPS environment are summarized
on the following table.
Component
Description
MPS
An MPS (Media Processing Series) component provides full
interactive call processing functionality with a programmable
switching fabric in an integrated system.
The MPS component provides telephone services and is
capable of application processing. It is equipped with the
telephony required to interact with applications to process calls.
OSCAR
An OSCAR (Open Signal Computing and Analysis Resource)
component provides external resource services such as speech
recognition and speech synthesis.
The OSCAR component functions in conjunction with a
component that provides the telephony and application services
required for call processing.
CCSS
# P0602566 Ver: 2.7
A CCSS (Common Channeling Signal Server) component that
provides SS7 (Signalling System 7) and C7 support to the
Process Server product line.
Page 5
PeriView Reference Manual
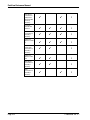
Component
Description
VAPI
A VAPI (Voice Application Programming Interface) component is
associated with the CTI product line. VAPI components makeup the connection between VRU (Voice Response Unit)
applications and the CTI Server.
The CTI Server can be the CallSPONSOR Server (CSS) or the
vendor's server. VAPI component’s include: GTS VAPI -Genesys Tserver. The VAPI and GTS TLS interface provides a
set of request messages that can be used by applications to
access the Genesys Tserver’s services.
TMSCOMM
Page 6
The TMSCOMM component provides network control and
telephony bridging functions across components and nodes in a
Processing Server environment.
# P0602566 Ver: 2.7
Working with PeriView
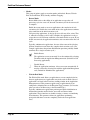
Start PeriView and Login
Client Based
Startup
Start client-based PeriView by selecting Start > Programs >Avaya > PeriView.
Browser Based
Startup
Start browser-based PeriView in the following manner:
Use the URL http://<your web server node name here>/periview/PeriView.html
Updates/changes to PeriView may not always appear when using the browser-based
PeriView. See Browser-based PeriView and the Java Cache on page 23.
# P0602566 Ver: 2.7
Page 7
PeriView Reference Manual
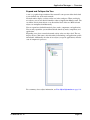
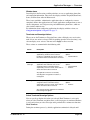
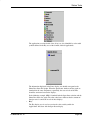
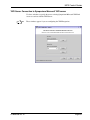
Using PeriView for the first time
When using PeriView in browser mode for the first time from a system, a Security
Warning dialog immediately appears when the browser is pointed to the PeriView's
URL.
If the system does not have the required Java plug-in, then the plug-in will be loaded
first before the dialog is displayed.
Choosing to accept PeriView to run as a trusted applet, using options ‘Yes’ or
‘Always’, ensures that the applet has access to system resources in a secure
environment.
If you choose ‘Yes’, PeriView runs as a signed applet for the current browser session
only. If you want PeriView to always run as a trusted applet, choose ‘Always’ in the
security dialog.
Avaya recommends you to choose the ‘Always’ option.
Choosing the ‘Always’ option prevents the security warning dialog from appearing
the next time you use PeriView from the same system.
If you decide not to accept the security dialog, PeriView would then run as an
unsigned Java applet. Running PeriView in an unsigned mode will result in security
restrictions and exceptions.
Avaya recommends you not to choose the ‘No’ option.
Page 8
# P0602566 Ver: 2.7
Working with PeriView
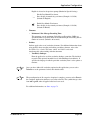
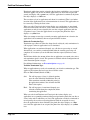
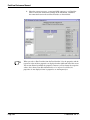
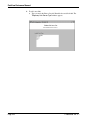
Clicking on ‘More Details’ will open up a modal screen. This screen will display
information about the certificate associated with the signed applet. Clicking ‘Close’
will return you to the security dialog
.
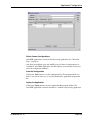
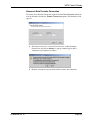
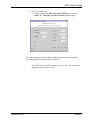
You can check if PeriView's certificate has always been accepted for the system,
(using the ‘Always’ option), by going to the Java Plugin Control Panel. Selecting the
Certificates tab will display a list of certificates associated with signed applets that can
run on your system.
You can see only the certificates that are persistent on your system. You can view the
certificate for PeriView on your system only if you choose the ‘Always’ option.
You can remove a certificate by selecting the Remove button. Once a certificate has
been removed, you will encounter the Security Dialog the next time you point your
browser to PeriView's URL.
Avaya strongly recommends you not to remove certificates.
# P0602566 Ver: 2.7
Page 9
PeriView Reference Manual
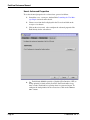
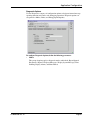
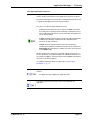
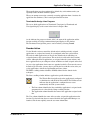
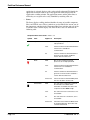
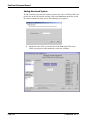
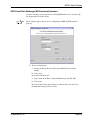
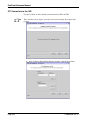
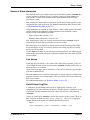
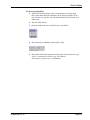
Login
At the login screen, perform the following steps
Page 10
•
Type the UserID and Password.
•
Choose the Host and Port number.
•
Click OK.
# P0602566 Ver: 2.7
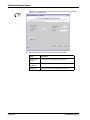
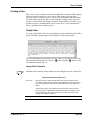
Working with PeriView
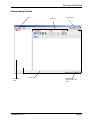
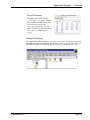
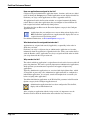
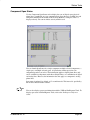
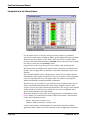
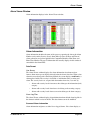
Understanding PeriView
Menus
Navigation
Pane
# P0602566 Ver: 2.7
desktop
Toolbars
Current User
PeriView Data
Provider connection
status
Page 11
PeriView Reference Manual
Navigating PeriView
Toolbars
The PeriView toolbars offer shortcuts to frequently used tools in PeriView. Click on a
button to open the window.
Menus
Click on a menu to access menu options. Certain menu options are disabled incase,
certain conditions are not satisfied. For example, the Close option in the File menu
is only available if a window is open on the desktop. If a window is not open, then the
Close option is greyed out.
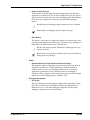
Right-click Menus
Some windows use right-click menus. Right-click menus offer shortcuts to options
within a window. The Navigation Pane also uses right-click menus. Use the rightclick menus in the Navigation Pane to expand attributes or properties of a domain,
line, node, application, component, span, or procedure.
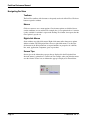
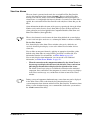
Screen Tips
Screen tips are the informative pop-ups that are displayed in the Navigation Pane
when the mouse is pointed on a certain icon. For example, when you point the mouse
over the Alarms Viewer icon, an informative pop up is displayed as shown below.
Page 12
# P0602566 Ver: 2.7
Working with PeriView
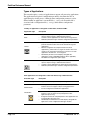
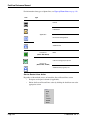
PeriView Toolbars
PeriView has three toolbars: Management, Status, and Alarms.
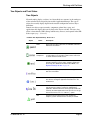
Management Toolbar
Button
Button label
Tool Description
MPS Control Center
Use the MPS Control Center tool to configure
certain aspects of the MPS, including MMF files,
the vos.cfg file, the vpshosts file and create
Clusters.
PeriView Log Viewer
Use the PeriView Log Viewer tool to view the
PeriView logs when needed. This plug-in is only
applicable for client-based PeriView (namely, not
available for browser PeriView).Information is
displayed for each fault occurrence and includes
the date, time, application name, component, and
line number associated with the incident.
Application Configuration
Use the Application Configuration tool to
configure an application’s runtime environment
parameters.
Application Management
Use the Application Management tool to
manage application and phone line resources.
User Manager
Use the User Manager tool to define User and
Group logon names and descriptions.
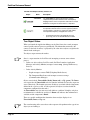
Status Toolbar
Button
# P0602566 Ver: 2.7
Button name
Tool Description
Host Status
Use the Host Status tool to display the status of
an external host. You can select to display host
status based on either the VT number or the
phone line number, with which the VT is
associated.
Line Status
Use the Line Status tool to display phone line
activity for components, phone lines, and
applications.
Page 13
PeriView Reference Manual
Button
Button name
Tool Description
Linked Apps Status
Use the Linked Application tool to monitor phone
line status of a currently executing main
application and its linking activity, if any. Linking
activity represents the activity between the main
application and the linked applications, to which it
links, during its execution cycle.
Span Status
Use the Span Status tool to display the state of
digital spans (physical phone lines), graphically, on
a per component basis.
Alarms Toolbar
Button
Page 14
Button name
Tool Description
Alarm Filter
Use the Alarm Filter tool to define alarm filtering
properties. Filtering allows you to control the
alarms that display and are logged.
Alarm Viewer
Use the Alarm Viewer tool to view live and logged
alarms.
# P0602566 Ver: 2.7
Working with PeriView
PeriView Menus
PeriView has a dynamic menu system. This means that as some new windows become
active, a new menu corresponding to that window will appear.
The windows which will cause new menus to appear are the USER MANAGER and the
ALARM VIEWER windows.
For example: The default menus are File, Window, and Help.
If the ALARM VIEWER window is open and active, the following menu will appear.
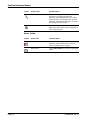
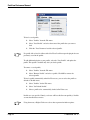
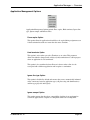
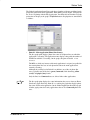
The File Menu
Use the File menu to work with Profiles, Reload the toolkit, Close the current
window, or Exit PeriView.
Profiles
PeriView allows users to save opened plugins as profiles. A user's profile contains the
plugins and their related information that you often use. These profiles, when saved,
can be loaded whenever required and saves time.
It is recommended to save the commonly used plugins into a profile.
To save the plugins open in PeriView's canvas as a profile,
1. Select "Profiles" from File menu
2. Select "Save Profile As" to save the plugins that you open in PeriView's
canvas. Give a name to the profile.
# P0602566 Ver: 2.7
Page 15
PeriView Reference Manual
To load a saved profile,
1. Select "Profiles" from the File menu
2. Select "Load Profile" and select the name of the profile that you want to
load.
3. Click the "Load" button to load the selected profile.
If a profile fails to load, it will not affect PeriView. It will not open the plugins that are
previously saved in the profile.
To add additional plugins to your profile, select the "Save Profile" and update the
profile. This option is enabled only after you load a profile.
To remove a saved profile,
1. Select "Profiles" from the File menu
2. Select "Remove Profile" and select a profile. Click OK to remove the
selected profile.
To load a profile automatically when PeriView starts, you can select the profile as
default via Profile menu.
1. Select "Profiles" for the File menu.
2. Select "Set Default Profile".
3. Select a profile to be automatically loaded at PeriView start.
Profiles are user-specific. Namely, each user will have his/her own profile(s). Profiles
are not sharable between users.
Using the mouse, <Right-Click> on a tab to show up menu for further options.
Page 16
# P0602566 Ver: 2.7
Working with PeriView
Reload Toolkit
This menu item is used to refresh the toolkit icons. If a new plug-in has been added to
PeriView, clicking on Reload Toolkit will make the new item appear in the toolkit, as
opposed to exiting PeriView and logging back in.
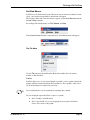
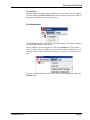
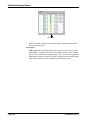
The Window Menu
Use the Window menu to specify how to view open windows, close all open windows
and which open window to view on top.
When a window is open it will appear in a list in the Window menu. The window
which is currently active will appear at the top of the list with a checkmark next to it.
All other windows will be listed in the order they are layered on the desktop, front to
back.
To choose another window to become active, click on the corresponding name in the
Window menu.
# P0602566 Ver: 2.7
Page 17
PeriView Reference Manual
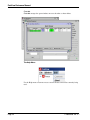
Cascade
Cascade arranges the open windows one over the other as shown below.
The Help Menu
Use the Help menu to learn the release version and date of PeriView currently being
used.
Page 18
# P0602566 Ver: 2.7
Working with PeriView
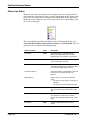
The Navigation Pane
The Navigation Pane offers a visual representation of lines, clusters, spans, domains,
nodes, components, and applications.
Lines
Line objects represent the phone lines that are associated with the application. A
component can have multiple lines assigned to it. The line objects display as blue,
green or yellow when you expand them in the workspace.
A blue line indicates that the line is assigned, a green line indicated that the phone line
is assigned and running whereas a yellow line indicates that the line is vacant without
any applications running.
Clusters
A cluster is a collection of nodes. These nodes, contain various MPS components. The
clusters basically make the classification and identification of nodes easier.
Spans
Span indicates a single digital connection. For domestic (T1) systems, each span can
support 24 phone lines. For European (E1) systems, each span can support 30 phone
lines.
Domains
A domain is a collection of components and nodes that represent either the entire MPS
network or a portion of the network and display in as hierarchical tree structure in the
workspace. Tree objects display as green, red, or black when you expand them in the
workspace.
The domain object represents all components in the MPS network. When you
manipulate a domain object, you control network activity from the domain perspective
and focus control of PeriView tools at the domain level. The default domain is named
“Avaya”.
Nodes
Each node object represents a unique UNIX machine defined for the MPS network. A
node can be configured with a single component or as a PeriView workstation.
You can expand a domain or group object by node to display network activity from
the node perspective and focus control of PeriView tools at the node level.
Components
Each component object represents an individual component that is defined in the
vpshosts file.
You can expand a domain or node object by component to display network activity
from the perspective of its components and focus control of PeriView tools at the
component level.
# P0602566 Ver: 2.7
Page 19
PeriView Reference Manual
Applications
Each application object represents a unique application, which indicates the number of
instances of the application that are assigned to phone lines. Application expansion
displays network activity from the application perspective and focuses control of
APPMAN tools at the application level. Once you assign applications, you can expand
tree objects by application, then view and manipulate.
You can expand an application to display all lines to which it is assigned for
processing. When you expand a component from an application, control is distributed
only over the phone lines associated with the application being processed by that
component.
Application objects display the application name and the number of phone lines to
which the application has been assigned. Applications are displayed as stateless in
purple. The line objects that are assigned and running display as green objects. The
line objects that are assigned but are not running display as blue objects.
Page 20
# P0602566 Ver: 2.7
Working with PeriView
Tree Objects and Their States
Tree Objects
Network entities display as objects, in a hierarchical tree structure, in the workspace
of the main PeriView navigation pane and the Application Manager. The type of
objects that actually display depend on the network configuration and tree object
definitions.
Domain tree objects represent nodes, components, phone lines, spans, and
applications that display their state by their color, in near real-time. The state of an
object is determined by SRP (Startup and Recovery Process) and reported in the SRP
Status report (srp -status).
PeriView Tree Object Summary Sheet 1 of 2
Object
# P0602566 Ver: 2.7
Name
Description
Node
Each node tree object represents an individual node that is
defined for the network.
Common
Component
The Common Component tree object runs on every node. It
is responsible for any operation common to the node such
as alarm collection and file access.
MPS
An MPS tree object represents a network component that
provides telephone services and is capable of application
processing. For additional information about MPSs, see
Expand and Collapse the Tree on page 115.
Application
An application object represents an individual application
that runs on the MPS.
Phone Line
A Phone Line object represents a physical (or logical) phone
line which is running the application listed above it in the
PeriView tree.
Admin Line
An Administrative Line object represents a physical (or
logical) phone line which is running an administrative
application. Administrative lines do not typically handle calls.
Currently, the admin applications work up to line 512. To get
more than 512 lines, run vmst with the -p option.
VPS
A VPS tree object represents the older Periphonics
telephony system. A VPS functions similarly to an MPS.
Page 21
PeriView Reference Manual
PeriView Tree Object Summary Sheet 2 of 2
Object
Name
Description
TMSCOMM
The TMSCOMM tree object represents the network
component that provides network control and telephony
bridging functions across components and nodes in a Avaya
Media Processing Server Series Release 1.0 product.
OSCAR
An OSCAR tree object represents a network component
that provides external resource services (speech synthesis
and recognition). It functions in conjunction with a MPS,
which provides telephony and application services.
•
For detailed information about OSCAR resource
processing, refer to the OSCAR Reference Guide.
Tree Object States
When you launch the Application Manager or the Line Status, these tools attempt to
contact specific software processes periodically. The information returned by the
contact, or the lack of contact, is projected by the color of tree objects assigned to the
domain in the workspace.
Tree objects represent network entities.
State is a representation of a PeriView tool attempting to contact some software
process.
•
In the case of tree objects, PeriView tools (PeriView Launcher, Application
Manager and Activity Monitor) attempt to contact srp (Startup and Recovery
Process).
•
In the Activity Monitor:
•
Graphs attempt to contact TMS (Telephony Media Server).
•
The Component Host Status tool attempts to contact commgr
(Communications Manager).
Object states include: Unreachable (black), Down (red), or Up (green). The Down
state supersedes the Unreachable state for domains and nodes because they represent
states collectively. (The domain represents all objects associated with the components
defined in the vpshosts file. A node represents all objects associated with the
components configured for that node.)
An Unreachable state does not necessarily indicate a problem. It implies, only, that
no information is available for an object. A Down state indicates that information is
available and the component is Down.
There are specific conditions that determine when an object displays in an
Unreachable, Down, or Up state.
The actual meaning of the states these colors represent is dependent on the type of tree
object you are looking at.
Page 22
# P0602566 Ver: 2.7
Working with PeriView
Browser-based PeriView and the Java Cache
When PeriView is accessed by a web browser, the Java files (.class and .jar) are
typically copied to a local Java file cache. Putting these files in a local cache speeds
loading the next time the web page (PeriView) is accessed.
This caching may prevent PeriView updates/changes from appearing the next time
you start PeriView from the browser. For example, you apply a PeriView patch which
adds a new menu option. The next time you use PeriView in the browser, you may not
see the new menu option. The browser is using the cached (older) version. Similar
behavior may occur if you access one version of PeriView on a system, then use the
browser to access a different version of PeriView on a different system.
The Java files are cached by a Java plug-in. The cache much be cleared using the Java
plugin Control Panel. The cached files cannot be removed by clearing the browser
cache. To clear the Java cache:
On Windows 2000 systems:
1. Start > Settings > Control Panel
2. Select the Java Plug-In
# P0602566 Ver: 2.7
Page 23
PeriView Reference Manual
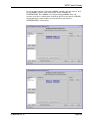
3. Click on the Cache Tab.
4. Click on the Clear button.
On Solaris systems:
1. Change directory to <Java Runtime Environment Install Dir>/bin (typically /usr/java/bin).
2. Start the Plugin Control Panel
mps100 {3} ControlPanel
3. Click on the Cache Tab
4. Click on the Clear button
PeriView 2.1 supports the Java Runtime Environment version 1.4.1 (and higher).
Consult your browser/platform documentation for Java cache clearing procedures if
different from the above.
Page 24
# P0602566 Ver: 2.7
User Manager
This chapter covers:
1. Launching the User Manager
Plugin
2. Introduction to User Manager
3. User Manager—User tab
4. User Manager—Group tab
PeriView Reference Manual
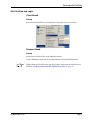
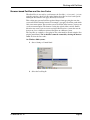
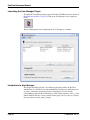
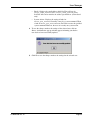
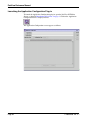
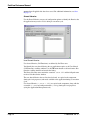
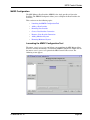
Launching the User Manager Plugin
To launch the User Manager plugin, open the PeriView GUI Main Screen as shown in
Introduction to PeriView on page 2. Click on the User Manager icon as displayed
below.
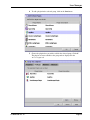
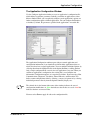
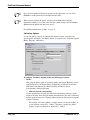
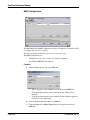
The User Management screen displaying the User Tab appears as follows:
Introduction to User Manager
This chapter describes PeriView’s User Manager plugin that allows the PeriView
administrator (or a PeriView user with administrative privileges) to add/remove users
or groups, and change user/group privileges and properties. If a user and the
corresponding groups that the user belongs to, share similar properties, (for e.g., if the
domain name for the user is Avaya and that for the group is Avaya), the user’s settings
takes precedence over the group’s settings.
Page 26
# P0602566 Ver: 2.7
User Manager
User Manager—User Tab
The User tab allows the PeriView administrator to:
•
Add a new User
•
Remove a User
•
Setting User Properties
•
Setting User Privileges
•
Membership Management
•
User’s Advanced Properties
•
Setting Password
•
Configuring Global Properties
Add a new User
PeriView provides a Graphical User Interface (GUI) to add/remove new users/groups,
set/edit properties/privileges for the PeriView user.
# P0602566 Ver: 2.7
Page 27
PeriView Reference Manual
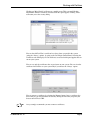
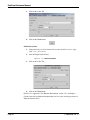
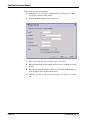
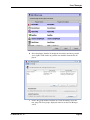
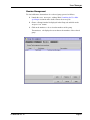
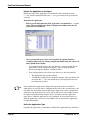
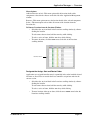
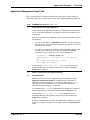
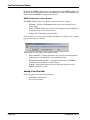
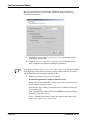
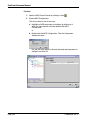
To add a new user, proceed as follows:
1. Launch the User Manager window. Refer Launching the User Manager Plugin section for more details.
2. Click on the ADD button, to create a new user.
3. Enter a user id for the new user in the User ID text box.
4. Enter the Full Name and Description for the new user profile that is being
created.
5. Enter the password (mandatory) for the user, and click on NEXT button to
grant the plugin access rights to the new user.
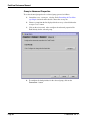
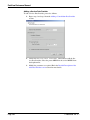
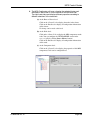
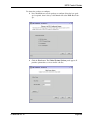
6. Select the type of user. The user can be of type, User Supervisor and Normal.
Page 28
# P0602566 Ver: 2.7
User Manager
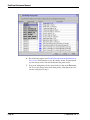
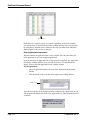
7. Select the plugins (from the list displayed) to which you wish to grant the
access rights. Click on NEXT to grant the user a group membership.
8. Grant the membership of the group to the user from the displayed list of
groups.
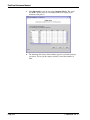
9. Click on FINISH to create the user. The user profile is displayed in the list
displayed in the User Manager window.
# P0602566 Ver: 2.7
Page 29
PeriView Reference Manual
Page 30
# P0602566 Ver: 2.7
User Manager
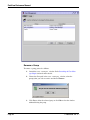
Remove a User
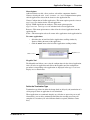
To remove a user, proceed as follows:
1. Launch the User Manager window. Refer Launching the User Manager Plugin section for more details.
2. In the User Manager window, select the user(s) that you wish to
remove and choose REMOVE.
3. Click YES to delete the selected user profile or click NO to close the window without deleting the user profile.
When a user is removed from the list, all the properties and privileges associated with
the user are also removed. The user is also removed from any groups it has
membership of. The user “Administrator” cannot be removed from the list of users.
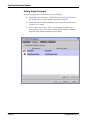
# P0602566 Ver: 2.7
Page 31
PeriView Reference Manual
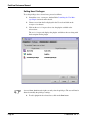
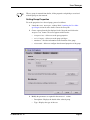
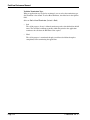
Setting User Properties
To set the properties for a selected user, proceed as follows:
1. Launch the User Manager window. Refer Launching the User Manager Plugin section for more details.
2. Choose a user from the list displayed in the User tab and click on the
Properties button. The screen appears with four tabs:
•
Properties—Allows to set the user properties
•
Privileges—Allows to set the user privileges
•
Membership—Provides information on the membership of the user to
different groups
•
Advanced—Provides information on advanced properties of the user.
By default, the Properties tab is displayed.
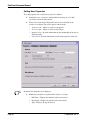
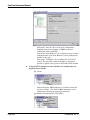
3. Modify the parameters as required in the General section.
Page 32
•
Full Name—Displays the full name of the selected user.
•
Description—Displays the details for the selected user.
•
Type—Displays the type of the user.
# P0602566 Ver: 2.7
User Manager
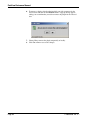
4. To customize the PeriView display settings for the selected user, click on
the VIEW SETTINGS button.
5. Modify the parameters as required. Click OK to save the changes in the
View Settings. This saves the changes locally. To permanently save the
changes made, click the OK button in the parent screen.
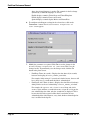
•
Domain Name—Displays the startup domain located in the navigation
pane of the PeriView window. Checking the VIEW TOOLTIPS check box
ensures that the tooltips are displayed on the PeriView main topology
nodes.
•
Tab Location—Displays the location of the tab on the PeriView desktop.
•
Startup Location—Displays the location PeriView will open on the
monitor screen. (Client-based only)
Choosing GET CURRENT will set the location to where the PeriView
window currently sits. The default location is X 0, Y 0.
•
Startup Dimension—Displays the size of the PeriView window upon
startup. (Client-based only)
Choosing GET CURRENT will set the size to whatever the PeriView
window currently is. The default size is 1024 x 768.
# P0602566 Ver: 2.7
•
Language—Choose the language which PeriView will use to display.
Choose from English, French and Spanish.
•
Country—Choose the country from the list. This determines the country
Page 33
PeriView Reference Manual
where the selected language is spoken. The countries in the list change
dynamically as different languages are chosen.
English displays countries United States and United Kingdom.
French displays countries France and Canada.
Spanish displays countries Spain, Mexico and Puerto Rico.
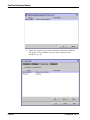
6. To configure miscellaneous settings for the selected user, click on the
CONFIGURE... button. The Miscellaneous Properties of
User screen appears.
7. Modify the parameters as required. Click OK to save the changes in the
Miscellaneous Properties of User screen. This saves the
changes locally. To permanently save the changes made, click the OK
button in the parent screen.
•
Fault Beep Timer (in second)—Displays the time interval (in seconds)
between two beeping of FAULT_IMMED_ACK faults.
For example, if this setting is 5 seconds and a fault of occurs, the user will
hear a beep every 5 seconds until the fault is acknowledged.
•
Fault Ignore Ack. Timer (in hour)—Displays the time interval (in hours)
during which a user has to acknowledge a FAULT_IMMED_ACK fault.
For example, the Ignore Ack Timer is set to 1 hour and a fault
occurs at 1pm, and then a second fault occurs at 2 pm. If at 2:30 pm, the
user acknowledges the faults, only the second fault is displayed. This is
because the first fault occurred earlier than 1 hour before the user
acknowledged the fault. However, every fault, whether acknowledged or
not, is recorded in the log file.
Page 34
# P0602566 Ver: 2.7
User Manager
•
Email—Displays the email address which PeriView will use for
FAULT_USER_ACTION. Once a FAULT_USER_ACTION occurs,
PeriView will send an email to the address specified here. (Client-based
only)
•
System Action—Displays the setting of faults for
FAULT_SYS_ACTION. Generally, it may be a system command. When
a fault of FAULT_SYS_ACTION occurs, PeriView executes the specified
system command. However, the user can set only one system action.
8. To save the changes made to the settings of the selected user, click on
APPLY. An informative pop-up window appears informing you that the
user data has been successfully updated.
9. Click OK to save the changes made to the settings for the selected user.
# P0602566 Ver: 2.7
Page 35
PeriView Reference Manual
Setting User Privileges
To set the privileges for a selected user, proceed as follows:
1. Launch the User Manager window. Refer Launching the User Manager Plugin section for more details.
2. Choose a user from the list displayed in the User tab and click on the
Properties button.
3. Click on the Privileges tab to view the plugins available to the
selected user.
The Privileges tab displays the plugins available to the user along with
the description for the plugin.
A user without administrative rights can only view the privileges. The user will not be
allowed to modify the privileges settings.
4. To add a plugin for the selected user, click on the ADD button.
Page 36
# P0602566 Ver: 2.7
User Manager
5. Choose the plugins that you wish to add for the selected user. Click OK.
The plugins are now available to the user and are displayed in the
Privileges tab.
# P0602566 Ver: 2.7
Page 37
PeriView Reference Manual
6. To remove a plugin, select the plugin which you wish to remove for the
selected user and click on the REMOVE button. A pop-up dialog appears
asking you to confirm that you wish to remove the plugin for the selected
user.
7. Choose YES to remove the plugin temporarily or locally.
8. Click OK or APPLY to save the changes.
Page 38
# P0602566 Ver: 2.7
User Manager
Membership Management
To view/set the membership for a selected user, proceed as follows:
1. Launch the User Manager window. Refer Launching the User Manager Plugin section for more details.
2. Choose a user from the list displayed in the User tab and click on the
Properties button.
3. Click on the Membership tab to view the groups available to the
selected user.
The Membership tab displays the groups that the user is associated with.
A user without administrative rights can only view the membership details. The user
will not be allowed to modify the membership settings as the ADD and REMOVE
buttons will be disabled.
4. To add the user as a member of an additional group, click on the ADD button. The Membership Management window appears.
# P0602566 Ver: 2.7
Page 39
PeriView Reference Manual
5. Choose the groups that you wish to add for the selected user. Click OK.
The groups are now available to the user and are displayed in the
Membership tab.
Page 40
# P0602566 Ver: 2.7
User Manager
6. To remove the membership of a group for the selected user, click on the
REMOVE button. A pop-up dialog appears asking you to confirm that you
wish to remove the group for the selected user.
7. Choose YES to remove the user’s membership from the group locally.
8. Click OK or APPLY button in the parent window to save the changes.
9. To get the details of user’s group, click on the DETAILS button. For more
information, refer Setting Group Properties section.
# P0602566 Ver: 2.7
Page 41
PeriView Reference Manual
User’s Advanced Properties
To set the advanced properties for a selected user, proceed as follows:
1. Launch the User Manager window. Refer Launching the User Manager Plugin section for more details.
2. Choose a user from the list displayed in the User tab and click on the
Properties button.
3. Click on the Advanced tab to configure the advanced properties like
Fault Priority for the selected user.
4. The Fault Priority Modifier provides a Graphical User Interface (GUI) to
change priorities of faults used by PeriView. PeriView handles exceptions as faults. Each fault has a priority when it is generated occurs. To
configure the fault priorities for the selected user, click on the CONFIGURE... button.
h
Page 42
# P0602566 Ver: 2.7
User Manager
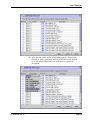
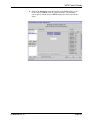
5. Select the fault priority for the corresponding fault id as shown below.
Fault ids are unique, predefined in PeriView and for PeriView internal
use. Faults whose fault priorities are modifiable have appropriate
descriptions.
# P0602566 Ver: 2.7
Page 43
PeriView Reference Manual
Detailed Description of the Fault Priority of User screen
•
FAULT_LOG—To log a fault to a log file if applicable, including the
time of logging and fault info.
•
FAULT_INFORMATION—Puts the fault message to the left footer of
the Main frame.
•
FAULT_ACKNOWLEDGE—Pops up a dialog with fault message. The
user must acknowledge this to proceed.
•
FAULT_IMMED_ACK—An icon will appear on the left footer.
•
FAULT_PLUGIN—No specific action. The Plugin associated to the fault
(if any) should handle it.
•
FAULT_USER_ACTION—Executes a user-predefined action.
Currently, the action is to send an email to a specific receiver. The related
setting is in Account Properties (Email) and Global Configuration (SMTP
Server and Sender's Email).
•
FAULT_SYS_ACTION—Executes a user-defined system command or
script if applicable. User can change this in Account Properties (System
Action).
6. Click on APPLY to save the changes locally. To permanently save the
changes made, click the OK button in the parent screen.
7. To reset the fault priority for the selected fault id, click on the RESET button.
8. To save the changes made in the fault priority, click APPLY in the User
window as displayed in Step 3.
For Client-based PeriView, handling of all seven fault priorities are supported with
appropriate settings (like email, smtp server, and so on).
For Browser-based PeriView, PeriView does not support the highest two
(FAULT_USER_ACTION and FAULT_SYS_ACTION) at this time. Faults of the
two priorities will be handled as lower fault priorities here. All faults are logged to a
log file if applicable. In Browser-based PeriView, the log is in the Java Console when
available.
Page 44
# P0602566 Ver: 2.7
User Manager
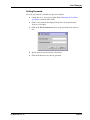
Setting Password
To set the password for a selected user, proceed as follows:
1. Launch the User Manager window. Refer Launching the User Manager Plugin section for more details.
2. Choose a user from the list displayed in the User tab and click on the
Properties button.
3. Click on the SET PASSWORD button to set the password for the selected
user.
4. Specify the new password for the selected user.
5. Click on OK button to save the new password.
# P0602566 Ver: 2.7
Page 45
PeriView Reference Manual
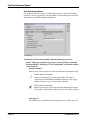
Configuring Global Properties
The Global Configuration tool allows to configure the common properties for all the
users. These properties apply to all the users.
To set the global properties for all the users, proceed as follows:
1. Launch the User Manager window. Refer Launching the User Manager Plugin section for more details.
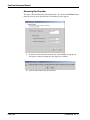
2. Click on the CONFIGURE... button to set the global configurations for all
the users.
3. Configure the parameters displayed in the Global Properties screen.
Detailed Description of the Global Properties screen
Page 46
•
Connection Retry Time Interval—When disconnection occurs between
PeriView and the MPS Manager Data Provider (MMDP), PeriView
attempts to establish the connection again. This setting (in seconds)
determines the time interval between the attempts made for connection.
PeriView continues to attempt to connect until it is successful. The
default setting for this interval is 10 seconds.
•
Remote File Read/Write Timeout—For file operations, PeriView by
default starts a timer after a file-related request is sent. PeriView waits for
a time interval specified in this setting (in seconds). If there is no response
for the request sent, PeriView discards the request and informs the user.
The default setting for this interval is 30 seconds.
•
Profile Load Timeout Interval—PeriView provides support for profiles.
Incase of a connection related problem, a profile may not be loaded as
soon as the user selects it. This time interval specifies the time for
PeriView to attempt to reload a profile. If the specified time expires and
# P0602566 Ver: 2.7
User Manager
the selected profile has still not loaded successfully, PeriView stops
loading the profile and informs the user. The default setting for this
interval is 30 seconds.
•
SMTP Server Name—This is used for PeriView fault handling of
FAULT_
USER_ACTION, which sends email of fault info to the user-specified
email address. This setting must be valid for FAULT_USER_ACTION
fault handling to be in effect.
For Client-based PeriView only.
•
Sender Email—This is used for PeriView fault handling of
FAULT_USER_
ACTION, which sends email of fault info to this user-specified email
address. This setting must be valid for FAULT_USER_ACTION fault
handling to be in effect.
4. Click Ok to save the changes.
# P0602566 Ver: 2.7
Page 47
PeriView Reference Manual
User Manager—Group Tab
The Group tab allows the PeriView administrator to:
•
Adding a new Group
•
Remove a Group
•
Setting Group Properties
•
Setting Group Privileges
•
Member Management
•
Group’s Advanced Properties
Adding a new Group
PeriView provides a GUI to add/remove a new group of users/groups, set/edit
properties/privileges for the group of users.
To add a new group, proceed as follows:
1. Launch the User Manager window. Refer Launching the User Manager
Plugin section for more details.
2. Click on the ADD button, to create a new group.
3. Enter a group id for the new group in the Group ID text box.
4. Enter the Description for the new group that is being created and click on
the NEXT button to grant the plugin access rights to the new group.
5. Select the type of group. The group can be of type, User Supervisor and
Normal.
Page 48
# P0602566 Ver: 2.7
User Manager
6. Select the plugins (from the list displayed) for which you wish to grant the
access rights. Click on NEXT to grant the user members from the list displayed.
7. Choose the group members from the list. Click on FINISH to create the
new group. The new group is displayed in the list on the User Manager
screen.
# P0602566 Ver: 2.7
Page 49
PeriView Reference Manual
Remove a Group
To remove a group, proceed as follows:
1. Launch the User Manager window. Refer Launching the User Manager Plugin section for more details.
2. Choose the Group tab in the User Manager window, select the
group(s) that you wish to remove and choose REMOVE.
3. Click YES to delete the selected group or click NO to close the window
without deleting the group.
Page 50
# P0602566 Ver: 2.7
User Manager
When a group is removed from the list, all the properties and privileges associated
with the group are also removed.
Setting Group Properties
To set the properties for a selected group, proceed as follows:
1. Launch the User Manager window. Refer Launching the User Manager Plugin section for more details. Choose the Group tab.
2. Choose a group from the list displayed in the Group tab and click on the
Properties button. The screen appears with four tabs:
•
Properties—Allows to set the group properties
•
Privileges—Allows to set the group privileges
•
Members—Provides information on the members of the group
•
Advanced—Allows to configure the advanced properties of the group
3. Modify the parameters as required in the General section.
# P0602566 Ver: 2.7
•
Description—Displays the details of the selected group.
•
Type—Displays the type of the user.
Page 51
PeriView Reference Manual
4. To customize the PeriView display settings for the selected user, click on
the VIEW SETTINGS button.
5. Modify the parameters as required. Click OK to save the changes in the
View Settings of Group Users screen. This saves the changes
locally. To permanently save the changes made, click the OK button in the
parent screen.
6. To configure miscellaneous settings for the selected group, click on the
CONFIGURE... button. The Miscellaneous Properties of
User screen appears.
Page 52
# P0602566 Ver: 2.7
User Manager
7. Modify the parameters as required. Click OK to save the changes in the
Miscellaneous Properties of Group screen. This saves the
changes locally. To permanently save the changes made, click the OK button.
8. To save the changes made to the settings of the selected group, click on
APPLY. An informative pop-up window appears informing you that the
group data has been successfully updated.
9. Click OK to save the changes made to the settings for the selected group.
# P0602566 Ver: 2.7
Page 53
PeriView Reference Manual
Setting Group Privileges
To set the privileges for a selected user, proceed as follows:
1. Launch the User Manager window. Refer Launching the User Manager Plugin section for more details. Choose the Group tab.
2. Choose a group from the list displayed in the Group tab and click on the
Properties button.
3. Click on the Privileges tab to view the plugins available to the
selected group. The Privileges tab displays the plugins available to
the group along with the description for the plugin.
Page 54
# P0602566 Ver: 2.7
User Manager
4. To add a plugin for the selected group, click on the ADD button.
5. Choose the plugins that you wish to add for the selected group. Click OK.
The plugins are now available to the group and are displayed in the
Privileges tab.
# P0602566 Ver: 2.7
Page 55
PeriView Reference Manual
6. To remove a plugin, select the plugin which you wish to remove for the
selected group and click on the REMOVE button. A pop-up dialog appears
asking you to confirm that you wish to remove the plugin for the selected
group.
7. Choose YES to remove the plugin temporarily or locally.
8. Click OK or APPLY in the parent screen to save the changes.
Page 56
# P0602566 Ver: 2.7
User Manager
Member Management
To view/add/remove the members for a selected group, proceed as follows:
1. Launch the User Manager window. Refer Launching the User Manager Plugin section for more details. Choose the Group tab.
2. Choose a Group from the list displayed in the Group tab and click on the
Properties button.
3. Click on the Members tab to view the members of the group.
The Members tab displays the users that are the members of the selected
group.
# P0602566 Ver: 2.7
Page 57
PeriView Reference Manual
4. To add a user to the group, click on the ADD button. The Membership
Management window appears.
5. Choose the users that you wish to add to the selected group. Click OK.
The users are now a member of the selected group and are displayed in
the Members tab.
Page 58
# P0602566 Ver: 2.7
User Manager
6. To remove the members of a group, click on the REMOVE button. A
popup dialog appears asking you to confirm that you wish to remove the
selected members of the group.
7. Choose YES to remove the members from the group locally.
8. Click OK or APPLY button in the parent window to save the changes.
9. To get the details of the selected members, click on the DETAILS button.
For more information, refer the Setting User Properties section.
# P0602566 Ver: 2.7
Page 59
PeriView Reference Manual
Group’s Advanced Properties
To set the advanced properties for a selected group, proceed as follows:
1. Launch the User Manager window. Refer Launching the User Manager Plugin section for more details. Choose the Group tab.
2. Choose a group from the list displayed in the Group tab and click on the
Properties button.
3. Click on the Advanced tab to configure the advanced properties like
Fault Priority for the selected group.
4. To configure the fault priorities for the selected group, click on the
CONFIGURE... button.
Page 60
# P0602566 Ver: 2.7
User Manager
5. Select the fault priority for the corresponding fault id as shown below.
Fault ids are unique, predefined in PeriView and for PeriView internal
use. Faults whose fault priorities are modifiable have appropriate descriptions.
# P0602566 Ver: 2.7
Page 61
PeriView Reference Manual
6. For detailed description, refer Detailed Description of the Fault Priority of
User screen. Click on APPLY to save the changes locally. To permanently
save the changes made, click the OK button in the parent screen.
7. To reset the fault priority for the selected fault id, click on the RESET button. To save the changes made in the fault priority, click Apply in the User
window as displayed in Step 3.
Page 62
# P0602566 Ver: 2.7
Application
Configuration
This chapter covers:
1. Launching the Application Configuration Plug-in
2. Introduction to Application Configuration
3. Configure Standard Applications
4. Configure VoiceXML Applications
PeriView Reference Manual
Launching the Application Configuration Plug-in
To launch the Application Configuration plug-in, open the PeriView GUI Main
Screen as shown in Introduction to PeriView on page 2. Click on the Application
Configuration icon as displayed below.
The Application Configuration screen appears as follows:
Page 64
# P0602566 Ver: 2.7
Application Configuration
Introduction to Application Configuration
Use the Configure Applications tool to create the file that defines an application’s
execution parameters and run-time environment. For PeriProducer applications (a
generated .vex file), the configuration file (*.acfg) is copied, along with the
application’s executable file (*.vex), to the node where you assign the application.
Although you can assign an application with a default configuration file, you can use
this tool define individual configuration parameters.
For VoiceXML applications, the .acfg file is explicitly defined on the node (in the
appropriate component directory) on which it runs. See “Configure VoiceXML
Applications” on page 104.
Configurations Options
Configuration options are categorized as follows:
•
Data Processing
•
Host Communications
•
Diagnostic
•
Vocabulary
•
Shared Libraries
•
Execution Parameters
Although you can define configuration options within the application itself, when you
define these parameters in a configuration file, you can easily display and modify
them with this tool.
An application can execute in either IVR mode (voice) or Web mode (Internet),
depending upon the configuration parameters associated with the application.
File Requirements
Only a single configuration file can exist for an application at any one time. When you
redefine an application’s configuration, the existing file gets saved with new
information. For standard applications, the file names of an application’s
configuration file (*.acfg) and executable file (*.vex) differ only with respect to
the file extension.
During the assign process, if a configuration file is not located in the same directory as
the application’s executable file, the application is assigned with a default
configuration.
During the assign process, application files and user shared libraries are copied from
their source location to the designated directories on the node where they will process.
•
Executable file (*.vex) and configuration files (*.acfg) for all applications
(main and linked) will be copied to the directory the following locations:
Solaris: $MPSHOME/componentN/apps
Windows 2000:%MPSHOME%\componentN\apps
•
# P0602566 Ver: 2.7
User shared libraries (*.so or *.dll) will be copied to the following
locations:
Page 65
PeriView Reference Manual
Solaris: $MPSHOME/componentN/apps/lib
Windows 2000:%MPSHOME%\componentN\apps\lib
Configure Standard Applications
You configure standard (PeriProducer/.vex) applications in the Application
Configuration window. A summary of the information required for these processes
follows.
Application
You must identify the name of the application’s executable file (*.vex). For
additional information, see Identify the Application to Configure on page 68.
Application Type
Initially, you configure an application as main or linked.
When you configure a Main application, then you must continue to define the
Configuration Type. And, for PeriProducer applications, you need to specify
Defaults Settings.
When you configure a linked application, no other options apply. For additional
information, see Define the Application Type on page 68.
Configuration Type
A Main application is defined with either a Default or Custom Configuration.
When you configure default application, no other options apply.
When you create a Custom configuration, individual parameters are defined from
within six option categories.
Configuration Options
The six categories of configuration options include: Data Processing, Shared
Libraries, Host Communication, Execution, Diagnostics, and Vocabulary.
Each option is listed individually, in alphabetic order, in the Options Summary
window. For additional information, see Define Custom Configurations on page
70.
Save or Deploy
You must Choose Save to save the configuration file. You can also select
Assign/Start to launch the Application Management tool for the application in the
Configure Application window. For additional information, see Define Custom
Configurations on page 70.
Page 66
# P0602566 Ver: 2.7
Application Configuration
The Application Configuration Window
Use the Configure Application window to create an application’s configuration file,
which defines its run-time parameters. Initially, you define an application as either
Main or Linked. While you can explicitly configure a main application’s options, no
further configuration applies to linked applications. You can configure PeriProducer
to include, by default, the parameters specified in the application’s executable file.
The Application Configuration window opens with pre-entered application and
configuration information, if you launch the tool from either application objects or
objects that have been assigned applications. You can configure individual options by
selecting them from the alphabetized list in the Option Summary scrolling window.
Only a single configuration file can exist for each application at any time. When you
redefine an application’s configuration, the existing file is saved with the new
information. Configuration options are categorized as follows: Data Processing, Host
Communications, Diagnostic, Vocabulary, Shared Libraries, and Execution. You
define custom configurations either by selecting a category of options or by selecting
individual parameters directly from the Options Summary display area.
The colored dot, in the bottom right corner of the window, indicates the state of
configuration modifications. A green dot indicates that all edits are saved. A red dot
indicates that there are unsaved edits.
You must select Save to apply all edits to the configuration file.
# P0602566 Ver: 2.7
Page 67
PeriView Reference Manual
Identify the Application to Configure
Identify the name of the application’s executable file. The executable file name
(*.vex) and the configuration file name (*.acfg) are identical except for the file
extension.
To identify the application:
•
Either type the full path name of the application’s executable file (*.vex) or
select Choose to display the Choose Configuration window and select the
name of the executable file.
•
Once you enter file name, select Load to update the Options Summary
scrolling window with any existing configuration information and activate all
other options in the window.
•
If a configuration file exists in the same directory as the executable file, the
application’s current configuration displays. You can define parameters
directly from Options Summary scrolling window.
•
If no configuration file exists in the same directory as the executable file:
•
The Application Type defaults to Main.
•
A PeriProducer application is configured using the values specified in the
executable file (*.vex) and default values for all options that have not
been explicitly specified.
If you launched the Application Configuration tool from an object to which an
application was assigned, and if a configuration file exists in the same directory as the
executable file, the window opens displaying the application’s current configuration
information and all parameters are active. You do not have to select Load to activate
the Application Configuration window. There is no need to enter the application
name, unless a different application is to be configured. If you enter the name of a
different application, you have to select Load to activate options in the Application
Configuration window.
Define the Application Type
Configure the application as either Main or Linked. The Application Type defaults to
Page 68
# P0602566 Ver: 2.7
Application Configuration
Main when creating a default configuration with the Application Management tool.
To Define the Application Type:
Select Main or Linked. (The system default is Main.)
Main: Configures the file as a main application. A main application performs a
specific call processing or administrative function and can link to other
applications during its execution cycle.
You can define Main applications with either default or custom parameters
and assign them to either call processing or administrative phone lines,
depending upon their function.
To define a custom configuration for a main application, select Custom as the
Configuration Type (page 69) and proceed to define individual configuration
options (page 66). Default application require no further configuration.
If you have completed your edits, you must select Save to save changes to the
file. The symbol changes color from red to green when all changes have been
saved. For additional information, see Save on page 72.
Linked: Configures the file as a linked application. A linked application can be shared
by one or more main applications, which can link to them during their
execution cycle. Linked applications are assigned only to MPS components;
they are not assigned to phone lines.
When you assign linked applications, they display with the link
icon in the Applications scrolling window of the Application
Management tool. This icon also displays in the Component status
window, to identify linked applications (if any) that are assigned to
the MPS.
You can monitor the linking activity of main applications with the Linked
Application Status graph, which you launch from the Activity Monitor. The
main application and the applications to which it links, display as graph
points.
The remaining configuration parameters do not apply to linked applications
therefore, all other options are inactive. At this point, you must select Save to
save edits to the file. The symbol changes color from red to green when all
changes have been saved. For additional information, see Save on page 72.
Define the Configuration Type
Configuration Type is defined as Default or Custom.
Select Custom to activate the Configuration Options tabs. Alternatively, you can
specify custom values individual options at the Option Summary window.
To define the Configuration Type:
Select Default or Custom.
Default:
Default settings are option specific. A default setting represents the value for a
# P0602566 Ver: 2.7
Page 69
PeriView Reference Manual
configuration option, which is used in the absence of explicitly selecting a
different value. For a description of each option and its default setting, see
Configuration Options’ Categories on page 73. (Default)
The consequence of selecting Default is dependent upon the method by which the
application was created (PeriProducer).
•
When you select Default for a PeriProducer application, it is be configured
using the values specified in the executable file (*.vex) and default values
for all options that you have not explicitly specified.
No other parameters apply default configurations and all other options are
inactive. If you have completed your edits, you must select Save to save edits to
the file. The symbol changes color from red to green, when all changes have been
saved. For additional information, see Save on page 72.
Custom:
Select Custom to specify values for individual configuration options. The six
Option Category buttons are activated and you can select a category of options
from the following: Data Processing, Shared Libraries, Host Communication,
Execution, Diagnostics, and Vocabulary.
The application is configured with the default value for each option that you do
not explicitly define.
For each category of options that you have modified, after you define the options
within the category, you must select Apply, Reset, or Defaults from within the
individual Option Category window to apply the edits to the Applications
Configuration window. For additional information, see Define Custom
Configurations on page 70.
After you apply the edits within the individual Option Category windows, and
when your edits are complete, you must select Save to save edits to the file. The
symbol changes color from red to green, when all applied edits have been saved.
For additional information, see Save on page 72.
Define Custom Configurations
Individual configuration options are categorized as: Data Processing, Shared
Libraries, Host Communication, Execution, Diagnostics, and Vocabulary. These
options can either be user defined or reset to their default settings on an individual
basis.
To define a custom configuration and save the configuration file:
In the Application Configuration window, either select a category of options from the
menu tabs or select options individually at the Options Summary scrolling window.
•
Using the Options Category tabs:
Select Data Processing, Shared Libraries, Host Communications,
Execution, Diagnostic, or Vocabulary. The category of options displays with a
tab. Refer to Configuration Options’ Categories on page 73.
Page 70
# P0602566 Ver: 2.7
Application Configuration
•
Using the Options Summary scrolling window:
Select an option in the Options Summary scrolling window.
•
Choose Change Option to display the option category tab for the selected
parameter. Refer to Configuration Options’ Categories on page 73.
•
Choose Defaults to reset all the options in the summary to its default value.
When you define options in the individual Option Category tabs:
•
Define values for the options within the category.
•
Select Apply, Reset, or Defaults at the Option Category window.
For specific information about configuring individual options within a category, see
Configuration Options’ Categories on page 73.
When you have defined all options, you must select Save in the Configure
Application window to save edits to the file. The symbol changes color from red to
green, when all applied edits have been saved. For additional information, see Save
on page 72.
# P0602566 Ver: 2.7
Page 71
PeriView Reference Manual
Save
When you have defined all options, you must select Save to save the configuration to
a file. The configuration file is only created or updated after Save is selected.
•
If you close the window without saving the changes, you abort process
without saving a configuration definition.
Choose Save to save the configuration file. The dot changes color from red to green,
when all edits have been saved.
After you select Save, only the Application name remains active. Other parameters in
the Application Configuration window be inactive until Load is selected for a specific
application.
Deploy
Choose Deploy to launch the Application Management tool for the currently defined
configuration.
•
•
If you selected Save before Deploy, the Application Management tool
launches for the application with the newly saved configuration.
•
If you did not select Save before Deploy, the Application Management tool
launches for the application with the existing configuration file. Any changes
made in the Application Configuration window do not apply to the
application unless you select Save before the launching the tool.
Close the Application Configuration window.
To abort the configuration process, close the Application Configuration window
without selecting Save. If you attempt to close the window and there are unsaved
applied edits, the symbol is red and a notice box displays to confirm the exit.
Page 72
•
Select Yes to exit the window and abort the process without saving the edits.
•
Select No to continue with the configure application process.
# P0602566 Ver: 2.7
Application Configuration
Configuration Options’ Categories
The six categories of configuration options are identified in the following table. Each
category of options displays with an individual tab. After defining the parameters you
must select Apply to apply the changes to the Application Configuration window.
Then, you must select Save in the Application Configuration window to save the
configuration to a file.
For information about saving a configuration file and launching the Application
Management tool, see Save on page 72. For information about individual options
categories, go to the page listed in the following table.
Option Category
Configure
Go To
Data Processing
Data handling methodologies.
page 74
Shared Libraries
User and System (3rd Party) shared libraries.
page 78
Host Communication
External host communications.
page 81
Execution
Run-time execution parameters.
page 84
Diagnostics
Internal message reporting functions and source
code debugging operations.
page 97
Vocabulary
Vocabulary speech management functions.
page 100
At each of the six option category windows, use one of the methods described in the
following table to specify the value for an option.
# P0602566 Ver: 2.7
Page 73
PeriView Reference Manual
Data Processing Options
Use the Data Processing category of configuration options to define data handling
procedures. You can specify data processing Modes, how to handle items retained in
shared memory, and define Application Input text.
To configure Data Processing Options, define the following parameters.
•
Modes: This group of options apply to data processing modes and include:
Formatted Display, Indexing by 0, VPS Compatibility, and Unload Statistics
After Each Run.
•
Formatted Display:
Numeric items can be displayed in either an unformatted or formatted mode.
Disable Numeric Formatting.
Numeric items display in an unformatted mode. This mode is
standard in the internal MPS environment. Numerals, only, display
without reference to sign or decimal place. (Default)
Enable Numeric Formatting.
Numeric items display in the formatted mode defined by the Picture
Clause (PIC) in the application. Both sign and decimal place display.
•
Indexing by 0:
The ASE process responsible for running applications, by default, does not
Page 74
# P0602566 Ver: 2.7
Application Configuration
support explicit array indexing by zero (0).
Disable Indexing by 0.
Disable this parameter for backward PeriProducer compatibility.
(Default)
Enable Indexing by 0.
!
Do not enable Indexing by 0 unless a legacy application does not
execute successfully with this parameter disabled.
•
VPS Compatibility:
This option applies to backwards VPS compatibility for legacy applications
written in pre VAS (Release 3) and Release 4 (VPS mode).
It allows the application program to do both of the following:
•
speak the character string ‘$1,234.45’ as Money (for example, the
non-numeric characters $, . are ignored.)
•
move 1234 to A (where A is an array), without specifying an array index.
Disable backward VPS compatibility. (Default)
!
Enable backward VPS compatibility.
You should not enable VPS Compatibility Mode unless a legacy
application does not execute successfully with this parameter
disabled.
•
Close Databases After Each Call:
HSAM and ISAM database files can either remain open or be closed when an
application restarts (disconnects and recycles). This option allows for
backward compatibility.
Disable database files from closing after each call.
HSAM and ISAM database files remain open when the application
restarts. This option saves significant overhead. (Default)
Enable database file closing after each call.
HSAM and ISAM database files close when the application restarts.
You should only enable this backward compatibility mode when your
application does not execute successfully with the parameter
disabled. This may be a solution for the problem that exists when all
database related calls fail.
You can initialize, erase, or get the status of database files at the VSH tool’s
System menu.
•
# P0602566 Ver: 2.7
Unload Statistics After Each Run:
Page 75
PeriView Reference Manual
The VSUPD process polls MPSs for application statistics in 15 minute
intervals. Further, you can configure applications to pass application statistics
to VSUPD each time a call terminates.
•
If all application statistics are collected only when polled, large amounts
of data are transferred at regular time intervals.
•
If application statistics are transferred to VSUPD each time a call
terminates, message traffic increases, but the amount of data transferred at
regular intervals decreases (as some statistics generated in that time
period have already been transferred).
Message traffic is distributed over a wider time period when you select to
transfer statistics after applications terminate. Specify the option that is more
successful in your operating environment.
Disable Unloading Statistics After Each Run.
Application statistics are be passed to VSUPD each time a call is
terminated. VSUPD polls the MPS for statistics, regularly, at 15
minute intervals. (Default)
Enable Unloading Statistics After Each Run.
Application statistics are passed to VSUPD each time a call is
terminated and VSUPD polls the MPS for statistics, regularly, at 15
minute intervals.
•
Bytes Per Counter for Statistics:
You can define the number of bytes for the statistics counter in the statistics
message format.
The default statistics message format (2 bytes per counter, maximum 1800
fields per stat folder) can reduce VSUPD message traffic significantly, in
comparison to the format used in releases prior to 5.3.0.
You should use the smallest field size that is large enough to hold the counter
range (1-byte field=255, 2-byte field=65535, 4-bytes fields = more than 4
billion). The VSUPD process automatically recognizes any message format.
The stat format has changed as of Release 5.3.0. The option Variable based
on field name length relates to the stat format prior to Release 5.3.0. This
option should not be selected by anyone other than Certified Avaya support
personnel.
•
Shared Memory Retainment:
This parameter allows for the shared memory items associated with main or
linked applications to be preserved after the applications have terminated. Unless
you configure shared memory to be reclaimed by the system, it is necessary to
explicitly remove retained data to reallocate the area of memory to the system.
The shared memory area can be examined with the VSH tool. Select one of the
following options to define shared memory retainment.
Page 76
# P0602566 Ver: 2.7
Application Configuration
•
None:
Shared memory items are not retained for either main or linked applications.
(Default)
•
Linked pgm after return execution:
Shared memory items of all linked programs are retained by the system after
the linked application ends and execution control is returned to the main
application. When the main program terminates, this memory is reclaimed by
the system.
•
Linked pgm after application termination:
Shared memory items of all linked programs are retained by the system after
the main application is terminated. Items specific to the main application are
not retained.
•
Main pgm after application termination:
Shared memory items of the main programs are retained by the system after
the application is terminated.
•
Linked pgm after return execution, main pgm after application termination:
Shared memory items of the linked programs are preserved while the main
program is active. When the main program terminates, shared memory from
linked programs is reclaimed and the shared memory of the main program is
preserved.
•
Linked and main pgm after application termination:
All shared memory items of the main and linked applications are preserved
after the main application terminates.
•
Application Input Parameter Text:
This option allows for data to be passed from the configuration file to the
application, when you start the application. This can include user entered data or
file-based data that is to be used as input by the application. Also, Input Parameter
Text can be made accessible to programs that are linked to the application you are
configuring.
Once you have defined all shared libraries for this application, you can select
Defaults to set the parameters back to their default values.
When you have defined all options, you must select Save in the Application
Configuration window to save edits to the file. The symbol changes color from red to
# P0602566 Ver: 2.7
Page 77
PeriView Reference Manual
green, when all applied edits have been saved. For additional information, see Save
on page 72.
Shared Libraries
Use the Shared Libraries category of configuration options to identify the libraries that
the application may need to access during its execution cycle.
User Shared Libraries
User shared libraries (Call Functions) are defined by PeriView users.
You identify the user shared libraries that an application requires at the User Shared
(Call Functions) scrolling window. Use the Edit menu button to add and remove files
from the scrolling window and reorder the listing.
The library file name must contain the extension .so or .dll and the full path name
needs to be defined in the window.
The user shared libraries that are listed and selected, are copied to the component
(during the Assign process) and made available to the application during its execution
cycle.
User shared libraries (*.so or *.dll) are copied to the component, along with the
executable (*.vex) and configuration files (*.acfg), during the Assign process
(using the Application Management tool).
Page 78
# P0602566 Ver: 2.7
Application Configuration
Executable file (*.vex) and configuration files (*.acfg) for all applications (main
and linked) will be copied to the directory the following locations:
Solaris: $MPSHOME/component_typeN/apps
Windows 2000:%MPSHOME%\component_typeN\apps
User shared libraries (*.so or *.dll) will be copied to the following locations:
Solaris: $MPSHOME/component_typeN/apps/lib
Windows 2000:%MPSHOME%\component_typeN\apps\lib
•
Any selected library, that does not exist in the destination directory, is copied
when the application is assigned.
•
If a selected library already resides in the destination directory, then the
recopying of that library (during the Assign process) depends on your
response to the option Copy User Shared Libraries (in the Application
Management window).
System and 3rd Party Shared Libraries
System and 3rd Party shared libraries are libraries that were not been created by the
user.
•
First, you need to copy any system and 3rd Party shared libraries, which the
application may need during its execution cycle, to the MPS component
before you identify them in the scrolling window.
•
Then, you enter and select the System and 3rd Party shared libraries required
by the application at the System and 3rd Party scrolling window. Use the Edit
menu button to add and remove files from the scrolling window and reorder
the listing.
The library file name must contain the extension .so or .dll and the full path
name needs to be defined in the window.
The libraries that are listed and selected are associated with the application and are
available during its execution.
Linked versus Main Applications
When a linked application requires a shared library, the shared library is configured
for the main application—not the linked application. (Custom configuration options
can be defined only for main applications.)
# P0602566 Ver: 2.7
Page 79
PeriView Reference Manual
Library Search Order
The selected libraries are associated with the application being configured in the order
in which they are listed in the library scrolling windows. Libraries are searched,
sequentially, in the order in which they are associated with the application.
If the order in which libraries are searched is important to the application, ensure that
the selected libraries are listed in the order they are to be searched.
You can reorder the list from either a menu or with the up and down arrows buttons.
Identify Shared Libraries
The process for identifying shared libraries is the same for both User Shared (Call
Functions) and System & 3rd Party shared libraries.
To configure shared libraries, define the following parameters.
•
Select Edit to and choose Add Another, Remove, or Move.
Add Another:
Choose Add Another to display the File Chooser. Use the File
Chooser to locate and select existing shared library files.
Remove:
Choose Remove to remove Selected or All shared library file
names from the display area. This allows for quick removal of
unwanted data. Remove only clears the display area(s) of data.
The files themselves remain unaltered.
Move:
Choose Move to display the move menu and reorder the listing in
the display area.
When an application is assigned to a location, selected libraries
are associated with the application in the order in which they are
listed. During the application’s execution cycle, when libraries
are needed, they are searched sequentially, in the order in which
they were associated with the application. To reorder the list:
• Select one or more lines.
• Use the <RIGHT> mouse button and select Up or Down to
move the selected location(s) up or down on the list.
Alternatively, reorder libraries with the up and
down arrow buttons located under each
scrolling window.
<LEFT> click the mouse button on the up arrow to
move the selected location(s) up on the list.
<LEFT> click the mouse button on the down arrow to
move the selected location(s) down on the list.
Once you have defined all shared libraries for this application, you can select
Defaults to set the parameters back to their default values.
When you have defined all options, you must select Save in the Configure
Application window to save edits to the file. The symbol changes color from red to
green, when all applied edits have been saved. For additional information, see Save
Page 80
# P0602566 Ver: 2.7
Application Configuration
on page 72.
The selected shared libraries that are actually copied from their source directory to the
MPS depend on the parameter Copy User Shared Libraries.
Host Communications Options
Use the Host Communications category of configuration options to define
communication modes between an application and its external host.
To configure Host Communications Options, define the follow parameters.
•
External Host:
Enable or Disable communication between this configuration of the application
and an external host computer.
Enable External Host Communications.
Enable host communications if the application is communicating with an
external host computer. (Default)
Disable External Host Communications.
Disable host communications if the application is not communicating
with an external host computer.
•
Mirror Map I/O:
This parameter enables or disables the display of maps in a separate window
during an applications’s execution. Visually displayed maps aid in debugging
# P0602566 Ver: 2.7
Page 81
PeriView Reference Manual
operations.
Disable Mirror Map I/O.
Maps do not display in a separate window. (Default)
Enable Mirror Map I/O.
Maps display in a separate window.
For additional information about mirror maps, refer to the section Mirroring Host
Interaction (Real Mode) in the PeriProducer User’s Guide.
•
Wait:
This parameter determines whether Phone Line I/O waits or proceeds while there
are outstanding Host I/O requests.
Enable Wait Mode:
Phone Line I/O waits while there are outstanding Host I/O requests.
(Default)
Disable Wait Mode.
Phone Line I/O occurs regardless of the state of Host I/O. Phone Line I/O
is permitted to interrupt Host I/O.
•
Delay Disconnect Delivery:
You can specify either of the following:
•
an application stop playing the message Please hold on as soon as it
received a condition disc.
•
the application ignores the condition disc when it arrives and continues to
play the message Please hold on until the next phone line related
command is received (even though the caller hung up).
Examples:
•
If you disable delay disconnect delivery, as soon as the condition disc
arrives the application stops playing the message Please hold on.
•
If you enable delay disconnect delivery, the application continues to play the
message Please hold on while waiting for a message from the host or
CCM, even though the condition disc arrived.
Disable Delay Disconnect Delivery.
An application responds immediately if a condition disc arrives and
stop playing the message Please hold on, even if it is waiting for a
host or component message. (Default)
Page 82
# P0602566 Ver: 2.7
Application Configuration
Enable Delay Disconnect Delivery.
•
An application ignores the condition disc until the next CCM or host
command is received. The application continues to play the message
Please hold on while waiting for a host or CCM command, even
though the condition disc arrived. You should not enable this backward
compatibility mode unless your application does not execute successfully
with the parameter disabled.
Conversion of Low Values Into Spaces in Map Fields:
This parameter determines whether low value constants (non-printable characters)
are converted to spaces in map fields.
Enable Conversion:
Low values are converted to spaces in map fields. (Default)
Disable Conversion.
Low value constant is inserted in map fields.
•
Conversion of Attributes Into Spaces in Map Fields:
This parameter determines whether the attribute bytes in map fields retain their
definition or are converted to spaces.
Disable Conversion:
Attribute bytes retain their definition in map fields. (Default)
Enable Conversion.
Attribute bytes are converted to spaces in map fields.
Once you have defined all host communications for this application, you can select
Defaults to set the parameters back to their default values.
When you have defined all options, you must select Save in the Configure
Application window to save edits to the file. The symbol changes color from red to
green, when all applied edits have been saved. For additional information, see Save
on page 72.
# P0602566 Ver: 2.7
Page 83
PeriView Reference Manual
Execution Options
Use the Execution category of configuration options to define parameters specific to
the application’s execution cycle. When an application terminates due to exceeding
these parameters, it restarts automatically only if you enable the Restart Mode. If
Restart is disabled, you need start the application with the Application Management
tool.
Execution options are categorized as, Execution Type, Modes, Timeouts, Counters,
Messages, Interpreter, and Environment. Default values are parameter-specific and
vary with your selections.
Page 84
# P0602566 Ver: 2.7
Application Configuration
To configure Execution Options, define the following parameters.
•
Execution Type:
Define the execution type as either Call Processing or Administrative.
•
Call Processing
Call processing applications are designed to interact with callers. They
receive incoming calls, transmit data to the caller, and acquire data from the
caller until the call transaction is complete. You need to assign call processing
applications to physical phone lines, which are equipped to process calls.
(Default)
Physical phone lines display as blue, green or yellow call processing
phone line icons in the Locations sections of the Application
Management tool and blue or green icons in the Application
Management tool.
You must configure any application that handles message retrieval as Call
Processing. Further, you must configure these applications to repeat the call
processing cycle for new calls each time the execution cycle for a call is
complete (see Restart Mode).
•
Administrative
Administrative applications are designed for system maintenance and
administrative data processing tasks that support call processing applications.
These operations can include resetting a counter or reintializing shared
memory. It is important that applications performing prerequisite functions
both start and complete their execution cycle before applications that depend
them (see Wait for Exit) start.
Administrative applications that you configure to Wait for Exit
display the initialization icon in the Application Management tool.
Typically, administrative applications do not need to be assigned to phone
lines that are equipped to process calls (physical lines). You should assign
these applications to an MPS’s logical lines (lines that are not connected to
any physical phone line), leaving the lines that are actually connected to
phone line ports available for call processing applications.
Logical phone lines display as blue, green or yellow administrative
phone line icons in the Locations sections of the Application
Management and blue or green icons in the Application
Management tool.
# P0602566 Ver: 2.7
Page 85
PeriView Reference Manual
•
Modes:
This group of options apply to execution modes and include: Restart, Wait for
Exit, Start on Reboot, Web, Standby, and Error Trapping.
•
Restart Mode:
Restart Mode refers to the ability of an application to repeat the call
processing cycle for a new call, when the execution cycle for the current call
is complete.
Enable the restart mode to restart an application at the conclusion of each
execution cycle. Disable the restart mode to force the application to terminate
after conclusion of the initial execution cycle.
Call processing applications, by design, process calls one call at a time. That
is, when the execution cycle for call is complete, the application is ready to
accept the next call. You must enable the restart mode for this to occur. If you
disable restart mode, the application terminates after execution of the first call
cycle.
Typically, administrative applications, because of the nature of the jobs they
perform, should not restart when they complete their execution cycle. (For
example, applications that perform initialization operations probably should
terminate after a single execution cycle.)
Enable Restart.
The application execute recurrently. It can be terminated by selecting
Terminate with the Application Management tool. (Default for Call
Processing applications)
Disable Restart.
When the application terminates, it does not restart automatically. It
must be restarted by selecting Start with the Application Management
tool. (Default for Administrative applications)
•
Wait for Exit Mode:
The Wait for Exit mode allows an application to execute completely before
the next application starts. Applications start in the order in which selected
applications are listed in the Locations scrolling window in the Application
Management tool. This parameter applies only to applications that you
configured as Administrative at the Execution Type parameter. (It is inactive
when you select Call Processing as the Execution Type.)
Typically, administrative applications perform prerequisite initialization or
maintenance functions needed for the successful execution of other
applications. These functions can include resetting a counter or reintializing
shared memory. This parameter allows for applications performing
prerequisite functions to execute completely, before the next application
starts.
Page 86
# P0602566 Ver: 2.7
Application Configuration
Enable Wait for Exit.
No other application is assigned or started until this application
completes its execution cycle. Select this option for applications that
perform prerequisite initialization functions, to ensure that they
complete the tasks on which other applications depend. (Default)
Applications enabled to Wait for Exit display with an
initialization icon. This icon displays in the Applications and
Locations sections of the Application Management tool; in the
Locations section in the Application Management tool; and in the
Lines section of the Line Start Order During Reboot tool.
You must select Hard Terminate to terminate any application
configured Wait for Exit.
Disable Wait for Exit.
Once this application starts, subsequent applications are assigned and
started without waiting for this application to complete its execution
cycle. Select this option for administrative applications that are
functionally independent of other applications. If other applications
depend on this application, enable this parameter.
# P0602566 Ver: 2.7
Page 87
PeriView Reference Manual
•
Start on Reboot Mode:
Use this parameter to indicate that an application starts during system reboot.
The default order in which applications are assigned/started when the system
reboots is controlled with the Reorder action.
Although all applications listed in the tool’s window is assigned, this
parameter determines which of the applications actually start when the system
reboots.
Enable Start on Reboot.
The application starts automatically, during system reboot, in the
order that applications are listed in the Line Start Order During
Reboot tool.(Default)
Disable Start on Reboot.
The application does not start automatically at system reboot. If you
want to restart the application, you must explicitly restart it by
selecting Start with the Application Management tool.
Applications configured not to restart display with a blue
application initialization icon. This icon displays in the
Applications and Locations sections of the Application
Management tool; in the Locations section in the Application
Management tool; and in the Lines section of the Line Start Order
During Reboot tool.
•
Web Mode:
This parameter applies to applications that execute over the Internet. Select
Web mode to configure an application to execute as a Web application, as
opposed to an application that execute on telephone lines.
You can run a web application by either of two methodologies. The web
application can be configured as a main application or as a linked application,
which executes in conjunction with a Standby application.
Although both of these methods can be used to run a web application,
typically, they are run with the Linked/Standby Application methodology.
The benefit of the Linked/Standby method is that a pool of phone lines can be
dedicated to web application processing.
These lines can then be associated dynamically with web applications on an
as-need basis. The Main Application methodology requires that a specific
web application be associated with a specific phone line, which is a much
more restrictive approach.
•
•
Page 88
Main Application Methodology:
•
Configure the web application as a main application, enable Web
mode, and disable Standby mode.
•
Assign and Start the web application.
Linked/Standby Application Methodology:
# P0602566 Ver: 2.7
Application Configuration
•
•
Copy the file web-standby.vex to ~peri.This file resides in the
following locations:
Solaris: $PWEBHOME/link/web-standby.vex
Windows 2000: %PWEBHOME%\link\web-standby.vex
Configure the web application as a linked application.
•
Configure the Standby Application as a main application, enable Web
mode, and enable Standby mode.
•
Assign and Start the (main) Standby Application at selected locations.
•
Assign the (linked) web application to the node where the Standby
Application was assigned.
If you need different configurations for Standby Applications, copy the
web-standby.vex file to a different file name and configure it
appropriately.
Disable Web Mode.
The application is configured as a voice application (IVR) and
executes on telephone lines. Standby mode and Maximum Call
Length timeout are be inactive. (Default)
Enable Web Mode.
The application is configured as a Web application and executes over
the Internet. The parameters Standby and Maximum Call Length are
activated only when Web Mode is enabled.
# P0602566 Ver: 2.7
Page 89
PeriView Reference Manual
•
Standby Mode:
This parameter applies to applications that execute over the Internet and is
active only when Web Mode is enabled. (It is inactive when Web Mode is
disabled.)
It allows the VENGINE process to be started without an associated
application. This allows applications to be dynamically assigned to the
VENGINE process on an as-need basis.
Disable Standby Mode.
Use this option when you are configuring a web application as a main
application, to which a VENGINE process is specifically associated.
When you start the application (with the Application Management
tool) a VENGINE process starts for this application. (Default)
Enable Standby Mode.
Use this option when configuring a Standby Application to be used in
conjunction with a web application that has been configured as
linked. When you start the Standby application (with the Application
Management tool) a VENGINE process starts without associating it
with a specific application.
Use Standby mode when a phone line is configured for an Internet application
but, the specific application that is to run on the line, eventually, is selected
from a menu. This procedure encompasses the following actions.
Page 90
•
The Standby application is configured as a Main application with Standby
enabled. Then, it is assigned and started at one or more locations.
•
To enable a web application to run at Standby locations, assign a specific
web application, which has been configured as a Linked application, to
the component where the Standby application has been assigned and
started. At that point, the web application is enabled to run on the phone
line to which the Standby Application has been assigned.
•
At some point, someone selects the application that actually is assigned to
a Standby location, from the initial menu. Applications listed on the menu
represent those applications that have been configured as a linked
applications and assigned to a component (see above).
# P0602566 Ver: 2.7
Application Configuration
•
Error Trapping Mode:
Typically, if a condition is generated in an application, and the application
does not explicitly handle or ignore the condition, PeriProducer handles the
condition using the generic error condition. This methodology is
appropriate for all but two conditions that can be generated by an application.
Error Trapping Mode applies specifically to the two conditions (linkdown
and calltim) that should be explicitly handled in order to gain control over
the consequences, if these errors are generated.
!
•
A linkdown condition occurs when contact with a MPS’s VOS process
is lost. By default, when an unhanlded linkdown condition occurs, the
application terminates.
•
A calltim condition occurs when The Maximum Call Length
parameter expires and the call terminates. Maximum Call Length applies
to Web Mode applications and is defined in the Timeouts category of
Execution Options.
linkdown and calltim conditions should be explicitly handled. It is
poor practice to allow them to go unhandled.
Disable Error Trapping.
Unhandled linkdown and calltim conditions are not trapped by
the generic error condition (PeriProducer’s generic trap). When an
application generates a linkdown or calltim condition, the
application terminates, unless the application explicitly handles the
condition.
Enable Error Trapping.
Unhandled linkdown and calltim conditions are trapped by the
generic error condition (PeriProducer’s generic trap), which is used
for all unhandled error conditions.
# P0602566 Ver: 2.7
Page 91
PeriView Reference Manual
•
Search Up for Condition Handler Mode
By default, vexlinked applications will only search for a condition handler
within themselves. If a condition is not explicitly handled in the vexlinked
application, it is treated as an unhandled condition.
The “Search Up” mode specifies that the vexlinked application should also
check the linking application for a condition handler (if there is no appropriate
condition handler in the lined application). If the condition is handled in the
linking application, that handler path is used.
Refer to the PeriProducer User’s Guide for more information on vexlinked
applications.
Do Not Search Up for Condition Handler
Conditions that are not explicitly handled in vexlinked applications
are treated as unhandled conditions
Search Up for Condition Handler
If an unhandled condition occurs in a vexlinked application, the
system checks for a condition handler in the linking application.
•
Timeouts (seconds):
This group of options apply to timeout values and include: Maximum Call
Length, Resource Inter timeout, Resource Error timeout, Message timeout, and
Kill timer.
•
Transaction:
This parameter applies only to web applications and is active only when you
enable Web Mode. Enter the number of seconds to define the transaction
length for the web application (the time it takes for the user to respond to a
request). This parameter applies to the transaction period for the host,
component, and user — and applies only to web applications.
(Default 600 seconds)
When this timer expires, the application receives the condition webtimeout
Unless the application explicitly handles the condition, the call terminates
when it exceeds the length you specified. If Web Mode is disabled the
parameter is inactive.
!
You should not set this parameter to zero (0) as it disables the Maximum Call
Length. If this parameter is disabled, the application could be blocked for an
undetermined amount of time waiting for user’s input.
The Message timeout (which you define at the following parameter) is not
triggered, as it is disabled in Web mode for user inquiry/response time.
Page 92
# P0602566 Ver: 2.7
Application Configuration
•
Message Timeout:
This value represents the internal message timeout parameter. Message
timeout determines the amount of time to wait for a response to each message
that requires a response before a call can be terminated. (Default is 60)
This parameter can apply to the inquiry/response period for the host, the
component, and the user — depending upon the application’s method of
execution.
•
In IVR mode (application executes on telephone lines) this parameter
applies to the inquiry/response period for the host, component, and user.
An application executes in IVR mode when Web mode is disabled.
•
In web mode (application executes on the Internet) this parameter applies
to the inquiry/response period for the host and component, not the user.
An application executes in Web mode only when Web mode is enabled.
When the time interval is exceeded, the application receives the condition
vrto, which terminates the call if the condition is not handled. Enter the
maximum number of seconds for the Message Timeout.
The value for Message Timeout must be greater than the value for Resource
Errortimeout, otherwise the application receives a vrto condition, before the
Intermediate Timeout Message is played.
!
•
Kill Timer:
The kill timer sets the amount of time that an application can remain active
after a soft termination signal is issued. The application terminates when the
maximum time interval is exceeded. Set the kill timer to a specified number of
seconds. (Default is 600).
•
Resource Inter:
The Resource Intertimeout parameter determines the interval during which
the Intermediate Timeout Message is played. This parameter applies to the
inquiry/response period for the component, not the host or the user.
This parameter is disabled (assigned a value of zero) by default. To enable
this parameter, enter the number of seconds at which to set this timer. When
the timer expires, the application receives the condition intertimeout and
the system plays the Intermediate Timeout Message (Please hold on) to
the caller. This message can be redefined at the Execution Option—
Intermediate Timeout Message.
The message is only played if this parameter is less than the Resource
Errortimeout parameter (defined at the following parameter).
For information on programming for components, refer to the Application
Features Guide and the PeriProducer User’s Guide.
•
Resource Error:
The Resource Errortimeout parameter determines the total length of time of
any one inquiry/response period, before the call can be terminated. This
# P0602566 Ver: 2.7
Page 93
PeriView Reference Manual
parameter applies to the inquiry/response period for the component, not the
host or the user.
During the time specified at this parameter, the Intermediate Timeout
Message (Please hold on) is played to the caller at the frequency
determined by the Resource Intertimeout parameter (defined by the previous
parameter). This message can be redefined at the Execution Option—
Intermediate Timeout Message.
This parameter is disabled (assigned a value of zero) by default. To enable
this parameter, enter the number of seconds at which to set this timer. When
the timer expires, the application receives the condition ertimeout which
terminates the call if the condition is not handled.
The Resource Errortimeout parameter should be less than the Message
Timeout parameter or the message playing interval is aborted when the
Message Timeout parameter is exceeded.
For information on programming for components, refer to the Application
Features Guide and the PeriProducer User’s Guide.
•
Counters:
This group of options apply to counter values and include: Infinite Loop Counter
and Condition Counter.
•
Infinite Loop Counter:
The infinite loop counter tracks the number of times that an application
executes the same segment of code, repeatedly, without performing any
useful input or output function. The application terminates when the infinite
loop counter value is exceeded. Enter the maximum number of times an
application can loop before it terminates. A value of zero (0) disables this
counter. (Default is 500).
•
Condition Counter:
The condition counter tracks the number of times that an application
generates the same status/exception condition. The application terminates
when the condition counter value is exceeded. Enter the maximum number of
times a condition can generate before the application terminates. A value of
zero (0) disables this counter. (Default is 64)
•
Messages (Intermediate Timeout):
Enter the message text. This message plays to the caller during the wait time
between an inquiry and its response. Message playing is triggered by both the host
and component timeout parameters. The message text defaults to Please hold
on unless a different message is entered at this parameter.
•
Host Timeout Parameters:
The host timeout period and the interval at which the Intermediate Timeout
Message is played can be defined with the er and intime parameters in
either the commgr.cfg file or within the application.
•
Page 94
The intime parameter determines the interval at which the Intermediate
# P0602566 Ver: 2.7
Application Configuration
Timeout Message is played. This parameter applies to the
inquiry/response period for the host, not the component or the user.
When this timer expires, the application receives the condition intime
and the system plays the Intermediate Timeout Message (Please hold
on) to the caller. The message is only played if this parameter is less than
the er parameter.
•
The er (inquiry/response) parameter determines the total length of time
of any one inquiry/response period, before the call can be terminated.
This parameter applies to the inquiry/response period for the host, not the
component or the user.
During the time specified at this parameter, the Intermediate Timeout
Message is played to the caller at the frequency determined by the
intime parameter. Once the er parameter is exceeded, the application
receives the condition ertimeout, which terminates the call if the
condition is not handled.
The Message Timeout parameter determines the total length of time of any
one inquiry/response period, before the call can be terminated. This parameter
applies to the inquiry/response period for the host, the component, and the
user. The Message Timeout parameter can be defined at the Execution
Option—Message Timeout.
The er parameter should be less than the Message Timeout parameter or the
message playing interval is aborted when the Message Timeout parameter is
exceeded.
For additional information about defining the commgr.cfg file, refer to the
Communications Configuration Reference Manual. For information about
defining the host environment option, refer to the PeriProducer User’s Guide.
•
Resource Timeout Parameters:
The Resource Timeout parameter and the interval at which the Intermediate
Timeout Message is played can be defined within an application or with the
Execution Options—Resource Intertimeout and Resource Errortimeout
parameters. For information about defining Resource Timeout parameters,
refer to the PeriProducer User’s Guide.
•
Interpreter:
Enter the name of the interpreter with which the application executes. Application
files (*.vex) are interpreted files. They cannot run by themselves. They have to
be run by an interpreter. Typically, vengine is the name of the interpreter that
runs the application. This option allows you to specify the interpreter that runs the
application. It may be vengine or it can be another interpreter, that you specify.
(Default is vengine)
•
Environment:
The Environment option allows you to modify the environment variables in effect
when the application executes.
Typically, applications inherit the set of environment variables that are defined by
# P0602566 Ver: 2.7
Page 95
PeriView Reference Manual
SRP. This option allows you to modify those environment variables. You can
define an environment variable with a value to append, prepend, or overwrite
SRP’s value for that variable. If the variable is not defined in SRP’s run-time
environment, then it is added to the run-time environment for the application
being configured.
The set of environment variables is saved, along with all other options, in the
application’s configuration file (*.acfg). Environment variables and their
actions are set at run-time in the order in which they are listed in the Environment
scrolling window.
You must specify the name of the variable, the value by which the variable is
modified, and the action associated with the modifier (append, prepend,
overwrite).
•
Action:
Select from Append, Prepend, Overwrite. This action allows you to
modify the variable that you specify. It determines the relationship
between the variable and modifier, which you specify at the following
two prompts (Variable Name and Value). (Default is Append)
•
Variable Name:
Type the name of the variable to add to the list.
•
Value:
Type the environment modifier. This value either appends, prepends, or
overwrites the variable specified at the previous prompt (Variable Name)
based on the Action you select.
•
Apply:
Select Apply to add the modified environment variable to the
Environment scrolling window. No action is taken until you select Apply.
•
To Remove environment variables from the scrolling list, press Edit and
select Remove. Choose between Selected or All.
•
Selected: All environment variables that are selected are removed from
the scrolling window.
•
All: All environment variables that are listed in the scrolling window are
removed from the window.
Once you have defined all execution options for this application, you can select
Defaults to set the parameters back to their default values.
When you have defined all options, you must select Save in the Configure
Application window to save edits to the file. The symbol changes color from red to
green, when all applied edits have been saved.
For additional information, see Save on page 72.
Page 96
# P0602566 Ver: 2.7
Application Configuration
Diagnostic Options
Use the Diagnostics category of configuration options to designate internal message
reporting functions and source code debugging operations. Diagnostic options are
categorized as Modes, Limits, and Debugging Breakpoints.
To configure Diagnostic Options, define the following parameters.
•
Modes:
This group of options apply to diagnostic modes and include: Report Ignored
Disconnects, Report Unexpected Messages, Display System Messages, Time
Profiling, Display Alarms, and Short Format.
# P0602566 Ver: 2.7
Page 97
PeriView Reference Manual
•
Report Ignored Disconnects:
You can ignore or report Ignored disconnects during debugging.
Enable the reporting of ignored disconnects. (Default).
Disable the reporting of ignored disconnects.
•
Report Unexpected Messages:
You can ignore or report unexpected internal messages during debugging.
Enable the reporting of unexpected messages. (Default).
Disable the reporting of unexpected messages.
•
Time Profiling:
You can collect execution timing information for paragraphs within an
application, when the paragraphs have executed.
Disable collection of execution timing information. (Default).
Enable collection of execution timing information.
•
Display Alarms:
During an application’s execution, messages generated by the application
regarding status/exception conditions can display as alarms. These messages
can be helpful during application development.
Disable Display of Alarms.
No alarms display for status or exception conditions generated by an
application, including those not handled by the application’s HANDLE
CONDITION or IGNORE CONDITION statements. These are either
handled or ignored by HANDLE CONDITION or IGNORE
CONDITION statements in the applications or by Handle blocks in
PeriProducer applications. (Default)
Enable Display of Alarms.
Enables the display alarms for all status or exception conditions
generated by an application, including those handled by the
application’s HANDLE CONDITION or IGNORE CONDITION
statements.
Page 98
# P0602566 Ver: 2.7
Application Configuration
•
Display System Messages:
You can ignore or display input and output debugging messages during an
application’s execution cycle. If you select to display messages, the you can
specify the format of these messages at the following prompt (Short Format).
If you select not to display these messages, the Short Format prompt is
inactive.
Disable display of debugging (input & output) messages. (Default).
Enable display of debugging (input & output) messages.
•
Short Format:
This option is active only if you enable the display of system messages at the
previous prompt (Display System Messages). System messages can display as
either full text or abbreviated messages (short format).
Disable short message format. The full text of debugging messages
displays. (Default).
Enable short message format. An abbreviated version of the full text
debugging message displays.
•
Limits:
•
Maximum Reference Depth (Perform Statement Nesting):
This parameter applies to debugging operations only and does not affect an
application’s performance. Use this parameter to define the number of
traceable levels of source code debugging. If this level is exceeded, the
application’s performance is not be affected, but the list of debugging
statements will be incomplete. Enter an integer that represents the maximum
number of traceable debugging levels. (Default is 128)
•
Debugging Breakpoints:
•
Paragraph:
This value defines the first debugging breakpoint in the application’s source
code. The system default is no breakpoint. Enter the Paragraph Name or
Number that serves as the initial debugging breakpoint. All subsequent
debugging commands are entered interactively.
# P0602566 Ver: 2.7
Page 99
PeriView Reference Manual
Once you have defined all diagnostic options for this application, you can select
Defaults to set the parameters back to their default values.
When you have defined all options, you must select Save in the Configure
Application window to save edits to the file. The symbol changes color from red to
green, when all applied edits have been saved.
For additional information, see Save on page 72.
Vocabulary Options
Use the Vocabulary category of configuration options to define vocabulary and
speech specific parameters. Vocabulary options are categorized as Vocabulary Option
Modes, Timeouts, and Prefixes.
To configure Vocabulary Options, define the following parameters.
•
Modes:
This group of options apply to vocabulary modes and include: Monetary Speech
Concatenation, Use Vocabulary Tokens in English, Use Dollars For Currency,
TDD Literal, Day-Month_Year Format, Quality of Numeric Speech
Concatenation, and Speech Parsing.
•
Monetary Speech Concatenation:
Use this parameter to designate the method of concatenating monetary speech
output at run-time. Your selection should correspond to the size of the vocabulary
that the application accesses. Typically, Monetary Speech Concatenation requires
a larger vocabulary.
For example, $25 can be spoken as a single element “twenty-five dollars” or
as two elements “twenty-five” “dollars.” The phrase “twenty-five dollars”
requires a larger vocabulary that “twenty-five” “dollars.”
Page 100
# P0602566 Ver: 2.7
Application Configuration
Regardless of the number of phrases by which the dollar value is spoken,
numeric items are spoken in the formatted mode defined either by the
PeriProducer data card type, which is specified in the application. Both sign
and decimal place are represented.
!
Disable Monetary Speech Concatenation.
Example: $25 is spoken as the two elements “twenty-five” “dollars.”
(Default)
Enable Monetary Speech Concatenation.
Example: $25 is spoken as the single element “twenty-five dollars.”
This requires a larger vocabulary than is needed if this parameter is
disabled.
•
Quality of Numeric Speech Concatenation:
Define the quality of numeric speech output at run-time by selecting Regular,
Better, or Best.
•
Regular:
Enables the Regular method for concatenating speech output at
run-time. This represents the most minimal quality available for
numeric speech output.
Better:
Enables the Better method for concatenating speech output at
run-time. (Default)
Best:
Enables the Best method for concatenating speech output at runtime. This represents the highest quality available for numeric
speech output.
Speech Parsing:
Indicate the Method of Speech Parsing when speaking numeric amounts,
dates, and time information. Select from Arabic, British, Cantonese, Dutch,
English, European, French, German, Italian, Japanese, Korean, Mandarin,
Portuguese, Spanish, and TDD (Telecommunications Device for the Deaf).
(Default is English)
•
Use Vocabulary Tokens in English:
This parameter is active only when Dutch, French, German, Italian,
Portuguese, or Spanish is selected at the previous prompt (Method of Speech
Parsing). You can display these vocabulary tokens in either the language you
select or in English. This parameter does not affect the language that is spoken
by the token; it affects only the language in which the token displays.
# P0602566 Ver: 2.7
Page 101
PeriView Reference Manual
Disable Using English Vocabulary Tokens.
When you select either Dutch, French, German, Italian, Portuguese,
or Spanish, vocabulary tokens display in the language you select.
(Default)
Spanish Example: Token=uno; Spoken=uno
Enable Using English Vocabulary Tokens.
When you select either Dutch, French, German, Italian, Portuguese,
or Spanish, vocabulary tokens display in English.
Spanish Example: Token=one; Spoken=uno
For additional information about using tokens when recording and naming
vocabulary elements, refer to the PeriStudio User’s Guide. The terms “token”
and “label” can be used interchangeably when working with that document.
•
TDD Literal:
This parameter determines the method by which messages are displayed to a
caller’s TDD (Telecommunications Device for the Deaf) device during an
application’s execution cycle. It is applicable only when configuring an
application for TDD and can only be defined when TDD is selected at the
previous prompt (Method of Speech Parsing).
TDD transactions are accomplished using message text as opposed to spoken
vocabulary. This parameter determines whether the literal message or a
referenced value displays on the caller’s device. Enable or disable the TDD
Literal by specifying OFF or ON.
Enable the TDD Literal method.
The literal message displays on a caller’s TDD a opposed to a
referenced value. (Default)
Disable the TDD Literal method.
A referenced value of the text displays on a caller’s TDD as opposed
to the literal message text.
•
Day-Month-Year Format:
This parameter determines the display format for dates (day-month-year or
month-day-year). You can specify the date format only when British or
Page 102
# P0602566 Ver: 2.7
Application Configuration
English is selected at the previous prompt (Method of Speech Parsing).
Disable Day-Month-Year format.
Dates display in month-day-year format (Example: 12/31/98).
(Default for English)
Enable Day-Month-Year format.
Dates display in day-month-year format (Example: 31/12/98).
(Default for British)
•
Timeouts:
•
Maximum Caller Message Recording Time:
This parameter sets the maximum Caller Message Recording (CMR) to a
specified number of seconds. Enter the maximum length of recording time in
number of seconds. (Default is 60 seconds)
•
Prefixes:
Prefixes apply to the use of vocabulary elements. For additional information about
using prefixes when recording and naming vocabulary elements, refer to the
PeriStudio User’s Guide. The terms “token” and “label” can be used
interchangeably when working with that document.
•
Vocabulary Lookups:
Enter the prefix to be used for vocabulary lookups at run-time. The default is
no prefix. This option is intended for use with multilingual vocabularies. It
specifies the language in which a particular vocabulary item is to be spoken at
run-time.
Once you have defined all vocabulary options for this application, you can select
Defaults to set the parameters back to their default values.
When configuration of all categories of options is complete, you must select Save in
the Configure Application window to save edits to the file. The symbol changes color
from red to green, when all applied edits have been saved.
For additional information, see Save on page 72.
# P0602566 Ver: 2.7
Page 103
PeriView Reference Manual
Configure VoiceXML Applications
VoiceXML applications can reside on separate systems and are accessed through
Uniform Resource Indicators (URIs), like web pages on the Internet. Only the
configuration file (.acfg) is defined and kept on an MPS node. Once a VoiceXML
application configuration file is defined and saved, the application can be assigned,
started, etc. like standard PeriProducer applications.
Identify the Application to Configure
You can load a VoiceXML file using PeriView in the following ways:
•
Specify the file location of the vxml file, or
•
Specify the URI of the vxml application
In the Application field of the Application Configuration window, specify either
the location of the file or the URI of the VoiceXML application.
For example,
Specify the location of the file as follows:
Application: file:///home/peri/CorpDialer/corpdialer.vxml
Or, specify the URI of the vxml application, as follows:
Application: http://vxml_server/apps/corpdialer.vxml
Application Configuration does not verify that the URI is valid (i.e., a VoiceXML
application exists at the specified location). Be sure you enter the valid URI for the
application.
In the Configuration field, enter the location for the configuration file in the
following manner, nodename:/directory/filename.acfg. The directory should
typically be /opt/vps/componentX/apps/appname.acfg. You should use the
same root name for the configuration file as you do for the VoiceXML application.
For example:
Configuration: mpsap1-a:/opt/vps/mps1/apps/corpdialer.acfg
After entering the criteria, click on Load. PeriView creates a default configuration for
the VoiceXML application. Note that the application type automatically changes to
VoiceXML.
Page 104
# P0602566 Ver: 2.7
Application Configuration
Define Custom Configurations
VoiceXML applications can only be Call Processing applications. See “Execution
Type:” on page 85.
Only the Start on Reboot (page 88) and Kill (page 93) timer execution options are
available for VoiceXML applications. All other options are unavailable (and greyed
out in the configuration windows).
Save the Configuration
Click on the Save button to save the configuration file. The configuration file can
then be accessed the same way as any other PeriProducer application configuration
file.
Deploy the Application
Click on the Deploy button to start the Application Management window. The
VoiceXML application can now be handled as a standard call processing application.
# P0602566 Ver: 2.7
Page 105
PeriView Reference Manual
This page has been intentionally left blank.
Page 106
# P0602566 Ver: 2.7
Application Manager
This chapter covers:
1. Launching the Application Management
Plug-in
2. Introduction to Application Management
3. Application Management Actions
4. Application Management Options
5. Application Management Event Cycle
PeriView Reference Manual
Launching the Application Management Plug-in
To launch the Application Management plug-in, open the PeriView GUI Main Screen
as shown in Introduction to PeriView on page 2. Click on the Application
Management icon as displayed below.
The Application Management screen appears as follows:
Page 108
# P0602566 Ver: 1.5
Application Manager
Introduction to Application Management
The APPMAN tool is the PeriView tool that is used to manage applications in the
network. Tree objects depict their state (up, down, unreachable), in near realtime, by the color (green, red, black) of individual objects. You can assign
applications from the Application Management window.
When you launch the Application Management window, the applications that are
currently assigned to the domain displayed in the workspace are listed in the
Applications scrolling window. If you choose the action from a tree object to
which applications are assigned, information specific to the object displays in the
Locations scrolling window. The Applications, Locations, and Options display
areas are inactive until you select an Action.
You can control the order in which applications are assigned by manipulating the
Locations list. Applications are assigned in the order in which the selected
locations are listed. When you choose this action, the order of the Locations
listings, reflects the current default line start order. This information is stored in
the $MPSHOME/component_typeN/etc/aseLines.cfg file.
When you reorder the list in this window, the new order applies only to the current
session. Each time this window is closed and reopened, the listing reflects the
default order (specified in the aseLines.cfg file), not the order specified in
the previous session.
Application files and user shared libraries are copied from their source location to
the designated directories, on the node where they will process during the Assign
process. Executable files (*.vex) and configuration files (*.acfg) for all
applications (main and linked) are copied to the following locations (on the node
where they will process).
Solaris: $MPSHOME/component_typeN/apps
Windows 2000:%MPSHOME%\component_typeN\apps
User shared libraries (*.so or *.dll) will be copied to the following
locations:
Solaris: $MPSHOME/component_typeN/apps/lib
Windows 2000:%MPSHOME%\component_typeN\apps\lib
Application Configuration
An application’s executable and configuration files (*.vex and *.acfg) are
required to exist in the same directory before the application can be assigned to a
location. If you select an executable file a corresponding configuration file is not
detected, a notice box displays to inform you that a configuration file is created
before the assign process continues. Press OK to continue.
# P0602566 Ver: 1.5
•
If you selected a PeriProducer application, it is configured using the
values specified in the executable file (*.vex) and default values for all
options that have not been explicitly specified.
•
Use the Terminate or Un-Assign Lines action to un-assign the
application.
•
Open the Application Configuration window, modify the configuration
Page 109
PeriView Reference Manual
file, save the file, and select Assign/Start to assign the application with the
configuration you saved.
For additional information, see Application Configuration on page 63.
Enter Locations Information
You must select the locations to be assigned in the Locations scrolling window. The
Assign action is not applied to locations that are listed, but not selected. Any location
listed in the scrolling window can be selected, deselected, or removed from the
display.
When you select a main application in the Applications scrolling window, you can
select phone lines in the Locations scrolling window. When you select a linked
application, you can select only components, not phone lines.
To Add Locations to the Locations Window
•
Select/deselect any item in the Choose window, either from the Filter or Tree
tab.
•
If choosing from the Filter tab:
To select more that one item, hold the CTRL key while clicking.
To select a series of items, hold the SHIFT key while clicking.
•
If choosing from the Tree tab:
To select more that one item, hold the CTRL key while clicking.
Holding the SHIFT key under this tab does not allow multiple selections.
•
To add locations, click the right arrow to the right of the Choose window.
Click to add
You can also make use of the background menu available in the Applications area to
add an application from the Chooser to the Applications list. The background menu is
as follows:
Page 110
# P0602566 Ver: 2.7
Application Manager — Overview
Menu Options:
Add from chooser on left—This menu option adds the location details of the
components selected in the chooser on the left side of the Application Management
window.
Remove—This menu option removes the location details of the selected component.
Select—This menu option selects either all or none of the locations from the
Locations list.
To Remove Locations from the Locations Window:
•
Select/deselect any item listed in the Locations scrolling window by <LEFT>
clicking the location.
To select more that one item, hold the CTRL key while clicking.
To select a series of items, hold the SHIFT key while clicking.
•
To remove locations, click the DOWN arrow to the left of the Locations
scrolling window.
Click to remove
Designate the Assign, Start and Restart Order
Applications are assigned/started/restarted, sequentially, in the order in which selected
locations are listed. You can reorder the list to control the assign/start order for the
current session.
•
Select/deselect any item listed in the Locations scrolling window by <LEFT>
clicking the location.
To select more that one item, hold the CTRL key while clicking.
To select a series of items, hold the SHIFT key while clicking.
•
# P0602566 Ver: 2.7
To move locations either up or down, click the UP or DOWN arrow below the
Locations scrolling window.
Page 111
PeriView Reference Manual
click to move
Phone lines are assigned, started, or restarted, sequentially, in the order in which
selected locations are listed in the Locations scrolling window. You can reorder this
list using the up and down arrows. However, the order you define from within this
window applies to the current session only.
Enter Applications Information
You must identify the application that is to be assigned. You can select either one
main application or one or more linked applications.
If you do not select an application, the Assign action is not applied. Any application
listed in the scrolling window can be selected, deselected, or removed from the
display. You can also add applications to the scrolling window.
To add applications:
•
Select an application from the Chooser of the Application Management
window.
•
Click the RIGHT arrow to the left of the Application scrolling window.
Click to add
You can also make use of the background menu available in the Applications area to
add an application from the Chooser to the Applications list. The background menu is
as follows:
Page 112
# P0602566 Ver: 2.7
Application Manager — Overview
Menu Options:
Add from Chooser on left—Once you have selected the components from the
Chooser, selecting the Add from Chooser on left background menu option,
adds the applications selected in the chooser to the Applications list.
Choose Configuration or PeriPro application—This menu option opens the Choose
Application window for the selected application.
Specify VXML Application to configure—This menu option opens the
Application Configuration window for the selected application.
Remove—This menu option removes either all or the selected application from the
application list.
Select—This menu option selects all or none of the applications in the application list.
To remove applications:
•
Select/deselect an item listed in the Applications scrolling window by
<LEFT> clicking the name of the application.
•
Click the DOWN arrow to the left of the Application scrolling window.
Click to remove
Magnifier tool
Magnifier Tool
The Magnifier tool allows you to view the configurations for the selected application.
After you select an application and click on the magnifier tool, the configuration
parameters corresponding to that application are displayed in the Applications
display area as shown below:
Define the Termination Type
Termination type allows for either the abrupt (hard) or delayed (soft) termination of a
call in progress when an application is to be terminated.
When applications are terminated abruptly, any calls that are processing are cut off.
Alternatively, you can delay termination until either the currently processing call
completes its execution cycle or the kill timer limit has expired (whichever comes
first).
# P0602566 Ver: 2.7
Page 113
PeriView Reference Manual
To define Termination Type:
When an application may need to be terminated, you can select the termination type.
Soft Terminate is the default. To select Hard Terminate, check the box in the Options
field.
Select or Soft or Hard Terminate. (Default is Soft.)
•
Soft
The call in progress (if any) is allowed continue up to the value defined for the kill
timer. The call either terminates naturally within this period or the application
terminates the call when the Kill Timer value expires.
•
Hard
The call in progress is terminated abruptly (not allowed to follow through to
completion) before terminating the application.
Page 114
# P0602566 Ver: 2.7
Application Manager — Overview
Expand and Collapse the Tree
A tree is a graphical representation of the network. It can represent either the default
or user defined view of the entire network.
Network entities display as objects on the tree in the workspace. When you display
tree objects, you can use them to launch the subset of Application Manager tools. You
can initiate activity from objects at any hierarchical level of the tree. Multi-selected
objects are manipulated simultaneously.
You can expand user defined domains by lines, nodes, components, and application.
You can only expand the system defined default domain by nodes, components, and
applications.
Expanding a tree places control of network activity at the tree object level. The tree
displays objects, their names, their hierarchical relationships, and application specific
information. Additionally, the color of tree objects (except for applications) show the
state of component’s processes.
For a summary of tree object information, see Tree Object Information on page 116.
# P0602566 Ver: 2.7
Page 115
PeriView Reference Manual
Tree Object Information
Tree object information is displayed with text, by object shape, and by color. The
information displayed by a tree object is directly related to the entity from which it
was expanded. Objects representing network entities include node, component,
application, and line objects.
Tree Object Information Sheet 1 of 2
Node objects are identified by their name, which displays below the object.
Each node represents a unique Solaris machine defined for the network.
The color of a node indicates the status of its components and srp.
•
A red node indicates that at least one of its components is Down, as
indicated by an SRP state of anything other than Running. It indicates
either of the following:
•
•
A green node indicates that all of its components are Up, as indicated
by an SRP state of Running. It indicates both of the following:
•
•
One or more components configured on the node are down. (When
you expand the node by component, one or more components on
the node are represented by red objects)
All components configured on the node are up and running. (When
you expand the node by component, all components on the node
are represented by green objects.)
A black node indicates that the state of the node is unknown. No
information is available because the node is Unreachable. Once
information is available the state of the node is either Down or Up.
A node is considered Unreachable when the node itself is unreachable.
Page 116
# P0602566 Ver: 2.7
Application Manager — Overview
Tree Object Information Sheet 2 of 2
Component objects display their node name, the MPS component number,
and the number of phone lines to which applications have been assigned.
Each component represents an entity that is configured with phone lines and
is capable of both application processing and execution.
The color of a component object indicates its status.
•
A red component indicates that the component is Down, as indicated
by an SRP state of anything other than Running. It indicates that one or
more component-specific processes have either been interrupted or are
not yet fully operational.
•
A green component indicates that the component is Up, as indicated by
an SRP state of Running. It indicates that all component-specific
processes are fully operational.
•
A black component indicates that the state of the component is
unknown. No information is available and the state of the component is
Unreachable. Once information is available, the state of the component
is either Down or Up.
While a component is in the process of booting, and not all processes are
yet fully operational, the component displays as a red object. However, once
the component is Up, the component object becomes green, indicating that
all processes are fully operational.
For additional information about tree object states, see Tree Object
Information on page 116.
Application objects represent the applications that are assigned to
locations.
•
The Application object displays the application name
Line objects represent the phone line that are associated with the
application.
# P0602566 Ver: 2.7
Page 117
PeriView Reference Manual
Types of Applications
The network requires a variety of applications to support call processing applications.
The application itself, plus its configuration parameters, determine the role an
application plays in this process. Although some configuration parameters can be
defined within an application’s executable file (*.vex), each executable file is
associated with a configuration file (*.acfg), which defines configuration
parameters.
Initially, an application is configured as either Main, Linked or VXML.
Application Type
Description
•
Main
•
•
•
Linked
•
•
•
VXML
•
•
•
Copied to the component, assigned to lines, and performs
specific call processing or administrative functions.
Can link to other applications for interim processing functions.
Defined by Execution Type and other configuration parameters.
Copied to the component, but not assigned to phone lines, and
performs interim functions that can be shared among main
applications.
Must be assigned to the component before the main
application(s), which links to it, begins to execute. Files must
remain on the component until the last occurrence of a main
application, that links to it, is un-assigned.
Identified by the link icon that displays alongside the
application’s name in APPMAN windows (when applicable).
No additional configuration options apply.
Copied to the component, assigned to lines, and performs
specific call processing or administrative functions.
Can link to other applications for interim processing functions.
Defined by Execution Type and other configuration parameters.
Main applications are configured as either Call Processing or Administrative.
Execution Type
Description
Call Processing
Main applications, which perform call processing functions.
•
Administrative
Initialization
•
•
•
•
Page 118
Main applications, which perform system maintenance
functions and act to support call processing applications.
Can be configured as initialization applications.
Main, administrative applications that perform initialization
functions, some of which can be prerequisite to other
application processing.
Assigned and execute completely before other applications are
assigned. (Only executes once)
Identified by the initialization icon that displays alongside the
application’s name in Application Manager windows.
# P0602566 Ver: 2.7
Application Manager — Overview
Main applications are defined as Start on Reboot or No Start on Reboot.
No Start on Reboot
Description
Main applications identified with the blue No Start icon have been
configured not to start (restart) during system reboot.
Types of Phone Lines
The MPS’s phone lines are categorized as either call processing lines or
administrative lines. Call processing lines represent physical lines, which are capable
of processing telephone calls. Administrative lines represent logical lines, which are
incapable of processing calls.
Line type checking is enabled, by default, in the Assign/(Re)Start Lines tool. This
ensures that you know the type of line to which you are assigning an application.
Phone lines are represented by icons in the AssignLines, Start Lines, Restart Lines
Terminate Lines, Unassign Lines actions, and Status tools. The icon’s shape and color
indicate information about the phone line.
The shape of phone line icons indicates phone line type (Call Processing or
Administrative). The color of phone line icons (blue, green or yellow) indicates the
state of the phone line (assigned, assigned and running, or un-assigned).
Phone line icon shape and color information is summarized on the following tables.
Shape
Description
Call Processing (Physical) Line; capable of processing calls.
Assign call processing applications to call processing lines.
Administrative (Logical) Line; incapable of processing calls.
Assign administrative applications to administrative lines.
# P0602566 Ver: 2.7
Color
Description
Green
An application is assigned to a phone line and is in the process of
executing (running).
Blue
An application was assigned to a phone line but it is not currently executing
(not running). The application:
•
was assigned but not started,
•
has completed its execution cycle, or
•
has terminated but has not been un-assigned from the phone line.
Yellow
The phone line has been selected, but no application has been assigned to
the phone line.
Page 119
PeriView Reference Manual
File Location Requirements
All files that an application requires during its execution cycle are copied from their
source location to specific locations on the components with the Assign action.
Required files include executable and configuration files for both main and linked
applications and any shared libraries they can utilize.
•
Main and linked application executable (*.vex) and configuration
(*.acfg) files are copied to the following locations (on the node where they
will process).
Solaris:$MPSHOME/component_typeN/apps
Windows 2000:%MPSHOME%\component_typeN\apps
•
User shared libraries (*.so or *.dll) are copied to the following
locations on the node where the main and linked applications with which they
are associated will process.
Solaris:$MPSHOME/component_typeN/apps/lib
Windows 2000:%MPSHOME%\component_typeN\apps\lib
Only one copy of an application will reside on a component regardless of the number
of application instances that are processing on the node.
•
Only one copy of each of the files (*.vex,*.acfg, *.so, *.dll) a main
application requires, must reside on the component where it is processed,
regardless of the number of phone lines to which it is assigned.
•
Only one copy of each of the files (*.vex,*.acfg, *.so, *.dll) a
linked application requires, must reside the on the component where
processing occurs for the main applications that link to it.
Further, you must assign linked and initialization applications to the component where
process occurs before starting main applications that depend on these files during their
execution cycle.
Application files (*.vex,*.acfg, *.so, *.dll) need to remain on the
component where processing occurs until the last instance of the application is
un-assigned from its location. You disassociate files from phone lines with the
Terminate/Un-Assign Lines tool during the Un-Assign process. Linked applications
should only be removed when the last occurrence of all main applications linking to
them are un-assigned.
Page 120
# P0602566 Ver: 2.7
Application Manager — Overview
Solaris File Manager
The applications in this example
(*.vex and *.acfg) have already
been assigned to the MPS and reside
in the directory $MPSHOME/
vps5/apps. Notice the lib file
folder, in which user shared libraries
are located, is a subdirectory of
/apps.
Windows File Manager
The applications in this example (*.vex & *.acfg) have already been assigned to
the MPS and reside in the directory %MPSHOME%\vps204\apps. Notice the lib
file folder, in which user shared libraries are located, is a subdirectory of \apps.
# P0602566 Ver: 2.7
Page 121
PeriView Reference Manual
Application Management Actions
Application Management Actions include associating applications with locations
(components and phone lines) and initiating an application’s execution cycle;
terminating applications and disassociating them from locations; configuring
execution parameters and run-time environment, accessing component and
application status information; defining the default line start order during reboot; and
file maintenance.
Application Management Actions include Assign, Start, Restart, Terminate, Unassign
and Reorder.
Assign:
The Assign process copies applications to the component where
they are processed and associates applications with specific MPS
phone lines.
Only one application can be assigned per phone line.
Start:
The Start process initiates the application’s execution cycle on the
phone lines to which it is assigned.
Restart:
The Restart process terminates an application during its execution
cycle, then restarts the applications on the same phone line.
Terminate:
The Terminate process halts an application’s execution cycle.
Unassign:
The Unassign process disassociates applications from the
components where they are processing and from the phone lines
where they were assigned to execute.
Reorder:
The Reorder Action is used to redefine the order in which
applications are assigned to a location and started (when
applicable) when the system reboots.
The default order is the order which applications are initially
assigned.
Page 122
# P0602566 Ver: 2.7
Application Manager — Overview
Assign Action
Use the Assign Lines action to associate applications with locations and to initiate an
application’s execution cycle.
You can assign an application without starting it, assign and start the application
simultaneously, or terminate, then restart, applications at the same location to which it
was previously assigned. The tree in the workspace indicates the most current
information about the domain.
Assign/Start Order
Applications are copied to the appropriate directory and associated with locations
during the Assign process. The Start process initiates an application’s execution cycle.
The order in which applications are assigned and started is critical to overall system
performance. The assign/start order is initially defined when you assign and start
applications with the Assign/(Re)Start Lines tool. However, the order can be
redefined with the Line Start Order During Reboot tool.
Configuration File Requirements
Before an application can be assigned, a configuration file (*.acfg) must exist in the
same directory as its executable file (*.vex). If you attempt to assign an application
and a configuration file is not present, a default configuration file is automatically
created during the Assign process.
For additional information, see Application Configuration on page 63.
Assign Lines Window Icons
The graphical application and phone line information in the Assign Lines action
windows, is identified in the following table.
For information about types of applications, see Types of Applications on page 118.
For information about configuring application types, see Configure Standard
Applications on page 66.
For information about types of phone lines, see Types of Phone Lines on page 119.
# P0602566 Ver: 2.7
Page 123
PeriView Reference Manual
Icon
Type
Linked
Initialization
Application
No Restart During Reboot
Administrative
Component
(Green, Red, Black)
MPS
Call Processing (Physical) Line
Phone Line
(Green, Blue, Yellow)
Administrative (Logical) Line
Start the Assign Lines Action
Regardless of the method you use to launch the Assign Lines action.
•
Designate and expand a domain (if applicable).
•
Initiate the Assign Lines action by clicking the checkbox next to it.
When you launch the Assign Lines action from a selected tree object, it displays with
predefined application and locations information.
An application can execute in either IVR mode (voice) or Web mode (Internet),
Page 124
# P0602566 Ver: 2.7
Application Manager — Overview
depending upon the configuration parameters associated with the application.
Assign Lines Progress
The rate at which applications are assigned displays to the screen in the form of a
Progress Bar in the lower right-hand corner of the Application Management window.
As the indicator bar progresses from 0–100%, the name of the application and the
location to which it is being assigned, started, or restarted displays in the window.
The Assign Lines process can be halted by selecting Cancel.
Start and Restart Action
Use the Start and Restart Lines actions to initiate an application’s execution cycle.
You can assign an application without starting it, assign and start the application
simultaneously, or terminate, then restart, applications at the same location to which it
was previously assigned. The tree in the workspace indicates the most current
information about the domain.
Start/Restart Order
Applications are copied to the appropriate directory and associated with
locations during the Assign process. The Start process initiates an application’s
execution cycle. The order in which applications are assigned and started is critical to
overall system performance. The assign/start order is initially defined when you
assign and start applications with the Assign/(Re)Start Lines tool. However, the order
can be redefined with the Line Start Order During Reboot tool.
For additional information, see Application Management Event Cycle on page 139.
Configuration File Requirements
Before an application can be assigned, a configuration file (*.acfg) must exist in the
same directory as its executable file (*.vex). If you attempt to assign an application
and a configuration file is not present, a default configuration file is automatically
created during the Assign process.
For additional information, see Application Configuration on page 63.
Start and Restart Window Icons
The graphical application and phone line information in the Start and Restart Lines
action windows, is identified in the following table.
For information about types of applications, see Types of Applications on page 118.
For information about configuring application types, see Application Configuration
on page 63.
# P0602566 Ver: 2.7
Page 125
PeriView Reference Manual
For information about types of phone lines, see Types of Phone Lines on page 119.
Icon
Type
Linked
Initialization
Application
No Restart During Reboot
Administrative
Component
(Green, Red, Black)
MPS
Call Processing (Physical) Line
Phone Line
(Green, Blue, Yellow)
Administrative (Logical) Line
Start or Restart Lines Action
Regardless of the method you use to launch the Start or Restart Lines action.
Page 126
•
Designate and expand a domain (if applicable).
•
Initiate the Start or Restart Lines action by clicking the checkbox next to the
appropriate action
# P0602566 Ver: 2.7
Application Manager — Overview
When you begin the Start or Restart Lines action from a selected tree object, it
displays with predefined application and locations information.
An application can execute in either IVR mode (voice) or Web mode (Internet),
depending upon the configuration parameters associated with the application.
Start and Restart Lines Progress
The rate at which applications are started or restarted displays to the screen in the form
of a Progress Box.
As the indicator bar progresses from 0–100%, the name of the application and the
location to which it is being assigned, started, or restarted displays in the window.
The Start and Restart Lines process can be halted by selecting Cancel.
Terminate or Unassign Action
Use the Terminate or Unassign Lines action to terminate applications and un-assign
them from the locations to which they had been assigned. You can terminate an
application without un-assigning it. The tree in the workspace indicates the most
current information about the domain.
When applications are assigned, they are associated with the user that launched the
Application Manager. Only that user (with the exception of root) is able to start,
restart, terminate, or un-assign that phone line.
Applications are terminated and unassigned in the order in which selected locations
are listed in the Locations scrolling window. The order of the Locations list reflects
the default line start order.
If applications have been assigned to locations subsequent to the list being reordered,
these applications are appended to the locations list.
File Maintenance
The Terminate and Unassign Lines actions provide an option for automatically
removing executable (*.vex), configuration (*.acfg) files when the last
occurrence of the application is un-assigned from a location. Linked applications and
shared libraries cannot be removed with this option because only those applications
that are assigned to phone lines display in the window.
During the assign process, application files and user shared libraries are copied from
their source location to the designated directories on the node where processing
occurs.
•
# P0602566 Ver: 2.7
Executable file (*.vex) and configuration files (*.acfg) for all
applications (main and linked) will be copied to the directory the following
locations:
Page 127
PeriView Reference Manual
Solaris:$MPSHOME/component_typeN/apps
Windows 2000:%MPSHOME%\component_typeN\apps
•
User shared libraries (*.so or *.dll) will be copied to the following
locations:
Solaris:$MPSHOME/component_typeN/apps/lib
Windows 2000:%MPSHOME%\component_typeN\apps\lib
Terminate/Unassign Window Icons
Application and phone line information displays graphically with icons in the
Application and Locations windows. These icons are identified in the following table.
For information about types of applications, see Types of Applications on page 118.
For information about types of phone lines, see Types of Phone Lines on page 119.
For information about configuring application types, see Application Configuration
on page 63.
Icon
Type
Initialization
Application
No Restart During Reboot
Component
(Green, Red, Black)
MPS
Call Processing (Physical) Line
Phone Line
(Green, Blue, Yellow)
Administrative (Logical) Line
Start the Terminate or Unassign Lines Action
Start the Application Manager from the PeriView Toolbar by clicking the icon
•
Designate and expand a domain (if applicable).
Initiate the Terminate or Unassign Lines action by clicking the checkbox next to either
action.
Page 128
# P0602566 Ver: 2.7
Application Manager — Overview
Window Icons
Icons display in the Locations scrolling windows are cues to application, phone line,
and component information. These icons also display with the Assign/(Re)Start Lines,
Status, and Line Start order for Reboot tools.
These icons symbolize: administrative applications that are configured to execute
completely before other applications are started; applications configured not to start at
reboot; components; and, call processing and administrative phone lines, which are
color coded to indicate state.
For information about configuring applications that display with these icons, see
Configuration Options’ Categories on page 73.
Terminate and Unassign Actions
When you use the Terminate or Unassign Lines action, all display areas are inactive
until at least one action is selected. Then, depending upon the selected action(s), only
relevant display areas activate. You must select Apply to effect an action.
These actions are summarized in the following table.
Action
Description
Active Area
Terminate
After you press Apply, currently executing
application(s) terminate at the selected
location(s), sequentially, one line at a time in
the order in which selected locations are listed.
Locations
Options
•
Hard Terminate
Terminate
Unassign
After you press Apply, currently executing
applications first terminate, then are unassigned from the selected location(s),
sequentially, one line at a time, in the order in
which selected locations are listed.
Locations
Options
•
Hard terminate
•
Remove
Any application, which is not currently
executing but is assigned to a location, is
unassigned.
Unassign
After you press Apply, applications, are unassigned from the selected location(s),
sequentially, one line at a time, in the order in
which selected locations are listed.
Locations
Options
•
Remove
Any currently running application is terminated
before being unassigned.
Select Terminate/Unassign Options
You can specify an Option for Action you selected. Hard Terminate is active only
when you select Terminate and affects how a call is in progress is terminated. Remove
is active only when you select Unassign and it performs file a maintenance function.
Hard Terminate
During the terminate process, by default, application termination is delayed until
# P0602566 Ver: 2.7
Page 129
PeriView Reference Manual
either the currently processing call completes its execution cycle or the kill timer limit
has expired (whichever comes first).
The Hard Terminate option allows for either the abrupt (hard) or delayed (soft)
termination of a currently executing application. When applications are terminated
abruptly, any calls that are processing are cut off.
When Terminate is selected as an action, soft terminate is
enabled.
The call in progress (if any) is allowed continue up to the
value defined for the kill timer. The call either terminates
naturally within this period or the application terminates the
call when the Kill Timer value expires.
To disable soft termination and enable hard termination, check
Hard Terminate. The call in progress is terminated abruptly
(not allowed to follow through to completion) before
terminating the application.
Page 130
# P0602566 Ver: 2.7
Application Manager — Overview
Remove
During the unassign process, by default, the executable (*.vex) and configuration
(*.acfg) files of the application to be terminated remains in the file system on the
node where the application is processing.
This option allows for the executable and configuration files (*.vex and *.acfg) of
main applications (applications that have been assigned to phone lines) to be removed
from the file system to which they were copied when the application was assigned.
•
If an application is to both process on an MPS node and execute on the MPSs
phone lines, the files reside on the MPS node.
One copy of each of these files must reside on the node where an application is
processing until the last instance of the application is unassigned. (Thus, this
parameter applies only when the last occurrence of an application is being un-assigned
from a location.) The files being deleted were copied to the directory
$MPSHOME/componentN/apps on the processing node when the application was
assigned to the location.
When Unassign is selected as an action, Remove is
disabled by default.
Files are removed from the processing node when the
last occurrence of an application is un-assigned. They
remain in the /apps directory.
To enable file removal when the last instance of an
application is un-assigned from a location, check the
Remove option.
An application’s executable and configuration files
(*.vex and *.acfg) are deleted from the processing
node’s /apps directory only when the last
occurrence of an application is unassigned from the
location.
Terminate and Unassign Lines
You can select Terminate, Unassign, or both Terminate and Unassign. However, you
must select Apply before an action becomes effective. You can select either a single
action or a combination of actions and apply them to one or more locations. Valid
actions are described individually in the sections that follow.
When applications are to be terminated, the termination type determines whether
application termination is abrupt or delayed.
When you select Terminate in the Actions display area, applications are terminated at
selected locations, one line at a time, in the order in which they are listed. The
application can only be terminated by the user that assigned application (with the
exception of root).
By default, applications Soft Terminate, unless Hard Terminate has specifically been
selected in the Options display area.
# P0602566 Ver: 2.7
Page 131
PeriView Reference Manual
Terminated applications remain assigned to the locations to which they were assigned.
Terminate applies only to lines on which applications have been both assigned and
started (and display with a green icon). Once the application is terminated, the phone
line object displays as a blue icon.
The execution cycle of an application ends when it is terminated. That is, no further
iteration of the application occurs, when termination is selected. This application can
be restarted by selecting the Start action
When you select Unassign in the Actions display area, applications are unassigned
from selected locations, one line at a time, in the order in which they are listed. The
application can only be un-assigned by the user that assigned application (with the
exception of root). Once the application is un-assigned, the phone line object
displays as a yellow icon.
When you attempt to unassign a currently executing application from a location, the
application is first terminated, then un-assigned from the location.
Define the Termination Type
Termination type allows for either the abrupt (hard) or delayed (soft) termination of a
call in progress when an application is to be terminated.
When applications are terminated abruptly, any calls that are processing are cut off.
Alternatively, you can delay termination until either the currently processing call
completes its execution cycle or the kill timer limit has expired (whichever comes
first).
The kill timer defines the amount of time that an application can remain active after a
soft termination signal is issued. This parameter is defined with the Configuration tool
at the Execution Options category.
For additional information, see Execution Options on page 84.
To define Termination Type:
When an application may needs to be terminated, you select the termination type. This
applies to all locations that have been selected for the action.
Select or Soft or Hard. (Default is Soft.)
Soft:
The call in progress (if any) is allowed continue
up to the value defined for the kill timer. The call
either terminates naturally within this period or
the application terminates the call when the Kill
Timer value expires.
Hard:
The call in progress is terminated abruptly (not
allowed to follow through to completion) before
terminating the application.
When you select both Terminate and Unassign in the Actions display area,
applications are sequentially terminated then unassign from the phone line, one line at
a time, in the order in which they are listed. The application can only be terminated or
un-assigned by the user that assigned application (with the exception of root).
Once the application has been terminated, the phone line object displays as a blue
icon. After the application is un-assigned, the phone line object displays as a yellow
icon.
Page 132
# P0602566 Ver: 2.7
Application Manager — Overview
When applications are to be terminated, by default, they soft terminate unless you
explicitly enable the Hard Terminate Option.
When you attempt to unassign a currently executing application from a location, the
application first terminates, then is unassigned from the location.
Terminate/Un-Assign Lines Progress
The rate at which applications are Terminated, Unassigned, or Terminated and
Unassigned displays to the screen in the form of a Progress Box.
As the indicator bar progresses from 0–100%, the name of the application and the
location to which it is being terminated/unassigned displays in the window.
The Terminate/Unassign Lines process can be halted by selecting Cancel.
Reorder Action
Use the Reorder action to control the default order in which previously assigned
applications are assigned and started (if so configured) when the system reboots.
The order in which applications are listed is the default order in which they are
assigned whenever the system reboots. This order also is reflected in the Locations
section. Although all listed applications are assigned when the system reboots, only
those applications that you configure to Start on Reboot are both assigned and started.
As you assign applications, their names are appended to this list. To ensure the correct
default assign start order, you may have to reorder the list, with this action, after you
assign applications, with the Assign/Start/Restart Lines actions.
The MPSs scrolling window identifies all MPSs defined for the domain in the
workspace.
The Lines scrolling window indicates application-specific information.
The Wait for Exit icon indicates that the application is configured
as administrative with Wait for Exit enabled. The No Restart icon
indicates that the application is configured not to restart
automatically when the system reboots.
•
The Line column identifies the line to which the application is assigned on the
component that is selected in the Comps scrolling window.
•
The Application column identifies the name of the application assigned to the
line.
The User column identifies the name of the user that assigned the application to the
location. It is derived from the user name with which the Application Manager was
launched. You do not explicitly enter the user name information.
# P0602566 Ver: 2.7
Page 133
PeriView Reference Manual
How are applications assigned to the list?
Call processing and administrative application names, locations, and icons are added
to the list during the Assign process. Linked applications are not displayed in this list.
Each time you assign a main application, its name is appended to the list.
All applications listed in the Locations window are assigned automatically during
reboot. However, only those applications that you configure to Start on Reboot are
both assigned and started automatically during reboot.
You define the Start on Reboot at the Execution Options category in the Configure
Applications tool.
Applications that you configure not to restart during reboot display with a
blue (No ReStart) application icon. Applications that display this icon are
assigned, but not started, during reboot.
For additional information, see Execution Options on page 84.
What determines the assigned/started order?
Applications are assigned and started (if applicable), sequentially, in the order in
which they are listed.
Each time you assign a call processing or administrative application to a location,
information about the application is appended to this list. Unless you reorder this list
(with the Reorder action), applications are always assigned and in the order in which
you assign them with the Assign action tool.
Why reorder the list?
The order in which any application is assigned/started can be critical to successful call
processing functions. This tool is especially important to Administrative Applications,
which perform system maintenance operations and support call processing
applications.
Typically, administrative applications are associated with logical phone lines, which
are incapable of processing calls. Administrative applications that are configured as
initialization applications, are assigned, started and complete their execution cycle
before assigning other applications.
You define initialization applications at the Wait for Exit parameter in the Execution
Options category in the Configure Application tool.
Administration applications that have been configured to Wait for Exit,
display with an initialization icon.
After assigning an application with the Assign action, it is important to use the
Reorder action to check the default order and reorder the list, if necessary.
Page 134
# P0602566 Ver: 2.7
Application Manager — Overview
What affects the order of items on the list?
Initially, the order of this list is determined by the order in which applications were
assigned with the Assign action. Once applications are assigned, you can redefine
their default assign/start order.
As subsequent applications are assigned with the Assign action, they are appended to
the list in the Locations window. To maintain the correct order, check the list after
assigning applications and reorder the list if necessary.
Where is the information stored?
When you assign a main application (call processing or administrative) with the
Assign action, information about the application is appended to the configuration file
aseLines.cfg. This file identifies the list of applications that execute on the
specified component and the phone lines to which they are assigned.
The aseLines.cfg file resides at the following locations.
Solaris: $MPSHOME/component_typeN/etc/aseLines.cfg
Windows 2000:%MPSHOME%\component_typeN\etc\aseLines.cfg
Each time you assign a main application, the name of the application, the line to which
it is assigned, and your user name, gets appended the list in this file.
The order in which applications are listed in aseLines.cfg determines the order in
which applications are listed when the Application Management window is opened.
When the list is reordered with the Reorder action, the new order is saved in the
aseLines.cfg file.
How do I reorder the list?
You define the Line Start Order by selecting the component and lines that are to be
reordered. You can reorder this list using the up and down arrows. Any move must be
applied before it becomes effective.
When you reorder the lines that are in use, ensure that all the lines (that need to be reordered) are selected.
To define the line start order:
•
In the Comps scrolling window, select the component where the phone lines
are to be reordered.
•
In the Lines scrolling window, select the application(s) that are to be
reordered. You can select and move applications individually or you can
multiply select applications and move the group.
Select applications by <LEFT> clicking the mouse button on the line to be moved.
A line must be selected before it can be reordered.
# P0602566 Ver: 2.7
Page 135
PeriView Reference Manual
Click to move
•
•
Continue with the reorder process until the Lines scrolling window reflects
the correct default order.
Select Apply
Apply:Applies the order listed in this window. In the event of system reboot,
applications are assigned and started (if so configured) in the order in which
they are listed in the Lines scrolling window. Also, each time the Application
Management window is opened, this order is reflected in the Locations listing
(unless applications have been assigned after reordering the list).
Page 136
# P0602566 Ver: 2.7
Application Manager — Overview
Application Management Options
Application Management Options include Force copies, Hard terminate, Ignore line
type, Ignore compat and Remove Files.
Force copies Option
This option allows for application related files to be copied during assignment even
if the destination locations are newer than the source locations.
Hard terminate Option
This option is active when you select Terminate as an action. This parameter
allows for either the abrupt (hard) or delayed (soft) termination of a call in progress
when an application is to be terminated.
This option is also considered when a Restart is done or when a line is to be
reassigned with a different application and it requires a termination.
Ignore line type Option
This option is disabled by default and ensures that you are automatically informed
of the consistency between application type (call processing and administrative)
and line type (physical and logical).
Ignore compat Option
This option ensures that the release compatibility checking is not performed to
warn if an application is assigned to a component when it is not compatible.
# P0602566 Ver: 2.7
Page 137
PeriView Reference Manual
Remove Files Option
This option is active only when you select Unassign as an action. This parameter
enables the automatic deletion of the executable (*.vex) and configuration files
(*.acfg) for main applications, during the Unassign process, when the last
occurrence of the application is un-assigned. This option also enables removal of
shared libraries.
Page 138
# P0602566 Ver: 2.7
Application Manager — Overview
Application Management Event Cycle
This set of procedures is designed to identify the events that can occur during an
application’s life cycle, from the point of view of the Application Management tool.
Step
APPMAN Events Time Line Sheet 1 of 4
1
Create and Generate/Compile Application.
Create a PeriProducer application in the directory designated for development. Be
sure to incorporate the definition of any statistical events for which statistics are to
be generated.
Before you can implement an application, you must create an executable version of
the application.
•
To create an executable for a PeriProducer application, use the PeriProducer
Generate function. For information about generating an application, refer to the
PeriProducer User’s Guide.
•
To create an executable for an application, use the makeapp command, which
is issued from a command line. In the following example, the makeapp
command is issued to compile the source code file newapp.cob.
vsh.5@is5{1} -> makeapp newapp.cob
Compiling under: @ (#) Avaya: 1.31, 5.3.0, 06/30/97
181
vrc: newapp.cob parsed with no errors
vrc: newapp.cob finished ok.
All required files (*.vex, *.acfg, *.so, *.dll) is copied from the user’s
development directory to the required locations on the component during the
Assign process (Step #3).
2
Define a Configuration File and Shared Libraries.
2a
Configuration File:
Optionally (at this time), define a configuration file for this application with the
Application Configuration window. If a configuration file is defined for an
application, both the executable file (*.vex) and its configuration file (*.acfg)
must exist in the same development directory for them to be copied to the
component during the Assign process (Step #3).
If a configuration file (*.acfg) is not defined before the application is assigned, a
default configuration file is created automatically during the Assign process.
All required files (*.vex, *.acfg, *.so, *.dll) is copied from the user’s
development directory to the required locations on the component during the
Assign process (Step #3).
To remove configuration files (as well as executable and shared libraries) from their
location on a component when they are no longer needed, use the Remove Files
option.
# P0602566 Ver: 2.7
Page 139
PeriView Reference Manual
Step
APPMAN Events Time Line Sheet 2 of 4
2b
Shared Libraries:
Create/Compile any shared libraries (*.so or *.dll) that the application requires.
You associate shared libraries with an application with the Application
Configuration window.
You must define the full path name of the shared libraries in the application’s
configuration file (*.acfg) so that they can be copied to the component along with
the application’s executable (*.vex) and configuration (*.acfg) files during the
Assign process (Step #3).
When the application’s executable file is copied to the component during the Assign
process, its configuration file and any shared library files (if Copy File is checked)
associated with the application are also copied to the component (Step #3).
To remove shared libraries (as well as executable and configuration files) from their
location on a component when they are no longer needed, use the Unassign
option.
Page 140
# P0602566 Ver: 2.7
Application Manager — Overview
Step
APPMAN Events Time Line Sheet 3 of 4
3
Assign an Application
The Assign process copies an application’s executable (*.vex), configuration
(*.acfg), and shared library (*.so or *.dll) files from a development directory to
an MPS and associates the application with specific phone lines on an MPS.
Executable and configuration files (*.vex and *.acfg) are copied to the following
locations on the node where they will process.
Solaris: $MPSHOME/component_typeN/apps
Windows 2000:%MPSHOME%\component_typeN\apps
Shared libraries (*.so or *.dll) are copied to the following locations on the
component where the application will be processed.
Solaris: $MPSHOME/component_typeN/apps/lib
Windows 2000:%MPSHOME%\component_typeN\apps\lib
If a configuration file (*.acfg) for this application is located in the same directory as
the executable file (*.vex), it is also copied to the
$MPSHOME/componentN/apps directory (on the component where application
processing occurs) during the Assign process.
•
If no configuration file exists when the application is being assigned, you have
the option to create a default configuration file during the Assign process.
•
Alternatively, you can define a configuration file with the Application
Configuration window, then use the Assign action to assign the application.
Both an application’s executable and configuration files (*.vex and *.acfg) must
exist in the following directories before starting the application, with the Start
process (Step #4).
Solaris: $MPSHOME/component_typeN/apps
Windows 2000:%MPSHOME%\component_typeN\apps
Any shared libraries required by the application must be located in the following
directory paths before starting the application (see Step #2). All files are copied to
their respective directories on the component where the application will be
processed.
Solaris: $MPSHOME/component_typeN/apps/lib
Windows 2000:%MPSHOME%\component_typeN\apps\lib
To define the order in which applications are assigned and started in the case of
system reboot, use the Reorder action. Each time an application is assigned, it
gets appended to the end of the previously defined list. To ensure that the correct
assign/start is defined, be sure to check this tool after assigning applications.
# P0602566 Ver: 2.7
Page 141
PeriView Reference Manual
Step
APPMAN Events Time Line Sheet 4 of 4
4
Start an Application
The Start process initiates the application’s execution cycle at location where it is
assigned. At this point, all required files (*.vex, *.acfg, *.so, *.dll) are copied
to their respective directory locations on the MPS component during the Assign
process.
To terminate an application and/or disassociate it from the phone line to which it was
assigned/started, use the Terminate or Unassign Lines actions.
To redefine a configuration file for an application that has been assigned or started,
modify the configuration file, terminate/un-assign any applications that have been
assigned/started, and assign/start the application with the modified configuration file
(Step #6).
5
Modify the Application (if applicable).
Typically, a user modifies an application at a local drive designated for development
purposes. Once all changes to the application are complete and the application is
recompiled/regenerated, it must be copied to the component where processing
occurs, during the Assign process (Step #3).
In the case of applications that have been assigned/started prior to the modification,
the original version continues to execute until it is terminated/un-assigned.
To replace the original version of the application with the modified version for
previously assigned/started applications, all assigned versions of the original
application must be terminated (if executing) and un-assigned from the locations to
which it was assigned with the Terminate or Unassign Lines actions.
To process the modified application, the application must be assigned with the
Assign action (Step #3).
6
Modify an Application’s Configuration File (if applicable).
Use the Application Configuration window to redefine a previously existing
configuration file. The modified configuration file is associated with the application
during all subsequent Assign processes (Step #3).
In the case of applications that have been assigned/started before the modification,
the application continues to execute with the original (unmodified) configuration file.
To replace the original version of the configuration file with the modified version for
previously assigned/started applications, all assigned versions of the original
configuration must be terminated (if executing) and un-assigned from the lines on
which it was assigned with the Terminate or Unassign Lines action.
To process the application with the modified configuration file, the application must
be assigned with the Assign action (Step # 3).
Page 142
# P0602566 Ver: 2.7
Application Manager — Overview
Application Revision Control
When an application is created it must be compiled before it can be assigned to a line.
(It is the compiled version of the application that actually gets assigned to a line.)
The following information is applicable to Windows 2000 environment.
All instances of an application must be terminated. The application’s *.vex file in
the /apps directory is copied when a modified version of the application is
assigned to any lines on a component. This prevents two versions of the same
application from running concurrently.
If you attempt to assign a application that is a modified version of one that is currently
running to any phone lines on a component, you get the following message.
Press OK to continue. Terminate the application on all the lines to which it is
assigned. Then, proceed to assign the modified version of the application to a
component’s phone lines.
# P0602566 Ver: 2.7
Page 143
PeriView Reference Manual
This page has been intentionally left blank.
Page 144
# P0602566 Ver: 2.7
Status Tools
This chapter covers:
1. Introduction to the Status Tools
2. Working with the Status Tools
3. Overview
4. Phone Line Status
5. Phone Line Status Bar Graph
6. Component Span Status
7. Component Host Status
PeriView Reference Manual
Introduction to the Status Tools
Use the Status Tools to monitor activity in the environment. You monitor component
and application phone line status with a set of graphs, which you launch using tree
objects (domain, node, component, or application). The Linked Application Status
graph provides information about main applications that link to other applications
during their execution cycle. The Span and Host Status tools display information
about digital spans and external hosts, on a per component basis.
The suite of tools on the tool bar provide for monitoring component and application
activity. Although TMSCOMM, and OSCAR objects display in the tree, these
components cannot be monitored with the current suite of tools. These objects do
provide information about the environment in which you are monitoring activity.
For information about OSCAR resource processing, refer to the OSCAR Reference
Guide.
You can display phone line status for single or multiple components and applications
in a pie, bar, or stacked bar graph. You can launch the Linked Application Status bar
graph only for a single, currently executing, application. Phone line status updates at a
pre-defined interval (set in the PeriView Data Provider) as a percentage of phone line
usage or in absolute numbers of lines.
You can launch multiple graphs consecutively. Each graph displays in its own window,
functions independently of other graphs, and can be assigned unique graph properties.
The windows can be moved, resized, or iconified.
Once you launch a graph, it continues to monitor activity, even while iconified. The
iconified graph continually polls components and alerts the operator to potential
problems by emitting a beeping sound and displaying a flashing movement (if so
configured) when the system being monitored does not respond. The graph can be
selectively restored to size to view activity, then iconified while maintaining a
perpetually active state.
Page 146
# P0602566 Ver: 1.5
Status Tools
Working with the Status Tools
You can select any of the Status tools, which include Phone Line Status graphs,
Linked Application Status graphs, Component Span Status, and Component Host
Status.
•
Phone Line Status graphs (pie, stacked bar, bar):
You can monitor phone line status for any component or main application
configured for the domain displayed in the workspace.
•
Linked Application Status Bar graph:
You can monitor phone line status and linking activity only for a currently
executing main application (and its associated linked applications) configured
for the domain displayed in the workspace. (A currently executing
applications has been assigned, started, and displays as green application tree
object.)
Applications are assigned and started with the Application Manager tool.
Refer to Introduction to Application Management on page 109.
•
Component Span Status:
You can monitor the status of digital spans for any component defined for the
domain displayed in the workspace.
•
Component Host Status:
You can monitor the status of external hosts for any component defined for the
domain displayed in the workspace.
# P0602566 Ver: 1.4
Page 147
PeriView Reference Manual
Tree Objects Without Phone Lines
Phone Line Status graphs display information about the physical state of phone lines
for a specific period of time. Therefore, you can only launch graphs with tree objects
that are either configured with phone lines or are associated with a specific application
(which is assigned to phone lines). For information about specific phone line states,
see Phone Line Status on page 150.
You can not launch a graph with a tree object that is not configured with phone lines,
unless it you expand it from an application (it has an application as an ancestor). In
that case, the tree object launches the graph only for the application from which it was
expanded. The graphs you launched by the application, and each of their child tree
objects, are identical and reflect the activity of the application.
Page 148
# P0602566 Ver: 2.7
:
Status Tools
Overview
The four Status tools display information in either graph format or a status window.
•
Phone Line Status graphs (pie, stacked bar, bar):
You can monitor current phone line status for any MPS, or main application
displayed in the workspace. To launch a Phone Line Status pie, stacked bar, or bar
graph click the following icon:
•
Linked Application Status Bar graph:
You can monitor linked application activity only for a single, currently executing,
main application (a green application object). Applications are assigned and
started with the Application Manager tool. For information about assigning and
starting lines, see Introduction to Application Management on page 109. To
launch a Linked Application Status Bar graph click the following icon:
•
Component Span Status:
You can display the status of digital spans, graphically, for any component defined
for the domain displayed in the workspace. To launch a Span Status window click
the following icon:
•
Component Host Status:
You can display the status of an external host, graphically, for any component
defined for the domain displayed in the workspace. To launch a Host Status
window click the following icon:
# P0602566 Ver: 2.7
Page 149
PeriView Reference Manual
Phone Line Status
Phone line status refers to the physical state of phone lines for a specific period of
time. Phone line status indicates what is actually happening on the line during a time
period. You can monitor the current phone line status for MPS and the applications.
Phone line status is defined by seven color coded activity states, which display along
the y-axis of each graph.
The Activity Monitor quantifies and displays each the following phone line states:
Connected, Ready, Referral, Busy, Down, No Answer, and Unreachable. These six
phone line states are defined in the following table.
Page 150
Phone Line State
Color
Description
Connected
Green
The monitor detects ongoing interaction
between the MPS phone lines and callers,
indicating calls are in progress on these lines.
Ready
Yellow
The monitor detects the MPS phone lines are in
service and ready to take calls.
Referral
Orange
Detected activity is dependent upon the type of
referral method that has been instituted—either
a hook flash or digital referral method.
Hook Flash Referral
The monitor detects if the MPS phone lines are
in the process of referring the call to an
operator.
Digital Referral
Activity can be in one of the two following
states:
•
The lines are in the process of referring to
operators.
•
The callers are interacting with operators
Busy
Purple
The monitor detects the MPS phone lines are in
an in-service-busy state and not able to take
calls.
Down
Red
The monitor is able to contact the MPS phone
lines, but detects the lines are not able to
receive calls, indicating that these lines can be
faulty.
No Answer
Blue
The line is Idle and the state is set to no
answer.
# P0602566 Ver: 2.7
:
Status Tools
Phone Line State
Color
Description
Unreachable
Black
Phone line status has been queried for its state
and no message has been received by the
Monitor (basically, a missed response).
Also, it could mean that SRP did not respond to
information about the phone line from the
Monitor. The Monitor needs to query SRP about
how it should contact the CCM (Call Control
Manager) process, before it can actually
contact CCM.
# P0602566 Ver: 2.7
Page 151
PeriView Reference Manual
Phone Line Status Graph Display
A Phone Line Status graph monitors the physical activity state of phone lines for
applications or MPS components. A phone line can be in any one of seven activity
states: Connected, Ready, Referring, Busy, Down, No Answer, and Unreachable.
You can launch graphs from any of the following tree objects: a domain, a node, a
single MPS, a single application, multi-selected MPS, and multi-selected applications.
You can monitor activity for multiple MPS, or applications on a cumulative or
individual basis. A tree object can represent a single entity (as in the case of a single
MPS or application), a collection of entities (as in the case of a domain, group, or
node), or multi-selected MPS or applications. A graph can monitor activity for either
the single entity, the collection of entities, or multi-selected MPS and applications.
When a tree object represents a collection of entities (domain, node), only a single tree
object can be graphed. Alternatively, you can multi-select and graph MPS and
applications. (Each MPS or application represents a single entity, never a collection of
entities.) For example, you can graph either the domain, or a node. You cannot graph
multi-selected nodes. To choose multiple MPS or applications, hold the CTRL key
while choosing.
This graph was launched
with three multi-selected
MPS. The graph displays
with three sets of graph
points, one set for each
MPS. The x-axis label
identifies the names of the
MPS that are being
monitored.
Page 152
# P0602566 Ver: 2.7
:
Status Tools
You can monitor phone line status in either pie or bar graph format. A pie graph
always depicts activity from a consolidated viewpoint. (A pie graph always depicts the
relationship between the whole and its parts.) Unlike the pie graph, bar graphs can
display activity from either a consolidated or individual viewpoint.
•
A consolidated viewpoint depicts activity for the entity with a single set of
bars, which represent all members collectively.
•
The individual viewpoint depicts activity for the entity with a single set of
bars for each individual member.
Bar graphs that are launched by multi-selected MPS or applications, initially display
the individual viewpoint. However, once a graph is launched, this point of view can be
changed by clicking an option under the X Axis heading.
Bar graphs that are launched by an object, which represents a collection of entities (a
group, a domain, or node), initially display the consolidated viewpoint.
The consolidated and individual viewpoints for bar graphs that monitor a single MPS
or application appear identical, as there is only a single set of information to graph.
In the following graphs, phone line status is being monitored for three MPS.
# P0602566 Ver: 2.7
•
The graph with three sets of graph points was launched by multiply selected
MPS objects and displays activity for each of the three MPS, individually.
•
The graph with the single set of graph points displays activity, collectively, for
all three MPS because the viewpoint was changed from Individual MPS to
Consolidated MPS under the X Axis heading.
Page 153
PeriView Reference Manual
Phone Line Status Graph Types
You can monitor phone line status in either a pie, stacked bar, or bar graph format. Pie
graphs offer only a consolidated view of tree object activity. Bar graphs can display
either consolidated or individual views.
Examples of the three types of Phone Line Status graphs follow. Each of the graphs
were launched by the domain Avaya from node MPS201, which is indicated by each
of the Consolidated Graph Frame Labels (201).
Pie graphs display a consolidated view
of phone line activity and phone line
status for the entity you are monitoring.
A pie graph displays the fractional
composition of the parts with respect to
the whole.
Stacked bar graphs display a collective
view of phone line activity and phone
line status for the entity you are
monitoring.
A stacked bar graph displays the
percentage composition of the parts
with respect to the whole. Each
segment of the bar indicates the
percentage of phone line activity for
each state.
The cumulative value of the bar is
equal to 100% of the phone lines
assigned to the entity being monitored.
Page 154
# P0602566 Ver: 2.7
:
Status Tools
The bar graph displays a single point
view of phone line activity and phone
line status for the entity you are
monitoring.
You can express activity in absolute
numbers of phone lines (the default) or
as percentage of the total number of
phone lines. To change to percentage,
select the “View Line Status as %”
option and click Apply.
When you express activity as a percent,
each bar indicates percentage of phone
lines in a specific phone line state. The
cumulative value of a set of bars is equal
to 100% of the phone lines assigned to
the entity being monitored.
Phone line status graphs monitor activity for analog, digital, or mixed (analog and
digital) systems. You can also monitor phone line status for MPS that are configured
(exclusively or partially) with digital spans, with the Component Span Status tool. For
additional information, see Component Span Status on page 167.
# P0602566 Ver: 2.7
Page 155
PeriView Reference Manual
Consolidated versus Individual Viewpoints
The two sets of graphs in this example illustrate the difference between monitoring an
entity from consolidated and individual viewpoints. Both sets of graphs were launched
from the domain Avaya and each set consists of all three Phone Line Status graph
types. The bar graph displays phone lines both as a percentage (of the total number of
phone lines) and in absolute numbers (of phone lines).
Page 156
•
Graph Set A represents the graphs as they were initially launched. The graphs
display a consolidated view of phone line status. Bar graphs display status
with a single set of bars, which monitors the cumulative activity for all MPS
and their assigned applications.
•
Graph Set B represents the individual view, which was explicitly specified at
each graph’s Line Status Graph Properties window, after the graphs were
launched. Status displays with two sets of bars—one set for each MPS.
Activity is monitored, individually, for each MPS (and their assigned
applications) within the domain Avaya.
# P0602566 Ver: 2.7
:
Status Tools
Set A - Consolidated View
All graphs display phone line status, cumulatively, for all MPS in the domain Avaya.
A single set of bars monitor MPS activity, collectively, for all MPS.
# P0602566 Ver: 2.7
Page 157
PeriView Reference Manual
Set B - Individual View
The three bar graphs display phone line status, individually, for each MPS in the
domain Avaya. Activity for each MPS is monitored with an individual set of bars
monitors.
Use the scroll bar to view graph points that extend beyond the scope of the graph
window size.
Page 158
# P0602566 Ver: 2.7
:
Status Tools
Linked Application Status Bar Graph
The Linked Application Status Bar graph displays the phone line status of a currently
executing main application and its linking activity, if any. Linking activity depicts the
activity between the main application and the linked applications it links to during its
execution cycle.
Although the linked application status graph can be launched for any currently
executing main application, the display provides information about the main
application and the applications to which it links during its execution cycle.
Linked applications are not assigned to phone lines. They are copied to the locations
where the main applications (that link to them) are assigned. Then, the linked
applications are accessible to the main application during its execution cycle.
A main application that does not link to other applications, always executes on the
phone line(s) to which it was assigned. However, when a main application links to
another application (linked application), it is the linked application that is executing on
the line to which the main application was assigned and started. When the linked
application has completed its job, control is returned to the main application.
Use the Application Manager tool administer application activity. Use the Configure
Applications tool to configured applications as Main or Linked. Applications are
assigned and started with the Assign/Start/Restart Lines action.
Linked Application Status Graph Display
You can launch the Linked Application bar graph only for a single, currently
executing main application. It displays the main application’s phone line status and
linking activity. The name of the main application and the names of the applications to
which it links display at graph points along the X axis. The Y axis displays phone line
activity as either a percentage (of the total number of phone lines) or in absolute
numbers (of phone lines). The following graph displays the Global Data View of
linking activity for a main application.
# P0602566 Ver: 2.7
Page 159
PeriView Reference Manual
The display and behavior of Linked Application Status bar graphs is heavily
dependent upon the properties by which you define each graph.
You can define the number of graph points and specify linked applications that display
on the X axis. You can express phone line activity on the Y axis as a percent (of the
total number of phone lines) or in absolute numbers (of phone lines).
The number of points that actually display on the X axis can vary. However, the first
two points are predefined, represent the main application, and can not be redefined.
Each point, beginning with the third point, represents an application to which the main
application can link during its execution cycle. The applications that actually display
on the X axis are determined both by the graph’s properties and the run-time activity
of the linked applications.
In this example:
•
24 instances of the main application cemast24 are assigned and running on
mps1091.
•
21 are in a Connected phone line state.
•
3 is in a Ready phone line state.
•
a total 12 instances of the 21 in a Connected phone line state have linked to 8
other applications.
•
9 instances of the 21 in a Connected phone line state have not linked to other
applications.
•
1 graph point displays the beginning of the name of the linked application that
had been active, most recently, in that position. Since there is no linking
activity to display at that position, the name remains on the graph until it is
replaced with active linking information.
Typically, linking activity displays at graph points in order of descending activity
(beginning with the third graph point). The third point on the graph displays the name
of the linked application with the greatest activity (or most number of phone lines in a
Connected phone line state). The remaining graph points display linked applications
in order of descending activity, until all points on the graph are filled.
However, you can designate specific linked applications to always display and assign
them to permanent graph points (beginning with the third graph point). This ensures
their names display at the specified graph points, regardless of their linking activity.
These applications are considered critical applications.
The term critical application refers to an application that can be linked to, from a
main application, and is always present on a linked application status graph.
The number of graph points that display, and the critical applications that permanently
occupy graph points, are controlled at each graph’s Linked Graph Properties window.
Unless all graph points are displayed, not all applications to which a main
application can link, are represented by graph points.
Critical applications, which are permanently assigned to graph points, display
even when they are inactive.
Use the scroll bar to view graph points that extend beyond the scope of the graph
window size.
Page 160
# P0602566 Ver: 2.7
:
Status Tools
The Linked Application Status Bar graph always launches with two predefined graph
points that represent the main application. When linking activity begins, it displays on
the X axis, beginning with the third graph point. You define the total number of graph
points that can display at the graph’s Properties button. Graph points are summarized
as follows:
•
Point #1 - Main Application (Phone Line Status):
The first graph point displays phone line status for all phone lines on which the
application is executing. The application name displays along with the number of
the MPS on which it is executing. On the graph, this point is labeled Line
Status.
The MPS, to which any instance of the main application is assigned, are polled for
the current phone line state of each phone line where the main application is
currently executing.
Although the stacking bar for Point #1 can indicate any of the six phone line
states, typically most of the bar is green (Connected) with alternating yellow
(ready) and purple (busy) bands.
Only the lines in a Connected state are able to link to other applications.
The first graph point displays the same information that you see from any Phone
Line Status graph. Basically, Point #1 is a stacking bar graph that displays phone
line status for the main application. On the Linked Application Status Bar graph,
all other graph points show only applications that are in a Connected phone line
state.
# P0602566 Ver: 2.7
Page 161
PeriView Reference Manual
•
Point #2 - Main Application (Connected phone line state):
The second graph point indicates the total number of lines on which the main
application is currently executing in a Connected state. This bar is always green.
On the graph, this point is labeled Main.
•
•
When this application is executing on all lines (and has linked to none) this
point equals the activity in a Connected state at Point #1. Conversely, when
this application is linking to all applications, no bar displays at this point.
•
When this main application links to other applications, linked application
activity displays at the remaining graph points. The activity at this point (Point
#2), plus the activity of all linked points (starting at Point #3), equals the
activity in a Connected state at Point #1. When there are fewer graph points
(displayed on the X axis) than linked applications, you cannot view all linking
activity.
•
When every instance of the main application has linked to other applications,
the line count at Point #2 reverts to zero (0) and the cumulative activity of all
linked points (starting at Point #3) equals the activity in a Connected state at
Point #1.
Point #3 and all other points - Linked Applications:
A graph can display with a minimum of three graph points. The first two points
are predefined and represent the main application. Linked applications begin to
display at the 3rd graph point. On the graph, these applications are labeled Link.
The number of points that display is defined at a graph’s Linked Graph Properties
window. Applications designated as critical, always occupy specific graph point
(beginning at the third graph point). The linking activity that actually displays,
depends upon the availability of graph points and the activity of individual linked
applications.
•
The order in which critical applications display is defined at a graph’s Linked
Graph Properties window.
•
The order in which non-critical applications display is determined by their
level of activity.
Critical applications always display, even when inactive. Non-critical applications
display from left to right in order of descending activity. Graphs display activity in
near real-time. You specify the interval and which MPS are polled for new
information at the Activity Monitor Polling Rate property. The names of the
noncritical applications that display at each point shift dynamically, as their
activity level changes.
The stacking bar at link graph points are always green, indicating the linked
application is in a Connected phone line state. The line count of a linked
application reverts to zero (0) when the main application is not linked to the
application during a specific time period.
In summary, a graph’s Properties determine the appearance and behavior of the graph.
The Activity Monitor’s Polling Rate property that determines the update interval.
Therefore, linked application activity can best be displayed and interpreted by having
a thorough understanding of the both the graph’s and Activity Monitor’s properties.
Page 162
# P0602566 Ver: 2.7
:
Status Tools
Refer to Linked Graph Properties on page 163.
Linked Graph Properties
The display and behavior of the Linked Application Status Bar graph depends on the
parameters defined at the Linked Graph Properties window. Each graph can be
individually configured with an individual set of properties.
To define Linked Graph Properties:
•
Launch the Monitor and graph a main application that has been assigned,
started, and links to other applications during its execution cycle. (It is
represented by a green application icon.) For additional information, see
Linked Application Status Graph Display on page 159.
•
Select the graph’s Properties button to display the Linked Graph Properties
window. You can customize a graph by defining the following properties.
•
Graph's Frame Label:
Define the name of the Graph's Frame Label. This label displays in the
graph’s title bar. The default label is Activity Monitor.
•
Max # of Non-Permanent graph points to show: (10, 20, Number)
This value determines the maximum number graph points at which
non-permanent linked application activity can display. (Points #1 & #2 always
display main application activity.)
The total number of linked applications that actually display is dependent
upon a combination of factors. The applications that display at non-permanent
graph points (if any) are determined by:
# P0602566 Ver: 2.7
•
the number graph points specified at this parameter.
•
the number of critical applications specified at the Critical Application
List (if any).
•
the activity of the non-critical applications (if any).
Page 163
PeriView Reference Manual
Graph points are classified as non-permanent and permanent.
•
Non-permanent points are occupied by linked applications beginning with
the 3rd graph point, unless permanent graph points are defined for critical
applications.
If permanent graph points are defined, non-permanent linked applications
display after the last permanent graph point. However, the total number of
graph points will not exceed the number specified at this parameter,
unless a greater number of critical applications have been defined. (In that
case, no non-permanent applications display.)
The names of linked applications display, dynamically, at non-permanent
points in order of descending activity.
•
Permanent points always display critical applications at specific graph
points, beginning with the 3rd graph point. Permanent points are
configured at the Critical Applications scrolling window.
Non-permanent linked applications begin to display after the last critical
application. However, the total number of graph points will not exceed the
number specified at this parameter, unless a greater number of critical
applications have been defined.
Because critical applications always display on a specific graph point, the
actual number of linked applications that display can exceed the number you
define at this prompt. The following examples illustrate the interaction
between permanent and non-permanent points.
Page 164
•
If you select 10 and define no critical applications, the names of the ten
most active linked applications display (in descending activity order)
beginning at Point #3. A total of 12 graph points display.
•
If you select 10 and define two critical applications, the two critical
applications display (in a predefined order) beginning at Point #3. The
names of the eight most active linked applications display (in descending
activity order) at the remaining points, beginning at Points #5. A total of
twelve points graph display.
•
If you select 10 and define eleven critical applications, the eleven critical
applications display play (in a predefined order) beginning at Point #3. No
other linked applications display, because the value 10 was exceeded by
the number of critical applications. A total of thirteen graph points
display.
# P0602566 Ver: 2.7
:
Status Tools
Choose to show 10 points, 20 points, or a specific number of points as the
maximum number of non-permanent graph points.
•
The default number of points is 10. If you select 10, the graph actually
displays twelve points, as Point# 1 & Point #2 are always present.
•
The minimum number of points that you can define is 3. If you specify 3,
Point #1 & Point #2 displays information about the main application. The
3rd point displays only the most active linked application, unless one
critical application is defined. In that case, no non-permanent linked
applications display.
It is important to understand that the number of points you select to display
affects the readability of the graph. Ten (10) is the default because a twelve
point graph displays information in a comfortably readable format.
Readability is indirectly proportional to the number of graph points.
(Readability decreases as the number of graph points increase.)
!
Ultimately, the maximum number of points displayed to the graph is
dependent upon the number of critical applications and the value you specify
at this prompt.
•
Y Axis Representation: (Line Number, Percentage)
Choose to express activity as either a percentage of phone lines or in absolute
numbers of phone lines. This selection determines Y axis values.
•
•
Line Number: The Y axis expresses the actual number of phone lines on
which applications are executing (currently in a Connected phone line
state).
•
Percentage: The Y axis expresses the percentage of phone lines on which
applications are executing (currently in a Connected phone line state).
Critical Application List:
This window displays the names of those linked applications that always
display at specific graph points (beginning with Point #3), regardless of actual
linking activity. On the graph, critical applications are labeled Critical not
Link. The term critical application refers to an application that is linked to,
from a main application, and is always present on a linked application status
graph.
You can specify any number of critical applications. They display in the order
in which they are listed in the scrolling window. The number of critical
applications affect the number of linked applications that display at
non-permanent graph points. By default, no critical applications are defined.
In this example, the linked application lt025 is defined as a critical
application. It is the only critical application. It displays at Point #3 and is
labeled Critical not Link. The 8 other visible graph points display the
names of 8 most active non-permanent linked applications, beginning with
Point #4, in order of descending activity.
# P0602566 Ver: 2.7
Page 165
PeriView Reference Manual
To define a critical application:
•
Type the name of linked application that is designated as critical.
•
Select Edit to display the Edit Critical Applications menu and choose
Add, Remove, Select, or Move.
Add:
Choose Add and select Bottom, Top, Before, or After to add the
name of the application to a specific location on the Critical
Application List.
Delete: Choose Remove to remove Selected or All applications from the
Critical Application List. This allows for quick removal of
application names. Remove only clears the window of data. The
application itself remains unaltered.
Move Up or Down:Choose Move to reorder the applications in the
Critical Application List. Critical applications display on the
graph, beginning with Point #3, based on the order in which
applications are listed in this window. To reorder applications,
select one or more applications and choose Up or Down.
Up:
Scroll with the <RIGHT> mouse button move the selected
application(s) up one position on the list.
Down: Scroll with the <RIGHT> mouse button to move the
selected application(s) down one position on the list.
•
Once all properties are defined for this graph, select Apply, Reset, or
Defaults.
Apply: Applies the properties to the Linked Application Status Bar graph.
Reset: Restores the listing to the state after the last occurrence of selecting
Apply.
Defaults: Resets the window to the default. Choose Apply to apply the
settings to the graph.
Page 166
# P0602566 Ver: 2.7
:
Status Tools
Component Span Status
Use the Component Span Status tool to display the state of digital spans (physical
phone lines), graphically, on a per component basis. Span Status is available for each
component defined for the domain in the Activity Monitor’s workspace. This is a
display tool only. You can not initiate activity with this tool.
You can launch Span Status for a single component, multiple selected components, a
single span, or multiple selected spans. A Span Status window opens for each
component/span that you select. The information applies to digital phone lines only
and is available for components with either all digital lines, or a combination of digital
and analog lines. However, the information does not apply to a component’s analog
phone lines.
Span status is updated, by default, at 15 second intervals. This interval is specified by
the PeriView Data Provider software.
You can also display span status information with the VSH and PeriReporter Tools. To
display span status with PeriReporter Tools, refer to the PeriReporter Reference
Guide.
# P0602566 Ver: 2.7
Page 167
PeriView Reference Manual
Span status displays only for (digital) physical phone (call processing) lines, which are
capable of process calls. Span status does not display for logical (administrative)
phone lines, which are unable to process calls and to which administrative applications
are, typically, assigned. Therefore, administrative applications are not listed in the
Applications scrolling window, unless they are assigned to physical lines, which are
digital.
Component Span Status displays the component name and state; the name of the spans
(A, B, C, etc.) and their states; and the phone lines and applications that are associated
with each span.
Span dividers are lines that identify the boundaries between individual spans in the
Lines display area. When you position the cursor over a line, the phone line number
displays under the Lines display area.
The date and time of the last update of information to this window displays in the
lower left corner of the Component Span Status window.
Component Span Status Information
The Component Span Status tool displays the following information.
•
Component:
The node name and component number of the component used to launch the
Component Span Status tool displays in the format nodename:comp_number.
In this example, is9501:101 (MPS 101 on node is9501) was used to launch
the tool. The current state of the component (Up, Down, Unreachable) is
identified by the color coded symbols defined in Key area of the window, labeled
States.
When you launch Component Spans status with a component configured only
with analog phone lines, the Span Status window indicates some information
about the component. However, the message in the Spans display area indicates
that no spans have been detected. In the following illustration, the Span Status tool
was launched with an analog MPS (is7501:1).
•
Spans:
Span information indicates the span state, span name, and phone line range
associated with the span. The current state of the span (Red Alarm, Purple Alarm,
Blue Alarm, Yellow Alarm, Unreachable, Up, Disabled, Unknown) is identified
by the color coded symbols defined in Key area of the window, labeled States.
•
Lines:
The Lines display area identifies information about the spans that are associated
with phone lines. Span dividers are the black lines that define the boundaries
between the individual spans. When the cursor is over an line, the line number
displays under the Lines display area.
The current phone line state is indicated by the color coded symbols defined in
Key area of the window and labeled States.
Page 168
# P0602566 Ver: 2.7
:
Status Tools
The applications associated with a line (if any) are also identified by color coded
symbols defined in the Key area of the window, labeled Applications.
The information displayed in the Lines display area should correspond to the
Phone Line Status Bar graphs. When the Span Status window and bar graph are
launched for the same component, sequentially, the state of each of the lines
should be consistent between the displays.
In the following example, MPS31 launched both the Span Status window and the
Phone Line Status bar graph. The color coded states indicate that the amount of
lines/per state is consistent in each of these displays.
•
Key:
The Key display area is used to associate the color coded symbols for
Applications and States with the Span Status display.
# P0602566 Ver: 2.7
Page 169
PeriView Reference Manual
•
Applications:
The Applications display scrolling window identifies all applications (if any)
that have been assigned to the component. Each application is associated with
a specific color. Each line to which an application is assigned displays with a
colored background, which matches one of the application colors displayed in
the Applications scrolling window. The application names and the phone lines
to which they are assigned can be identified by matching the color sets.
Because span status displays only for (digital) physical phone lines,
administrative applications are not listed in the Applications scrolling
window, unless they are assigned to (digital) physical lines.
•
States:
The States display scrolling window identifies the range of possible
component, Span, and Phone Line states. These symbols are used to indicate
the current state of the component, each span, and each of the digital, physical
phone lines associated with the spans in the Lines display area. Phone Line,
Span, and component states are defined in the following table. For additional
information about phone line states, see Phone Line Status on page 150.
Page 170
# P0602566 Ver: 2.7
:
Status Tools
Component Span Status States Sheet 1 of 2
Symbol
State
Applies To
Description
Connected
Phone Line
Phone line state in which interaction is
detected between the MPS phone lines
and callers, indicating that calls are in
process on these lines.
No Answer
Phone Line
The line is Idle and the state is set to no
answer.
Referral
Phone Line
Detected activity is dependent upon the
type of referral method that has been
instituted (hook flash or digital). Refer to
Phone Line Status on page 150.
Busy
Phone Line
Phone line state in which the MPS phone
lines are in an in-service-busy state and
not able to take calls.
Down
MPS
One or more component-specific
processes have either been interrupted
or are not yet fully operational.
Phone Line
Phone line state in which the MPS or
MPS phone lines are not able to receive
calls.
Span
The state of the span is unknown
because the span is unreachable.
MPS
The state of the MPS is unknown. No
information is available. Once information
is available, the state of the MPS is either
Down or Up.
Phone Line
Phone line state in which the MPS
cannot be contacted therefore, phone
line state cannot be determined.
Ready
Phone Line
Phone line state in which the MPS phone
lines are in service and ready to take
calls.
Up
Span
The Span is in service.
MPS
All MPS-specific processes are fully
operational.
Span
The span has been intentionally disabled
from the MPS.
Unreachable
Disabled
# P0602566 Ver: 2.7
Page 171
PeriView Reference Manual
Component Span Status States Sheet 2 of 2
Symbol
State
Applies To
Description
Yellow Alarm
Span
The span is in a yellow alarm state. The
span is receiving a yellow alarm from the
remote end.
This indicates that the far end is not able
to receive your signal but you are
receiving a signal from the remote end.
The span requires attention.
Red Alarm
Span
The span is in a red alarm state, which
indicates that the span is out of sync.
A red alarm indicates the span has lost
the ability to synchronize with the remote
equipment. The span has, effectively, lost
the incoming signal.
The span requires attention.
Blue Alarm
Span
The span is in a blue alarm state. The
span is receiving a blue alarm from the
remote end. This means you are
receiving a pattern of all ones.
Typically, a blue alarm indicates that the
remote end is in a maintenance mode.
Purple Alarm
Span
The span is in a purple alarm state. The
span is receiving a purple alarm from the
remote end. This means you are
receiving a pattern of all ones on channel
16).
Typically, a purple alarm indicates that
the remote end is in a maintenance
mode.
Unknown
Page 172
Span
The state of the span is unrecognized. It
does not comply with the definition of any
other State listed in this scrolling window.
# P0602566 Ver: 2.7
:
Status Tools
Component Host Status
Use the Component Host Status tool to display host status information,
on a per component basis, for each component defined for the domain in
the Activity Monitor’s workspace. You can select to display host status
based on either the VT number or the phone line number, with which the
VT is associated. This is a display tool only. You can not initiate activity
with this tool.
You can launch Host status for a single component or for multiply selected
components. A Host Status window opens for each component you select and displays
the status of all hosts with which the component communicates.
Host status is updated, at a pre-determined time-interval. This interval is set in the
PeriView Data Provider configuration file.
Component Host Status displays the name and state of the component used to launch
the tool. For each host, the host name, state, and protocol is identified. You can select
to display host status by either VT or Line to obtain state and application information.
When the cursor is over a VT or Line, the VT or Line number displays under the
VT/Lines display area. The date and time of the last update of information to this
window displays in the lower left corner of the Component Host Status window.
# P0602566 Ver: 2.7
Page 173
PeriView Reference Manual
When you launch the Component Host Status tool with a component that is not
associated with a host, you see the message No hosts at the Hosts parameter.
The COMMGR (Communications Manager) process enables application programs to
communicate with external host computers, using a range of protocols. A host’s VTs
are either associated directly with a component’s phone lines or are pooled and made
available to phone lines. This information resides in the COMMGR’s configuration
file $MPSHOME/componentN/etc/commgr.cfg.
Applications, which are assigned to specific phone lines on an MPS, are associated
with a specific host’s VT numbers in the commgr.cfg file.VT/ Line status
identifies the application (if any) associated with the phone line that is configured for a
host’s VT.
For information about the COMMGR process or its configuration file commgr.cfg,
refer to the System Configuration Reference Manual. Host communication functions
and protocols are documented in the Communication Configuration Reference
Manual. COMMGR commands are also individually documented on Solaris man pages,
which are accessible from a VSH command line.
Type vpsman commgr intro to display the man page that provides an overview
of the COMMGR commands
•
Type vpsman commgr status to display the man page that documents
the commgr status command.
You can also display host status information with the VSH and PeriReporter Tools. To
display span status with PeriReporter Tools, refer to the PeriReporter User’s Guide.
Page 174
# P0602566 Ver: 2.7
:
Status Tools
Component Host Status Information
Component Host status information is displayed on a per component basis. Once the
status window opens, information about all hosts to which the component (that was
used to launch this tool communicates) is available. To display information for a
specific host, select the host in the Hosts display area. Component Host status
information includes the following:
•
Component:
The node name and component number of the component used to launch the
Component Host Status tool displays in the format nodename:comp_number.
In this example, is4:4 (MPS 4 on node is4) was used to launch the tool. The
current state of the component (Up, Down, Unreachable) is identified by the
color coded symbols defined in Key area of the window, labeled States.
•
Hosts:
The hosts display area identifies all hosts with which the component
communicates. For each host, the host name, state, and protocol are defined. The
current state of the host (Up, Down, Unreachable) is identified by the color
coded symbols defined in Key area of the window and labeled States. Information
about the VTs/Lines configured for the selected host, displays in the Lines area.
•
Index by VT/Line:
You can select to display host status based on the VT number or the phone line
number with which the VT is associated. Select VT to display status based on VT
number. Select Line to display status based on the phone line number associated
with the VT.
•
VT/Lines:
The VT/Lines display area identifies information about the state of individual
VT’s or phone lines. If VT was selected at the previous prompt, VTs display in
this area. If Line was selected at the previous prompt, phone lines display in this
area.
When the cursor is over a VT or Line, the VT number or line number displays
under this display area. The current state of the VT/Line (Up, Down, Unreachable,
Unassigned VT) is identified by the color coded symbols defined in Key area of
the window and labeled States. The applications associated with a VT/Line
(if any) are also identified by color coded symbols defined in the Key area of the
window, labeled Applications.
The relationship between a component’s phone lines and a host’s VTs are defined
in the commgr.cfg configuration file, which resides in the following locations:
Solaris: $MPSHOME/component_typeN/etc/commgr.cfg
Windows 2000:
%MPSHOME%\component_typeN\etc\info\commgr.cfg
•
Applications:
The Applications display scrolling window identifies all applications (if any) that
are assigned to the component, regardless of which host is selected. Each
application is associated with a specific color. Each VT or line to which an
# P0602566 Ver: 2.7
Page 175
PeriView Reference Manual
application is assigned, displays with a color coded background. To identify the
application, match the color to one of the application colors displayed in the
Applications scrolling window. The applications names and the phone lines to
which they are assigned can be easily identified by matching color sets.
•
States:
The States display scrolling window identifies the range of possible component,
Host, and VT/Line states. These symbols are used to indicate the current state of
the component, each host in the Component Host Status window, and each of the
VTs/Lines in the VT/Line display area. Each of these states are defined in the
following table.
Component Host Status States Sheet 1 of 2
Symbol
State
Applies To
Description
Up
MPS
All component-specific processes are
fully operational.
Host
Protocol software has determined that the
remote host is available for
communication.
VT
Protocol software has determined that a
given VT can be used to establish a
session with the remote host.
MPS
One or more component-specific
processes are not fully operational.
Host
Protocol software has determined that the
remote host is not available for
communication.
VT
Protocol software has determined that a
given VT can not be used to establish a
session with the remote host.
Phone Line
Phone Line state in which the MPS phone
lines are not able to receive calls.
MPS
The state of the component is unknown.
No information is available. Once
information is available, the state of the
component is either Down or Up.
Host
The state of the host is not known, as it is
unreachable.
VT
The state of the VT is not known, as it is
unreachable.
Phone Line
Phone line state in which the MPS cannot
be contacted therefore, phone line state
cannot be determined.
Down
Unreachable
Page 176
# P0602566 Ver: 2.7
:
Status Tools
Component Host Status States Sheet 2 of 2
Symbol
# P0602566 Ver: 2.7
State
Applies To
Description
Unassigned VT
VT
The phone line is not currently associated
with a VT. However, at some other point
in time it can be associated with a VT as a
result of pooling.
Unknown
Span
The state of the host is unrecognized. It
does not comply with the definition of any
other State listed in this scrolling window.
Page 177
PeriView Reference Manual
This page has been intentionally left blank.
Page 178
# P0602566 Ver: 2.7
MPS Control Center
This chapter covers:
1. Introduction to MPS Control
Center
2. MMDP Configuration
3. MPS Configuration
4. MMF Configuration
5. VOS Configuration
6. VpsHosts Configuration
7. Cluster Configuration
8. IPML Configuration
9. Telephony Link Server
10. SCCS Host Data Exchange
11. TAPI Server Connection
PeriView Reference Manual
Introduction to MPS Control Center
The user must have administrative rights in order to access the MPS Control Center.
The MPS Control Center is made up of seven tools.
Page 180
•
MMDP Configuration
•
MPS Configuration
•
MMF Configuration
•
VOS Configuration
•
VPSHOSTS Configuration
•
CLUSTER Configuration
•
IPML Configuration
# P0602566 Ver: 2.7
MPS Control Center
MMDP Configuration
The MPS Manager Data Provider (MMDP) is the single provider of data to the
PeriView. The MMDP Configurator allows you to configure the Data Providers for
PeriView.
This section covers the following topics:
•
Launching the MMDP Configuration Tool
•
Adding a Data Provider
•
Removing Data Provider
•
Create a Data Provider Connection
•
Remove a Data Provider Connection
•
Adding Monitored System
•
Removing Monitored System
Launching the MMDP Configuration Tool
The MMDP Configuration tool allows you to configure the MPS Manager Data
Providers and their relationships. To launch the MMDP Configurator, double click on
the MMDP Configuration option in the MPS Control Center screen. The
following screen appears:
# P0602566 Ver: 2.7
Page 181
PeriView Reference Manual
By default, the MMDP Configuration screen opens with a single MMDP (which is the
local host). In the GUI displayed above, the MMDP runs on the NAGARATNA host.
Note that no other MMDP is configured on this host.
MMDP Configurator—Action Buttons
The MMDP Configuration screen displays three action buttons, namely,
•
RESTORE—Clicking the RESTORE button restores the last known saved
configuration.
•
SAVE—The SAVE button causes the current configuration to be distributed to
all configured (on screen) Data Providers.
•
CLOSE—The CLOSE button exits the utility.
If a user closes the screen by either clicking on CLOSE or by clicking on X, a warning
pop-up screen appears as follows:
The Warning message displays three buttons namely,
•
SAVE, THEN EXIT—Clicking this button causes the current configuration to
be distributed to all configured (on screen) Data Providers.
•
DISCARD CHANGES AND EXIT—Clicking this button closes the MMDP
Configurator screen without saving the changes.
•
CANCEL—Clicking this button cancels the operation and returns to the
MMDP Configurator screen.
Adding a Data Provider
PeriView supports two types of Data Providers:
Page 182
•
Consolidator Data Provider
•
Service Data Provider
# P0602566 Ver: 2.7
MPS Control Center
Adding a Consolidator Data Provider
To add a Consolidator Data Provider, proceed as follows:
1. Launch the MMDP configuration tool. Right click on the parent Data Provider.
2. Select the ADD DATA PROVIDER menu option, the following screen
appears.
You can also launch the Add Data provider screen by clicking on the ADD
button under the first list on the left hand side of the MMDP Configuration
tool screen. Note that all the screens corresponding to the functionalities available
with the MMDP Configurator can be launched either by right clicking on the Data
Provider or by clicking the respective buttons.
# P0602566 Ver: 2.7
Page 183
PeriView Reference Manual
This is true for the Remove Data Provider, Add Monitored System, Remove
Monitored System, Create a Data Provider Connection, Remove Data Provider
Connection functionalities.
3. Choose the Consolidation Workstation radio button to add the
Consolidator Data Provider.
4. Check the Import Existing Configuration checkbox, if you
need to support data replication on multiple consolidators.
If you do not check the Import Existing Configuration checkbox, clicking
on the Add button will rewrite the currently existing configuration data on a newly
added consolidator with the default configuration data.
5. Modify the parameters in the screen as required.
Detailed Description of the Add Data Provider screen
Name of new Data Provider Host—Allows you to enter a name for the new
Data Provider that is being created.
Data Provider Type—Allows to choose between Consolidator and Service
Data Provider types.
Add—Clicking on this button adds the new MMDP host to the list of Data
Providers present in the system.
Cancel—Clicking on this button, cancels the operation and returns to the
MMDP Configuration tool screen.
Page 184
# P0602566 Ver: 2.7
MPS Control Center
6. Click on the ADD button, to add the new Consolidator MMDP to the list
of Data Providers. The following screen appears with the consolidator
MMDP displayed in the list of the Data Providers.
# P0602566 Ver: 2.7
Page 185
PeriView Reference Manual
Adding a Service Data Provider
To add a Service Data Provider, proceed as follows:
1. Repeat step 1 and step 2 from the Adding a Consolidator Data Provider
section.
2. Choose the Service Data Provider radio button to add the Service Data Provider. Select the parent MMDP for the service MMDP from
the dropdown list.
3. Modify the parameters as required. Refer the Detailed Description of the
Add Data Provider screen section for more details.
Page 186
# P0602566 Ver: 2.7
MPS Control Center
4. Click on the ADD button under the first list on the left hand side, to add
the new Service MMDP to the list of Data Providers. The following
screen appears with the Service MMDP displayed in the list of Data Providers.
# P0602566 Ver: 2.7
Page 187
PeriView Reference Manual
Removing Data Provider
To remove a Data Provider from the Data Provider’s list, click on the REMOVE button
under the first list on the left hand side. The following screen appears:
1. To remove the Data Provider from the list, click on DONE. A pop up window appears with the warning message displayed as follows,
2. Click on OK to remove the Data Provider.
Page 188
# P0602566 Ver: 2.7
MPS Control Center
Create a Data Provider Connection
The MMDP Configuration tool allows you to create a connection between the existing
Data Providers. To create a data provider connection, proceed as follows:
1. Launch the MMDP configuration tool. Right click on any Data Provider.
2. To create a connection, choose the Create Connection menu
option. The following screen appears:
# P0602566 Ver: 2.7
Page 189
PeriView Reference Manual
3. Select the parent (Connect From) and child (Connect To) Data Providers to create the connection. Clicking on the Add button, establishes
the connection between the two Data Providers as shown below.
When you select a Data Provider from the Data Provider’s list, the properties and the
respective values of these properties are displayed on the right hand side of the screen.
You are not allowed to modify the properties, however you can change the respective
values. Also, when a Data Provider marked as to be imported is selected, it’s
properties are not displayed since its properties are not imported yet.
Page 190
# P0602566 Ver: 2.7
MPS Control Center
Remove a Data Provider Connection
To remove a Data Provider Connection, right click on the DATA PROVIDER which you
want to disconnect and choose, REMOVE CONNECTION option. The following screen
appears:
1. Select the Connected From and Connected To Data Providers
from the lists and click on REMOVE. A pop up window appears with a
warning message displayed as follows,
2. Read the warning message and click on OK to remove the connection.
# P0602566 Ver: 2.7
Page 191
PeriView Reference Manual
Adding Monitored System
To add a monitored system to the monitored systems list, select a Data Provider from
the first list on the left hand side and then, click on the ADD button under the second
list on the left hand side of the screen. The following screen appears:
1. Specify the name of the system and click on the ADD button. The newly
added system appears in the monitored systems list as follows:
Page 192
# P0602566 Ver: 2.7
MPS Control Center
Removing Monitored System
To remove the monitored system, click on the REMOVE button under the second list
on the left hand side of the screen. The following screen appears:
1. To remove the monitored system, click on OK.
# P0602566 Ver: 2.7
Page 193
PeriView Reference Manual
Supporting Data Replication in MMDP
MMDP has a built-in capability to replicate the configuration of all data providers
amongst other PeriView Data Providers, provided that they are not configured as
Service MMDPs. Data replication occurs only amongst consolidator MMDPs.
Data Replication occurs in the following scenarios:
•
A user changes the MMDP configuration data on one MMDP which is
connected to at least one more MMDP, acting as a consolidator.
•
A user requests to import a Consolidator MMDP's configuration and the
operation completes successfully (the imported MMDP receives the merged
configuration which includes not only itself, but also the configuration data of
all the other MMDP that the user was connected to).
or,
In order for data replication to occur, the following conditions must be satisfied:
•
The MMDPs must be able to establish a network connection between them.
•
The MMDP that sends the update (called the replicator) has newer
information than the MMDP that receives the update (called the replicant).
If updates are done on a replicator, and it is not connected to a replicant, the updates
are cached until such time when the replicator is able to connect. Under most
circumstances, both machines will be up and running, and replication will occur
within one second.
Data replication in MMDP implies that the data stored and displayed through the
clients (PeriView) is consistent and correct at all times. To better understand
replication, consider the following scenario:
The user is using PeriView to connect to the MMDP, UNITEDSTATES.
Additionally, the user has a second instance of the PeriView client connected
to the MMDP, ISRAEL.
Page 194
# P0602566 Ver: 2.7
MPS Control Center
In order to understand data replication in MMDP, consider a scenario where in, there
are two MMDPs (with the same configuration) namely ISRAEL and
UNITEDSTATES. These MMDPs are configured through MMDP utility and
recognize each other’s configurations. Launch the PeriView and connect to ISRAEL
and simultaneously launch another session of PeriView and connect to
UNITEDSTATES as shown below:
# P0602566 Ver: 2.7
Page 195
PeriView Reference Manual
As stated earlier, if the user changes a configuration item on one MMDP, the other
MMDP receives an update. The receiving MMDP is responsible for notifying all its
PeriView clients that a modification has taken place.
In the same scenario as above (using the PeriView connection to ISRAEL), if you
select ISRAEL, change its properties and save these changes, the entire configuration
of all MMDPS is redistributed to all replicant MMDPs. That is, information about the
changes made in the configuration of ISRAEL gets distributed to all the MMDPs (and
open PeriViews) in the system. A message is displayed in the PeriView connected to
UNITEDSTATES as follows:
To view the updated configuration, click OK in the pop-up window. This will force the
data to be applied and the correct information is displayed in the PeriView connected
to UNITEDSTATES.
In the event, there were changes being made to the configuration of
UNITEDSTATES, which weren’t saved, the changes will be lost due to the
mandatory update information from ISRAEL. This guarantees that a client cannot
selectively deny an update from occurring.
Page 196
# P0602566 Ver: 2.7
MPS Control Center
MPS Configuration
MPS Configurator distributes the same tms.cfg file to all nodes defined in the cluster
that it works on. Therefore, make sure to properly configure a cluster that contains the
desired nodes before using the MPS Configurator. Use the Cluster Configurator
plugin to configure clusters. For additional information, see Cluster Configuration
on page 208.
The MPS Configurator is the utility to configure the tms.cfg file, which is accessed
by several MPS processes.
This file is located at
Solaris: $MPSHOME/common/etc/tms/tms.cfg.
Windows 2000: %MPSHOME%\common\etc\tms\tms.cfg.
For additional information, see Cluster Configuration on page 208.
The MPS Configurator can:
•
Configure System Parameters
•
Configure MPS Resource Allocation
•
Configure MPS Clock Setting
•
Configure MPS Spans
•
# P0602566 Ver: 2.7
•
Add
•
Remove
•
Resource Setting
•
Protocol Setting
•
Line Mapping
Manage NIC Cards
Page 197
PeriView Reference Manual
Function
1. Open the MPS Control Center by clicking its icon.
2. Choose MPS Configuration.
This can be done in one of two ways:
a. Highlight an MPS component to configure by clicking on it
within the tree structure, and then double-click MPS
Configuration.
or
b. Double-click the MPS Configuration. Then the Component
Selector will open.
Use the pull down menus to choose the node and component to
configure and click OK.
Page 198
# P0602566 Ver: 2.7
MPS Control Center
3. The MPS Configurator will open, showing the selected cluster and
the nodes in the cluster in a tree structure on the left-hand side.
The right-hand side panel displays different properties according to
different selections of the tree levels.
(a) At the Root or Cluster level:
Click on the “General” tab to display the nodes in the cluster.
Click on the Details tab to display all configuration information
of this cluster.
No change can be made at this level.
(b) At the Node level:
Click on the “General” tab to display the MPS components on the
node. You can configure the DTCMAP/BIND section in the
tms.cfg file by clicking ADD or MODIFY buttons.
Click on the Details tab to display all configuration information
of this node.
(c) At the Component level:
Click on the “General” tab to display the properties of this MPS
component; Clock can be configured here.
# P0602566 Ver: 2.7
Page 199
PeriView Reference Manual
Click on the “Shared Resources” tab to display the shared
resources configured on this MPS. You can add or remove
resources, override resources parameters, or copy the resources
configuration from another MPS component.
Click on the “Static Resources” tab to display the static resources
configured on this MPS component. The static resources can be
configured on the lines of the MPS component.
Page 200
# P0602566 Ver: 2.7
MPS Control Center
Click on the “Details” tab to display all configuration of this MPS
component.
(d) At the TMS card level:
Click on the “General” tab to display the spans configured on this
card. You can add or remove span here.
Click on the “Details” tab to display all configuration of this TMS
card.
# P0602566 Ver: 2.7
Page 201
PeriView Reference Manual
(e) At the span level:
Click on the “General” tab to set the span’s configuration,
including protocol, line mapping, and ISDN associated
configuration (when applicable).
Click on the “Static Resources” tab to display the static resources
configured on this span. Static Resources can be configured on
the lines of this span.
Click on the “CCSS(SS7)” tab to configure the CCSS (SS7)
settings. This tab will be enabled only when an appropriate
protocol is applied to this span and a DCC3000 card is installed.
4. Using the MPS Configurator menu selection, the configuration can
be performed as follows:
(f) Clocks:
Click on the menu “MPSConfigurator” on PeriView menu bar
and select “Clocks”. The clocks of MPS components can be
configured by choosing the appropriate menu item.
(g) Manage Network Interface Cards (NICs):
Page 202
# P0602566 Ver: 2.7
MPS Control Center
(h) Click on the menu “MPSConfigurator” on PeriView menu
bar and select “Advanced”, then “Manage NICs”. Network
Interface Cards can be configured in the tms.cfg file.
(i) Override System Parameters:
Click on the menu “MPSConfigurator” on PeriView menu bar
and select “Advanced”, then “Override System Parameters”. You
can override the specific system parameters in the tms.cfg file.
!
MPS Configurator cannot validate the overridden system
parameters. Therefore, make sure that the overridden data is
valid to avoid any undesired result.
(j) Import a tms.cfg from another node in the cluster:
Click on the menu “MPSConfigurator” on PeriView menu bar
and select “Advanced”, then Import tms.cfg. When user has a
cluster containing multiple nodes, the user can import the
tms.cfg file from another node other than MPS Configurator
starts with as needed.
Only the data associated with the MPS components of the node
will be imported. Any other data in the imported tms.cfg file
will be ignored.
# P0602566 Ver: 2.7
Page 203
PeriView Reference Manual
MMF Configuration
The Multi-Media File (MMF) Configurator provides a Graphical User Interface (GUI)
to configure the vmm-mmf.cfg file.
This file is located in $MPSHOME/mpsN/etc/vmm-mmf.cfg.
The MMF Configurator can:
•
Configure the vmm-mmf.cfg file of a selected component
•
Load/Unload MMF files dynamically.
Function
5. Click the ADD button to add a new MMF file.
•
Type in the path or click CHOOSE to locate the desired MMF file.
•
Using the pull-down menu choose whether the file will Record or
Playback.
•
Using the pull-down menu choose whether the file should be applied to
the System or the Application.
6. Click the DELETE button to remove an MMF file.
7. Click the MOVE UP or MOVE DOWN buttons to change the order of the
MMF files.
Page 204
# P0602566 Ver: 2.7
MPS Control Center
8. Click the checkbox under Load At Start to choose whether a specific file
should be loaded at startup.
9. Choose MMF File Options
# P0602566 Ver: 2.7
•
Turn Load all Elements Into VDM on or off.
•
Set the PreLoad Time of Each Element (in seconds)
Page 205
PeriView Reference Manual
VOS Configuration
The VOS Configurator provides a Graphical User Interface (GUI) to configure the
vos.cfg file.
This file is located in $MPSHOME/mpsN/etc/vos.cfg.
The VOS Configurator can:
Page 206
•
Add new processes
•
Remove existing processes
•
Update existing processes
•
Comment Out existing processes
# P0602566 Ver: 2.7
MPS Control Center
VpsHosts Configuration
The VpsHosts Configurator provides a Graphical User Interface (GUI) to configure
the vpshosts file.
This file is located in $MPSHOME/mpsN/etc/vpshosts
The VpsHosts Configurator can:
# P0602566 Ver: 2.7
•
Add new components
•
Remove existing components
•
Update existing components
•
Comment Out existing components
Page 207
PeriView Reference Manual
Cluster Configuration
The Cluster Configurator provides a Graphical User Interface (GUI) to configure the
clusters.xml file which resides at the same host where the MPS Manager Data
Provider (MMDP) runs.
The cluster information will affect the MPS Configurator.
For additional information, see MPS Configuration on page 197.
IPML Configuration
The IPML Configurator allows you to graphically change configuration files.
This section guides you through the IPML Configurator.
Before clicking on the icon for the IPML Configurator within the MPS Control Center
you must navigate through the directory structure to locate the node to configure.
After doing this, click on the IPML Configurator icon.
Only the node containing the IPML configuration activates the IPML utility. If not the
case, the footnote displays “Invalid selection in the Topology tree” message.
Only one instance of the IPML utility for the node can be active at any given time.
Choose the Packages to Configure
The first window of the IPML Configurator, Welcome to the IPML Configuration
Program, lets you choose the packages you will configure. Depending on the choices
you make here, certain windows may or may not appear throughout the rest of the
wizard.
Page 208
# P0602566 Ver: 2.7
MPS Control Center
To choose the packages to configure:
1. Put a checkmark next to each package to configure. Since the base package is required, there is always a checkmark next to the IPML Base Package.
2. Click the Start button. The Global System Options panel appears. It
provides options that csad uses for the call data.
# P0602566 Ver: 2.7
Page 209
PeriView Reference Manual
3. Click Advanced to view the next panel Logging Options. This panel
lists IPML specific processes and configures the way logging is performed on each process.
4. The following table shows which windows appear based on the packages
you choose. The rest of this chapter describes each of the windows in
order.
Page 210
# P0602566 Ver: 2.7
MPS Control Center
Window in
IPML
Configurator
IPML Base
Package only
Base Package
plus IVR
SCCS
Integration
Package
Base Package
plus TAPI
Integration
Base Package
plus CCT-IVR
Integration
Configure
External Host
Interface
Telephony Link
Server
Identifier
Telephony Link
Server
Interface
Telephony Link
Interface
IPML SP
Identifier
IPML SP
Interface
SCCS Host
Data
Exchange (BiDirectional)
Interface (3
windows)
Server Side
Connection for
SCCS Server
for Real-Time
Stats (2
windows)
SCCS Server
Connection to
Send Data
Only (3
windows)
TAPI Server
connection to
Symposium
Microsoft TAPI
Server (3
windows)
# P0602566 Ver: 2.7
Page 211
PeriView Reference Manual
Configure
Internal Host
Interface
CTI
Connection to
the IVR (2
windows)
Advanced
Options::CSVA
PI
Real-Time
Agent Stats
Connection to
the IVR (2
windows)
Advanced
Options::CSR
SM
TAPI SCCS
Connection to
the IVR (2
windows)
TAPI
Connection to
the IVR (2
windows)
Page 212
# P0602566 Ver: 2.7
MPS Control Center
Window in
IPML
Configurator
IPML Base
Package plus
IVR SCCS
Integration
Package and
TAPI
Integration
Base Package
plus IVR
SCCS
Integration
Package and
CCT-IVR
Integration
Base Package
plus TAPI
Integration
and CCT-IVR
Base Package
plus
IVR SCCS
Integration
Package,
TAPI
Integration
and CCT-IVR
Integration
Configure
External Host
Interface
Telephony Link
Server
Identifier
Telephony Link
Server
Interface
Telephony Link
Interface
IPML SP
Identifier
IPML SP
Interface
SCCS Host
Data
Exchange (BiDirectional)
Interface (3
windows)
Server Side
Connection for
SCCS Server
for Real-Time
Stats (2
windows)
SCCS Server
Connection to
Send Data
Only (3
windows)
# P0602566 Ver: 2.7
Page 213
PeriView Reference Manual
TAPI Server
connection to
Symposium
Microsoft TAPI
Server (3
windows)
Configure
Internal Host
Interface
CTI
Connection to
the IVR (2
windows)
Advanced
Options::CSVA
PI
Real-Time
Agent Stats
Connection to
the IVR (2
windows)
Advanced
Options::CSR
SM
TAPI SCCS
Connection to
the IVR (2
windows)
TAPI
Connection to
the IVR (2
windows)
Page 214
# P0602566 Ver: 2.7
MPS Control Center
Telephony Link Server
Use these windows to specify the new or existing telephony link server to associate
with a switch.
These windows always appear, since they are used to configure the required base
package.
1. In the Configure External Host Interface window, click the Next button.
The Telephony Link Server Identifier screen appears.
# P0602566 Ver: 2.7
Page 215
PeriView Reference Manual
2. To add a new link:
a. Type a name in the Enter a Logical Identifier box and click Add. The
Telephony Link Server Type window appears.
Page 216
# P0602566 Ver: 2.7
MPS Control Center
3. To use an existing link:
a. Choose the link in the Select the Logical Identifier box and click
Modify. The Telephony Link Server Interface window appears.
The attributes displayed in the Telephony Link Server Interface window change
depending upon the switch type selected by the user.
Or if you do not need to make changes to a link or add a new one, click the
Skip button and go to the next task.
# P0602566 Ver: 2.7
Page 217
PeriView Reference Manual
4. To delete a link:
a. Choose the link in the Select the Logical Identifier box and click
Delete.
5. Enter information in the window using the following table.
Page 218
Field
Explanation
Switch IP
Address
Defines the hostname of the machine where the
Telephony Link Server is installed.
Port Number
The Telephony Link Server connection port.
Application ID
Usually the host name of the machine running the
Telephony Link Server.
Customer No
The PBX customer number defined in the Customer
Data block. Allows numbers 0 through 15.
Host Name
The host name for the Meridian Link/MLSM.
Machine ID
The PBX M1 machine name. Default is SL16.
# P0602566 Ver: 2.7
MPS Control Center
6. Click the Advanced... button.
7. Enter information in the window using the following table, then click the
Save button.
Field
Explanation
Poll Interval
Number of seconds to wait between polls. Allows
values 10 through 120.
Request to
Timeout
Number of seconds before a request times out. Allows
values 10 through 300.
8. Click the Save button again.
Currently, IPML supports multiple link servers configuration, which means that the
user can configure multiple tls, hdxls, rsmls, tapils (ls means 'link server').
# P0602566 Ver: 2.7
Page 219
PeriView Reference Manual
CCT-IVR Integration
Use these windows to configure the IPML Service Provider package.
These windows appear only if you are configuring the IPML Service Provider
Integration package.
1. To use an existing link:
a. Choose the link in the Select the Logical Identifier box and click
Modify.
b. Go to step 2.
Or to add a new link to use:
a. Type a name in the Enter a Logical Identifier box and click Add.
b. Go to step 2.
Or if you do not need to make changes to a link or add a new one, click
the Skip button and go to the next task.
To remove an existing link, choose the link in the Select the Logical Identifier box
and click Delete.
Page 220
# P0602566 Ver: 2.7
MPS Control Center
If there is no existing link available, the default entry in the Logical Identifier field
will be ‘cct’. A new link can be created by clicking the Add button.
# P0602566 Ver: 2.7
Page 221
PeriView Reference Manual
2. Enter information in the window using the following table
Page 222
Field
Explanation
Remote Host
The host name of the CCT Server
Remote Port
The listening port of the CCT Server
# P0602566 Ver: 2.7
MPS Control Center
SCCS Host Data Exchange (Bi-Directional) Interface
Use these windows to specify the new or existing HDX link server to associate with
the Symposium Call Center Server.
These windows appear only if you are configuring the IPML SCCS Integration
package.
1. To use an existing link:
a. Choose the link in the Select the Logical Identifier box and click
Modify.
b. Go to step 2.
Or to add a new link to use:
a. Type a name in the Enter a Logical Identifier box and click Add.
b. Go to step 2.
Or if you do not need to make changes to a link or add a new one, click
the Skip button and go to the next task.
# P0602566 Ver: 2.7
Page 223
PeriView Reference Manual
To remove an existing link, choose the link in the Select the Logical Identifier box and click Delete.
2. Enter information in the window using the following table
Page 224
Field
Explanation
Server Site IP
Address
The IP address of the Telephony Link Server.
Provider Site
IP Address
The PBX M1 machine name. Default is SL16.
Register ID
Usually the name of the Telephony Link Server.
# P0602566 Ver: 2.7
MPS Control Center
3. Click the Advanced... button.
4. Enter information in the window using the following table, then click the
Save button.
Field
Explanation
Poll Interval
Number of seconds to wait between polls. Allows values
10 through 120.
Request to
Timeout
Number of seconds before a request times out. Allows
values 10 through 300.
5. Click the Save button again.
6. If you need to enter another HDX link server, repeat steps 1 through 5.
Otherwise, click the Next button.
# P0602566 Ver: 2.7
Page 225
PeriView Reference Manual
Server Side Connection for SCCS Server for Real-Time Stats
Use these windows to specify the new or existing CSRSM link server to associate
with the Symposium Call Center Server.
These windows appear only if you are configuring the IVR SCCS Integration
package.
To use an existing link:
a. Choose the link in the Select the Logical Identifier box and click
Modify.
b. Go to step 2.
Or to add a new link to use:
a. Type a name in the Enter a Logical Identifier box and click Add.
b. Go to step 2.
Or if you do not need to make changes to a link or add a new one, click
the Skip button and go to the next task.
Page 226
# P0602566 Ver: 2.7
MPS Control Center
To remove an existing link, choose the link in the Select the Logical Identifier box and
click Delete.
1. Enter information in the window using the following table. For each statistic to retrieve from a port, put a check in the box next to it and enter the
Symposium Server port number.
Field
Explanation
Interval To Date
Agent
Port number where the server sends
cumulative statistics about the agent.
Application
Port number where the server sends
cumulative statistics about the application.
Skill Set
Port number where the server sends
cumulative statistics about the skillset.
Moving Window
Agent
Port number where the server sends statistics
about the agent over the period set in
Symposium.
Application
Port number where the server sends statistics
about the application over the period set in
Symposium.
Skill Set
Port number where the server sends statistics
about the skillset over the period set in
Symposium.
Server Site IP Address
# P0602566 Ver: 2.7
The IP address of the SCCS server.
Page 227
PeriView Reference Manual
Server Site Port
The SCCS server port that receives statistics.
Multicast Host IP
The IP address of the multicast group.
Site Name
The PBX M1 machine name.
Remote ORB
The CORBA lookup application to use, either
Orbix or Visibroker.
2. Click Save to keep your changes.
3. If you need to enter another CSRSM link server, repeat steps 1 through 3.
Otherwise, click the Next button.
SCCS Server Connection to Send Data Only
Use these windows to specify the new or existing TAPI link server to associate with
the Symposium Call Center Server.
These windows appear if you are configuring the IVR SCCS Integration package.
Page 228
# P0602566 Ver: 2.7
MPS Control Center
1. To use an existing link:
a. Choose the link in the Select the Logical Identifier box and click
Modify.
b. Go to step 2.
Or to add a new link to use:
a. Type a name in the Enter a Logical Identifier box and click Add.
b. Go to step 2.
Or if you do not need to make changes to a link or add a new one, click
the Skip button and go to the next task.
To remove an existing link, choose the link in the Select the Logical
Identifier box and click Delete.
2. Enter information in the fields using the following table.
# P0602566 Ver: 2.7
Field
Explanation
TAPISCCS Server IP
Address
Name of TAPI link server running on the socket.
Port Number
The TAPI link server connection port.
Page 229
PeriView Reference Manual
3. Click the Advanced... button.
4. Enter information in the window using the following table, then click the
Save button.
Field
Explanation
Poll Interval
Number of seconds between polls (10-120).
Request to
Timeout
Number of seconds before the request times out (10300).
Send Call Data
Yes sends both the calldata key and calldata value to the
TAPI server. No sends only the calldata value to the TAPI
server.
Call Data
Separator
The character to use to separate call data key when
sending data to the TAPI server. If you don’t want to
separate call data with a delimiter, use 0 (zero).
5. Click the Save button again.
6. If you need to enter another TAPI link server, repeat steps 1 through 5.
Otherwise, click the Next button.
Page 230
# P0602566 Ver: 2.7
MPS Control Center
TAPI Server Connection to Symposium Microsoft TAPI server
Use these windows to specify the new or existing Symposium Microsoft TAPI link
server to associate with the TAPI Server.
These windows appear if you are configuring the TAPI Integration.
# P0602566 Ver: 2.7
Page 231
PeriView Reference Manual
1. To use an existing link:
a. Choose the link in the Select the Logical Identifier box and click
Modify.
b. Go to step 2.
Or to add a new link to use:
a. Type a name in the Enter a Logical Identifier box and click Add.
b. Go to step 2.
Or if you do not need to make changes to a link or add a new one, click
the Skip button and go to the next task.
To remove an existing link, choose the link in the Select the Logical
Identifier box and click Delete.
2. Enter information in the window using the following table.
Page 232
Field
Explanation
TAPI Server IP
Address
The host name of the telephony link server running on the
socket.
Port Number
The listening port of the TAPI server.
# P0602566 Ver: 2.7
MPS Control Center
3. Click Advanced...
4. Enter information in the window using the following table, the click Save.
Field
Explanation
Poll Interval
Number of seconds between polls (10-120)
Request to
Timeout
Number of seconds before the request times out (10-300)
Send Call Data
Yes sends both the calldata key and calldata value to the
TAPI server. No sends only the calldata value to the TAPI
server.
Call Data
Separator
The character to use to separate call data key when
sending data to the TAPI server. If you don’t want to
separate call data with a delimiter, use 0 (zero).
5. Click Save again.
6. If you need to enter another Symposium Microsoft TAPI link server,
repeat steps 1 through 5. Otherwise, click the Next button.
# P0602566 Ver: 2.7
Page 233
PeriView Reference Manual
CTI Connection to the IVR
Use these window to add or modify connections from CTI to the IVR.
These windows always appear, since they are used to configure the required base
package.
1. In the Configure Internal Host Interface window, click the Next button.
Page 234
# P0602566 Ver: 2.7
MPS Control Center
2. To use an existing IVR:
a. Choose the link in the Select the Existing IVR box and click Modify.
b. Go to step 2.
Or to add a new IVR to use:
a. In the IVR Hostname box, type the name of the provider application
used when communication is initiated.
b. In the IVR Number box, type the number that identifies this IVR.
c. Click Add.
d. Go to step 2.
Or if you do not need to make changes to an IVR or add a new one, click
the Skip button and go to the next task.
To remove an existing link, choose the IVR in the Select an Existing IVR
box and click Delete.
3. Choose the IVR in the IVR drop-down box.
# P0602566 Ver: 2.7
Page 235
PeriView Reference Manual
4. To add a device, enter the following information in the window and click
Add.
Field/Button
Explanation
No. of Records
The number of devices that will be entered into the
table.
Start Line No.
The starting phone line number.
Start Device No.
The starting device number.
Device Type
Sets device type for the registered device.
You can also quickly add or change information by typing directly in the
grid in the Existing Mappings area.
5. To delete a device, enter the following information in the window and
click Delete.
Field/Button
Explanation
No. of Records
The number of devices that will be removed from the
table.
Start Line No.
The starting phone line number.
Start Device No.
The starting device number.
Device Type
Sets device type for the registered device.
You can also quickly remove records by clicking the record in the grid
and clicking Delete.
6. To add another IVR, click the Add IVR button and repeat steps 2 and 3.
Otherwise, click the Save or Finish button.
Page 236
# P0602566 Ver: 2.7
MPS Control Center
Real-Time Agent Stats Connection to the IVR
Use these windows to add or modify connections from CSRSM to the IVR.
These windows will appear if you are configuring the IVR SCCS Integration package.
# P0602566 Ver: 2.7
Page 237
PeriView Reference Manual
1. To use an existing IVR:
a. Choose the link in the Select the Existing IVR box and click Modify.
b. Go to step 2.
Or to add a new IVR to use:
a. In the IVR Hostname box, type the name of the provider application
used when communication is initiated.
b. In the IVR Number box, type the number that identifies this IVR.
c. Click Add.
d. Go to step 2.
Or if you do not need to make changes to an IVR or add a new one, click
the Skip button and go to the next task.
To remove an existing link, choose the IVR in the Select an Existing
IVR box and click Delete.
2. Choose the IVR in the IVR drop-down box.
Page 238
# P0602566 Ver: 2.7
MPS Control Center
3. To add a record, enter the following information in the window and click
Add.
Field/Button
Explanation
Device Name
The name for the device.
Device Type
The device type for the registered device.
You can also quickly add or change information by typing directly in the
grid in the Existing Mappings area.
4. To delete a record, enter the following information in the window and
click Delete.
Field/Button
Explanation
Device Name
The name of the device to remove.
Device Type
The device type to remove.
You can also quickly remove records by clicking the record in the grid
and clicking Delete.
5. To add another IVR, click the Add IVR button and repeat steps 2 and 3.
Otherwise, click the Save button.
# P0602566 Ver: 2.7
Page 239
PeriView Reference Manual
TAPI SCCS Connection to the IVR
Use these windows to add or modify connections from CSTAPI to the IVR.
These windows appear if you are configuring the IVR SCCS Integration package.
Page 240
# P0602566 Ver: 2.7
MPS Control Center
1. To use an existing IVR:
a. Choose the link in the Select the Existing IVR box and click Modify.
b. Go to step 2.
Or to add a new IVR to use:
a. In the IVR Hostname box, type the name of the provider application
used when communication is initiated.
b. In the IVR Number box, type the number that identifies this IVR.
c. Click Add.
d. Go to step 2.
Or if you do not need to make changes to an IVR or add a new one, click
the Skip button and go to the next task.
To remove an existing link, choose the IVR in the Select an Existing IVR
box and click Delete.
2. Choose the IVR in the IVR drop-down box.
# P0602566 Ver: 2.7
Page 241
PeriView Reference Manual
3. To add a device, enter the following information in the window and click
Add.
Field/Button
Explanation
No. of Records
The number of devices that will be entered into the
table.
Start Line No.
The starting phone line number.
Start Device No.
The starting device number.
Device Type
Sets device type for the registered device.
You can also quickly add or change information by typing directly in the
grid in the Existing Mappings area.
4. To delete a device, enter the following information in the window and
click Delete.
Field/Button
Explanation
No. of Records
The number of devices that will be removed from the
table.
Start Line No.
The starting phone line number.
Start Device No.
The starting device number.
Device Type
Sets device type for the registered device.
You can also quickly remove records by clicking the record in the grid
and clicking Delete.
5. To add another IVR, click the Add IVR button and repeat steps 2 and 3.
Otherwise, click the Save or Finish button.
Page 242
# P0602566 Ver: 2.7
MPS Control Center
TAPI Connection to the IVR
Use this window to add or modify connections from CSTAPI to the IVR.
These windows appear if you are configuring the TAPI Integration.
1. To use an existing IVR:
a. Choose the link in the Select the Existing IVR box and click Modify.
b. Go to step 2.
Or to add a new IVR to use:
a. In the IVR Hostname box, type the name of the provider application
used when communication is initiated.
b. In the IVR Number box, type the number that identifies this IVR.
c. Click Add.
d. Go to step 2.
# P0602566 Ver: 2.7
Page 243
PeriView Reference Manual
Or to remove an existing link, choose the link in the Select the Logical
Identifier box and click Delete.
2. Choose the IVR in the IVR drop-down box.
3. To add a device, enter the following information in the window and click
Add.
Field/Button
Explanation
No. of Records
The number of devices that will be entered into the
table.
Start Line No.
The starting phone line number.
Start Device No.
The starting device number.
Device Type
Sets device type for the registered device.
You can also quickly add or change information by typing directly in the
grid in the Existing Mappings area.
4. To delete a device, enter the following information in the window and
click Delete.
Page 244
Field/Button
Explanation
No. of Records
The number of devices that will be removed from the
table.
Start Line No.
The starting phone line number.
Start Device No.
The starting device number.
Device Type
Sets device type for the registered device.
# P0602566 Ver: 2.7
MPS Control Center
You can also quickly remove records by clicking the record in the grid
and clicking Delete.
5. To add another IVR, click the Add IVR button and repeat steps 2 and 3.
Otherwise, click the Save button.
# P0602566 Ver: 2.7
Page 245
PeriView Reference Manual
This page has been intentionally left blank.
Page 246
# P0602566 Ver: 2.7
Alarm Viewer
This chapter covers:
1. Introduction to the Alarm
Viewer
2. Working in the Alarm Viewer
3. Source of Alarm Information
4. Alarm Viewer Window
5. View Live Alarms
6. Filter Alarms
7. Creating a Filter
8. Saving a Filter
PeriView Reference Manual
Introduction to the Alarm Viewer
Use the Alarm Viewer to view live and logged alarms. Alarms are predefined
messages that either report a problem or display specific information about a situation.
Alarm text messages display, as live alarms, in the Alarm Viewer window. These
messages come from the alarm daemon (alarmd) that execute on the node to which
the viewer is connected (one alarmd per node).
Logged alarms are messages that have been recorded in a file (default log file).
The Alarm Viewer tool displays live alarms and the system generated default alarm
log files. You can apply filters to control the actual alarms that display in the viewer
windows.
You can launch multiple viewers simultaneously. Alarm Viewer windows function
independently of one another and provide for an array of separate viewing situations
across the network. Each viewer can display either live alarms or alarm log files
within an individually customized window environment.
Alarm messages are categorized as system alarms and user defined alarms. System
alarms are predefined into numerically coded, unique conditions that have been
assigned a severity level and stored in an alarm database. The category of user defined
alarms contain site specific messages which you can create in compliance with a
specific format and add to the alarm database.
Each alarm database is node-specific and is managed by the Alarm Manager utility
(alm), which is accessible directly from the VSH tool. Each node’s alarm database
resides in the following locations.
Solaris: $MPSHOME/common/etc
Windows 2000:%MPSHOME%\common\etc
A node’s alarm database should include all system alarms and all user-defined
application alarms, which are specific to the node and to all applications assigned to
Page 248
# P0602566 Ver: 2.7
Alarm Viewer
process at the node.
There is one alarm daemon executing for each node. Each alarm daemon writes
information to component-specific alarm log files. For example, alarms for MPS 107
would be written to mps107’s alarm log file. For additional information about alarm
log files, see Source of Alarm Information on page 251.
Alarm Viewer windows continue to track activity, even while iconified. The iconified
viewer alerts you to ongoing activity by displaying a flashing movement and by
emitting a beeping (ringing) sound (if so configured). Further, the number of beeps (or
rings) and the color of the alarm icon indicate the severity group of the alarm(s) being
generated.
Working with an Alarm Filter in the Alarm Viewer
When you launch an Alarm Viewer, you can apply an alarm filter.
There are two ways to apply an alarm filter:
- Implicitly: through the selections of TopologyTreeNode (Node, Component, or
Process);
- Explicitly: define an alarm filter with Alarm Filter plug-in.
• Define a filter with Alarm
Filter plug-in:
Use the Alarm Filter to define
an alarm filter for Alarm
Viewer.
You can apply an alarm filter with Alarm Viewer, so that, only the alarms passing
the filter are shown in Alarm Viewer. Select the Alarm Filter button from the
toolbar to define an alarm filter.
Alternately, you can load a filter that is previously saved and then use it.
For additional information about filtering alarms, see Filter Alarms on page 258.
•
Select Alarm Log Files:
Use the Choose Log button in the Alarm Filter window to
select the Alarm Log files, which are to be viewed.
You must select the specific alarm log files that you want to view before they will
# P0602566 Ver: 2.7
Page 249
PeriView Reference Manual
display in the view window.
•
View Alarms:
To view the alarm log files,
use either of the following
options:
Page 250
•
Select the menu item
Log Viewer from the
Alarm Viewer menu.
•
Click the Choose Log button in the Log File section in the Alarm Filter.
•
When a log file is selected using one of the options mentioned above, the log
data appears in a separate window. The Alarm Viewer presents only the live
alarms, however, the stored alarm log is not presented in the Alarm Viewer
GUI.
•
Default alarm log files in alarm filter are displayed in the order in which they
are selected in the Logged Alarms Filter.
# P0602566 Ver: 2.7
Alarm Viewer
Source of Alarm Information
The Alarm Viewer receives alarm text messages from alarm daemons (alarmd) that
execute on nodes to which the Viewer is currently connected. Alarm daemons are
node-specific. A single alarm daemon collects alarm information for all alarms
generated on a node.
This information is then written to component-specific default alarm log files for the
components that reside on the node. For additional information about alarm log files,
see Default Alarm Log Files on page 251.
Alarm definitions are stored in the alarm database, which is node-specific and should
contain alarms for all components configured for the node. Each node’s alarm
database resides in the following locations.
Solaris: $MPSHOME/common/etc
Windows 2000:%MPSHOME%\common\etc
Live alarms display as they are received from alarm daemons (alarmd). Logged
alarms display from the file in which they have been recorded.
The Alarm Viewer can display Live Alarms and the default Alarm Log Files. While
live alarms display as they are received, you must select alarm log files for viewing
before you can view them.
Use the View menu button to select the type of alarm log files to view. When logged
alarms display, the log file path name is identified with the title of the Alarm Log File
Viewer window.
Live Alarms
Alarm text messages display as live alarms in the Alarm Viewer window, as they are
received from the node-specific alarm daemons (alarmd) executing on the nodes to
which the Viewer is connected.
Alarm Viewer can apply with an alarm filter so, only the live alarms that pass the filter
will show in Alarm Viewer.
The information that is recorded in alarm log files is subject to the live alarm filtering
properties that were in use during logging. You can view these files in the Alarm Log
File Viewer window.
For additional information, see View Live Alarms on page 255.
Default Alarm Log Files
A component-specific default alarm log file is automatically created by each
component as part of the initial boot-up process. This file contains a continuous record
of all alarms, for that component, that were collected by the node’s alarm daemon
(alarmd).
Alarms on a node log by alarmd, based on the severities of these alarms. There are
three categories of alarm severities: info, warning, and alarm. Componentspecific default alarm log files are named in the following format:
Syntax:
info.<component_type>.<component_number>.log
# P0602566 Ver: 2.7
Page 251
PeriView Reference Manual
warning.<component_type>.<component_number>.log
alarm.<component_type>.<component_number>.log
Example:
Node is9507 contains two components: common and mps107.
•
Alarms specific to the common component are written to
alarm.common.0.log.
•
Alarms specific to the mps107 component are written to
alarm.mps.107.log.
Alarm log files reside in the following locations:
Solaris: $MPSHOME/common/log
Windows 2000:%MPSHOME%\common\log
Initially, when the default alarm log file reaches its preconfigured file size limit, a
default alarm log backup file is created to provide extended storage for alarm
information. There is only one backup file for each component-specific log file. When
alarm information is written to a backup file that contains alarms, the alarm
information will be purged to make room for the more current alarm information. You
can choose to view backup default alarm log files along with the default log files that
you select.
Component-specific alarm log backup files are named in the format:
Syntax:
alarm.<component_type>.<component_number>.log.bak
Example:
Page 252
•
mps107 alarm log file: alarm.mps.107.log
•
mps107 backup alarm log file: alarm.mps.107.log.bak
# P0602566 Ver: 2.7
Alarm Viewer
Alarm Viewer Window
Alarm information displays in the Alarm Viewer window.
Alarm Information
Alarm information includes the name of the process generating the alarm; the Alarm
Number (code) and its Severity Level; Alarm Message Text; the Date and Time of
alarm generation; and, when applicable the Component Identifier, Host Name and
Phone Line Number. The type of information that actually displays in this window is
controlled in the Alarm Filter.
Data Format
Live Alarms
The Alarm Viewer window displays live alarm information in column and row
format. Alarm message text displays directly below the alarm’s data line. When a data
element is not relevant to the alarm being defined, the system displays undefined as a
column place holder. The severity is classified as: information (info), warning and
alarm. The severity levels are assigned with the numbers from one (1) to nine (9).
•
Alarms with severity levels from one to three belong to the information (info)
category.
•
Alarms with severity levels from four to six belong to the warning category.
•
Alarms with severity levels from seven to nine belong to the alarm category.
Alarm Log Files
The Alarm Viewer window displays alarm information from default alarm log files in
the format in which it exists in the file. This data format can not be modified.
Source of Alarm Information
Alarm information originates as either live or logged alarms. Live alarms display as
# P0602566 Ver: 2.7
Page 253
PeriView Reference Manual
they are generated in the Alarm Viewer window. Logged alarms are previously
recorded alarm information, which is saved to a system default file that you can view
later.
Alarm Message Length
The Message Length indicates the number of alarm messages that PeriView keeps for
each alarm. The default value of the Message Length is 10. However, it can range
from 5 to 100 (the valid values are displayed in the combo-box.) Whenever, there is
any change in the message length, it applies to all the alarms in the viewer. The
Message Length also affects the number of alarm messages you can see when you
click the ">" button on the left side of an alarm. At any point in time, the user can view
at the most the number of alarm messages defined by the Message Length.
Page 254
# P0602566 Ver: 2.7
Alarm Viewer
View Live Alarms
When an alarm is generated on the node, the associated PeriView Data Provider
receives this alarm from alarm daemon (alarmd). However, the PeriView Data
Provider will cache the alarms received from alarmd and send alarm updates to
AlarmViewer at a configurable time interval (default is 5 seconds). If an alarm filter is
applied, the associated PeriView Data Provider sends only those alarms that pass the
filter.
Alarm information includes the name of the process generating the alarm; the Alarm
Number (code) and its Severity Level; Alarm Message Text; the Date and Time of
alarm generation; and, when applicable the Component Identifier, Host Name and
Phone Line Number (when applicable).
When a data element is not relevant to the alarm being defined, the system displays
undefined in its place and serves as a column place holder to enhance readability.
To view Live Alarms:
Live alarms display in the Alarm Viewer window at the rate by which they are
received. Alarms begin to display as soon as the Alarm Viewer window receives
alarm data.
You can filter out unwanted alarms by applying an appropriate alarm filter (either
defined using Alarm Filter or retrieved from a previously saved filter file.) For
information about the Live Alarm Filter, see Filter Alarms on page 258.
You can only display alarm information; you can not edit it. For additional
information, see Alarm Viewer Window on page 253.
•
When the connection to the component monitored by the Alarm Viewer is
lost, message text displayed in the lower left side in the Viewer and an icon
indicating the disconnection is displayed in the right side of the viewer.
The Alarm Viewer keeps trying to reestablish the connection to the monitored
component. Once connection to the component is restored, message text displays
in the Viewer and message area, and the flow of alarms resume in the Viewer
window.
During system and component shutdown/startup, some alarms may not be displayed
in the Alarm Viewer. This results from the lost connection between the
system/component alarm daemon and the PeriView Data Provider. To monitor alarms
during a system shutdown/startup, start a command line shell on the system and use
the alarm command line utility.
# P0602566 Ver: 2.7
Page 255
PeriView Reference Manual
View Default Alarm Log Files
All alarms that are generated from a node are collected by the node’s alarm daemon
and recorded in component-specific default alarm log files. Component-specific
default alarm log files are automatically created during the initial system boot-up
process.
When these default alarm log files, initially, reach their preconfigured file size limit,
default alarm log backup files are created to provide extended storage for alarm
information.
Each time a default alarm log file reaches its file size limit, its existing backup file
information is overwritten with the newer information. You can select to filter and
view these backup default alarm log files.
Each component is limited to a single default alarm log file and a single backup file.
For additional information about default alarm log files, see Default Alarm Log Files
on page 251.
Information from default alarm log files display in the Alarm Viewer window. The
data displays in the same format as it exists in the actual file and the format can not be
modified.
Alarm information includes the day, month, date, and time the alarm is generated; the
process generating the alarm; the Alarm Number; Severity Level; and message text.
When applicable, it will also include the Component Identifier, Phone Line Number,
and Host Number.
You can only display alarm information; you can not edit it. For additional
information, see Alarm Viewer Window on page 253.
Although all alarms generated by a component are recorded in the default alarm log
file, you can apply an alarm filter to an alarm log file, see Filtering Alarm Log Files
on page 265.
The default alarm log file’s logging process is not subject to filters. Filters apply only
to the display of information contained in the file, not to the information that is
recorded in the file.
You can define an alarm filter directly from Alarm Filter or retrieve the filter from a
previously saved filter file. For information about the Alarm Filter, see Filter Alarms
on page 258.
Page 256
# P0602566 Ver: 2.7
Alarm Viewer
To View Alarm Log Files:
1. To filter the alarm log output, select a node from the navigation pane.
Only alarms from that node will display in the alarm log output. To display all alarms in a log file, select the default domain (Avaya) in the navigation pane.
2. Start the Alarm Viewer.
3. From the main menu, select Alarm Viewer > Log Viewer
4. Select the node on which the alarm log file resides.
5. Select the desired node/component alarm log file (alarm log files are typically in /$MPSHOME/common/log for Solaris or
%MPSHOME%\common\etc for Windows).
# P0602566 Ver: 2.7
Page 257
PeriView Reference Manual
Filter Alarms
Use filters to control the alarms that display in the viewer window. Although you can
view all live and logged alarms, you can specify the alarm information that actually
displays in viewer windows by defining filtering properties (e.g. display alarms only
from the specified nodes or components etc).
You can apply filters to both live and logged alarms. You define filtering properties at
the Alarm Filter menu button.
You can also save custom-made alarm filters for later use.
Page 258
# P0602566 Ver: 2.7
Alarm Viewer
Creating a Filter
There are two ways to define an alarm filter: Simple Filter or Advanced Filter. Simple
filter is designed for most users’ needs and can filter alarms by general alarm
properties such as component, process, severity, and alarm number. Advanced Filter
has more filtering parameters such as alarm frequency (number of times generated
within a set time period), host number, and node. Advanced Filter also allows you to
perform an action (a command which can be expressed on a single command line)
when a specified alarm (condition) occurs.
Simple Filter
To create a simple filter, select the desired filtering criteria and click the Add to Filter
button. The filter statement appears in the Filter Set section of the window:
You can add multiple filter statements to create a filter set. To delete the most recent
filter statement from the filter set, click the
button. Click the
button to clear
all statements from the filter set.
Simple Filter Parameters
Hold down the Control key while clicking to select multiple items from a display list.
Simple Filter Parameters Sheet 1 of 2
Processes
Filter by the process which generated the alarm. Some systems may use
user-defined alarms which get generated by applications. If your system does
this, put the application name into the text box and click on the “Add to List”
button.
To filter by processes, select the processes from the list. If you have other
processes (such as applications) which generate alarms and they are not on
the list, add them to list by entering the process name in the text box and
clicking on the Add to List button.
Components
# P0602566 Ver: 2.7
Filter by the component(s) from which the alarm was generated.
Page 259
PeriView Reference Manual
Simple Filter Parameters Sheet 2 of 2
Severity
Class
Alarm
Numbers
Filter according to the severity of the alarm.
Info
Messages which typically indicate normal system
functioning (severity levels 7-9)
Warning
Messages which typically indicate unexpected or abnormal
system functioning but do not necessarily mean that the
system cannot function as expected (severity levels 4-6).
Alarm
Messages which typically indicate a serious system failure
that may impact its ability to function properly (severity
levels 1-3).
Filter according to alarm number. Each alarm is identified with a unique alarm
number. (The range for system alarms is 00000-89999. The range for
application alarms is 90000-99999.)
If you want to filter alarms by specific alarm(s), you must add the alarm(s) to
the scrolling list, then select them. Only selected alarms will display in the
viewer window (when they are generated).
Add alarms to the list by entering the alarm in the text box and clicking on the
Add to List button. Select the alarm(s) in the list.
Page 260
Message
Contains
Filter according to the text displayed in the alarm message.
Phone Line
Numbers
Filter according to the line numbers on which the alarm condition occurred.
Specify this as a range of phone lines.
# P0602566 Ver: 2.7
Alarm Viewer
Advanced Filter
Advanced filter fields with picklists allow you to select only one element at a time.
After selecting the element, click on the Add to Selection
button. If you want to
add more elements to the filter statement, select another element from the picklist and
click the Add to Selection button again.
After finishing with a filter parameter, click on
to put it into the Conditions area.
From the Conditions area, you can make the filter statement part of the filter set (click
on
), negate the statement (click on
), or remove the last Filter statement from
the Condition (click on ).
Selecting the
button includes the values selected from the drop-down
menu for that parameter, while selecting the
button excludes the selected
values for that parameter.
Advanced Filter Parameters
Advanced filter properties contain all features available in the Simple Filter and adds
the following:
Advanced Filter Parameters Sheet 1 of 2
# P0602566 Ver: 2.7
Alarm
Producer
(Source)
This parameter is same as “Processes” in Simple Filter.
See “Processes” on page 259.
Node
Filter according to the node on which the alarm condition occurred.
Component
Filter according to Component Type and/or Component Number from which
the alarm was generated.
Host
Filter according to the external host to which the alarm applies. This is used
only when filtering for alarm messages that are specific to external host
communications.
Frequency
Filter according to how often an alarm occurs in a set period of time. The
alarm is not shown in the viewer until it exceeds the set threshold.
Time Since
Previous
Filter according to when the last time the same alarm occurred. The alarm is
not shown in the viewer until it meets the specified criteria.
Alarm
Counts
Filter according to how often an alarm occurs. Unlike the frequency setting,
this setting has no time limit for which the number of alarms must occur to
satisfy the condition.
> >=
Display every occurrence of an alarm starting at (or after)
the specified threshold.
< <=
Display every occurrence of an alarm up until the specified
threshold.
Every
Display the every nth alarm message, where n is the
specified threshold. For example, if n is 100, only the every
100th occurrence of this alarm is displayed in the viewer.
Page 261
PeriView Reference Manual
Advanced Filter Parameters Sheet 2 of 2
Action on
Success
Action on
Failure
Perform an action if a generated alarm satisfies all of the previously defined
filter criteria.
true
Generate a “true” event (recognized by the alarm filter)
false
Generate a “false” event (recognized by the alarm filter)
print()
Print the alarm to the standard output on the system where
the alarm occurs.
log()
Log the alarm in a specified log file. You will be asked to
enter the log file name. The log file must exist on the system
where the alarm occurs and must be writable.
email()
Send an email. You will be asked to enter an email address
and subject line.
consolidate()
Consolidate the alarms. You will be asked to enter the text
for the alarm consolidation.
discard()
Discard the alarm when it occurs.
Perform an action if a generated alarm does not satisfy all of the previously
defined filter criteria. The actions are the same as those listed for Action on
Success
The default settings for Action On Success (true) and Action On Failure (false) will
pass alarms that satisfy the specified filter criteria, and will not pass alarms that do not
satisfy the specified filter criteria. Settings other than these defaults can result in
different behavior.
After creating a filter, click on the filter window’s Start Alarm Viewer button to start
an Alarm Viewer using the filter settings. The Filter appears in the Alarm Viewer’s
title bar:
The alarm filter statement, as created in the Alarm Filter
window, appears in the title bar of the Alarm Viewer (when
the Alarm Viewer is launched from the Alarm Filter window).
Page 262
# P0602566 Ver: 2.7
Alarm Viewer
# P0602566 Ver: 2.7
Page 263
PeriView Reference Manual
Saving a Filter
To save a filter file:
1. Verify that the filter performs as expected.
2. Select the node on which you want to save the filter
3. Click on Save Filter.
4. Select the directory in which to store the filter and enter a filter filename.
Click on Save.
Page 264
# P0602566 Ver: 2.7
Alarm Viewer
Filtering Alarm Log Files
You can use alarm filtering to filter alarm log viewing. The Alarm Filter only changes
what is displayed in the Alarm Viewer. It does not change the contents of the existing
alarm log files.
To view filtered alarm log files:
1. Create the filter (or load it from somewhere else).
2. Select the node which has the log file you wish to view (and filter)
3. Load the alarm log file
This Feature is not available now.
# P0602566 Ver: 2.7
Page 265
PeriView Reference Manual
Page 266
# P0602566 Ver: 2.7
Configuring Data
Provider for PeriView
This chapter covers:
1. Introduction
PeriView Reference Manual
Introduction
The MPS Manager Data Provider (MMDP) collects information from the systems in
the network and consolidates it for being used by PeriView. The Data Providers for
PeriView are configured using PeriView’s MMDP Configuration utility. For detailed
information, refer the “MMDP Configuration” on page 181.
The MMDP Configurator allows you to configure every Data Provider across an
entire corporation including multiple sites. You can use a browser to connect to any
MMDP, that is acting as a Consolidator. (A consolidator can talk to other lower
service MMDPs in the hierarchy.)
In PeriView, if you are connected to a consolidator MMDP, you can import or add
another consolidator. In this case, when you save the configuration for the first
consolidator MMDP, both the consolidators (and all the child service MMDPs) will
get each MMDP’s configuration data. Each MMDP in a system recognizes the
configuration of all the other MMDPs unless the system is down.
The MMDP has a built-in replication feature which allows it to replicate information
across the consolidator MMDPs anytime a change is made. If a connection between
two consolidators is broken, the respective consolidator MMDPs try to reconnect to
one another in every 15 seconds. On reconnection, the new configuration is
transmitted.
The Data Provider should not be stopped in any circumstances; the MMDP is capable
of reconfiguring itself dynamically based on the new configuration including opening
new connections to service MMDPs. An MMDP can handle changing from a
consolidator to a service and back to consolidator without a restart.
For Solaris,
Start and stop the S95avaya.pdp service before the changes take effect. Issue the
following commands to stop and start the S95avaya.pdp service.
etc/rc3d/S95avaya.pdp stop
etc/rc3d/S95avaya.pdp start
For Windows,
Go to Start -> Programs -> Administrative Tools -> Service to
start or stop the Avaya PeriView Data Provider service.
Page 268
# P0602566 Ver: 2.7
Netscape for Solaris
Installation
This chapter covers:
1. Introduction
2. Installing Netscape browser
on a Solaris workstation
3. Installing Java Plug-in
PeriView Reference Manual
Introduction
You can access PeriView from any workstation on the MPS network provided the
workstation has an internet browser and the Java plugin installed. Netscape
Communicator is installed by default in later versions of Solaris. However, if you
want to use a Solaris workstation which does not have a browser installed, or your
Solaris browser does not have the Java plugin installed, use the following procedures.
Installing Netscape 4.7X for Solaris/SPARC
1. Download the netscape 4.7/X package from:
http://wp.netscape.com/download/archive.html
2. Unpack the distribution file using the following command:
gzip -dc <filename>.tar.gz | tar -xvf 3. Start the installation
./ns-install
4. Add the Netscape binary path (typically /opt/netscape) to your
$PATH environment variable.
Installing Java Plug-in
1. Log in as root (superuser) and download the Java plugin software (or the
entire Java Runtime Environment) from:
http://java.sun.com/products/archive
2. Change directory to /opt
cd /opt
3. Run the install script:
./j2re-1_4_1-solaris-sparc.sh (for JRE)
4. Verify that the plugin/JRE install directory (and contents) exists.
5. Add the following to your environment:
setenv NPX_PLUGIN_PATH
/opt/installed_jre_dir/plugin/sparc/ns4
Test the browser and/or plugin installation by starting the browser and accessing the
PeriView page:
http://<PeriView_nodename>/periview/PeriView.html
Page 270
# P0602566 Ver: 2.7
Index
PeriView Reference Manual
A
Activity Monitor
Host status 147, 149, 167, 173
COMMGR 174
VTs 168, 173
line states 150
linked application activity 159–??
graph display 159
graph properties 163
PLM line state 150
PLM status graph 148
graph types 154
Span status
information 168
VPS Host status 147, 149
administrative phone lines 119
alarm
filters 258
alarm log files
default 251
alarm man pages 248
Alarm Viewer 247
Alarm Viewer window 253
default alarm log file
filter 258
source 251
view 256
filter alarms 258–??
historical alarm log files
filter 258
live alarms
filter 258
source 251
view 255
Log File Viewer window 253
source of alarm information 251
default alarm log file 251
historical alarm log files 253
live alarms 251
view alarms 253
default alarm log file 256–??
live alarms 255–??
application
critical application 160, 165
linked application Activity Monitor 159
Application Manager 90, 124, 127
Assign/(Re)Start Lines tool
application configuration 125
applications information 112
Page 272
Assign/(Re)Start Lines progress 125
launch 124
locations information 110
assign/start order 123, 139
Configure Applications tool
configuration options 70, 73–??
configure application 66
data processing options 74
diagnostics options 97
execution options 84
host communications options 81
overview 65
shared libraries 78
vocabulary options 100
expand & collapse tree 139
file location requirements 120
icons 123, 125, 128
overview 118–??
Terminate/Un-Assign Lines tool ??–133
launch 128
progress 133
terminate 129
termination type 113, 129, 132
types of applications 118
application reference tree object 117
application tree object 117
Applications 174
applications
life cycle 139
location requirements 120
terminate 129
terminate & un-assign 131
types 118
C
call processing phone lines 85, 119
CCT-IVR Intergration 220
COMMGR 174
configuration files
HDX 223
cshdx.cfg 223
IPML
tls.cfg 215, 223
configuration options 73
data processing 74
diagnostic 97
execution 84
host communications 81
shared libraries 78
# P0602566 Ver: 2.7
Index
vocabulary 100
Configure Applications tool
Data Processing Options 74
Diagnostic Options 97
Execution Options 84
Host Communication Options 81
Shared Library Options 78
Vocabulary Options 100
Consolidator Data Provider 183
conventions
manual xii
critical application 160, 165
D
data processing configuration options 74
Data Replication in MMDP 194
diagnostic configuration options 97
display 85
Activity Monitor 159
shared libraries 79
live alarms 251
logged alarms
default 251
logical phone lines 85, 119
M
man pages
alarms 248
manual
how to use x
intended audience for x
organization of xi
scope of x
MMDP Configuration 181, 197
N
E
network
application management 118
execution configuration options 84
expand tree
Application Manager 115
P
F
filter alarms 258
G
graphs see Activity Monitor
group tree object 116
H
HDX
configuration files 223
Host
ID value 223
host communications configuration options 81
Host status 173
Activity Monitor 174
I
IPML Service Provider 220
L
linked applications
# P0602566 Ver: 2.7
phone line activity states 150
phone lines
administrative 85, 119
call processing 85, 119
line type checking 119
logical 85, 119
physical 85, 119
type 85, 119
physical phone lines 119
PLM
line status graphs 152
Profiles 15
R
remove file when un-assign 131
S
Service Data Provider 186
shared libraries
configuration options 78
linked applications 79
Span status 146
information 168
standby application 88
Page 273
PeriView Reference Manual
states of phone line activity 150
states, tree objects 116
T
termination type 113, 129, 132
tree object information
Application Manager 116
tree object states 116
V
Vocabulary Options 100
VPS Host status
COMMGR 174
VTs 168, 173, 174
VT (Virtual Terminal) 174
W
Web 88
Page 274
# P0602566 Ver: 2.7