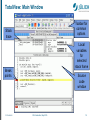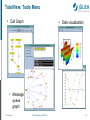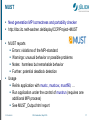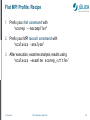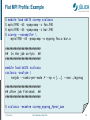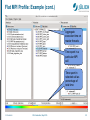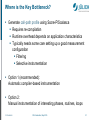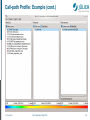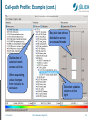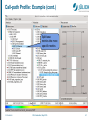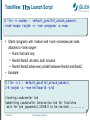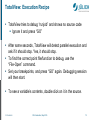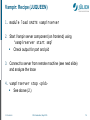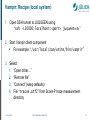
1
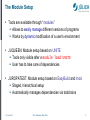
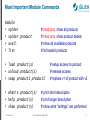
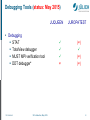
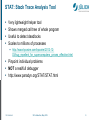
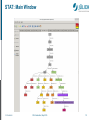
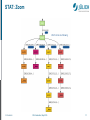
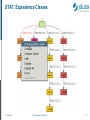
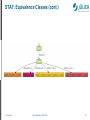
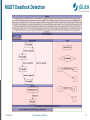
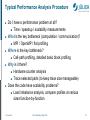
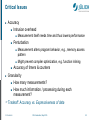
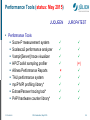
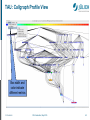
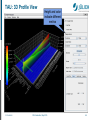
Mitglied der Helmholtz-Gemeinschaft HPC Software – Compiler and Tools May 2015 | Michael Knobloch Outline • Local module setup • Compilers* • Libraries* Debuggers: Make it work, make it right, make it fast. • STAT • TotalView • MUST Kent Beck Performance Tools: • • • • • • M. Knobloch SC Introduction, May 2015 Score-P Scalasca Vampir HPCToolkit Performance Reports TAU 2 Module setup & compiler Mitglied der Helmholtz-Gemeinschaft The Module Setup Tools are available through “modules” Allows to easily manage different versions of programs Works by dynamic modification of a user's environment JUQUEEN: Module setup based on UNITE Tools only visible after a module load UNITE User has to take care of dependencies JUROPATEST: Module setup based on EasyBuild and lmod Staged, hierarchical setup Automatically manages dependencies via toolchains M. Knobloch SC Introduction, May 2015 4 Most Important Module Commands module spider spider product avail list # lmod only: show all products # lmod only: show product details # show all available products # list loaded products load product(s) unload product(s) swap product1 product2 whatis product(s) help product(s) show product(s) M. Knobloch # setup access to product # release access # replace v1 of product with v2 # print short description # print longer description # show what “settings” are performed SC Introduction, May 2015 5 Compiler and MPI libraries JUQUEEN IBM XL C/C++ and Fortran compiler GNU C/C++ and Fortran compiler Clang C/C++ compiler IBM MPI JUROPATEST Intel C/C++ and Fortran compiler GNU C/C++ and Fortran compiler Intel MPI Parastation MPI M. Knobloch SC Introduction, May 2015 6 Debuggers Mitglied der Helmholtz-Gemeinschaft Debugging Tools (status: May 2015) JUQUEEN Debugging STAT TotalView debugger MUST MPI verification tool DDT debugger* M. Knobloch SC Introduction, May 2015 JUROPATEST () () () 8 STAT: Stack Trace Analysis Tool Very lightweight helper tool Shows merged call tree of whole program Useful to detect deadlocks Scales to millions of processes http://www.hpcwire.com/hpcwire/2012-1203/bug_repellent_for_supercomputers_proves_effective.html Pinpoint individual problems NOT a real/full debugger http://www.paradyn.org/STAT/STAT.html M. Knobloch SC Introduction, May 2015 9 STAT: Main Window M. Knobloch SC Introduction, May 2015 10 STAT: Zoom M. Knobloch SC Introduction, May 2015 11 STAT: Equivalence Classes M. Knobloch SC Introduction, May 2015 12 STAT: Equivalence Classes (cont.) M. Knobloch SC Introduction, May 2015 13 Parallel Debugger UNIX Symbolic Debugger for C, C++, F77, F90, PGI HPF, assembler programs “Standard” debugger Special, non-traditional features Multi-process and multi-threaded C++ support (templates, inheritance, inline functions) F90 support (user types, pointers, modules) 1D + 2D Array Data visualization Support for parallel debugging (MPI: automatic attach, message queues, OpenMP, pthreads) Scripting and batch debugging Memory Debugging http://www.roguewave.com NOTE: License limited to 2048 processes (shared between all users) M. Knobloch SC Introduction, May 2015 14 TotalView: Main Window Toolbar for common options Stack trace Local variables for selected stack frame Break points M. Knobloch Source code window SC Introduction, May 2015 15 TotalView: Tools Menu Call Graph Data visualization Message queue graph M. Knobloch SC Introduction, May 2015 16 MUST Next generation MPI correctness and portability checker http://doc.itc.rwth-aachen.de/display/CCP/Project+MUST MUST reports Errors: violations of the MPI-standard Warnings: unusual behavior or possible problems Notes: harmless but remarkable behavior Further: potential deadlock detection Usage Relink application with mustc, mustcxx, mustf90, … Run application under the control of mustrun (requires one additional MPI process) See MUST_Output.html report M. Knobloch SC Introduction, May 2015 17 MUST Datatype Mismatch M. Knobloch SC Introduction, May 2015 18 MUST Deadlock Detection M. Knobloch SC Introduction, May 2015 19 Performance Analysis Tools Mitglied der Helmholtz-Gemeinschaft Typical Performance Analysis Procedure ■ ■ ■ ■ ■ Do I have a performance problem at all? ■ Time / speedup / scalability measurements What is the key bottleneck (computation / communication)? ■ MPI / OpenMP / flat profiling Where is the key bottleneck? ■ Call-path profiling, detailed basic block profiling Why is it there? ■ Hardware counter analysis ■ Trace selected parts (to keep trace size manageable) Does the code have scalability problems? ■ Load imbalance analysis, compare profiles at various sizes function-by-function M. Knobloch SC Introduction, May 2015 21 Remark: No Single Solution is Sufficient! A combination of different methods, tools and techniques is typically needed! ■ Analysis ■ ■ Measurement ■ ■ Statistics, visualization, automatic analysis, data mining, ... Sampling / instrumentation, profiling / tracing, ... Instrumentation ■ M. Knobloch Source code / binary, manual / automatic, ... SC Introduction, May 2015 22 Critical Issues ■ Accuracy ■ Intrusion overhead ■ ■ Measurement itself needs time and thus lowers performance Perturbation ■ ■ Measurement alters program behavior, e.g., memory access pattern Might prevent compiler optimization, e.g. function inlining Accuracy of timers & counters ■ Granularity ■ How many measurements? ■ How much information / processing during each measurement? Tradeoff: Accuracy vs. Expressiveness of data ■ M. Knobloch SC Introduction, May 2015 23 Performance Tools (status: May 2015) JUQUEEN Performance Tools Score-P measurement system Scalasca2 performance analyzer Vampir[Server] trace visualizer HPCToolkit sampling profiler Allinea Performance Reports TAU performance system mpiP MPI profiling library* Extrae/Paraver tracing tool* PAPI hardware counter library* M. Knobloch SC Introduction, May 2015 JUROPATEST () 24 Score-P Community instrumentation and measurement infrastructure Developed by a consortium of performance tool groups Next generation measurement system of Scalasca 2.x Vampir TAU Periscope Common data formats improve tool interoperability http://www.score-p.org M. Knobloch SC Introduction, May 2015 25 Collection of trace-based performance analysis tools Specifically designed for large-scale systems Unique features: Scalable, automated search for event patterns representing inefficient behavior Scalable identification of the critical execution path Delay / root-cause analysis Based on Score-P for instrumentation and measurement Includes convenience / post-processing commands providing added value http://www.scalasca.org M. Knobloch SC Introduction, May 2015 26 What is the Key Bottleneck? Generate flat MPI profile using Score-P/Scalasca (or mpiP) Only requires re-linking Low runtime overhead Provides detailed information on MPI usage How much time is spent in which operation? How often is each operation called? How much data was transferred? Limitations: Computation on non-master threads and outside of MPI_Init/MPI_Finalize scope ignored M. Knobloch SC Introduction, May 2015 27 Flat MPI Profile: Recipe 1. Prefix your link command with “scorep --nocompiler” 2. Prefix your MPI launch command with “scalasca -analyze” 3. After execution, examine analysis results using “scalasca -examine scorep_<title>” M. Knobloch SC Introduction, May 2015 28 Flat MPI Profile: Example % % % % module load UNITE scorep scalasca mpixlf90 -O3 -qsmp=omp -c foo.f90 mpixlf90 -O3 -qsmp=omp -c bar.f90 scorep --nocompiler \ mpixlf90 -O3 –qsmp=omp -o myprog foo.o bar.o ########################## ## In the job script: ## ########################## module load UNITE scalasca scalasca -analyze \ runjob --ranks-per-node P --np n [...] --exe ./myprog ########################## ## After job finished: ## ########################## % scalasca -examine scorep_myprog_Ppnxt_sum M. Knobloch SC Introduction, May 2015 29 Flat MPI Profile: Example (cont.) Aggregate execution time on master threads Time spent in a particular MPI call Time spent in selected call as percentage of total time M. Knobloch SC Introduction, May 2015 30 Where is the Key Bottleneck? Generate call-path profile using Score-P/Scalasca Requires re-compilation Runtime overhead depends on application characteristics Typically needs some care setting up a good measurement configuration Filtering Selective instrumentation Option 1 (recommended): Automatic compiler-based instrumentation Option 2: Manual instrumentation of interesting phases, routines, loops M. Knobloch SC Introduction, May 2015 31 Call-path Profile: Recipe 1. Prefix your compile & link commands with “scorep” 2. Prefix your MPI launch command with “scalasca -analyze” 3. After execution, compare overall runtime with uninstrumented run to determine overhead 4. If overhead is too high 1. Score measurement using “scalasca -examine -s scorep_<title>” 2. Prepare filter file 3. Re-run measurement with filter applied using prefix “scalasca –analyze –f <filter_file>” 5. After execution, examine analysis results using “scalasca -examine scorep_<title>” M. Knobloch SC Introduction, May 2015 32 Call-path Profile: Example % % % % module load UNITE scorep scalasca scorep mpixlf90 -O3 -qsmp=omp -c foo.f90 scorep mpixlf90 -O3 -qsmp=omp -c bar.f90 scorep \ mpixlf90 -O3 –qsmp=omp -o myprog foo.o bar.o ########################## ## In the job script: ## ########################## module load UNITE scalasca scalasca -analyze \ runjob --ranks-per-node P --np n [...] --exe ./myprog M. Knobloch SC Introduction, May 2015 33 Call-path Profile: Example (cont.) % scalasca -examine -s epik_myprog_Ppnxt_sum scorep-score -r ./epik_myprog_Ppnxt_sum/profile.cubex INFO: Score report written to ./scorep_myprog_Ppnxt_sum/scorep.score Estimates trace buffer requirements Allows to identify canditate functions for filtering Computational routines with high visit count and low time-per-visit ratio Region/call-path classification COM MPI (pure MPI library functions) USR COM USR OMP (pure OpenMP functions/regions) USR (user-level source local computation USR OMP MPI USR COM (“combined” USR + OpeMP/MPI) ANY/ALL (aggregate of all region types) M. Knobloch SC Introduction, May 2015 34 Call-path Profile: Example (cont.) % less scorep_myprog_Ppnxt_sum/scorep.score Estimated aggregate size of event trace: 162GB Estimated requirements for largest trace buffer (max_buf): 2758MB Estimated memory requirements (SCOREP_TOTAL_MEMORY): 2822MB (hint: When tracing set SCOREP_TOTAL_MEMORY=2822MB to avoid intermediate flushes or reduce requirements using USR regions filters.) flt type max_buf[B] visits ALL 2,891,417,902 6,662,521,083 USR 2,858,189,854 6,574,882,113 OMP 54,327,600 86,353,920 MPI 676,342 550,010 COM 371,930 735,040 USR 921,918,660 2,110,313,472 USR 921,918,660 2,110,313,472 USR 921,918,660 2,110,313,472 USR 41,071,134 87,475,200 USR 41,071,134 87,475,200 USR 29,194,256 68,892,672 OMP 3,280,320 3,293,184 [...] M. Knobloch time[s] time[%] time/ region visit[us] 36581.51 100.0 5.49 ALL 13618.14 37.2 2.07 USR 22719.78 62.1 263.10 OMP 208.98 0.6 379.96 MPI 34.61 0.1 47.09 COM 3290.11 5914.98 3822.64 358.56 145.42 86.15 15.81 SC Introduction, May 2015 9.0 16.2 10.4 1.0 0.4 0.2 0.0 1.56 2.80 1.81 4.10 1.66 1.25 4.80 matmul_sub binvcrhs matvec_sub lhsinit binvrhs exact_solution !$omp parallel 35 Call-path Profile: Filtering In this example, the 6 most fequently called routines are of type USR These routines contribute around 35% of total time However, much of that is most likely measurement overhead Frequently executed Time-per-visit ratio in the order of a few microseconds Avoid measurements to reduce the overhead List routines to be filtered in simple text file M. Knobloch SC Introduction, May 2015 36 Filtering: Example % cat filter.txt SCOREP_REGION_NAMES_BEGIN EXCLUDE binvcrhs matmul_sub matvec_sub binvrhs lhsinit exact_solution SCOREP_REGION_NAMES_END Score-P filtering files support Wildcards (shell globs) Blacklisting Whitelisting Filtering based on filenames M. Knobloch SC Introduction, May 2015 37 Call-path Profile: Example (cont.) ## To verify effect of filter: % scalasca -examine -s -f filter.txt \ scorep_myprog_Ppnxt_sum ########################## ## In the job script: ## ########################## module load UNITE scalasca scalasca -analyze -f filter.txt \ runjob --ranks-per-node P --np n [...] --exe ./myprog ########################## ## After job finished: ## ########################## % scalasca -examine scorep_myprog_Ppnxt_sum M. Knobloch SC Introduction, May 2015 38 Call-path Profile: Example (cont.) M. Knobloch SC Introduction, May 2015 39 Call-path Profile: Example (cont.) Box plot view shows distribution across processes/threads Distribution of selected metric across call tree When expanding, value changes from inclusive to exclusive M. Knobloch Selection updates columns to the right SC Introduction, May 2015 40 Call-path Profile: Example (cont.) Split base metrics into more specific metrics M. Knobloch SC Introduction, May 2015 41 Score-P: Advanced Features Measurement can be extensively configured via environment variables Check output of “scorep-info config-vars” for details Allows for targeted measurements: Selective recording Phase profiling Parameter-based profiling … Please ask us or see the user manual for details M. Knobloch SC Introduction, May 2015 42 Why is the Bottleneck There? This is highly application dependent! Might require additional measurements Hardware-counter analysis CPU utilization Cache behavior Selective instrumentation Manual/automatic event trace analysis M. Knobloch SC Introduction, May 2015 43 HW Counter Measurements w/ Score-P Score-P supports both PAPI preset and native counters Available counters: papi_avail or papi_native_avail % % % % module load UNITE papi/5.0.1 less $PAPI_ROOT/doc/papi-5.0.1-avail.txt less $PAPI_ROOT/doc/papi-5.0.1-native_avail.txt less $PAPI_ROOT/doc/papi-5.0.1-avail-detail.txt Specify using “SCOREP_METRIC_PAPI” environment variable ########################## ## In the job script: ## ########################## module load UNITE scalasca export SCOREP_METRIC_PAPI=“PAPI_FP_OPS,PAPI_TOT_CYC“ scalasca -analyze -f filter.txt \ runjob --ranks-per-node P --np n [...] --exe ./myprog M. Knobloch SC Introduction, May 2015 44 Automatic Trace Analysis w/ Scalasca Idea: Automatic search for patterns of inefficient behavior Identification of wait states and their root causes Classification of behavior & quantification of significance Scalable identification of the critical execution path Low-level event trace Analysis High-level result Property Call path Location Advantages Guaranteed to cover the entire event trace Quicker than manual/visual trace analysis Helps to identify hot-spots for in-depth manual analysis M. Knobloch SC Introduction, May 2015 45 Trace Generation & Analysis w/ Scalasca Enable trace collection & analysis using “-t” option of “scalasca -analyze”: ########################## ## In the job script: ## ########################## module load UNITE scalasca export SCOREP_TOTAL_MEMORY=120MB # Consult score report scalasca -analyze -f filter.txt -t \ runjob --ranks-per-node P --np n [...] --exe ./myprog ATTENTION: Traces can quickly become extremely large! Remember to use proper filtering, selective instrumentation, and Score-P memory specification Before flooding the file system, ask us for assistance! M. Knobloch SC Introduction, May 2015 46 Scalasca Trace Analysis Example Additional wait-state metrics from the trace analysis Delay / root-cause metrics Critical-path profile M. Knobloch SC Introduction, May 2015 47 Vampir Event Trace Visualizer Offline trace visualization for Score-P’s OTF2 trace files Visualization of MPI, OpenMP and application events: All diagrams highly customizable (through context menus) Large variety of displays for ANY part of the trace http://www.vampir.eu Advantage: Detailed view of dynamic application behavior Disadvantage: Requires event traces (huge amount of data) Completely manual analysis M. Knobloch SC Introduction, May 2015 48 Vampir Displays M. Knobloch SC Introduction, May 2015 49 Vampir: Timeline Diagram Functions organized into groups coloring by group Message lines can be colored by tag or size Information about states, messages, collective and I/O operations available through clicking on the representation M. Knobloch SC Introduction, May 2015 50 Vampir: Process and Counter Timelines Process timeline show call stack nesting Counter timelines for hardware or software counters M. Knobloch SC Introduction, May 2015 51 Vampir: Execution Statistics Aggregated profiling information: execution time, number of calls, inclusive/exclusive Available for all / any group (activity) or all routines (symbols) Available for any part of the trace selectable through time line diagram M. Knobloch SC Introduction, May 2015 52 Vampir: Process Summary Execution statistics over all processes for comparison Clustering mode available for large process counts M. Knobloch SC Introduction, May 2015 53 Vampir: Communication Statistics Byte and message count, min/max/avg message length and min/max/avg bandwidth for each process pair Message length statistics • Available for any part of the trace M. Knobloch SC Introduction, May 2015 54 (Rice University) Multi-platform sampling-based call-path profiler Works on unmodified, optimized executables http://hpctoolkit.org Advantages: Overhead can be easily controlled via sampling interval Advantageous for complex C++ codes with many small functions Loop-level analysis (sometimes even individual source lines) Supports POSIX threads Disadvantages: Statistical approach that might miss details MPI/OpenMP time displayed as low-level system calls M. Knobloch SC Introduction, May 2015 55 HPCToolkit: Metric Specification Specified via environment variable HPCRUN_EVENT_LIST General format: “name@interval [;name@interval ...]” Possible sample sources: WALLCLOCK PAPI counters IO (use w/o interval spec) MEMLEAK (use w/o interval spec) Interval: given in microseconds E.g., 10000 → 100 samples per second M. Knobloch SC Introduction, May 2015 56 Example: hpcviewer associated source code Callpath to hotspot M. Knobloch SC Introduction, May 2015 57 Allinea Performance Reports Single page report provides quick overview of performance issues Works on unmodified, optimized executables Shows CPU, memory, network and I/O utilization http://www.allinea.com/products/allinea-performance-reports Supports MPI, multi-threading and accelerators Saves data in HTML, CVS or text form Note: License limited to 512 processes (with unlimited number of threads) M. Knobloch SC Introduction, May 2015 58 Example Performance Reports M. Knobloch SC Introduction, May 2015 59 TAU Very portable tool set for instrumentation, measurementand analysis of parallel multi-threaded applications http://tau.uoregon.edu/ Supports Various profiling modes and tracing Various forms of code instrumentation C, C++, Fortran, Java, Python MPI, multi-threading (OpenMP, Pthreads, …) Accelerators M. Knobloch SC Introduction, May 2015 60 TAU: Instrumentation Flexible instrumentation mechanisms at multiple levels Source code manual automatic C, C++, F77/90/95 (Program Database Toolkit (PDT)) OpenMP (directive rewriting with Opari) Object code pre-instrumented libraries (e.g., MPI using PMPI) statically-linked and dynamically-loaded (e.g., Python) Executable code dynamic instrumentation (pre-execution) (DynInst) virtual machine instrumentation (e.g., Java using JVMPI) Support for performance mapping Support for object-oriented and generic programming M. Knobloch SC Introduction, May 2015 61 TAU: Basic Profile View M. Knobloch SC Introduction, May 2015 62 TAU: Callgraph Profile View Box width and color indicate different metrics M. Knobloch SC Introduction, May 2015 63 TAU: 3D Profile View M. Knobloch Height and color indicate different metrics SC Introduction, May 2015 64 Documentation To check latest status JUQUEEN: use “module avail” JUROPATEST: use “module spider” Websites http://www.fz-juelich.de/ias/jsc/juqueen/ http://www.fz-juelich.de/ias/jsc/juropatest/ User Info Parallel Debugging ( ) Parallel Performance Analysis ( ) http://www.vi-hps.org/training/material/ Performance Tools LiveDVD image Links to tool websites and documentation Tutorial slides M. Knobloch SC Introduction, May 2015 65 Support For general support: [email protected] Tool-specific support via corresponding mailing lists Score-P: [email protected] Scalasca: [email protected] Workshops and Trainings: Regular VI-HPS Tuning Workshops Several days Multiple tools, e.g. Score-P, Scalasca, Vampir, TAU, … Bring-your-own-code http://www.vi-hps.org/training/tws/ JUQUEEN Porting and Tuning Workshop Series M. Knobloch SC Introduction, May 2015 66 Appendix Tool recipes Mitglied der Helmholtz-Gemeinschaft STAT: Recipe Compile and link your program with debug option: -g Load modules % ssh -X user@juqueen [...] juqueen% module load UNITE stat UNITE loaded stat/2.1 loaded juqueen% STATGUI Submit job and attach to it from GUI CAVEAT: Job needs to be started by login node where GUI is running Add the following entry to the submission script #@ requirements = (Machine == “juqueen<n>”) with <n> being the login node id M. Knobloch SC Introduction, May 2015 68 STAT: Attaching to a Job M. Knobloch SC Introduction, May 2015 69 TotalView: Recipe for JUQUEEN Compile and link your program with debug option: -g Use absolute paths for source code info: -qfullpath In case of optimized codes (XL), keep function call parameters: –qkeepparm Load modules % ssh -X user@juqueen [...] juqueen% module load UNITE totalview UNITE loaded totalview/8.14.0-16-mrnet loaded juqueen% mpixlcxx hello.cpp -qfullpath -qkeepparm -g -o helloworld juqueen% M. Knobloch SC Introduction, May 2015 70 TotalView: Interactive Startup Interactively: call the lltv script Creates a LoadLeveler batch script with required TotalView parameters If user cancels the script, it cancels the debugging job (does not eat your computing quota) NOTE: License limited to 2048 MPI ranks (shared between all users) Attaching to subset is recommended M. Knobloch SC Introduction, May 2015 71 TotalView: lltv Launch Script % lltv -n <nodes> : -default_parallel_attach_subset=\ <rank-range> runjob -a --exe <program> -p <num> Starts <program> with <nodes> and <num> processes per node, attaches to <rank-range>: Rank: that rank only RankX-RankZ: all ranks, both inclusive RankX-RankZ:stride every strideth between RankX and RankZ Example: % lltv -n 2 : -default_parallel_attach_subset=\ 2-6 runjob -a --exe helloworld -p 64 Creating LoadLeveler Job Submitting LoadLeveler Interactive Job for Totalview Wait for job juqueen1c1.32768.0 to be started:........... M. Knobloch SC Introduction, May 2015 72 TotalView: Execution Recipe TotalView tries to debug “runjob” and shows no source code Ignore it and press “GO” After some seconds, TotalView will detect parallel execution and ask if it should stop. Yes, it should stop. To find the correct point file/function to debug, use the “File-Open” command. Set your breakpoints, and press “GO” again. Debugging session will then start. To see a variable’s contents, double click on it in the source. M. Knobloch SC Introduction, May 2015 73 Vampir: Recipe (JUQUEEN) 1. module load UNITE vampirserver 2. Start Vampir server component (on frontend) using “vampirserver start smp” Check output for port and pid 3. Connect to server from remote machine (see next slide) and analyze the trace 4. vampirserver stop <pid> See above (2.) M. Knobloch SC Introduction, May 2015 74 Vampir: Recipe (local system) 1. Open SSH tunnel to JUQUEEN using “ssh -L30000:localhost:<port> juqueen<n>” 2. Start Vampir client component For example: “/usr/local/zam/unite/bin/vampir” 3. Select 1. “Open other…” 2. “Remote file” 3. “Connect” (keep defaults) 4. File “traces.otf2” from Score-P trace measurement directory M. Knobloch SC Introduction, May 2015 75 HPCToolkit: Recipe 1. Compile your code with “-g -qnoipa” For MPI, also make sure your application calls MPI_Comm_rank first on MPI_COMM_WORLD 2. Prefix your link command with “hpclink” Ignore potential linker warnings ;-) 3. Run your application as usual, specifying requested metrics with sampling intervals in environment variable “HPCRUN_EVENT_LIST” 4. Perform static binary analysis with “hpcstruct --loop-fwd-subst=no <app>” 5. Combine measurements with “hpcprof –S <struct file> \ -I “<path_to_src>/*” <measurement_dir>” 6. View results with “hpcviewer <hpct_database>” M. Knobloch SC Introduction, May 2015 76 TAU: Recipe 1. Load TAU module# once per session 1. 2. 3. 4. module load UNITE tau Specify programming model by setting TAU_MAKEFILE to one of $TAU_MF_DIR/Makefile.tau-* Compile and link with tau_cc.sh file.c ... tau_cxx.sh file.cxx... tau_f90.sh file.f90 ... Execute with real input data Environment variables control measurement mode TAU_PROFILE, TAU_TRACE, TAU_CALLPATH, … Examine results with paraprof M. Knobloch SC Introduction, May 2015 77