1
IPEC
Info
Indicator database on children's
activities in Latin America
and the Caribbean
USER'S
MANUAL
credits
Edition
International Labour Organization (ILO)
International Programme on the Elimination
of Child Labour (IPEC)
Design
SIPCOM Green
Photographies en the cover
Claudia Gacitúa
María Paz Lira
Hugo Peña
Antonio Rosas
Juvenal Sandoval
Richard Ulloa
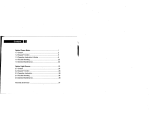
content
O Introduction
3
Q Home Page
5
© Parameters
8
© Displaying the data
14
© Presentations formats
17
© Gallery and presentations
24
© Example
25
Total or partial reproduction of the materials here published are permitted as long as not altered and corresponding
credits are acknowledged.
o introduction
IPEC Info is a database system that helps to organise and pres
ent indicators on work, school and domestic activities, as well as
some social aspects of girls and boys less than 18 years of age in
countries of Latin America and the Caribbean. It is an adaptation
of the Devinto technology, which was developed in co-operation
with the United Nations System.
The goal of this system is to facilitate access, use, interpretation
and dissemination of indicators on the activities of girls and boys
and their social context. Among potential users of IPEC Info
are different governmental institutions, statistical institutes,
non-governmental organisations, universities, research
centres, agencies within the United Nations System, and
others interested in information on girls and boys in Latin
America and the Caribbean.
This system consists of the following elements:
• Indicators
• Time periods
• Geographic areas
• Units
• Sub-populations
- Sex (female / male)
- Zone of residence (urban / rural)
- Age group
- Ethnicity (indigenous / non-indigenous)
- Region (province, state or others)
• Data sources
• Values (data)
IPEC Info provides access to indicators organised, by de
fault, by "Theme", where the indicators are grouped into
the following 15 topics:
- Characteristics of the dwelling
- Characteristics of the girls and boys
- Characteristics of the household
- Schooling
3
-
Domestic chores in the own home
Children's work - Characteristics of working girls and boys
Children's work - Status in employment
Children's work - Hours worked and shift
Children's work - Magnitude of work
Children's work - Occupation
Children's work - Perception of dependence on
children's work
Children's work - Industry or branch of economic activity
Children's work - Agricultural work
Children's work - Child domestic work
Children's work - Location of employment
Similarly, the user may choose to display the indicators by
"Sector", where the indicators are organised in two sectors
of 3 classes each:
• Activities of girls and boys less than 18 years of age
- Domestic activities in the own home
- School activities
- Work activities
• Social aspects of girls and boys less than 18 years of age
- Household aspects
- Demographic aspects
- Socio-economic aspects
Some of the indicators may be organised by "Convention",
particularly with regards to the ILO Minimum Age Convention,
1973 (No. 138) and/or the ILO Worst Forms of Child Labour
Convention, 1999 (No. 182).
In addition to consulting the indicators, as we will see below,
the system offers easy access to the display of these indicators
in tables, graphs or maps.
O home page
The Home Page appears as shown below:
GO
O
G
Q
G
©
O
Address bar
After installing IPEC Info, you must select the database, entering
localhost: //IPEC Info 1.0/IPECJnfo.mdb (or the corresponding database according to the version of IPEC Info selected) in this bar, in case
the system does not do so automatically.
Product
Presents a brief description of IPEC Info and its information sources, and
lists links for access to the Users' Manual, the questionnaires and the
documents that describe the definition of urban and rural zones, as well
as the methodology employed in the surveys that provided the information contained in IPEC Info. Furthermore, it also includes a list of the
tables, charts and maps included in Presentation (See E).
5
■
Organisation
Jr'
Lists the links to the portals of the Sub-Regional Coordinator for the International Programme on the Elimination of Child Labour for Central
America, Panama, Dominican Republic, Haiti and Mexico, the Regional
Office for the International Programme on the Elimination of Child Labour
for Latin America and the Caribbean, and the headquarters office of the
International Programme on the Elimination of Child Labour.
Q
*
Search
Allows direct access to the "Indicators" page.
Presentation
Contains a large number of tables, charts and maps that provide the
main results of the indicators available in IPEC Info.
Images
Contains the photographs from the Home Page, together with the
leame.txt, file which lists the photographers of each photograph.
Contents
Provides a "Wizard" to guide the user through the programme.
Guided Tour
Contains a presentation that states the objectives, benefits, advantages,
potential users, contents and uses of IPEC Info.
%
Speaker
Allows activation or deactivation of the background music.
6
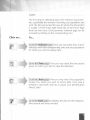
icons
The first step for obtaining data is the selection of parame
ters, specifically the indicator (including sub-population and
unit), the time period and the area for which the information
is sought. On the lower right-hand side of the Home Page
there are four icons. Each parameter selection page can be
accessed by clicking on the corresponding icon.
Click on...
To...
Go to the Indicator page. Here you may select from a list of
indicators with their corresponding units and sub-populations
for which you wish to display data.
r
Go to the Time page. Here you may select the time period
(year) for which you wish to view the indicators.
Go to the Area page. Here you may select the geographic
location for which you wish to access data. Each area is
divided in sub-levels and has a unique area identification
(Area Code).
Go to the Data page and display the data for the indicators,
time periods and areas selected.
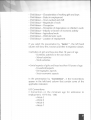
Q parameters
As was mentioned above, in order to obtain a desired value
(data point), you must first select three parameters: the indi
cator, the time and the area. The parameters may be selected
in any order, but you must select all of them before obtaining
a value for an indicator.
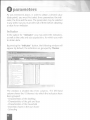
Indicator
In the option for "Indicator" you may select the indicators,
as well as the units and sub-populations, for which you wish
to obtain data.
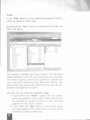
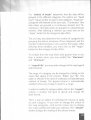
By pressing the "Indicator" button, the following window will
appear. By default, the indicators are grouped by Themes
EE
:^8ack Ö
AOSress ¡
I PEC Info
^jeíii
JÙ i
I Theme
]
CJ Characteristics of the dwelling
Characteristics of the o|f>s ard Coys j
(J Characteristics of me household
Cj_ Children'
work- Agricultural
workcf |
Children'gins
ss work'-w working
ancCharactensfcs
boys
_ * work
Children s work- Child domestic
_ Children
shfl s work- Hours worked and i
.. Children
of economics workactivityIndustry or branch
P*—* employment
Children s work- Location of
Q Children s work- Magnitude of work :
D Children s work- Occupât on
. Chdependence
dren s workPerceptions work
of
on children'
s work- Status o‘
D Children
employment
<9
indicator
Cy°h of boys in tnet
C3*%
1 of toys m me t
CS" * of boys m met
ofboys mthe t
cy°h of boys in tne t
C3** of toys in me t
1^% of girls an; oc
cy% of girls an; oc
(5*% of girls and be
CS’% of gins arc be
Cj'% of gins and be
Cj* % ot gins and be
0*% of girls ano bu
o* girts ana be
C3’% of gins and bo
O’% of girts and bo
0% of gins and bo
0% of gins and bo
;î
lUnlt
X Perc
/ Perc
.Z’ Perc
j/ Perc
.S' Perc
.Z' Perc
y Perc
Perc
y Perc
Perc
y Perc
Perc
y Perc
Perc
y Perc
y" Perc
y Perc
indicator
J Q3ubPop_Der*
i Der*
Bft Rural
less I:
B Total 1
Ö Urban
B Fern .!l
B Male
B Rural;,
B Total
B Urban“
B Fern
B Male :
B Rural
B Total
B Urban
Ö 1<ä
S' ’d
JL-LdT
16/09/2005
I
05 47 pm
—
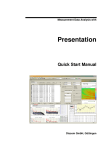
The window is divided into three columns. The left-hand
column shows the 15 themes into which the indicators have
been grouped:
- Characteristics of the dwelling
- Characteristics of the girls and boys
- Characteristics of the household
- Domestic chores in the own home
- Schooling
8
-
Child
Child
Child
Child
Child
Child
Child
Child
Child
Child
labour
labour
labour
labour
labour
labour
labour
labour
labour
labour
Characteristics of working girls and boys
Status in employment
Hours worked and shift
Magnitude of work
Occupation
Perception of dependence on children's work
Industry or branch of economic activity
Agricultural work
Child domestic work
Location of employment
If you select the presentation by "Sector'"', the left hand
column will show the 2 sectors and their 3 respective classes:
• Activities of girls and boys less than 18 years of age
- Domestic activities in the own home
- School activities
- Work activities
• Social aspects of girls and boys less than 18 years of age
- Household aspects
- Demographic aspects
- Socio-economic aspects
In the presentation by "Convention2 ILO Conventions
appear in the left-hand column that contain some of the
applicable indicators:
ILO Conventions:
• Convention on the minimum age for admission to
employment, 1973 (No. 138)
- Article 2
- Article 3
- Article 5
- Article 7
• Convention on the prohibition of the worst forms of
child labour and immediate action for its elimination,
1999 (No. 182)
- Articles 1 and 3d
The centre column shows the indicators that are available within
each theme (or within each class of each sector, or within each
Convention, according to the choice the user has made for
his/her presentation). The indicators chosen by the user appear
in the right-hand column.
To select an indicator, you must first select the topic (or
the sector and class, or the Convention) from the left-hand
column, and then double-click on the desired indicator
that appears in the list of available indicators in the centre
column. In the centre column, it is important to verify that
the unit and the sub-population related to each indicator
selected are the ones desired.
An indicator has been correctly selected when it appears in
the right-hand column. If you wish to eliminate an indicator
from the right-hand column, double-click on its name.
USEFUL INFORMATION: If you right-click on an indicator's name, whether in the centre column ("Available") or
the right-hand column ("Selected"), and select "Information", a window opens containing a definition of the
indicator and, where relevant, other important information
on how it was calculated for different countries. Similarly,
by right-clicking on the name of some themes an "Information" option appears, which contains the definition and
other relevant information on the theme. In the case of the
Convention articles, a right-click will display the full text
of these articles.
10
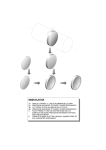
Time period
In the option for "Time" one may select the year for which
one desires to obtain data.
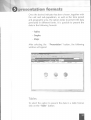
By clicking on the ''Time'' button, a window similar to the
following will open.
IPEC Info - [Time]
Me Ed* View Favortes Tool*
4eack 4
22 132003
32002
Ü2001
S3 2000
231999
S31998
S3l997
3'996
231995
JSI4
^2004
Ü2003
232002
232OOI
232000
231999
231998
231997
231996
231995
!05 41 pm. '
—
The window is divided into two columns. In the left-hand
column, the years available appear, and the right-hand
column displays the years selected by the user.
To select a time period, double-click on the desired year
that appears in the list of years in the left-hand column. A
period has been correctly selected when it appears in the
right-hand column. If you wish to eliminate a period from
the right-hand column, double-click on it.
11
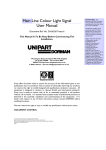
Area
In the "Area" option you may select the geographic area for
which you desire to obtain data.
By selecting the "Area" button, a window similar to the one
below will appear.
IPEC Info - [Areas]
Ffe Edft View Favoftes Toot« Help
O lïü là ¡ y 5c»ch FÍ.M.Í <0
! Address f
IPEC Inf
Name
Map
Area
II] Area
0j Latinamenca and tne Cariûbean
©Bei via
O Belize
©Brazil
Cl Bohvia
©Chile
Ci Brazil
©Colombia
D Chile
©Costa Rica
O Colombia
©Dominican Republic
CS Costa Rica
©Ecuador
! O Dominican Republic
c©Guatemala
El Salvador
O Ecuador
j- Q El Salvador
©Honduras
: a Guatemala
©Jamaica
I a Honduras
©Mexico
O Jamaica
! Nicaragua
a Mexico
©Par
O Nicaragua
i©^
a Panama
a Paraguay
D Peru
-inlxl
* ud
I Area ID
LACBLZ
LACBOL
LACBRA
LACCHL
LACCOL
LACCRI
LACDOM
LACECU
LACSLV
LACGTM
LACHND
LACJAM
LACMEX
LACNIC
LACPAN
Area Name
©Belize
©Bolivia
©Brazil
©Chile
©Dominican Republic
©Paraguay
J jJLL
16/09/2005
I Area ID ~
LACBLZ
LACBOL
LACBRA
LACCHL
LACDOM
LACPRY
05 44 p.m
The window is divided into three columns. The left-hand
column presents a list of the area levels and area sub-levels.
The centre column presents the sub-levels available for
each area level selected in the left-hand column. The
areas (levels and sub-levels) selected by the user are dis
played in the right-hand column.
The area may be selected by Name or Map
1. If you select the “Name” option, the list of area
sub-levels appears in the centre column. An area can
be selected by double-clicking on the area that
appears in the centre column.
2. If you select the "Map"option, a map of the region
selected appears in the centre column. An area can be
selected by clicking on the map.
An area has been correctly selected when it appears in the
right-hand column. If you wish to eliminate an area from the
right-hand column, double-click on its name.
Useful Information: You can select all of the indicators, time
periods or areas available by pressing the right mouse button
over the "Available" column and choosing "Select all".
You can deselect all of the indicators, time periods or areas
selected by merely right-clicking on the "selected" column
and choosing "Clear all".
AlltO-Selection | ► Button auto-selection
The auto-select button appears on the "Indicator”, "Time” y
"Area" pages. It allows you to automatically select the indicators,
time periods and areas for which data exist. Each step in the autoselection process is integrated with the previous selections made
by the user.
For example, if the user selects an indicator, the auto-select
option on the "Period", page will select only those years for
which there is data on this indicator. Similarly, in the "Área",
page, the auto-select option will automatically select only those areas for which data exists on this indicator and for the years already
selected.
On the "Indicator" page, the auto-select button in the left-hand
column automatically selects all those indicators for which there are
data, while the auto-select button in the centre column ("Available") selects those indicators for which there are data, but only
for the list of available indicators.
Likewise, in the "Area” page, the auto-select button in the lefthand column automatically selects all the areas from all the levels
for which there are data. This same button in the centre column
("Available") selects the areas for which data exist, but only from
the list of available areas.
13
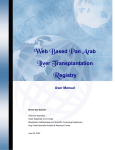
Q displaying the data
Once you have selected the parameters (indicator, year
and area), it is then possible to see the values for the
desired indicators.
After pressing the "Data" button, a window similar to that
shown below will appear.
File Edit View Favorite* Tools : Help
JB** O 3 iâ à U 'r '®* Favorites ’ßl : !
ettingstmarschatz\Desktop\OITJPECMPEC_lnfo\Data\IPECJrno_2_Eng_Pantallas.mdb|
irrrrtTTfrim Wmi
mm
2002
2002
2000
2001
2002
2000
2000
2001
liJ .
LACBLZ
LACBÖL
LACBRA
LACBRA
LACCHL
LACCOL
LACCOL
LACCRI
LACDOM
LACECU
LACGTM
LACHND
LACJAM
LACMEX
LACMEX
LACMEX
LACNIC
LAC PAN
LACPER
Belize
Bolivia
Brazil
Brazil
Chile
Colombia
Colombia
Costa Rica
Dominican Republic
Ecuador
Guatemala
Honduras
Jamaica
Mexico
Mexico
Mexico
Nicaragua
Panama
Peru
JBl£l
~3 a;
indicator
Souro
1 Data Value i Unit I SuBpoc. F
11 Percentage Total BLZ Belize. g
Working rate for girls and boys
28 Peicentage Toial BOLBollyia JCP §
Working rate for girls and boys
Working rate for girls and boys
12 Percentage Total ~ BRA Brazil_PNAC
Working rate for girls and boys
13 Percentage Total BRA Brazil_PNAC f
Working rate for girls and boys
5 Percentage Total CHLChile_2003
14 Percentage Total COL Colombia^ :i
Working rate for girls and boys
10 Percentage Total COL Colombia^
Working rate for girls and boys
Working rate for girls and boys
10 Percentage Total CRI Costa Rica.
18 Percentage Total DOM Dominican
Working rate for girls and boys
Working rate for girls and boys
21 Percentage Total ECU Ecuador.Ef
Working rate for girls and boys
23 Percentage Total GTM Guatemala.
Working rate for girls and boys
15 Percentage Total HND Honduras.
Working rate for girls and boys
2 Percentage Total JAM Jamaica.YA
Working rate for girls and boys
8 Percentage Total MEX Mexico JNE'
Working rate for girls and boys
8 Percentage Total MEX Mexico.lNE' ,
Working rate for girls and boys
7 Percentage Total MEX MexicO.lNE'
14 Percentage Total NIC Nicaragua.; «
Working rate for girls and boys
Working rate for girls and boys
6 Percentage Total PAN Panama.ET
Working rate for girls and boys
26 Percentage Total PER Pen ENAhH
>r
'07:18 pfm W~
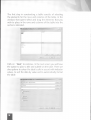
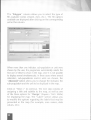
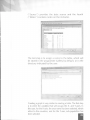
In the "View" option, you can see a table with the values for
the indicators corresponding to the selected parameters. This
table contains the following information: Time, Area Code, Area
Name, Indicator, Value, Unit, Sub-population and Source.
In the "Statistics" option, you can display the number of data
points, the minimum and maximum values, the mean and
standard deviation of the data for each indicator. This information may be more useful further along, to define the ranges
of the categories in the maps (see Section 7 of the Manual).
The "Subpop" option is useful for visualising the disaggregation available and the disaggregation selected for the indicators.
At this point, double-clicking on the name will change the subpopulation selection.
14
IPEC Info - [Data]
File Edit view Favorites Tools Help
- iTVorking rate for girls and boys
Percentage
Total
Count I Minimum I
Maxmurn j ~
13.41
13.41 '
17/09/2005
7
S3—
6,77 Î _
f07 22p.m. jp
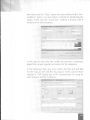
The "Sort'' option allows you to define the way you want
the data ordered in the presentation. These can be presented
in ascending or descending order, according to the follow
ing elements: area code, area name, data value, indicator,
source, sub-population, unit and time period. In the case
presented below, the choice has been made to display the
data in ascending order according to the area code. The up
ward-pointing arrow icon indicates ascending order, while a
downward-pointing arrow would be descending order.
^ IPEC Info - [Data]
File Edit Viaw Favorites Tools Help
O8** O
iá « / ■
am
Favonle* ^0}
15
The "Calculate" option provides methods for carrying out
simple calculations with the data obtained from the database.
The different methods available are: "Per cent", "100
minus”, "Composite index", "Subtotal", "Transform unit"
and "User-Defined Formula".
The "Per cent" method allows you to obtain an indicator (ra
tio) for which the user selects a numerator and a denominator,
and whose unit of measurement is percentage. For example, if
we have the number of girls working and the total number of
girls, this method makes it easy to calculate the percentage of
girls working in respect of the total number of girls.
The "100 minus" method provides the difference between
100% and the value of an indicator in percentages. For
example, if we have the school attendance rate of the working
boys, by applying this method we obtain the non-attendance
rate of the working boys.
The "Composite index" method calculates an index composed of
the selected indicators, according to the relative weight assigned to
each one by the user. For each composite index created you must
select a name, sector and class in which it will be placed, as well as
the corresponding unit, sub-population, number of decimal places,
minimum and maximum. If the user selects only one indicator, the
"Composite index" method transforms this indicator into an index
with a maximum value of 100, adjusting the other values accord
ing to their weight relative to this maximum value of 100.
The "Subtotal" method allows you to obtain data values for
geographic areas at a level below that originally selected.
The "Transform unit" method facilitates transforming one
unit by a multiplier. For example, it allows you to convert
thousands to hundreds, or vice-versa.
The "User-Defined Formula" method allows the user to create
calculations in accord with a formula s/he has defined.
16
o presentation formats
Once the desired indicator has been chosen, together with
the unit and sub-population, as well as the time period
and geographic area, the option exists to present the data
generated in different forms. It is possible to present the
data in the following formats:
- Tables
- Graphs
- Maps
After selecting the
window will appear:
"Presentation" button, the following
■Mi
Statistics ! Source
Unit
*5
Subpop
Sort
Calculate
Presentation
Gallery
■ys»
Map
I Présentât
Tables
To select the option to present the data in a table format,
click on the "Table” button.
17
The first step in constructing a table consists of selecting
the elements for the rows and columns of the table. In the
window that opens select and drag the elements that you
wish to place in the rows and columns of the table into the
sections indicated.
Click on "Next" to continue. In the next screen you will have
the option to place a title and subtitle on the table. There are
also options to colour the table's cells in accord with indicator
values, to sort the data by value and to automatically format
the table.
18
To obtain a preview of the table, click on "Next".If you
wish to change any aspect of the table, you may click on
"Back", or you can click on "Next" (Next >) to continue
to name and save the table.
Graphs
To select the option to present the data in graphs, you must
click on "Graphs".
The first step in creating a graph consists of selecting the
elements for the X- and Y-axes in the chart. Select and
drag the elements that you wish to place in the axes into
the indicated sections, and then click on "Next" to continue.
If you wish to sort the data by data value, mark the box
for the "Sort",option, and then click on the arrow icon to
determine the order desired (ascending or descending).
Mark the "Format table" box if you wish to automatically
format the table. Click on “Next" (Next >) to continue.
This step opens the MS Office Excel Chart Wizard, where
you will be able to select the type of chart and other options
related to sources for data, titles and labels, among others.
Once the chart options have been selected, they can be
previewed as in the following example.
Click on " Back" if you wish to make some change to the chart,
or "Next " to move on to naming and saving the chart.
Maps
If you wish to select the option to display the data in maps,
you must click on the "Map"button.
The data will be grouped in categories depending on their
value. By default, the programme pre-selects the options
for method and number of breaks, minimum and maximum
values to be displayed and category colours, but these may
be modified by the user.
20
The "Method of breaks" determines how the data will be
grouped in the different categories. The options are "Equal
count" (equal number of cases in each category), "Equal size"
(categories with intervals of the same size), "Continuous" (the
data values are grouped in a continuous manner) and "disontinuous" (the data values are grouped in a discontinuous
manner). After selecting a method, you must click on the
"Apply" button for the changes to take effect.
The user may also determine the number of categories for
grouping the data (a minimum of two categories) and the
number of decimal places to be used for the ranges. After
selecting these numbers, you must click on the "Apply"
button for the changes to take effect.
To exclude from the map those data greater than or less
than a certain value, you may modify the "Maximum"
and "Minimum".
In "Legend title" you may make changes to the map legend
and its format.
The range of a category can be changed by clicking on the
values that appear in the columns "From" and "To". This
option is relevant in the cases of continuous and discontinuous
method of breaks. The legend column is automatically
updated when any change is made to a range.
In order to modify the category labels, click on the "Leyend";
column, a window will open to specify and change the
label format.
There is also an option for selecting the colours to apply
to each category. If you wish to change the colour of
the map categories, click on the colour box to display
the colour palette and make your selection. The "Smooth"
button changes the shading of the colours chosen.
21
The "Polygon'' column allows you to select the type of
fill available (solid, striped, dots, etc.). The fill options
available are displayed after clicking on the corresponding
cell in this column.
When more than one indicator, sub-population or unit were
chosen by the user, the programme automatically selects the
first one of these to show in the map, since it is not possible
to display several simultaneously. In those cases where several
indicators, sub-populations and/or units are chosen, the
"Advanced"option allows you to change the indicator, the
sub-population and the unit to be displayed in the map.
Click on "Next >" to continue. The next step consists of
assigning a title and subtitle to the map, as well as one
of the three options for "Design" (Square / Tali / Wide)
for displaying the map. The "Label" section allows you
to modify the options regarding the labels that may be
presented in the map (for example, area names, data
values, etc.).
22
Click on "Next >" to continue. As the next step, you will find
the "Customize" option, which lets you make changes to
the map, such as adding new countries with their respective
format (fill style and colour, outline, labels), among others.
There are also options for "Full extent", "Zoom In", "Zoom
Out", "Pan", "Refresh", "Features" (to show features such
as the name, value, sub-population, unit, year for the data
on a particular region) and "Label" (to apply labels to the
map), all of which may be activated by clicking on them.
By clicking on "Next >", you will arrive at the following step,
a preview of the map, which opens in an MS Office Excel
spreadsheet. If you wish to make changes to the map, you
may click on "< Back" or click on "Next >" and "Save" to
assign a name and save the map.
Useful Information: Upon customising a map, you may
add other neighbouring countries or regions without data
values. To add regions or countries to a map, click on
"Customize", then the "Add" button and select the map
of the region or country that you wish to add. In some
cases, this may improve the map's appearance.
O gallery and presentations
All of the presentations that you have prepared are stored
in "Gallery" by default, whether these are tables, charts or
maps. These files are recorded in MS Office Excel format
(.xls), so that handling them is the same as using the MS
Office Excel programme. The presentations created may
be easily accessed by means of the "Gallery" option in the
"Tools" menu, which will open a window similar to that
shown below.
Inserting the tables, charts or maps you have created into MS
Office PowerPoint or MS Word documents is very simple,
since the files are originally created in MS Office Excel and
are image-type files. Thus, a simple "Copy" and "Paste" is
sufficient. Nevertheless, it is important to adjust the size of
the tables, charts or maps to the presentation or MS Office
Word document, as may be the case. Once the images have
been inserted, this can be carried out by clicking the right
mouse button on the image, selecting "Image Format", and
then selecting "size", to modify it as necessary.
24
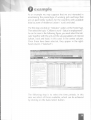
Q example
As an example we may suppose that we are interested in
ascertaining the percentage of working girls and boys that
are un-paid family workers for the countries with available
data by zone of residence (urban / rural) and total.
The first step is to click on “Indicator" option on the Home Page.
Then select the topic "Children's work-Status in employment".
As can be seen in the following figure, you must select the indi
cator together with the unit and the sub-populations of interest
(urban, rural and total, in this case) in the centre column.
Once these have been selected, they appear in the righthand column ("Selected").
IPEC Info - [Indicators]
File Edit View Fv
OBack O t*) i
Mm
~3-a
IPEC InfO——Mmrrrnpüt* jjjtgl
Theme
Theme r
j
Q Cha actenstics of the dwelling
C3 Characteristics ofthe girls and boys :
Q Characteristics ofthe household
Q Children's work- Agricultural work
P Children's work- Characteristics of
working girts and boys
P work
Children's work- Child domestic
LJ
p._j Children's work- Hours worked and i
pÖ_ Children'
s workeconomic
activityIndustry or branch ;
« Children's work- Location of
employment
-C3 Children s work- Magnitude of work :
2j Children's werk- Cccupation
,. Children s a-o-k- Perception of ■
—' dependence on children s work
.Children s work Status of
employment
; % of workers that are un-paid family workers
Indicator
Cj’% of workers tha .
0’% Of workers tha.
C5"% of workers tha .
úT%
of workers tha
C5:,% of workers tha .
0’% of workers tha
0°% of workers tha..
of workers tha .
0-% of workers tha .
Cj“% of workers tha .
1^% of workers tha
Cjf'% of workers tha
0"% of workers tha .
ofworkerstha.
of workers tha
Cj" % of workers tha
L5’% of workers tha
C^‘% of workers tha .
i uhpop
Cÿ”*) of workers tha .Z" °erc
of workers tha .Z' Perc n Total
of workers tha.,/ Perc. ö Urban
~w~
The following step is to select the time periods. In this
case we select all those available, which can be achieved
by clicking on the Auto-Select button.
25
; \ I Mil —III'll I'I'I' "
File Edit View Fívorítes Tools Help
¿b«* ©
*■ /
J£3Ji.
'•*** €!
* ~-
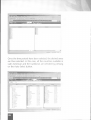
Once the time periods have been selected, the desired areas
are then selected. In this case, all the countries available in
Latin American and the Caribbean are selected by pressing
on the Auto-Select button.
IPEC Info - [Areas]
File Edit view Favorites Tools Help
(¡3 ¿J
lyDs««»<g>
Address
IPEC 11
TTtrri
_3 Area
B Ç3 Latinamenca and me Car.bbean
D Belize
C2 Bolivia
Cj Brazil
: Ci Chile
D Colombia
Li Q Costa Rica
Ca Dominican Republic
; Qj Ecuador
O El Salvador
: Cã Guatemala
O Honduras
j C3 Jamaica
1 O Mexico
O Nicaragua
1 O Panama
D Paraguay
Afea Name
Belize
^Bolivia
O Brazil
^ Chile
©Colombia
©Costa Rica
8Dominican Republic
Ecuador
SEI Salvador
Guatemala
©Honduras
©Jamaica
©Mexico
©Nicaragua
©Panama
©Paraguay
©Peru
d a
i Area ID
LACBLZ
LACBOL
LACBRA
LACCHL
LACCOL
LACCRI
LACDOM
LACECU
LACSLV
LACGTM
LACHND
LACJAM
LACMEX
LACNIC
LAC PAN
LAC PRY
LACPER
Belize
Olivia
Brazil
olombia
osta Rica
Dominican Republic
Ecuador
El Salvador
Guatemala
Honduras
amaica
Mexico
Nicaragua
Panama
Paraguay
±1
26
¡17/09/2005
1 Area IP
LACBLZ
LACBOL
LACBRA
LACCOL
LACCRI
LACDOM
LACECU
LACSLV
LACGTM
LACHND
LACJAM
LACMEX
LACNIC
LAC PAN
LACPRY
J ±j
*08:19 p.m !<$
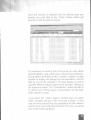
Once the indicator is selected with the desired areas and
periods, you must click on the "Data" button, which will
present us with the data as follows.
2001
2001
2002
2002
2002
2001
2001
2001
2003
2003
2003
2003
2003
2002
*\ I
Area iP : i
LACBLZ
LftCBLZ
LACBLZ
LACBOL
LACBOL
LACBOL
LACBRA
LACBRA
LACBRA
LACBRA
LACBRA
LACBRA
LACCOL
LACCOL
LACCOL
LACCOL
LACCOL
LACCOL
LACCRI
Belize
Belize
Bolivia
Bolivia
Bolivia
Brazil
Brazil
Brazil
Brazil
Brazil
Brazil
Colombia
Colombia
Colombia
Colombia
Colombia
Colombia
Cesta R ca
Indicator
ï Data Value j Unit j Subpop
7 Percentage Urban
paid family wjikÇTS
fc of workers thaï
34 Percentage Total
ib of workers that are un-paid family workers
43 Percentage Rural
>b of workers that are un-paid family workers
49 Percentage Urban
lb of workers that are un-paid family workers
82 Percentage Total
lb of workers that are un-paid family workers
94 Percentage Rural
lb of workers that are un-paid family workers
66 Percentage Rural
lb of workers that are un-paid family workers
41 Percentage Total
lb of workers that are un-paid family workers
23 Percentage Urban
lb of workers that are un-paid family workers
66 Percentage Rural
)b of workers that are un-paid family workers
40 Percentage Total
!b of workers that
paid family workers
23 Percentage Urban
lb of workers that are un-paid family workers
37 Percentage Urban
lb of workers that are un-paid family workers
47 Percentage Total
)b of workers that un-paid family workers
58 Percentage Rural
lb of workers that un-paid family workers
31 Percentage Urban
of workers that are un-paid family workers
39 Percentage Total
lb of workers that un-paid family workers
49 Percentage Rural
lb of workers that are un-paid family workers44 Percentage Total
it of workers that are un-ca d famiiv »»crke 3
j
BLZ
BLZB.
BLZ B>
BOLB
BOLB
BOLB
BRAB
BRAB
BRAB
BRAB
BRAB:
BRAB
COL C
COLC
COL Ó
COLC
COLC:
COLC:
CRI
,r
.! 710*2003 "108-20 pm. RS" Æ
mm
It is important to mention that at this point you may obtain
general statistics, such as the mean, minimum and maximum,
among others, by clicking on the "Statistics" button. It is also
possible to display and change the sub-population, sort the
data by any of the variables in the data display, as well as
calculate different aspects related to the indicator, clicking on
the respective button. The "Presentation" option permits us
to choose one of three types of presentation for the data:
tables, graphs or maps.
If you select the "Table" option, the first step is to select
which variables will go in the rows and columns. In this
case we have selected the sub-population for the columns
and the area name and time period for the rows, as can be
seen in the following figure.
27
Œ
Mtmm
jflijy
In the following step you select the title and sub-title for
the table, and you may also select the option to sort by the
data value (either ascending or descending), apply colourd
or give an automatic format to the table.
Table Wizard - Step 2 of 4 - Table Options
[% of workers that are un-paid family workers
Subtitle
[Percentage
Ts*t
Font
FontFont
r Sort by data value
Ai
I
r .Apply Color
1
<BacK |[ »>1»
The next step is to preview the table in MS Office Excel
format, as shown in the following figure. Here you may
make different adjustments, according to your requirements. The preview table presents four spreadsheets:
the first ("Table") contains the table itself, the second
("Data View") contains a display of the data, the third
28
("Source'') provides the data source and the fourth
("Notes") contains notes on the indicator.
Cancel
a
The last step is to assign a name to the table, which will
be stored in the programme Gallery by default, or in the
directory indicated by the user.
Table Wizard - Step 4 of
Oailerylocation ¡
$jC documents and SettingstpeleidesktoptlPEC INFOlBrc
Présentation name
: % of worke-s that are ur.-paid family workers
;cr-o:i attendance rate for gins and hoys_Orapn
licr.oal attendance rate for girts and beys table
School attendance
rate tor working gr’s and boys_Map
king -ate for girls and boys • Taeie
mmm
.JO]*.
'J
Creating a graph is very similar to creating a table. The first step
Is to select the variables that will occupy the X- and Y-axes. In
this case, for the X-axis, the area name has been selected, which
refers to the countries, and for the Y-axis, sub-population has
been selected.
29
ihm
Be» et
Save.
tarn
Load.
The following step allows us to sort the data and provide a for
mat for the graph. After this, the programme displays the MS
Office Excel Chart Wizard, where the graph may be custom
ised as desired. Here follows an example of how a customised
graph looks prior to saving in the Gallery or directory chosen
by the user.
In order to create a map of the total of unpaid family working
children by country, in the data display, we proceed to elimi
nate the data corresponding to the urban and rural zones,
since they will not be necessary for this map. Once this has
30
been done and the "Map" option has been selected in the "Presentation" section, we must select a method for distributing the
values. In this case the "Equal Size" method is chosen, with 4
breaks and no decimal places.
In this step the user may also modify the minimum, maximum,
legend title, ranges, legends and colours for the categories.
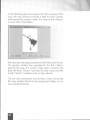
In the following step, you may modify the title and sub-title
for the map, as well and the map layout. In this case we have
selected a "Tall" layout due to the characteristics of a map for
Latin America and the Caribbean.
■ Title
!% of workers that are un-paid family workers
Subtitle
:
1
¡Percentage
□
a
a
Labet
; Field
i i j A-ea Ndmfc
Tj Advanced j
Disclaimer .
I ¡Note The bcurdanec and the rames snown and tne dccgnations uced on these maos do not
limply official endorsement or ac : eptance by the United Nations
Font.
font
II
Font
31
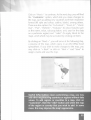
In the following step we are presented with a preview of the
map. We may choose to include a label for each country,
which gives the country's name, the value of the indicator,
or some other information.
After this step, the map is presented in MS Office Excel format.
The preview contains four spreadsheets: the first ("Map")
presents the map, the second ("Map Data”) presents the
data, the third ("Source”) provides the data sources and the
fourth ("Notes") contains notes on the indicator.
The last step corresponds to providing a name and saving
the map, whether this be in the programme Gallery or in a
user-selected directory..
32