1
STALKER ATS
User’s Guide
Stalker ATS for Windows - Version 3.0
Stalker ATS for Windows 95 - Version 4.0
User’s Guide
STALKER ATS
Versions
Stalker ATS for Windows - Version 3.0
Stalker ATS for Windows 95 - Version 4.0
.
.
STALKER ATS
This User’s Guide
This guide provides instructions for the installation and operation of Stalker ATS for Windows software.
The Stalker ATS program also has extensive on-line help documentation that duplicates much of this
manual.
Quick Start Up Instructions - The “Must Read” Chapter
The first chapter in this manual is written as a brief overview of Stalker ATS which can be read in
about 10 minutes. Reading through this chapter will provide most user’s enough understanding to
operate the STATS system. The rest of the manual provides the supporting detail and includes
instructions on many features that are not covered in chapter one.
4
Table of Contents
Table of Contents
Welcome
Introduction
Introduction to Stalker ATS
Chapter 1
Quick Start Up Instructions
Installation
Setup and Configuration
Recording
The Graph Mode Editor
Displaying the Results
Selecting a Trial
Statistics
Printing
Chapter 2
20
21
21
22
24
24
Configuration
Configuration Files
Configuration Settings
Settings on the Radar Gun
Chapter 5
15
16
17
18
19
The Main Screen
Major Screen Elements
The Main Menu
The Toolbar
The Three Sub Windows
Status Bar Displays
Popup Menus
Chapter 4
7
8
9
10
12
13
13
14
Installation
Versions of Stalker ATS
Computer Requirements
Installation Procedure
Previous Versions of Stalker ATS
Licence Agreement
Chapter 3
6
25
26
31
Recording Runs
Test Recording
Where to Place the Radar Gun
In-Vehicle Recordings
Trigger Versus Keyboard
The Radar Speedometer
When to Start Recording
After the Recording
33
34
34
36
36
37
38
Table of Contents
Chapter 6
5
Editing Data
Raw Versus Processed Data
The Graph Mode Editor
The Text Mode Editor
Data Filters
Data File Types
Chapter 7
Working With Data Trials
Trials Versus Files
Opening Data Files
Trials Information Window
Selecting Trials
Saving Trials
Managing Files & Directories
Averaging Trials
Chapter 8
66
67
Trouble Shooting
Built-In Help, Hints
Troubleshooting Index
Chapter 12
60
61
62
64
64
Printing
Print Dialog Box
Screen Capture Utility
Chapter 11
55
56
56
57
58
59
Measuring Statistics
The Statistic Window
Choosing Statistics
Creating Custom Statistics
Roll Out Distances
Managing Statistic Lists
Chapter 10
48
49
49
51
51
52
54
Working With Graphs
The Graph Window
Graph Types
Graph Scales & Zooming
Graph Styles
Reading Graph Coordinates
Averaging a Region of a Graph
Chapter 9
40
41
44
45
46
68
69
Appendixes
Index
Program Updates
Stalker ATS Specifications
Contacting Radar Sales, Inc.
74
77
78
80
6
Introduction
Welcome
Introduction
Congratulations
You have purchased the finest, radar based testing system available on the market today. The STalker
Acceleration Testing System (STATS) is used by most magazines and vehicle manufactures for
product testing because it is extremely accuracy, high quality, easy to use, and very affordable.
The Stalker Acceleration Testing System (STATS)
The STATS system consists of the Stalker ATS radar gun and the Stalker ATS software program. This
system is designed to measure vehicle or objects as they accelerate and then provide a detailed
picture of the dynamics of acceleration. STATS can be used for vehicle or kinetic testing.
What Is Included
The Standard STATS Package
• The Stalker ATS Professional Radar Gun
• Battery Handle & Smart Charging System
• Calibrated Tuning Verification Fork
• Deluxe Carrying Case
• Stalker ATS Software
• Serial Cable
The Deluxe STATS Package
• Everything in the Standard Package
• Second Battery Handle
• Gun Mounting Cradle
• Tripod
How the System Works
Think of the Stalker ATS radar gun as the speed sensor and the computer as the recorder. The Stalker
measures the speed of the vehicle (or object), and then sends those numbers to the computer at
precise intervals. The computer records the speed data,
assigns time information, and calculates distance and
The Data
acceleration rates for each data sample. This data is then
ACTUAL MEASUREMENTS
saved as a file on the computer's hard drive. Since speed,
Speed - Measured by Gun
time, distance, and acceleration are mathematically related,
Time - Assigned by Computer
having any two of these measurements means the other
components can be derived with absolute accuracy.
CALCULATIONS
Distance - Speed x Time
Acceleration - Change of Speed
Time
Chapter 1
Quick Start Up Instructions
Chapter 1
Quick Start Up Instructions
If you won’t read the entire
manual, at least read
through this chapter!
What is This Quick Start Up Chapter?
This is a short overview of Stalker ATS that can get most people up and running the STATS system
and software in 10 minutes. The rest of this manual provides the necessary detail for understanding
the capabilities of the software, and the detailed help file includes specific information about every
function.
Installation
Installation
Installing Stalker ATS in Windows 3.1X
1. Insert the program disk into your floppy drive.
2. Select File then Run from the Program Manager Menu.
3. Enter a:\setup in the command line box, and select OK.
Installing Stalker ATS in Windows 95
1. Insert the program disk into your floppy drive.
2. Select Start then Run.
3. Enter a:\setup in the open box, and select OK.
The Stalker ATS Installation Box will appear on your screen.
Make sure that the target drive selected is your hard drive (usually drive C:). Select OK.
Sample Data Files
A separate diskette labeled “Sample Data Files” should have been included with software shipment.
These files are actual data recordings of automobiles, snowmobiles, and personal watercraft. During
installation, you will be asked if you would like to install some sample data files.
• If you answer Yes, you will be prompted to insert the sample data diskette and the
sample recordings will be copied into the STALKER/DATA directory.
• If you answer No, no sample data files will be copied. You can still view and work with the
sample data later. To view them later, place the sample diskette into your floppy drive,
and choose Open a Data File, and then select a file from the floppy drive.
Starting the Program
Double-click on the Stalker ATS icon and wait for the start-up photo banner to load and
clear. This should bring you to the main screen.
7
8
Quick Start Up Instructions
Setup
The Setup Box
Chapter 1
The Setup Box controls the program configuration settings.
Access this box by selecting File > Setup > Change.
Choose the Correct Input Port
From the page tabbed “Radar Input,” choose the serial port
address used for the radar gun input. The open serial port on
most computers will be COM1, and some will use COM2.
Match the Units to the Radar
Make sure that the radar gun’s units and this unit setting are
the same.
Radar Gun Settings
For best results, set the
Stalker gun’s Auto Clear
setting to 0 seconds
(0SEC), and set the units to
read in 1/10th mph units.
Recommended Settings for Most Applications
• Auto Clear - 0SEC (0 Seconds)
• Setup Menu - H140 / Lo 0 (0-140 mph speeds)
• Units - 1/10th mph
• Range - Hi or SEn4
• X-Mit / Hold - Use trigger to transmit when hand holding gun, and set to constantly transmit
when the gun is tripod mounted.
The Stalker ATS radar gun outputs data through the serial port when it is transmitting. If it is
transmitting but no speed readings are present, it will output 0.0 speed data samples.
Test Recording
If the Radar Speedometer
shows some numbers but
seems to stall, then check
the “Disable Speedometer”
option in the Setup Box.
Do a test recording to verify that the radar gun and computer are communicating.
1. Start a trigger activated recording session by any of the following actions.
• Press the F2 function key on the computer.
• Use the menu to select Record > Record - Trigger Activated.
• Click on the red toolbar icon “Record radar data (Auto Trigger).”
2. Squeeze the trigger on the radar gun to begin transmitting (XMIT should display on gun).
3. Wave your fingers in front of the gun for a few seconds so that some speed readings are
taken.
4. If the gun and computer are communicating, then the Radar Speedometer window should
change to RECORDING. If the Radar Speedometer continues to display “Press the trigger
on radar gun to start data input,” then the test has failed. If the test failed, try another COM
Port setting.
See Chapter 4 for more information on Input Port settings.
Chapter 1
Quick Start Up Instructions
Recording
Radar Gun Placement
Doppler radar needs to be
lined up exactly in the line
of travel of the object it is
clocking. If the radar is
positioned off to the side,
angle error will cause
readings to be lower than
actual.
See page 34 for more
detailed instructions on
radar gun placement.
9
In order to get accurate test results, the radar gun needs to be positioned correctly.
Optimal Radar Placement For:
Acceleration Runs
Place the radar 15-30 feet directly behind the target vehicle.
Braking Runs
Radar can be placed in front of or behind the vehicle.
In-Vehicle
See Chapter 5 - Where to Place the Radar Gun
The sensitivity of the Stalker radar gun is intentionally reduced at speeds below 10 MPH, so it is
recommended that the portion of a run where the lowest speeds are measured is the same end of the
run that the radar is positioned.
When you have positioned the radar correctly, and have attached the serial cable from the radar gun
to computer, you are ready to begin recording.
Trigger Versus Keyboard Recording
You can use the trigger on the radar gun to start and stop a recording session, or
you can use the computer if the radar gun is set to constantly transmitting mode.
• If the Gun is Hand Held - Use the trigger method.
• If the Gun is Tripod Mounted - Use the keyboard method.
To Start Recording
Open The Radar Speedometer
To begin a recording session, first the radar speedometer box is opened by any of these three ways.
• Press the F2 or F3 function keys on the computer.
• Choose a recording method from the Record menu.
• Click on one of the red record icons from the toolbar.
When to Start Recording
For acceleration testing, all of the time measurements are based the actual movement curve of the
vehicle or object (target), and is NOT based on when the recording began. So, it is not necessary to
attempt to precisely time the start of the recording session to the start of the target.
• Acceleration Tests START recording BEFORE the target begins to move.
STOP recording AFTER the target reaches the end of the test run or when
the target goes out of the radar gun’s clocking range.
• Braking Tests
START recording at anytime prior to the brakes being applied.
STOP recording only after the target is completely stopped.
Beginning and Ending Zeros Are Discarded
Any speed readings of zero taken prior to the vehicle moving or taken after the vehicle stops, are
automatically discarded and will not add to the length of a recording.
10
Editing
Quick Start Up Instructions
Chapter 1
Two Types of Data Files
The Stalker ATS program creates two types of data files for each run.
• Raw Data File - A data file that includes just the actual speed numbers that were output from the
Stalker radar gun.
• Processed Data File - A data file that is created using the information from the Raw Data File
and includes speed, time, distance, and acceleration coordinates. All graphs and statistics
use the processed data files.
Processed Data is Created During Editing
The Processed Data file is created when a trial is edited. The Processed Data File is effected by the
data filter (if any), the data type, and by which raw data points are selected or not selected.
The Graph Mode Editor
Stalker ATS will attempt to take the data output from the radar gun and as automatically as possible,
create a clean curve representing the run. However, some types of problems with the data cannot be
overcome automatically, and you will need to manually assist in processing the data. If the “Auto Edit”
option is selected in the Setup Box, then immediately after a run is recorded, it will be loaded into the
Graph Mode Editor.
• Raw data points are represented as X and O marks.
• Processed data is represented as a blue curve passing through the raw data points.
The Data Type and Filter
that is selected in the Setup
Box will be the options
automatically listed in the
Editors.
Chapter 1
Quick Start Up Instructions
For accurate test results, it
is very important to
understand editing
completely. Look at the
editing section in Chapter 6
and the editing examples on
page 43.
Editing Has Three Components
1. Selection of which data points to be included in the processed curve.
2. Selection of the data type. See Chapter 6 - Data File Types.
3. Selection of the data filter to be applied. See Chapter 6 - Data Filters.
For a closer look at specific
areas, first zoom into the
area by drawing a region
box with the mouse and
then clicking on the Zoom
button on the toolbar.
11
The objective in the Graph Mode Editor is to include all of the good data points, and exclude any bad
data points. When the run is first loaded into the Editor, Stalker ATS will make it’s best guess at which
data points should be included or excluded.
• Included data points are represented as O’s.
• Excluded data points are represented as X’s.
Selecting Data Points
To select data points, draw a box around them with the mouse. Left click where you want a corner of
the box to be. Keep the mouse button pressed and move it to the opposite corner of the box. The box
will be drawn on the screen as you move the mouse. Release the mouse when the box includes the
data points you wish to select.
• Once you have highlighted an area containing the data points
Click on the + button to include the selected data points
Click on the - button to exclude the selected data points
When the curve looks appropriate, click on the green check to accept, which will close the Graph
Mode Editor.
Saving the Trial
When a trial is recorded, it is loaded into one of 12
memory slots. To keep the trial permanently, it must
be saved to the hard disk or to a floppy diskette. If
the “Auto Save” option is chosen in the Setup Box,
then you will be prompted to save the trial after it is
recorded or edited.
See Chapter 7 - Saving Trials.
12
Quick Start Up Instructions
Displaying the
Results
The Three Sub Windows
Click on a sub window’s
toolbar icon to bring that
window to the front.
Chapter 1
There are three sub windows used on the main screen.
1. The Graph Window
2. The Statistics Window
3. The Trials Information Window
Each sub window has a toolbar icon that brings that window to the front of the screen. These
windows can be sized and shaped inside the main screen to best fit it’s contents. The sub windows
can overlap each other and they can be minimized, but they cannot be closed.
The Trials Information Window
This window displays information about the trials
currently loaded in memory. It also provides tools for
managing and displaying trials. The plot mode and
column control which of the loaded trials will be displayed in the
graph and statistic windows.
• Left click in a trial’s Plot? column to change the plot status
of that trial.
POPUP MENUS
When you place the cursor
in one of the sub windows
and Right Click, a Popup
Menu will appear listing all
of the options and functions
available within that specific
sub window.
The Graph Window
Trials that are open and selected to be plotted in the Trials Information Window will be
displayed in the Graph Window. The trials can be displayed in any combination of speed, time,
distance, and acceleration.
• To change the graph type, select the Graph > Graph Type > and select one of the five types.
The various functions and options available under the Graph menu offer flexibility and a high degree of
control over the way the graph is displayed.
The Statistics Window
This window displays a table of the currently active statistics on all of the open and plotted
trials. The statistics can be displayed with the trials in rows or in columns. To transpose the
display, select Stats > Transpose from the main menu or right click with the cursor in the
Statistics window for the popup menu, and then select Transpose.
The Statistics and Graph Windows can be sized
so they both fit on the screen together, or the
Statistics Windows can be pulled to the front so
that it is placed within the Graph Window in an
area that doesn’t block the curve.
Chapter 1
Quick Start Up Instructions
Selecting a Trial
Select a Trial
Before you can perform certain functions (like copying, deleting, reediting or averaging a trial) you
must first select the trial(s) so that the program knows which trials to apply the function. Think of
selecting a trial as highlighting the trial.
A selected trial will show a
“+” next to the trial in the
Current Trials Information
Window and the Statistics
Window.
Statistics
A Trial Can Be Selected by Any of These Actions
• From the Edit menu, choose Select trial to edit > and then select the trial name from the
list of open trials.
• Click on the plotted curve line in the Graph window.
• Click on the trial name in the Statistic window.
• Click on the trial number in the Trial Information window.
Once a trial has been selected, you should see that the plotted line has symbols on it, and the
selected trial will have a “+” sign by it’s listing in the Statistics and the Trials Information Windows.
Choosing Performance Statistics
The Choose Statistics dialog box contains all the
functions required to create, edit, and manage
lists of statistics. To access this box, select Stats
> Setup Stats from the main menu or right click
on the Statistics Window to display the popup
menu and select Setup Stats.
Selecting Statistics
On the left side of the Choose Statistics box is
the current statistic list. Left click on the
individual stats to activate or deactivate the stat.
Creating New Custom Statistics
To save a User Default List
that loads automatically
every time the program is
started - place the cursor
within the current statistic
list and then right click to
open a popup menu. Then
choose Save as User
default.
If the New Statistic page is not visible when the Choose Statistics box is
open, left click on the New Statistic page tab.
To Create a New Statistic
1. Select the type of statistics from the Select Statistics Type list.
2. Enter the starting and ending measurements.
3. Left click on Add to List button. The Add to list, Replace Selection and Activate options
determine how the statistic is entered into the list options, and if the statistic is automatically
activated.
See Chapter 9 for more details on working with statistics.
13
14
Quick Start Up Instructions
Printing
Printing the Results
Chapter 1
The Stalker ATS program will print to any Windows
compatible printer. The output size can be adjusted
(scaled) and color printing will be available if you have a color
printer. You can print any of these results:
• Graphs
• Statistics
• Trial Information
• Comments
• A Brief Report (includes the graph, statistics, and
comments)
Open the Printing Selection Box by Any of the Following:
• Click on the Printer icon from the toolbar.
• From the File menu, choose Print.
• Use the shortcut key combination Ctrl + P.
If you wish to print a title with your graph, type your title into the text box.
To change your specific printer’s functions or to change printers, click on the Setup button to launch
the Windows Print Setup dialog box.
Screen Capture
Built-In Screen Capture Utility
Place a Stalker ATS Graph Into Your Desktop Publishing Program
There is a screen capture utility built into the Stalker ATS program. You can place the entire graph into
a word processor or desktop publishing program just like a photographic scan.
To Capture a Graph
• From the Graph menu, select Copy Graph >
To Clipboard places a copy of the graph in the Windows Clipboard program.
To Bitmap File saves the graph as a standard Windows bitmap graphics file (.BMP).
Help
Help is Built-In
Press F1 anytime you need
help. Context sensitive help
is always available.
Built into the Stalker ATS program is over 100 pages of help documentation. For Context Sensitive
help (help on the specific screen or dialog box you are in), just click on the Help button or press F1.
For general help or to search for help by words or topics, select Help from the Help menu. The
underlined green topics are links to other pages with help on similar topics.
Don’t Stop Reading Here
This chapter is designed to get you running, but be sure to look through the rest of the manual so you
can make full use of the many features of the Stalker ATS program.
Chapter 2
Installation
15
Chapter 2
Installation
Versions of
Stalker ATS
The Versions of Stalker ATS
Version 3.0 and 4.0 are
nearly identical. However
version 4.0 supports long
file names.
Stalker ATS for Windows - Version 3.0
Stalker ATS for Windows is a 16 bit application intended for use with Microsoft Windows 3.1 and
higher, including Microsoft Windows for Workgroups. This version can be installed and run normally
under Windows 95. However, this version will not make use of advanced Windows 95 features such as
long file names.
Stalker ATS is available in two Windows versions. Each is intended for use with different versions of
the Microsoft Windows Operating System. Before attempting installation, please be sure that you
have a version that is appropriate for your computer system.
Stalker ATS for Windows 95 - Version 4.0
Stalker ATS for Windows 95 is a 32 bit application intended for use with Microsoft Windows 95. This is
a true Windows 95 application providing access to long file names and other advanced features of the
operating system.
Installing on Windows NT
If you are using Windows NT, you must use the 32 bit version of Stalker ATS. Depending on which
version of NT you have (i.e. whether you have a Windows-like or a Windows 95-like interface) Stalker
ATS may or may not install automatically on your system. Please contact Radar Sales if you have
difficulties with your Windows NT installation.
Computer
Requirements
Computer Requirements
The following are the minimum and recommended configurations for computers running Stalker ATS.
While Stalker ATS will work on a minimally configured system, it will probably be slow and
cumbersome. The recommended configuration will allow you to operate more efficiently and smoothly.
Laptop computers are generally a must for collecting data in the field.
16
Installation
Computer
Requirements
Processors
IBM compatible computer with 386 or higher processor.
Recommended - 486 DX or Pentium processor.
Chapter 2
Operating System
Microsoft Windows 3.1, Windows for Workgroups, Windows 95 or Windows NT.
Graphics
VGA graphics (640x480 resolution) with monochrome or color monitor.
Recommended - SVGA graphics, and a color monitor.
Memory
4 Mb RAM.
Virtual Memory as recommended by operating system.
Recommended - 8 Mb RAM.
Windows configured with a permanent swap file.
Virtual Memory as recommended by operating system.
Hard Disk
1.5 Mb hard disk space for a typical installation.
10 kb to 500kb for individual data files.
Serial Port
A serial port not used by a modem, mouse or other application.
Mouse
A Windows compatible mouse or point device.
Note: For convenience when working in the field, most functions of Stalker ATS, including data
recording, can be accomplished using the keyboard alone.
Note: Stalker ATS is
distributed on 3.5 inch
diskettes., so a floppy drive
is required for installation. If
you require Stalker ATS on
a different medium, contact
Radar Sales.
Floppy Diskette Drive
3.5 inch, 1.44 Mb floppy drive.
The Bottom Line
If your system can run Windows, it can probably run Stalker ATS. On the other hand, if you have a
386 SX with monochrome screen, 2 Mb RAM and a 40 Mb hard drive, this would be an excellent time
to upgrade.
Chapter 2
Installation
Installation
Procedure
To Install Stalker ATS on Your Computer System
The installation disk has
been configured for Auto
Start under Windows 95. If
you are using Windows 95,
the installation program
may start itself
automatically when you
insert the floppy disk.
17
Windows 3.1X
• Insert the installation disk in your floppy disk drive.
• From the Program Manager Menu, select File > Run.
• Enter a:\setup in the Command Line box. If your floppy drive is not labeled a:, substitute the
appropriate drive letter.
• Press Enter or left click the OK button.
Windows 95
• Insert the installation disk in your floppy disk drive.
• From the Start menu, select Run.
• Enter a:\setup in the Open box. If your floppy drive is not labeled a:, substitute the appropriate
drive letter.
• Press Enter or left click the OK button.
The Stalker ATS Installation Box will appear on your screen.
Make sure that the target drive selected is your hard drive
(usually drive C:). Then select OK.
Special Installations
If you wish to install to another hard drive or to a network drive,
use the list box labeled “Target Drive” at the bottom of the
screen to select another drive. Left click on the down arrow at
the right edge of the list box to display the list of available
drives. Select a drive from the list with a left click.
What Installation Does
A new directory called STALKER is created on the target disk drive. The Stalker ATS program files are
loaded into this directory. A new subdirectory, STALKER\DATA is created which becomes the default
directory for data files.
Some desktop icons are
created so you can access
STALKER ATS easily.
In Windows 3.1X
• A new Program Manager Group called STALKER ATS is created. Icons for the STALKER ATS
program and STALKER ATS HELP are added to this group.
In Windows 95
• A new item called STALKER ATS is added to the Start menu. STALKER ATS and STALKER ATS
HELP are available from this menu item.
• A shortcut to Stalker ATS is placed on the Desktop.
18
Installation
Chapter 2
What Installation Does Not Do
• No changes are made to any of your Windows configuration files (autoexec.bat, config.sys,
win.ini, system.ini, etc.).
• No files are loaded into the Windows directory or anywhere else except the newly created
C:\STALKER directory and it’s subdirectories.
Since the installation program does not change any of your Windows configuration files, and does not
add any files outside of the STALKER directory, it will not affect any other programs or your system
settings.
If you do not have any
previously recorded data
files, you will need to open
sample data files in order to
gain familiarity with the
program.
Sample Data Files
A separate diskette labeled “Sample Data Files” should have been included with
software shipment. These files are actual data recordings of automobiles,
snowmobiles, and personal watercraft.
During installation, you will be asked if you would like to install some sample
data files.
• If you answer Yes, then you will be prompted to insert the sample data diskette and the
sample recordings will be copied into the STALKER\DATA directory.
• If you answer No, no sample data files will be copied. You can still view and work with the
sample data later. To view them later, place the sample diskette into your floppy drive,
choose Open a Data File, and then select a sample file from the floppy drive.
Previous Versions
of Stalker ATS
Installing With Previously Installed Stalker ATS Versions Present
Previous DOS Versions
You can install any Stalker ATS for Windows version and it will not have any effect on a previously
installed DOS version. Both the DOS and Windows versions can be left on the same computer.
Installing Stalker ATS for Windows with an Older Version (V2.0 - V2.30) Present
Installing a new version will update and install all needed files automatically. However, you may wish to
delete the desktop icon from the old version prior to installation so that you always start the newer
version (the executable file for Stalker ATS for Windows V3.0 is “stalker3.exe” where versions less
than 3.0 used “stalker2.exe”)
Installing the Windows 95 Version with a Previous ATS for Windows Version Present
Installing the Stalker ATS for Windows 95 will update and install all needed files automatically, and it
will create a new icon for the Windows 95 version (the Windows 95 Version uses the file named
“stalker4.exe” to run). However, if you previously saved any custom statistic lists from the previous
version (they will be files in the Stalker directory that end with a .SLM extension), those lists will be
incompatible and they should be deleted prior to running the Win95 version.
Chapter 2
Installation
19
Removing Stalker ATS From Your System
Remove Stalker ATS from your system by deleting the STALKER ATS group from Program Manager or
by removing the STALKER ATS group from the Start menu of Windows 95.
If you want to remove Stalker ATS and your radar data from your computer, delete the C:\STALKER
directory from your hard drive. To remove Stalker ATS but keep your data, simply delete all contents of
the STALKER directory except the \DATA subdirectory.
License Agreement
When you install the Stalker ATS software program, you have agreed to accept the terms of the Radar
Sales, Inc. license agreement. If you do not agree with the following terms, return the uninstalled
diskettes to Radar Sales, Inc. for a refund.
The Stalker ATS software
program (including all
versions) is owned by
Radar Sales, Inc. and is
protected by the United
States copyright laws and
international treaty
provisions.
Grant of License
Radar Sales, Inc. grants to the user the rights to:
• Use the Stalker ATS program to record, analyze, and print radar recordings generated from only
one Stalker radar gun.
• The user may install the program on more than one computer, however the user must purchase
an additional copy of the program with each Stalker ATS radar gun that is purchased or used.
The following are expressly prohibited with this grant of license:
• The program may not be used with any other radar system or input device other than a
Stalker ATS Professional radar gun.
• The program may not be reverse engineered, decompiled, or have derivative works created from
the software.
Starting
Stalker ATS
Starting the Stalker ATS Program
In Windows 3.1X
• Open the Stalker ATS group in Program Manager and double click on the Stalker ATS icon,
or • Select File > Run from the Start menu, enter the command C:\stalker\stalker3.exe and press
Enter. If your hard drive is not C:, substitute the appropriate drive letter.
In Windows 95
• Double Click on the Stalker ATS icon on your desktop,
or • Select Programs | Stalker ATS | Stalker ATS 95 from the Start menu,
or • Select Run from the Start menu and open the file C:\stalker\stalker4.exe.
(If your hard drive is not C:, substitute the appropriate drive letter).
After a few moments, a banner announcing the arrival of Stalker ATS to your desktop will appear. The
banner will remain active while Stalker ATS loads and initializes itself. When initialization is complete,
the Stalker ATS Main Screen will appear.
20
The Main Screen
Chapter 3
Chapter 3
The Main Screen
Major Screen Elements
When Stalker ATS first opens, the main screen will look something like this.
Main Menu
Gives complete access to
all important functions.
Toolbar
Provides quick access to the
most common functions.
The Three Sub Windows
These three windows can
be custom sized and placed
anywhere in the main
screen region.
Status Bar
This area displays
S - Current Settings
C - Comments
H - Warnings and
Error Messages
Status Bar Controls
Controls what information is
displayed in the Status Bar
Area.
The actual appearance of the screen will vary depending on whether you are running Windows or
Windows 95, and on the Windows color scheme and fonts you have selected. If your Windows 95
taskbar obstructs the lower screen, see page 70 in troubleshooting to eliminate this problem.
Chapter 3
The Main Screen
The Main Menu
The Main Menu
TIP - You can use the Alt
key together with the
underlined letter of a menu
item to activate that menu
item. For example, to
access the Stats menu,
type the shortcut key
combination Alt and S keys.
File - Functions for opening and closing data files, saving data and printing. You can change the
configuration of Stalker ATS by selecting SETUP from this menu. Also, you can terminate Stalker
ATS by selecting Exit from this menu.
Record - Functions for recording radar gun data using either the radar gun trigger or the
computer’s keyboard to activate recording.
Trials - Functions which act on the currently selected trial (editing, plotting, etc.) or effect the
Trials window display.
Graph - Functions which change the graph displayed in the Graph window or manipulated the
currently displayed data.
Stats - Functions which change the display of performance statistics and manipulate lists of
performance parameters.
Edit - Functions for editing radar data.
View - Functions for determining which objects are displayed on the Stalker ATS main screen.
Help - Functions which provide information about how to use Stalker ATS.
POPUP MENUS
When you place the cursor
in one of the sub windows
and Right Click a Popup
Menu will appear listing all
of the options and functions
available within that specific
sub window.
21
Shortcut Key Combinations
Some frequently used menu functions have “Shortcuts” or key combinations which allow those
functions to be directly activated from the keyboard, without opening a menu. If a menu option has a
shortcut, the key combination used to activate it directly is listed in menu, next to the menu item.
For Example
The first item on the File menu is Open a Data File (Ctrl+O).
The Ctrl+O after the name of the menu item indicates that this
function can be directly accessed from the keyboard using the
combination of the Ctrl and the O keys.
The Alt key will activate the main menus.
The underlining of the O in Open indicates that when the File
menu is open this function can be selected by simply pressing
the O key.
The Toolbar
The Toolbar Icons
The most commonly used functions have a quick access icon on the toolbar.
22
The Three Sub
Windows
Click on a sub window’s
toolbar icon to bring that
window to the front.
The Main Screen
Chapter 3
Opens a data file that has
previously been saved
Opens and brings forward the
Trials Information Window
Saves a trial to the hard drive
or to a floppy diskette
Opens and brings forward
the Graph Window
Opens the Printing Selection Box
to choose a printing option
Opens and brings forward
the Statistics Window
Activates a recording session for
Trigger controlled recording
Opens the Graph Mode Editing Window
to edit the selected trial
Activates a recording session for
Keyboard controlled recording
Opens the Text Mode Editor
to edit the selected trial
The Three Sub Windows
The results of a trial are shown in three sub windows. Each of these windows can be maximized to full
screen, minimized to an icon, or custom sized and shaped.
The Trials Information Window
The Trials Information Window displays information about the trials currently loaded in memory.
It also provides tools for managing and displaying trials.
The Graph Window
Trials that are open and that are selected to be plotted in the Trials Information Window, will be
displayed in the Graph Window. The trial can be displayed in any combination of speed, time,
distance, and acceleration.
The Statistics Window
This window displays a table of the currently active statistics on all of the open and plotted trials.
The trials can be arranged in rows or columns.
Resizing the Display Windows
Like all windows, these sub windows can be sized and shaped appropriately for the data. Do this by
placing the mouse on the frames of the windows,
holding down the left mouse button, and drag the
mouse to resize the box. You can move any of the
windows around the screen by placing the mouse
on the title bar of the window, hold down the left
button, and move the window to a new area.
Chapter 3
The Main Screen
23
Arranging Your Desktop
The three sub windows can be sized and arranged on your desktop to best fit the information currently
displayed. Below are some examples of how the desktop can be viewed.
Just the Graph Window - Full Screen
Graph and Statistics Windows - Split Screen
Statistics In Front of the Graph Window
All Windows - Sized to Share the Screen
The desktop can be
arranged in a nearly
unlimited number of layouts.
Screen Resolution
Your screen display resolution (640 x 480, 800 x 600, or 1024 x 768) will determine how much detail is
available. See your Windows manual for details on setting your display resolution. The above screen
captures were done with the screen set to 1024 x 768 pixels.
24
Status Bar Display
The Main Screen
Chapter 3
The Status Bar
The status bar is used for displaying information relevant to the status, function and control of Stalker
ATS. There are 4 different kinds of status displays that you can select between.
Status Information
Comments and the Time / Date Stamp
Hints
Error Messages
These Buttons Switch the Status Bar Display
To switch between status displays, click on the
appropriate letter from the box to the right of the
status bar area. To display any Error Messages in
the status bar area, select View > Error Messages > in Status Bar.
Error messages will temporarily replace the current status bar selection.
S Status Information
C Comments and the Time / Date Stamp
H Hints
Popup Menus
Popup Menus
Popup menus provide the
quickest access to all
functions available in the
current screen or window.
In all of the sub windows, and many of the dialog boxes, a Popup Menu is available that lists all of the
possible functions that can be selected pertaining to the current screen or window. When you place
the cursor in one of the sub windows or screens, right click to activate the Popup Menu.
There are a few screens where some
functions are only available through the
popup menu.
Right click to activate the
Popup Menu.
Chapter 4
Configuring Stalker ATS
25
Chapter 4
Configuring Stalker ATS
Configurations and Preferences
Many of the settings and features used by Stalker ATS can be adjusted by the user. Most users will
have particular kinds of projects to do and will have their own preferences for things like systems of
units, filters and color schemes. The flexible configuration of Stalker ATS makes it possible to set and
maintain these preferences.
Configuration Files
Configuration Files
Many of the program settings and graph preferences are saved in configuration files. You can save
and recall different configurations of Stalker ATS. This feature enables you to establish settings for
different kinds of tests or operating environments and instantly recall them when required.
Factory Default Configuration
The factory default configuration is permanently stored in Stalker ATS. This configuration reflects the
most common settings. Frequently you will be able to use Stalker ATS without changing to a new
configuration. You can reset Stalker ATS to the factory default configuration by selecting File > Setup
> Reset > to factory defaults from the main menu.
User Default Configuration - Automatically Loaded
You can also have your own default setting, which is called the user default configuration. This file is
saved in the STALKER directory with the name default.cfg. If
you change the setup during a session with Stalker ATS, the
program will ask you on exit, “Keep Changes to Stalker ATS
Setup?” If you respond by left clicking the Yes button or pressing
the Enter key, the new configuration will be saved as the user
default configuration and automatically recalled the next time
you start the program. You can reset Stalker ATS to the user
default configuration by selecting File > Setup > Reset > to user defaults from the main menu.
Custom Configurations
You can save many different configuration files that can be manually loaded for specific situations.
First, choose the desired settings and graph preferences. Then from the Setup Box, click on the SAVE
button. Third, give the configuration file an appropriate name that ends with the file extension .CFG.
To load a custom configuration in future sessions, select File > Setup > Load and choose the custom
configuration file.
26
Configuring Stalker ATS
Chapter 4
Settings Saved in Configuration Files
The information stored in configuration files include settings and graph preferences.
Setup Box Settings
• Input Port
• Units Used by Radar
• Default Data Type
• Speedometer Display
• Default Data Filter
• Display Units
• Color Scheme
• Save Option
• Automatic Graph Editor
• Automatic Comment Screen
Graph Preferences
• Graph Axis
• Symbols
Setup Box
The Setup Dialog Box
Specific pages of the Setup
Box may be accessed
directly from the status bar
buttons by clicking on a
status bar setting.
Accessing the Setup Box
All of the program settings are conveniently controlled in
one screen. The Setup Box can be accessed in two ways.
• Select File > Setup > Change from the main menu.
or • Left click on a setting displayed on the status bar.
Configuration
Settings
Configuration Settings
If you are setting up STATS
for the first time, try a Test
Recording. This will verify
that you have chosen the
correct Input Port.
See Chapter 5 - “Test
Recording.”
• Line Width
Input Port
This list displays the number of the serial port (COM port)
that Stalker ATS is using to communicate with the Radar
Gun. The selected port must correspond to the port address into which the Radar Gun is plugged.
The first time you use Stalker ATS, the Input Port is set to COM 1. You can change the input port by
selecting a new one from the list.
Your computer’s own BIOS program and hardware configuration determine the names assigned to the
serial ports. Most laptops have only one serial port, COM 1. Desktop computer systems usually have
two serial ports (COM 1 and COM 2). Occasionally, you will see configurations that have more serial
ports (COM 3 and COM 4).
The serial port used for the Radar Gun input cannot be shared with another device (a serial mouse,
modem or trackball, for example). Also, the serial port must not be claimed by another software
program. Some software (such as Internet, FAX and other communications programs) may reserve
the serial port even though they are not using it.
If you have trouble receiving radar data or have a warning which says “Invalid COM port” you may
have the system configured for the wrong serial port. Make sure that the Radar Gun is connected to
an available serial port ( i.e. one that is not claimed by a mouse, modem or another Windows
application) and that the Stalker ATS Input Port is set to the correct serial port designation.
Chapter 4
The units in which graphs
and statistics are displayed
can be set independently of
the input units. Therefore, it
is not normally necessary to
change input units.
Configuring Stalker ATS
27
Units Used by Radar
The Stalker ATS Radar Gun is capable of displaying data in three different units: US (mph), METRIC
(kph) and NAUTICAL (knots). For the Stalker ATS program to perform calculations correctly, it must
be told which units the gun is using. Most users record speeds in miles per hour. Both the radar gun
and the software default to this system of units.
If you do decide to use different input units you can change the configuration of the software by
selecting the appropriate units from the list of options. The input units selected must correspond to
the units setting of the Stalker Radar gun.
Using 1/10th Units on the Stalker Gun is Normally Recommended
The radar gun will transmit data with or without a decimal point. When changing units on the Stalker
gun, the units button cycles through the following modes.
• MPH with decimal point
• MPH, no decimal point
• KPH with decimal point
• KPH, no decimal point
• KNOTS with decimal point
• KNOTS, no decimal point
Stalker ATS can accept data in any format. However, greater accuracy is achieved with a decimal
point. When changing units on the radar gun, make sure that the decimal point is showing.
When to Use Whole Units
One case where it may be recommended to NOT use 1/10th units on the gun would be when tracking
objects with EXTREME acceleration (three g’s or more). Internally, the Stalker ATS takes about 240
samples per second in whole units, versus 31.25 samples per second in 1/10th units. The faster
internal sample rate can improve the gun’s ability to track projectile objects (use a BALL setting from
the Stalker gun’s Setup Menu), or targets with very rapid changes in speed. A medium or heavy
digital data filter should be used on whole unit recordings.
The data output rate (and the computer’s data files) of 31.25 samples per second remains the same
regardless of using whole or tenth units.
The “Normal Data Type”
setting will be automatically
used in the Editors, but can
always be manually
changed at the time of
editing.
Normal Data Type
Different kinds of measurement tasks require different data processing techniques. Stalker ATS can
adapt it’s filtering and analytical methods to meet the needs of different measurement applications.
The setting of Normal Data Type determine the kind of data that Stalker ATS expects to receive. The
program will tune it’s data processing to the requirements of the selected data type. You can change
the processing methods and filters applied to your raw data at any time using the edit functions, so this
is not a final commitment. The advantage of giving Stalker ATS some clue about which kind of
measurement you are making is that it can automatically process and analyze your data for you as
you collect it, and without any further intervention.
28
Configuring Stalker ATS
Chapter 4
The Available Data Types
• Acceleration Run - For test runs that start from zero and increase in speed (e.g. Drag Races).
• Deceleration Run - For tests starting at some speed, but slow down to zero speed (Brake Tests).
• Start - Stop - For tests that start and end at zero, with periods of acceleration and deceleration
in between (e.g. combined acceleration / braking tests).
• Constant Speed - For tests that do not start or end at zero speed (e.g. speed detection and
monitoring).
• Bounce - For tests which start at zero speed and where speed may return to zero many times
during the course of a test (e.g. for testing the elasticity of a bouncing object).
• Raw Data - For tests where the raw data from the radar gun needs to be recorded without any
processing or filtering.
• Unknown - Any other kind of recording that does not start or end at zero speed and that requires
only minimal filtering and processing.
See Chapter 6 - “Data File Types” for more information.
Disable Speedometer
If your computer is a
486 / 33 or slower, you
should disable the Radar
Speedometer Display.
In the Setup Box, check this box to disable the Radar Speedometer display
while recording. This may be necessary for acceptable recording on slower
computers.
Under normal operating conditions, Stalker ATS will display a speedometer
while it is recording data. The speedometer provides both analog and digital
displays of the speed currently reported by the radar gun. On slower
computers (386 processors and 486 processors with clock speeds of 33 MHz
or less) and on computers without accelerated graphics (generally older
desktops and laptops) the computer may not be powerful enough to update
the graphics display and read data from the radar gun at the same time.
If you have a problem collecting data, especially if you find that your computer
continues to process and display data for a while after you have released the
trigger, you should disable the speedometer display.
The Medium Digital Filter
smooths out the graph
lines, but does not introduce
a “lag effect” common with
a simple moving average.
Filter Setting
A data filter is a mathematical data smoothing method intended to reduce
variances in speed readings and increase the overall accuracy of graphs and
statistics. The Filter page of the Setup Box determines what filter will be
automatically applied at the time of editing. The filter setting can always be
changed manually when a trial is edited.
The factory default is a Medium Digital Filter. This is recommended for most
applications. See Chapter 6 - “Data Filters” for more details about filters.
Chapter 4
Display units are
independent of the units
used by the radar gun.
Configuring Stalker ATS
29
Display Units
This option is used to determine the system units Stalker ATS will use to display data on graphs. The
units used for display are completely independent of the units used by the radar gun. As long as a
data recording was made with the gun’s units and the Input unit’s setting in the software correctly
matched, Stalker ATS can perform all the required conversions to change the units displayed in a
graph.
The available unit systems, and the units that are displayed on the graph are listed in the table below.
Unit System
US
METRIC
SI (Scientific)
NAUTICAL
Distance Units
Feet
Meters
Meters
Nautical Miles
Speed Units
MPH
KPH
Meters/sec
Knots
Accel. Units
g’s (Gravity)
g’s
Meters/sec/sec
Knots
Time Units
Seconds
Seconds
Seconds
Seconds
Color Scheme
This option is used to change the color scheme of the Stalker ATS screen. The colors used by
Windows applications are to a large extent determined by the operating system and can be changed
through the Windows Control Panel. As a general rule, you should change display color to something
you like using the Windows control panel and leave Stalker ATS on the Window setting.
In the real world of performance testing, however, you will be using Stalker ATS outside in changing
and often poor ambient lighting conditions. The middle of a test series is not a good time to start
messing with the Windows Control Panel. Therefore, Stalker ATS allows you to quickly override parts
of the Windows color scheme. In addition to the “standard” settings, the options include four color
schemes that can help make a small laptop screen more visible in difficult lighting conditions.
Setting the Color Scheme
to Black on White will
provide the highest possible
contrast on laptop screens
for working in sunlight.
The Available Color Combinations
• Windows - Stalker ATS conforms to the desktop colors defined in the Windows Control Panel.
• ATS Standard - Our favorite color combination, very similar to the Windows “Designer” and
Windows 95 “Teal” color schemes.
• Hi Contrast - A nauseous combination of purple, yellow, and black that shows up well on some
monochrome screens. Do not try this color screen if you have a weak stomach.
• Greyscale - Shades of gray for those with VGA monochrome (i.e. 16 shades of gray) laptops.
• Black on White - Black text and lines on a white background. Very useful on some monochrome
laptops and on color screens if lighting conditions are difficult.
• White on Black - White text and lines on a black background. Also useful on some monochrome
laptops and on color screens if lighting conditions are difficult.
The screen will change colors as soon as you select a color scheme. However, if you select CANCEL
to exit the Setup Dialog Box, the original colors will be restored.
30
Configuring Stalker ATS
Chapter 4
Save Options
The Save Options page of the Setup Dialog is used to determine which method of saving freshly
recorded radar data is in use. Stalker ATS will save data automatically or let you do it manually,
depending on how it is configured. Left click on one of the buttons to select an option.
Manual Save
Stalker ATS will not automatically save your data to a
disk file after it is recorded. You must save it
manually. To save a trial, select the trial, then choose
File > Save from the main menu.
Auto Save
Stalker ATS will automatically save your data to a
disk file, using a file name you provide. After you
have collected a trial, a Save Data File dialog box will
appear. Enter a name for the data file and left click
on OK to save your data.
Quick Save
Stalker ATS will automatically save your data to a disk file, using an automatically generated file name
based on the date and time at which the data was collected. This option is useful if you must collect a
series of trials in quick succession and wish to save them to disk file for extra
security. A quick saved file name of 04134834 represents the day of the month
(04), and the military time which was 13:48 and 34 seconds.
Note that recorded data is always preserved as a trial in Stalker ATS memory until you delete it, exit
the system, or until it is overwritten by a new trial.
Record Options
The Record Options page of the Setup Box is used to determine
which screens are automatically opened immediately after
recording a new trial. You can save time in the field by only
selecting the screens that you plan on using.
Saving Your Settings
When you make changes to your configuration settings, you can
save them by clicking on the Save button from the Setup Box.
To save the settings as your user default, save the file name as default.cfg. Or, save your settings
when you exit the program by answering Yes when prompted to keep changes to Stalker ATS Setup.
Chapter 4
Configuring Stalker ATS
Settings on the
Radar Gun
Settings on the Stalker ATS Radar Gun
Any Auto Clear setting other
than 0SEC will cause data
to repeat during dropouts.
31
There are several settings on the Stalker ATS Professional Radar Gun that will effect data recordings.
Auto Clear - Set to 0SEC
The auto clear setting dictates how long a speed reading should
stay on the LCD screen of the radar gun. Since the data output
precisely matches the gun’s screen, anytime a speed is shown on
the screen, it will also be sent to the computer. This setting has a
large impact on recordings when there are momentary “drop outs.”
With the Auto Clear set to zero seconds (0SEC), if the radar gun
loses sight of the target momentarily, the screen will clear, and the
gun will output a speed sample of 0.0. With the Auto Clear set to
one second (1SEC), if the radar loses sight of the target, it will
continue to output the last reading for one second or until a new
speed reading is acquired.
These Are the Available Settings From the Auto Clear Function
• OFF (the gun’s readout will not automatically clear)
• 0SEC (clears in 0 seconds)
• 1SEC (clears in 1 seconds) • 2SEC, 3SEC, & 4SEC (2,3, & 4 seconds to clear)
To the right is a run that had some
momentary dropouts and the Auto Clear had
been set to 1 second (1SEC). Notice how
data points are repeated anytime the radar
gun could not resolve target speed. Had the
recording been made with the Auto Clear at 0
seconds, the dropouts would be represented
as 0.0 mph samples.
When editing a run, Stalker ATS is able to
identify dropouts by 0.0 speed readings and
repeated data points. It will automatically
exclude dropout regions and smoothly
interpolate between the good data points.
Setting the Auto Clear to 0SEC
(0 Seconds) is Always Recommended.
It is much easier for the user to manually edit data in the Graph Mode Editor when drop outs are
represented as 0.0 speed readings.
32
Configuring Stalker ATS
Chapter 4
Peak Mode
The Peak Mode setting on the gun has no effect on the output data.
Range - Set to Hi
The gun should be set for maximum sensitivity except when high interference causes the gun to ghost
read. Set the range to Hi or SEn4 (depending on the gun version).
Setup Menu - High and Low Speed Cutoffs
The cutoff settings can restrict which speeds the gun displays and outputs. For acceleration and
braking tests, the low speed cutoff should be set to zero mph. Set the high speed cutoff to 140 if your
target will not be exceeding 140 mph.
Projectile Testing
If you are tracking baseball pitches or other projectile objects, use the BALL mode settings which are
designed to work best for those type of targets.
Refer to the Stalker ATS radar gun manual for more information on the Setup Menu options.
X-Mit / Hold
The X-Mit / Hold key performs the same function as the gun’s trigger. It turns the transmitter on and
off. If you are hand holding the Stalker gun, it is usually more convenient to transmit by trigger. When
the gun is tripod mounted, then toggle the gun into continuous transmitting operation using the
X-Mit / Hold key.
The Stalker gun always outputs a data stream when it is transmitting - even if no target speeds are
present.
Most Common Stalker Gun Settings
•
•
•
•
•
•
Auto Clear - 0SEC
Units - 1/10th MPH
Setup Menu - H140 / Lo 0
Range - Hi (or SEn4)
Peak Mode - On
X-Mit / Hold - HOLD (Use the trigger to transmit when hand holding the gun).
XMIT (Switch to constantly transmitting when the gun is tripod mounted).
Chapter 5
Recording Data
33
Chapter 5
Recording Data
Stalker Radar Gun Connection
The included cable has a 9 pin male (DE-9P) connector for connecting to the Stalker radar gun and a
9 pin female (DE-9S) connector for mating to the computer’s serial port. This cable will fit the vast
majority of computers. If your serial port does not have a 9 pin male serial port and requires a
different connector (25 pin, for example) you will need to acquire an adapter.
1.
2.
3.
Test Recording
Plug the male end of the cable into the side of the Stalker and tighten the thumbscrews.
Plug the female end of the cable into your serial port and tighten the thumbscrews. You may
need to remove the spacers on the cable.
If you have not used STATS before, try a test recording.
Test Recording
Do a test recording to verify that the radar gun and computer are communicating.
1. Start a trigger activated recording session by any of the following actions
• Press the F2 function key on the computer.
• Select Record > Record - Trigger Activated from the main menu.
• Click on the red toolbar icon “Record radar data (Auto Trigger).”
2. Squeeze the trigger on the radar gun to begin transmitting (XMIT should display on gun).
3. Wave your fingers in front of the gun to generate some speed readings for a short time.
4. If the gun and computer are communicating, the Radar Speedometer window should
change to RECORDING. If the Radar Speedometer continues to display “Press the trigger
on radar gun to start data input,” then press the ESC key to cancel the recording. If the test
failed, first check the cable and connections, then try the other Input Port settings and try
another test recording. See Chapter 4 - “Configuration Settings - Input Port” for more details.
If the Speedometer
changes to RECORDING
but seems to stall, then
disable the speedometer
graphic display through the
Setup Dialog Box.
If you are unable to complete a test recording,
and have tried all of the Input Port settings, refer
to Chapter 11 - Trouble Shooting.
34
Recording Data
Where to Place the
Radar Gun
Where to Place the Radar Gun
Line up the radar with the
direction of travel.
For acceleration tests, place
the gun BEHIND the test
vehicle.
Chapter 5
In order to get accurate test results, the radar must be lined up exactly in the line of travel of the target
object. If the radar is positioned off to one side, an angle error will be introduced to the speed
readings, and the accuracy of the test results will be reduced.
Direction of Travel
Optimal Placement for Acceleration Runs
• 15-30 feet directly behind the starting area.
• If you start with the radar too close to the target, it becomes
more difficult to minimize angles.
• If the radar is placed at extreme distances from the target, the gun will have a
chance of missing some of the low initial speed readings.
Correct
Lined up with the
direction of travel
Incorrect
At an angle to the
direction of travel
greater
Optimal Placement for Braking Tests
• Placement can be either behind or ahead of the test vehicle.
• If the vehicle is approaching the radar, the signal strength will be greater at the critical end of
the test; however, safety could be compromised.
Radar Sensitivity is Reduced at Speeds Below 10 MPH
The sensitivity of the Stalker ATS radar is intentionally reduced at very low speeds. If the sensitivity
did not “roll off” at low speeds, the radar would have a tendency to track blowing sand, or leaves
waving in the wind. So, it is recommended that the portion of the run where the lowest speeds are
measured is the same end of the run that the radar gun is positioned.
In-Vehicle
Recordings
In-Vehicle Recordings
The Stalker ATS gun and computer can also be mounted inside the test vehicle, so that the radar gun
takes it’s reading off the ground and terrain. However, the accuracy of an in-vehicle recording will be
slightly degraded due to angle errors.
Terrain Readings
The Stalker ATS radar gun can track up to nine target speeds simultaneously; however, it will only
display and output the reading of the strongest signal. A radar mounted in the vehicle takes it’s
readings off of the terrain, and there are usually many objects in the terrain that are reflective (like
road signs, trees, bridges, boats, etc.).
Chapter 5
Recording Data
35
Changing Terrain Targets
The problem lies in the fact that many of these reflective objects may be off to the side of the vehicle’s
line of travel. Any readings made with the reflections from terrain objects on the side will be subject to
cosine error, and the reading will be lower than actual. As the vehicle (and radar) travel down the
road, the reading at one instant may come from the road surface directly ahead (which would have
little or no angle error). The next instant, the reading could come from a road sign 10 degrees off to
the right. This reading would be 1.5% lower than actual. (The cosine of 10 degrees is 0.985.)
A Slightly Slower Result
The result will be a recording that has repeating jagged dips, where the curve is temporarily “pulled
down” due to angle errors. A heavy data filter can smooth out the curve, but the average speed
sample will often be about 0.5% low, making the overall curve lower by the same amount.
An Example of In-Vehicle Versus Tripod Mounted Recordings
Below is a test done with two separate Stalker Acceleration Testing Systems measuring the same
vehicle at the same time. One system was tripod mounted on the road surface behind the starting
area. The other system was mounted in the vehicle. The two data recordings were then copied onto
one computer and plotted together. For this example, both recordings were processed with no data
filtering, so the angle error effects can be easily seen.
Twin Recordings Viewed Full Scale
A Close Up View Shows Angle Errors
When the two curves are viewed at full scale, they look very close. Also, the quarter mile times are
within 0.05 seconds of each other. However, if you zoom into a small section of the graph, you can
see how the in-vehicle curve (RUN3IN) is very noisy, and always reads slightly less than the road side
recording.
Sometimes In-Vehicle Recordings Will be the Only Option
In-vehicle recordings may not be as clean or quite as accurate as a tripod mounted test; however,
there may be many test situations (when testing alone) where in-vehicle testing is the best option.
36
Recording Data
Chapter 5
Trigger Versus
Keyboard
Recording
Trigger Versus Keyboard Activated Recording
There are two different options for starting and stopping a recording session.
• Trigger Activated - recording starts when the trigger
on the gun is squeezed.
• Keyboard Activated - recording starts when a
keyboard key is pressed.
Trigger Activated
• The radar gun would normally be hand held.
• Gun must not be in continuous transmitting mode.
• Activate the Radar Speedometer by pressing F2, the trigger record icon, or use the main menu.
• Squeezing the trigger will activate the recording session.
• Continue to hold the trigger for the entire run.
• Release the trigger when target is finished or out of range.
Keyboard Activated
• The radar gun would normally be tripod mounted.
• The gun must be in continuous transmitting mode
(Use the X-Mit / Hold key to switch to XMIT).
• Activate the Radar Speedometer by F3, the keyboard record icon, or use the main menu.
• If you see “Press any key to start data input” then the computer is receiving gun data.
• Use the spacebar, enter key, or a letter key to start and then stop the recording session.
The Radar
Speedometer
The Radar Speedometer
The recording window (Radar Speedometer) must be opened before beginning a recording session.
This window displays the data transmitted from the radar gun and gives simple instructions for starting
and stopping recording.
Initiate the Recording Window by One of These Methods
• Press the F2 button for trigger operation, or the F3 button for keyboard
operation.
• Select a Record option from Record on the main menu.
• Click on the appropriate record icon on the toolbar.
Once the Radar Speedometer is opened, you can begin recording.
The recording window will display an analog speedometer and display the
speed numbers textually.
Note: If the “Disable Speedometer” option on the Radar Input page of the
Setup dialog has been checked, the speedometer display will be replaced
by a message. This may be necessary for acceptable recording on slower
computers. The system will record data normally, however.
Chapter 5
Recording Data
37
Recording
When the system is ready to start recording data, press the radar gun trigger (in trigger-activated
mode) or press any key on the keyboard (in keyboard-activated mode) to start data recording.
You may record continuously for up five minutes. After five minutes, the system will keep recording,
but only the data recorded during the last five minutes will be kept.
To stop recording, release the radar gun trigger (in trigger-activated mode) or press any key on the
keyboard (in keyboard-activated mode).
When to Start
Recording
Starting the recording
before the vehicle moves
does not add any time to
the acceleration curve.
When to Squeeze the Trigger
For acceleration testing, all of the time measurements are based the actual movement curve of the
vehicle or object (target), and is NOT based on when the recording began. So, it is not necessary to
attempt to precisely time the start of the recording session to the start of the target.
• Acceleration Tests START recording BEFORE the target begins to move.
STOP recording AFTER the target reaches the end of the test run or when
the target goes out of the range of the radar gun.
• Braking Tests
START recording at anytime prior to the brakes being applied.
STOP recording only after the target is completely stopped.
Leading Zeros Are Discarded
Any speed readings of zero prior to the vehicle moving are automatically discarded and will not add to
the length of an acceleration recording.
Acceleration Tests That Do Not Start at Zero - Personal Watercraft
When acceleration testing with personal watercraft you can use another technique for starting. Since
most personal watercraft do not have a neutral gear, they will be crawling along at a few miles per hour
whenever they are running, which makes an actual, drag strip type run (from stop) not possible.
It is best to simulate a run from a stop by the following:
• Make sure the file type is set to acceleration run.
• Wait to start recording until the rider applies throttle, or for more precise control, start recording
right away but later edit out any data points prior to the beginning of the acceleration section.
• Let Stalker ATS software extrapolate the motion curve from when acceleration begins (often
about 6 mph) backwards to where the curve would cross zero.
• The result will be a clean acceleration curve starting from zero. Also, all statistics can be
calculated from the predicted zero speed start, with very consistent results.
See the example on the following page.
38
Recording Data
Chapter 5
Cutting Out Data Prior to Acceleration
To get clean acceleration curves on vehicles that do not start from zero, you can wait until the instant
the rider applies the throttle to begin recording. Or, for more precise control, you can record the boat
prior to when the throttle is applied, and using the Graph Mode Editor, exclude all raw data points
below the accelerating part of the curve.
A predicted zero speed
start is the best way to
make accurate acceleration
comparisons on vehicles
that do not start at zero.
Exclude any data points before the area of the
curve where acceleration is consistent.
Let Stalker ATS extrapolate the curve back to
zero to predict a zero speed starting point.
See Chapter 6 - “Graph Mode Editor” for more information on editing data.
After Recording
After Recording
What happens after a recording depends on the way
you have configured Stalker ATS.
If you prefer to edit later to
save time in the field, then
make sure the Auto Edit
option in the Setup Box is
not selected.
Editing
If you have selected Auto Edit (See Setup - Record
Options), Stalker ATS will present your raw and
processed data on a graphical editing screen. You can
use this screen to select and delete raw data points and
to change the way your data is processed.
When you have finished editing, click on the Accept Changes icon to accept the
processing curve. If you would rather edit your data later, still click on the Accept
Changes icon. This will finish processing the trial, and close the Graph Mode
Editor. Rejecting changes will discard the trial, and the information will be lost.
See Chapter 6 for more information about editing.
Chapter 5
There is no limit to the
length of comments that
can be saved with a trial.
Comments can always be
added later.
Recording Data
39
Comments
If you have selected Auto Comment from the Setup Box,
Stalker ATS will automatically open the Enter Comment
dialog box. Type in any comments or notes that you wish
to have stored with your data file. Left click on the OK
button when you have finished entering text. If you do not
have a mouse, use the key sequence TAB > Enter to move focus to the OK button and activate it.
The factory default configuration of Stalker ATS has Auto Comment on. If you rarely enter
comments, bypass this screen by disabling Auto Comment in the Setup Box.
Save the Data to a Disk File
If you have selected Auto Save, (See Setup - Record Options), Stalker ATS will present you with the
“Save a Trial” dialog box so that you can save your data to a file. Give your trial a name and make
sure it’s ends with the file extension .RAD. If you are using Windows 95, you can use a long name (up
to 256 characters). Windows 3.1X is limited to 7 characters.
If you have selected Manual Save, your data will not be
saved unless you select a completed trial and save it.
If you have selected quick save, your data will be
automatically saved to disk using a time-date stamp as
the file name and you will not see a dialog box.
See Chapter 7 - “Saving Trials” for more information.
40
Editing Data
Chapter 6
Chapter 6
Editing Data
Raw Versus
Processed Data
Files
The Two Types of Data Files
The Stalker ATS program creates two different data files for each single recording.
• Raw Data - Contains just the actual speed samples exactly as they were output from the
radar gun. These files have an .RDA file extension.
• Processed Data - Contains a complete table of speed, time, acceleration, and distance numbers
for each sample. The numbers in this file are generated at the time of editing. All of the graphs
and statistics are based on the processed data file. These files have an .RAD file extension.
This system of using two data
files grants the ability to go
back to a recording and reedit
the run.
Both data file types are
required to open and display a
trial. The copy and delete
functions done in the Stalker
ATS program automatically
include both file types.
Editing Data
The Graph Mode and Text Mode Editors in Stalker ATS provide options to:
• Remove bad data points from the raw data.
• Apply one of a selection of data smoothing filters, or no filter at all.
• Select a type-specific data processing method.
• Trim zero data from the beginning and end of the raw data.
• Overwrite specific data points (text editor only).
A trial can be edited immediately after the recording, or it can be reedited at anytime in the future.
Many (if not most) recordings should not need any manual editing by the user. Stalker ATS’s
sophisticated data processing techniques can automatically create the processed data with no help
from the user. Manual editing provides precise control when working with difficult recordings.
Chapter 6
Editing Data
41
Selecting a Trial to Edit
If Auto Edit is selected from the Setup options, when you complete a new recording, the trial will
automatically be loaded into the Graph Mode editing window. To edit a previously recorded trial, first it
must be opened, and it must be selected.
TIP - You can select and
start the Graph Mode
editing window in one step
by double clicking on the
plotted line of a trial.
A trial can be selected by any of these actions:
• From the Edit menu, choose Select Trial to Edit > then select
a trial from the list of open trials.
• Click on the plotted curve line in the Graph window.
• Click on the trial name in the Statistic Window.
• Click on the trial number in the Trial Information Window.
When a trial has been selected you should see that the plotted curve line
has symbols on it, and the selected trial will have a “+” sign by it’s listing in
both the Statistics and the Trials Information Windows. Once you have
selected a trial, you can edit it in either the Graph or Text mode editors.
Graph Mode Editor
The Graph Mode Editor is
the normal editor to use.
Editing a Run in Graph Mode
Once a trial is selected, you may edit the trial in Graph Mode by clicking on the Graph Mode
toolbar icon. Or, choose Edit > Edit selected trial in Graph mode from the main menu.
Graph mode editing allows the results
of editing and processing selections to
be visually inspected as editing
proceeds.
Raw Data Points
Represented as X’s and O’s
• X’s are raw data points that are
not being considered when
creating the processed curve.
• O’s are raw data points that are
being used when creating
the processed curve.
Processed Data
Represented as a blue curve passing
through the data points.
42
Editing Data
Chapter 6
The Graph Mode Editor Toolbar
The toolbar contains all the functions required to edit data.
Include
Help
The zoom button will be
activated only after an area
has been selected with the
mouse.
When zooming into an area
of the graph, if you hold
down the Shift key while
selecting the area, the limits
of the zoomed graph will set
to the nearest tick marks on
the graph.
Data Type Setting
Filter Setting
Zoom Into a
selected area
Exclude
Start Over
Reject
Accept
Zoom Out
(return to full scale)
• The Help button opens the Stalker ATS help file at this page.
• The Data Type selection box displays the currently selected data type. Left click on the down
arrow to select another data type from the list.
• The Filter selection box displays the currently selected filter. Left click on the down arrow to
select another filter from the list.
• The Zoom button zooms (rescales) into the currently selected area. To select the zoom area,
Right Click on the graph and select Scale from the popup menu. The Graph Scale dialog will
appear, allowing you to manually enter the desired axis ranges.
• The Unzoom button restores the original graph display. The Unzoom function is also available on
the popup menu which appears when the mouse is Right Clicked on the graph.
• The Start Over button restores the data type and filter settings to their original values and
undoes any data point selections that have been made since editing began.
• The Reject button restores the original data and closes the edit window. Closing the edit window
has the same effect.
• The Accept button, stores the new processed data and closes the edit window.
Selecting Data Points
To select data points, draw a box around them with the mouse. Left click where you want a corner of
the box to be. Keep the mouse button pressed and move it to the opposite corner of the box. The box
will be drawn on the screen as you move the mouse. Release the mouse when the box includes the
data points you wish to select.
To include the selected data points in the processed data, click the + button on the toolbar. The
data points you have selected will be activated and marked with an O on the graph. The data
will be reprocessed with these points included and a new curve plotted.
To exclude the selected data points in the processed data, click the - button on the toolbar. The
data points you have selected will be deactivated and marked with an X on the graph. The data
will be reprocessed with these points excluded and a new curve plotted.
Chapter 6
Editing Data
43
Examples
In this braking test, some data was recorded after the vehicle stopped. This is easily fixed by selecting
the later data points, and excluding them. The replotted graph smoothly decelerates to zero and stops
abruptly. The ending zero speed readings are automatically discarded.
The objective in the Graph
Mode editor is to turn all of
the good data points to O’s
and any bad points to X’s.
The recording below was particularly noisy as the watercraft approached the very end of the Stalker’s
clocking range. By zooming into a small part of the graph, including all of the samples that were in the
target speed range, and excluding the obviously noisy samples, the processed curve becomes much
more stable. (It is important to note that the Auto Clear setting on the radar gun had been set to 0
seconds for this recording, so any repeated data points were NOT dropouts, but were additional
readings at the same speed. In the first graph, the automatic edit attempt had treated repeated data
points as probable dropouts, so those points were initially excluded.)
44
Text Mode Editor
Editing Data
Chapter 6
Text Mode Editing
Text mode editing allows the numerical values of both raw and processed data to be inspected. The
figure below shows the Text Edit Window. Raw data points are displayed in the table on the left and
the results of processing are displayed in a table on the right. The scroll bar on the right of the display
is used to scroll through the two data tables, which are automatically synchronized.
Use the Text Editor only in
situations where specific
data points need to be
changed in order to correct
unusual trials, or to
synchronize a run with
another data acquisition
system.
Help
Data Type Setting
Filter Setting
Save to Disk
Start Over
Reject
Accept
Process Data
• The Help button opens the Stalker ATS help file at this page.
• The Data Type selection box displays the currently selected data type. Left click on the down
arrow to select another data type from the list.
• The Filter selection box displays the currently selected filter. Left click on the down arrow to
select another filter from the list.
• The Save button displays the comment dialog box so that notes can be added to the data and
then saves both the raw and processed data to a disk file you select.
• The Process button initiates recalculation of the processed data table, using the data type and
filter settings.
• The Start Over button restores the data type and filter settings to their original values and
undoes any data point selections that have been made since editing began.
• The Reject button restores the original data and closes the edit window. Closing the edit window
has the same effect.
• The Accept button stores the new processed data and closes the edit window.
Chapter 6
Editing Data
45
Using the Text Mode Editor
Select the Data Type
The Data Type selection box displays the currently selected data type. Left click on the down arrow
to select another data type from the list.
Select the Filter to be Applied
The Filter selection box displays the currently selected filter. Left click on the down arrow to select
another filter from the list.
Adjustment of the Numerical Values of Individual Raw Data Points
To change a data value in the raw data speed column, left click on it. Edit the data in the cell using
the number keys, Del and Backspace in the normal way. Press Enter or left click to finish editing the
cell.
Process the Data
Left click on the button to process and filter the raw data. Since data points are edited one at a time
in text mode, Stalker ATS does not automatically reprocess newly entered data.
Data Filters
Filters
Data filters generally
increase the accuracy and
improve the look of the
curve.
Stalker ATS has the ability to use various data filters that are applied to the processed data at the time
of editing. The filter has the effect of “smoothing” the speed-time curve, sometimes imperceptibly.
Filtering is useful for several reasons.
• It reduces the effects of “signal noise” (variations in speed) in the radar, such as that caused by
small targets, vibration of intervening objects, and poor environmental conditions.
• It increases the accuracy with which statistics can be calculated.
• It increases the accuracy of acceleration calculations. Any noise in the speed data,
however small, is greatly exaggerated in the acceleration data. The movements of a hand-held
radar gun, for example, can add noise that is of negligible speed but has a significant and
measurable acceleration.
Depending on your measuring environment, you may need more or less
filtering. Stalker ATS allows you to try various filters when you edit your
data. The default filter that is normally applied to new data, is changed in
the Setup dialog box.
The effects of filters is most
noticeable on the
acceleration vs. speed, and
acceleration vs. time
graphs.
Filter Options
• None - keeps the raw data’s exact speed samples
• Digital Filters - Light, Medium, Heavy
• Moving Average - 3 point, 5 point, 7 point, 9 point averages
46
The medium digital filter is
best for most applications.
When editing a trial (in
Graph Mode) you can try
out various filters to see
their effect. Zoom into a
small area of the curve for
the closest inspection.
Editing Data
Chapter 6
Digital Filtering
The digital filter is defined as a fourth order, zero lag Butterworth filter. The advantage of a digital filter
is that it more precisely attenuates noise frequencies while preserving the data frequencies that you
are trying to measure. It’s disadvantage is that it requires extra points at the start and end of a run to
make calculations accurately. Thus the last few samples of your data may be lost or have unusual
characteristics when using digital filters.
• The light setting applies minimal filtering and should only be used on “clean” radar data.
• The medium filter setting is recommended for most applications and will normally produce the
greatest accuracy. This is Stalker ATS’s default setting.
• The heavy filter setting applies a heavy (low cutoff frequency) filter to the raw data. This setting
should normally be used only on very noisy data. This filter setting is especially useful for filtering
out noise due to vibration and when the radar gun is mounted IN the test vehicle. The heavy filter
can have a tendency to overexaggerate a transition from increasing to decreasing speeds.
Moving Average
Data will be smoothed using a moving average. The moving average is less accurate than a digital
filter and does not distinguish precisely between the data and noise components of the radar data.
The advantage of a moving average is that it requires fewer data points to be discarded at the
beginning and end of a trial.
The filter designation indicates the number of data points used to calculate the average. In general,
the higher the designation, the smoother the resulting curves, but the greater the number of points
that must be discarded at the end of the run.
When to Not Use a Filter
No data filter can be used when tracking stable targets that are very close or very reflective to the
radar AND smooth acceleration rate graphs are not required. You may also choose to not use filtering
if the samples at the very end of the run are critical, or if it is very important to keep the actual speed
readings recorded from the radar. Even on very clean recordings, the graphs that include acceleration
rates will tend to look very noisy because the speed samples retain only the original 1/10th mph
resolution. Filtered data will resolve the speed readings to 1/100th mph resolution.
Data File Types
Understanding Data File Types
Different kinds of measurement tasks require different data processing techniques. The Data File Type
setting gives Stalker ATS a clue as to what techniques to use on the given trial. Some of the
processing techniques are:
•
•
•
•
Start or End Extrapolation - predicting how the curve would continue to meet zero.
Interpolation - filling in the curve between data points and dropouts.
Smoothing - applying a data filter to adjust for minute speed variances.
Trimming - cutting off beginning or ending zero speed samples.
Editing Data
47
Setting the Default Data Type
The setting chosen in the Setup Box will
determine the default data type that will be
used when editing trials. The data type can
always be changed in the graph of text mode
editors at the time of editing. Picking the data
type that you most commonly use will save
time.
Available Data Types
• Acceleration Run - for runs that start at (or
near) zero and increase in speed (drag race
style tests).
• Deceleration Run - for runs that start at some speed, but slow down to zero speed (braking tests).
• Start - Stop - for tests that both start and end at zero speed (combined acceleration and braking).
• Constant Speed - for tests that run along at various speeds, but do not include a standing start or a
complete stopping point.
• Bounce - for tests that start at and return to zero multiple times
(testing elasticity of a bouncing object).
• Raw Data - for tests that no processing or smoothing methods are desired.
• Unknown - for constant speed type tests that only filtering is to be used in processing.
-Fill in
Dropouts
(Interpolation)
-Apply Data
Filters
-Measure
Statistics
Acceleration Run
Deceleration Run
Start - Stop
Constant Speed
Bounce
Raw Data
Unknown
-End
Extrapolation
Data Processing Techniques by Data Type
-Start
Extrapolation
Chapter 6
Yes
No
Yes
No
Yes
No
No
No
Yes
Yes
No
Yes
No
No
Yes
Yes
Yes
Yes
Yes
No
No
Yes
Yes
Yes
Yes
Yes
No
Yes
Yes
Yes
Yes
No
No
No
No
48
Working With Data Trials
Chapter 7
Chapter 7
Working With Data Trials
Trials Versus Files
Trials
Stalker ATS defines a trial as the data from a single radar gun recording.
A trial consists of the following information:
• The name of the trial.
• The date and time the trial was recorded.
• Raw data from the recording (speed and time).
• Processed data calculated by Stalker ATS (smoothed speed, distance, acceleration).
• Other status information for internal use by Stalker ATS.
Stalker ATS can store up to 12 trials in memory at any one time. Each trial may contain up to 5
minutes of radar data. Trials can be loaded into memory either by making a radar recording or loading
a data file.
Files
Trials can be permanently stored in your computer as data files. In fact, Stalker ATS uses two files to
store a trial, one containing the raw radar data and one containing processed data. Processed data
files have the extension ‘.RAD’. Raw data files have the extension ‘.RDA’.
Processed Data File (.RAD)
Raw Data File (.RDA)
The first four lines in the raw data
file list information about the run.
1. Stalker ATS Version Number
2. Units Used by Radar
3. Data Type
4. Number of Samples in the File
The processed data file includes the
full table of data coordinates, the
comment field, and more descriptive
run information.
Chapter 7
Working With Data Trials
Opening Data Files
Loading a Data Trial
49
A data trial is loaded into memory when:
• Immediately after it is recorded.
• Opening a previously saved file.
In the Windows 95 version,
you can highlight and open
multiple trials at once.
To Open a Data File
You open (or load) a data file through the “Open
a Data File” dialog box. To open this box:
• Click on the File toolbar icon,
or • Select File > Open a Data File from the
main menu,
or • Use the shortcut combination Ctrl + O.
Select the desired file with the .RAD file extension. The accompanied raw data file (.RDA) will be
automatically included, but only the processed file will be listed.
Current Trials
Information
Current Trials Information Window
The Trials Information Window lists all of the trials that are currently loaded into memory. It also
provides tools for managing and displaying trials.
Trial Number
Indicates the number of the memory buffer in
which the trial is listed.
You can select a trial by
clicking on the trial number.
To select multiple trials, hold
down the Ctrl key while
clicking. To select all trials,
hold down the Shift key
when clicking.
An * (asterisk) preceding the number indicates
that this trial is currently the active trial. The
active trial is generally the most recent one. If
there are gaps in the trials list, new trials will be
loaded after the active trial.
A + (plus) after the trial number indicates that
the trial is selected. Some actions and
commands (for example, editing, copying,
deleting, averaging) act only on selected trials.
Trial Name
This column lists the trial name which is normally the name of the data files associated with the trial.
This name appears on the graph legend, also.
• Left click on the trial name to display and edit the comments associated with the trial.
50
Working With Data Trials
Chapter 7
Type
Lists the data type of the trial (Acceleration Run, Deceleration Run, etc.).
Time
Lists the length of the trial in minutes and seconds.
Saved?
Indicates whether or not this trial has been saved to disk. If any changes are made on a trial
(comments added or if the trial is reedited), the trial would need to be resaved to retain the changes.
• Left click in a trial’s Saved? column to save the data in that trial.
Just click on the word Yes
or No in the plot column to
change the plot status.
Plot?
This column indicates that the trial is currently being graphed in the Graph Window and statistics are
being calculated for the trial in the Statistics Window.
• Left click in the trials Plot? column to change the plot status of that trial.
Plot Mode
The setting of the plot mode buttons determines which trials are automatically displayed in the graph
window. The rules established by the selected plot mode are applied every time a trial selection is
changed. The available settings are:
• Select Each Trial - Only selected
trials will be plotted on the graph.
• Plot All Trials - All loaded trials will be plotted on the graph.
• Plot Current Trial Only - Only the
most recently selected trial
(the “current trial”) will be plotted.
Popup Menu
The Trials Information
window has a popup which
duplicates the Trials menu
portion of the main menu.
To access the popup menu,
right click on the Trials
Information Window.
Squeeze Function
This function squeezes the trials in
memory so that they occupy consecutive
locations in the Trials Information Windows.
Gaps can arise if you delete a trial from
memory.
Stalker ATS will always load data into the
next available slot, and will use up the gaps
if they occur. Squeezing is therefore not
essential to the function of the program.
However, it may make it easier to manage
trials in the Trials Information Window.
Chapter 7
Working With Data Trials
Selecting a Trial
Select a Trial
51
Before you can perform certain functions (like copying, deleting, reediting or averaging a trial) you
must first select the trial(s) so that the program knows which trials to apply the function. Think of
selecting a trial as highlighting the trial.
A selected trial will show a
“+” next to the trial number
in the Trials Information and
Statistics Windows.
Saving a Trial
A Trial Can Be Selected By Any of These Actions
• From the Edit menu, choose Select trial to edit > and then select the trial name from the
list of open trials.
• Click on the plotted curve line in the Graph Window.
• Click on the trial name in the Statistic Window.
• Click on the trial number in the Trials Information Window.
Once a trial has been selected, you should see that the plotted line has symbols on it, and the
selected trial will have a “+” sign by it’s listing in the Statistics and Trials Information Windows.
Saving a Trial
A trial must be saved to a diskette or to the hard drive to retain the trial data for the future. If the Auto
Save or Quick Save options are checked in the Setup Box, new recordings will be saved upon
completion of the run. If manual save is selected, or if changes are made to a previously saved trial,
you will need to save the trial through the “Save a Trial” dialog box.
See Chapter 4 - Save Options for more information.
To Manually Save a Trial
• Click on the “Save Data to Disk” icon on
the toolbar,
or • Select File > Save from the main menu,
or • Use the shortcut key combination Ctrl + S.
The “Save a Trial” and
“Open a Trial” dialog boxes
will appear different when
operating in Windows 3.1,
but the same operations
apply.
The “Save a Trial” Dialog Box
When a trial is saved, you will need to give it a
name and location. The name should include the
.RAD file extension, however Stalker ATS will
automatically add this file extension should you
forget. The default location to save data files is
the STALKER/DATA directory. Stalker ATS will
save two data files (the raw and processed files), however only the processed (.RAD) file will be
shown.
52
Working With Data Trials
Managing Files and
Directories
Managing the Locations of Data Files
Chapter 7
The default location new data files are saved to is C:\STALKER\DATA (the Data subdirectory under the
Stalker directory). When a trial is saved, any location can be selected from the available drives. To
help organize the files, it is a good idea to create custom subdirectories (folders).
For example, if you are performing brake testing and acceleration testing, you could create two new
folders called “Braking” and “Acceleration” and store your files in these appropriate locations. Many
new folders (or subdirectories) can be created to help you organize your data.
To Create a New Subdirectory
In Windows 95
• Open the Windows Explorer Program by
clicking on the Start button > Programs
and then select Windows Explorer.
• Locate and expand the Stalker folder on
the left screen split by double clicking on
stalker.
• Highlight the Data subdirectory by
clicking on it. You should see the folder
icon next to Data is open.
• From Explorer’s menu select File > New
> Folder.
• Type in a name for your new folder on
the right side of the split. Press Enter
when completed.
In Windows 3.1X
• Open the File Manager from the Main group.
• Select File > Create Directory.
• Then type in the name of the new directory (C:\STALKER\DATA\BRAKING)
[To quickly create the subdirectory, first highlight C:\STALKER\DATA from the tree, then you only
need to type in the name of the new subdirectory you are creating (BRAKING)].
Copying and Moving Data Files
You can use Stalker ATS to move around your data files, or you can use Explorer or File Manager. If
you move, copy, or delete files from Stalker ATS, both the raw (.RDA) and processed (.RAD) files will
be included together automatically. When using Explorer and File Manager, be sure to choose both
file types in your operations.
Chapter 7
Working With Data Trials
53
Copying a Trial
Stalker ATS can save a copy of a trial (both .RDA and .RAD files) in a new location.
1. Select File > Copy a data file from the main menu.
2. Select the trial you wish to copy and click on Open.
3. Select the new location from the “Copy files to...” dialog box, then click on OK.
Deleting a Data File
You can permanently delete data files, even if the data is not loaded into Stalker ATS memory.
To delete a file:
• Select File > Delete a data file from the main menu.
• Locate and select the file you wish to delete from the “Select a data file to delete” dialog box.
• Click on the Open button.
Both .RDA and .RAD files will be permanently deleted from the drive. If the particular trial is currently
open, the delete function will also be available from the Trials Information Window’s popup menu.
Closing a Trial
Closing a trial is the process of clearing an open trial from memory. If a trial that has not been saved
is closed, the run will be lost. However, if the trial is saved, closing the trial does not delete the file
from the disk.
You can close a trial(s) through the Trials Information Window’s
popup menu.
1. First select the desired trial(s) to close.
2. Then right click to bring up the popup menu.
3. Choose Selection > Delete > from Memory.
(Or, after step 1, use the shortcut key combination
Shift + Delete.)
To close all open trials, select File > Close All Trials from the
main menu.
54
Working With Data Trials
Averaging Trials
Averaging Trials
Chapter 7
Stalker ATS can create a new file that is an average of two or more trials.
Averaging several trials
together is the best method
to factor out small variances
such as wind.
To Create an Averaged Trial
1. Open all of the trials you wish to average.
2. From the Trials Information Window, select
two or more of the open trials by holding down
the Ctrl key and clicking on the trial numbers.
3. From the main menu or the popup menu,
choose Trials > Selection > Average.
The new trial is displayed on the graph and given
the default name “Average.” The trial is given a
comment annotation which lists the trials that were
used to form the average. The time/date stamp of
the new trial reflects the time the average was
calculated, not the times the original radar data
were recorded. The average trial is not saved to disk automatically. Averaged trials cannot be
reedited because there is no actual “raw” data file.
Statistics Will Not Average Exactly
Average trials are created by averaging the processed speed tables from the selected trials. This new
speed table (similar to a raw file) is then processed to create a complete processed average trial.
The measured statistics of an averaged trial may not necessarily be the numeric average of the same
statistics from the original trials. Averaged stats that are measurements of “speed at time” may end up
at a precise numeric average, but most other stats will vary slightly. Peak speed measurements will
definitely vary because the peak speed stats from each trial usually occur at different times.
Chapter 8
Working With Graphs
55
Chapter 8
Working With Graphs
The Graph Window
Displaying the Results
Stalker ATS displays speed, time, acceleration, and distance information as a line chart in the graph
window. Various functions and options available in Stalker ATS offer flexibility and a high degree of
control over the way the graph is displayed.
The graph window is automatically displayed when data is loaded or recorded. If it is not visible,
left click the graph icon on the toolbar or double click the graph icon in the main window.
Like all windows, the Graph Window can be maximized to full screen, minimized to an icon, or custom
sized to any shape in between. Place the cursor on the window frame to custom size the window.
Graph POPUP Menu
Place the cursor in the
Graph Window, and right
click to display the popup
menu. This popup menu
gives you quick access to
all available functions
pertaining to graphs.
56
Working With Graphs
Graph Types
Graph Types
Chapter 8
Stalker ATS can plot a results curve in five different formats.
• Speed versus Time
• Speed versus Distance
• Distance versus Time
• Acceleration versus Time
• Acceleration versus Distance
To change the graph type, select Graph > Graph Type from the main menu (or the graph popup
menu), and choose a new graph type. The default graph type is Speed versus Time.
Graph Scales
The scaling of the graph refers to the range of numbers on the axes. Graphs can be scaled one of
three ways:
• Automatic Scale - Stalker ATS chooses an appropriate scale based on the data.
• Manual Scale - You can select specific axis ranges in the Graph Scale Dialog Boxes.
• Zoom Scale - You can “zoom” into an area of a graph.
Automatic Scaling
Stalker ATS will automatically pick an axis range based on the range of the
data. Auto scaling is automatically used when the Stalker ATS program is
started.
Manual Scaling
To manually scale the axis range, choose Scale from the Graph menu or from
the graph popup menu. A Graph Scale box will appear with the two units
found in the currently displayed graph type. Set the button to Manual, and
enter in the desired axis speed range. Click on OK. The graph will be redrawn
with the new scale.
Zoom Scaling
To “zoom” into an area of the graph, use the mouse to select an area of the graph:
1. Place the cursor on one area of the graph.
2. Press and hold down the left mouse button.
3. While the left button is held down, move the cursor to another portion of the graph. You should
see a black region area being defined as the cursor is moved.
4. When you have created the desired zoom area, release the mouse button. The graph should
then be rescaled to the specific region you outlined.
The zoomed axis range will also be listed in the Graph Scale dialog boxes.
Chapter 8
Working With Graphs
Zoom Scaling
Zoom Scale Example
Draw a region around the shift point to zoom in for a closer look. To return to full scale, select
UnZoom from the Graph menu, or simply press the Esc (Escape) key.
Press the Esc key to
Unzoom.
Scale Limits
There are limits to how small the axes can be set.
• Time - 0.5 Seconds
• Distance - 6 Feet
• Speed - 1 MPH
• Acceleration - 0.05 g’s
Graph Style
Changing the Look of Graphs
Graph style preferences are
remembered in the Stalker
ATS configuration files, so
the same preferences will
be loaded each time the
program is opened.
The look of graphs can be changed in terms of:
• Axis Style
• Symbols
• Line Widths
To change these styles select Graph Style > from the
popup menu or below Graphs on the main menu.
Axis Style
This function controls the number of axis lines that are on the graph.
57
58
Working With Graphs
Chapter 8
Symbols
Symbols can be used to help denote specific trials when multiple trials are plotted. If you are printing
to a black and white printer, symbols will help match the curves with the trial names.
Line Width
The line width settings adjust the thickness of the curve lines used on the graphs. Thin lines show
more detail, thick lines are easier to see. To change the line widths, select Graph Style > Line Width
from the Graph menu.
Read Coordinates
Reading Coordinates Off the Graph
The Read Coordinates function on the Graph menu opens the Read Graph Window for displaying the
values of data points currently plotted on the screen. To read values:
• Select the Read Coordinates function on the Graph menu.
• Place the cursor on part of the line and left click.
• The left and right arrow keys move the point across the screen.
• The up and down arrow keys switch between different trials that are plotted on the graph.
Chapter 8
Working With Graphs
Averaging a Region
of a Graph
Take an Average from the Graph
59
A region of the graph can be averaged. This can be very useful in determining the average top speed
of a vehicle over a period of time or distance.
To Average a Region
1. Hold down the Alt key.
2. Place the mouse to the left side of the region to be averaged.
3. Press and hold the left mouse button down.
4. Drag the mouse to the right side of the region to average.
5. Release the mouse button and the Alt key.
A window containing average values of each trial in the selected region will appear.
TIP: If you want to take averages of specific regions, you could first manually scale the graph to only
include the exact region you wish to average, and then you would drag the mouse across the entire
graph. Or, you can hold down the Shift key along with the Alt key to select a region with major axis
borders.
60
Measuring Statistics
Chapter 9
Chapter 9
Measuring Statistics
Statistics
Possibly the most useful capability of Stalker ATS is the ability to measure performance statistics from
trials. Statistics are based on the processed data and they are defined in the Choose Statistics dialog
box. Statistics are then displayed in the Statistics Window. Since a trial contains the complete picture
of the run, measurements of all kinds can be calculated.
The Statistics
Window
The Statistics Window
This window displays a table of the currently active statistics for each plotted trial. To bring the
Statistics Window to the front of your screen, left click on the statistic toolbar icon (a Greek
sum sign).
The Statistics Window can maximized to full screen, minimized to an icon, or custom sized to fit the
amount of data.
The Statistics Window can share the screen
with the Graph Window.
Or, Statistics can overlap the Graph Window.
Chapter 9
Measuring Statistics
61
Switching Rows and Columns
The table of statistics can be grouped with trials in
columns or rows (referred to as the format). To
change the format, select Transpose from the
Stats menu or the Statistics Window popup menu
(Right click for the statistics popup menu). The
format can also be changed in the Choose
Statistics dialog box at the Format tabbed page.
• Left click on the in Columns box to display the statistics in columns and the trials in rows.
• Left click on the in Rows box to display the statistics in rows and the trials in columns.
Choosing Statistics
Choosing Which Statistics to Display
The Choose Statistics dialog provides functions for the management of statistics
lists and the creation of custom statistics, as well as duplicating many of the
functions available in the Stats menu and the Statistics Window.
To open the Choose Statistics dialog, select Stats > Setup Stats from the main
menu. Or, right click in the Statistics Window to display the statistics popup menu
and select Setup Stats.
The Name of the Current
List of Statistics
Current List of Statistics
The dialog has three zones. To
the left is the current statistics
list. On the lower right is a
collection of buttons which
perform various functions.
Above the buttons is a tabbed
dialog box with three pages
labeled Format, Rollout and
New Statistic.
Three Tabbed Pages:
Format, Rollout, New Statistics
Function Buttons
The active statistics are the ones highlighted. To activate (or deactivate) a statistic, simply left click on
the individual statistic to change it’s status.
62
Measuring Statistics
Creating Custom
Statistics
Creating Custom Statistics
Chapter 9
The list of possible statistics is not limited to the factory default list. You can set up your own
measurement parameters through the New Statistic page from the Choose Statistics dialog box.
Nearly any possible measurement can be made.
To Create a New Statistic
1.
2.
3.
4.
5.
(If
Select the desired Type of statistic from the New Statistic tabbed page. (see the examples)
Enter in the point to begin the measurement at (Start Measurement At:).
Enter in the ending point for the measurement (End Measurement At:).
Add it to the current list by clicking on the Add to list button.
Make sure your new statistic is activated (highlighted) on the list.
the Activate box was checked when it was added, it will be activated automatically.)
Select Statistic Type
Speed at Distance - measures the speed increment between two distance markers.
Examples:
0 - 500 feet speed, the speed increase over the first 500 feet of the run.
1320 - 2640 feet speed, the speed change during the second ¼ mile of the run.
Time at Distance - measures the time increment between two distance markers.
Examples:
0 - 1320 feet time, the elapsed time for a quarter mile run from a standing start.
1320 - 2640 feet time, the elapsed time over the second ¼ mile of a run.
Time at Speed - measures the time increment between two speed transitions.
Examples:
0 - 60 mph time, the time taken to accelerate from rest to 60 mph.
30 - 50 mph time, the time taken to accelerate from 30 to 50 mph.
Distance at Speed - measures the distance traversed between two speed transitions.
Examples:
0 - 60 mph distance, the distance required to accelerate from 0 mph to 60 mph.
30 - 0 mph distance, the braking distance from 30 mph to a stop.
Speed at Time - measures the recorded speed after a specified elapsed time, or the speed
change between two time points.
Examples:
0 - 6 sec speed, the speed achieved after 6 seconds of elapsed time.
60 - 120 sec, the speed change during the second minute of a run.
Distance at Time - measures the recorded distance after a specified elapsed time, or the
distance travelled between two time points.
Examples:
0 - 5 sec distance, the distance travelled after 5 seconds of elapsed time.
60 - 120 sec distance, the distance traveled during the second minute of a run.
Chapter 9
Measuring Statistics
Use the Tab key to quickly
toggle between the Start
and End settings.
Start Measurement At
The entry in this box defines the starting point of the
statistic calculation. To change the number you can
highlight the entry and over-type it, or use the up and
down buttons to scroll to the desired number.
63
End Measurement At
The entry in this box defines the end point of the statistic
calculation.
Add to List “Radio Button” Setting
If this option is selected, the new statistic will be entered in an empty space in the statistics list when
the Add to List button is clicked.
Replace Selection
If this option is selected, the new statistic will replace the most recently selected item in the statistic list
when the Add to List button is clicked.
Activate
If this box is checked, the new statistics will be activated as soon as it is added to the statistics list. It
will be highlighted in the list and the calculated values of the statistics will be displayed in the Statistics
Window.
Popup Menu
Some functions are only
available through the popup
menu.
To activate the Choose Statistics popup menu, place the cursor somewhere on the current list of
statistics and right click.
Clear Selection - deactivates all
highlighted statistics.
Invert Selection - changes the activate
status on all statistics.
Select All - activates all statistics.
Delete Selected Stats - removes any
highlighted statistics from the list.
Restore Defaults - loads either the
user or the original factory lists.
Save as User Defaults - saves the
current list as default.slm (which is
loaded automatically at start-up).
New List - loads a blank list that can be
filled with new statistics.
64
Measuring Statistics
Chapter 9
Rollout Distances
Rollout Distances
Rollouts have a huge effect
on statistics. Since the
progress at start of a race
is the slowest, a one foot
rollout could easily effect
times by 1/3rd of a second!
Many types of testing equipment begin a test only after the
vehicle has moved a certain distance. By programming in
a specific rollout distance, Stalker ATS is able to mimic the
timing methodology used by these other testing systems.
When a rollout distance is specified, Stalker ATS will base
the statistics starting from the moment the vehicle has
moved the rollout distance.
For example, some official timing systems use a 1 foot
rollout distance. All NHRA sanctioned drag strips use optical timing systems that start measurements
after one foot of rollout. So, the NHRA ¼ mile time is the time taken to travel from 1 foot to 1321 feet
(¼ mile + 1 foot). Since optical timing systems cannot measure instantaneous velocity, the NHRA also
figures the “trap speed” as the average velocity over the last 66 feet of the test (which would between
1255 - 1321 feet). The factory default list includes statistics to match an NHRA timing system.
When no rollout distance is used, Stalker ATS will base measurements on the instant the vehicle
begins to move. This measurement criteria meets the actual definitions of the statistics.
Managing
Statistic Lists
Statistic Lists
Different lists of statistics can be created and saved. This can be useful if you perform various types
of testing that use different statistics. Simply create and save the desired lists, then a list can be
loaded later, eliminating the need to recreate custom statistics. There is no limit to the number of
custom lists that can be saved. However, there is a limit of 20 individual statistics per list.
Three Types of Statistic Lists
• Factory Default List - this list is embedded into the program and cannot be erased.
• User Default List - save your most common list as the user default. This list loads automatically.
• Custom Lists - create and save lists that can be loaded in the future.
Factory Default List
The factory default list contains 17 commonly used measurements and has 3 available slots for new
statistics. The factory list includes Peak Speed and Peak Speed Time. These two statistics cannot be
recreated from the New Statistics page.
To Restore the Factory Default List
1. Open the Choose Statistics dialog
(select Stats > Setup Stats from the main menu).
2. Open the popup menu by right clicking on the current
statistic list.
3. Choose Restore Defaults > Factory Defaults from the
popup menu.
Chapter 9
Name a list default.slm to
have it loaded automatically.
Measuring Statistics
65
User Defaults
Save your most commonly used list of statistics as the “User Default” list.
This list will automatically be loaded each time you start the Stalker ATS
program.
To Save the User Default List
1. Set up a statistic list to your preferences.
2. Open the popup menu from the Choose Statistics dialog.
3. Select Save as User defaults from the popup menu.
(You can also save the list normally, but give the list the name default.slm.)
Custom Statistic Lists
You can create and save as many lists of statistics as you
wish. Then you can load these lists when working on
trials appropriate for the custom statistic list.
To Save a Custom Statistic List
1. Setup a statistic list to your preferences
(you can modify another list, or start with a new list).
2. Click on the “Save List” button
(in the Choose Statistics dialog box).
3. Enter a name for your list that ends with the
.SLM (statistic list menu) file extension.
Save your statistic lists in the STALKER directory.
If you name a list default.slm it will become your user default list that will be loaded automatically
when the program starts.
Loading Statistic Lists
To load (recall) a specific list of statistics, use the Load List option from the
Stats menu heading. Or, you can click on the Load List button
located in the Choose Statistics dialog box.
To include “Peak Speed”
statistics on a custom list,
Modify the Factory Default
statistic list.
How to Include “Peak Speed” Statistics in Custom Lists
The “Peak Speed” and “Peak Speed Time” statistics cannot be created from the New Statistic page.
So if you would like to include those statistics in a custom list, you will need to modify the factory
default list.
1. Load the factory default list (see page 64).
2. Activate all of the stats that you do not wish to keep (make sure the peak stats are not active).
3. Open the popup menu by right clicking on the statistic list.
4. Select Delete Selected Stats from the popup menu, leaving only stats you wish to keep.
5. Create and add any new statistics you desire.
6. When the list is complete, click on the Save List button, and give your list a new name.
66
Printing
Chapter 10
Chapter 10
Printing
The information displayed in the Graph, Trials and Statistics Windows can be output to your printer.
Printing can be controlled with the Print dialog or by using the print commands associated with
individual windows. The output size can be adjusted (scaled) and color printing will be available if you
have a color printer.
The Print Dialog
The Print Dialog
The Print dialog provides complete control over which
information is printed in your report. Using the print dialog,
you can enter a title for your printout, select which the items to be
printed and change your printer setup.
To Launch the Print Dialog
• Select File > Print from the main menu
or • Left click on the toolbar print icon.
or • Use the shortcut key combination Ctrl + P.
Title
Enter a title in the text box. This title will be printed at the top of each page of your printed reports.
Select Items to Print
Click on a check box to select or deselect an item for printing. If a box is checked, the associated item
is printed when you left click on the OK button.
The Available Items
• Brief Report - A two-page summary of your data, including the graph, statistics, and comments.
• Graph - Prints a copy of the currently displayed graph on it’s own page. To print a smaller graph,
change the value of the % scale in the box adjacent to the Graph selection.
• Statistics - Prints a copy of the statistics table. If you have more than six statistics, you may
need to group (format) your stats In Rows. (see page 61)
• Trials Information - Prints a copy of the trials information table.
• Comments - Prints the comments and annotations associated with each of the trials in memory.
OK
Left click on this button to send the selected items to your printer.
Chapter 10
Printing
67
Cancel
Left click on this button to close the Print dialog without printing anything.
Setup
Left click on this button to launch the Windows Print Setup dialog. This dialog
provides tools for changing the setup of your printer or selecting another printer.
Help
Left click on this button to display the help information.
Selected Trials Have Symbols That Will Be Printed
If a trial is selected at the time of printing (or screen capturing), like the screen image, symbols will be
plotted along with the line of any selected trials. Make sure no trials are selected by clicking on an
outside region of the graph until no trials are selected.
Screen Capture
Place a Stalker ATS Graph Into Your Desktop Publishing Program
Use the Copy Graph
function to take a
“snapshot” of the graph that
can be placed into other
programs. This is a high
resolution capture and it
retains all of the colors.
There is a screen capture utility built into the Stalker ATS
program. You can place the entire graph into a word
processor or desktop publishing program just like a
photographic scan.
To Capture the Graph
From the Graph menu, select Copy Graph >.
• To Clipboard places a copy of the graph in the
Windows Clipboard program.
• To Bitmap File saves the graph as a standard
Windows bitmap graphics file (.BMP).
Use the Paste command in
most programs to “dump”
the clipboard contents into
your publishing programs.
Tips For Making the Best Possible Screen Captures
The quality of the graph bitmap that can be exported to other programs depends upon the size and
detail of the current Graph Window. The actual byte size of the file will depend on the screen
resolution and Graph Window size.
1. Set your computer’s video display setting to the highest resolution available.
• The most common (and the lowest) resolution is VGA (640 x 480 pixels).
• A better setting would be SVGA (800 x 600).
• Higher resolutions like 1024 x 768 may be available on higher performance computers.
• These settings are changed in the Windows Control Panel under Display.
2. Maximize the size of the Graph Window so it is as large as possible.
3. Be sure that the line width, axis style, and legend is to your liking.
68
Troubleshooting
Chapter 11
Chapter 11
Troubleshooting
This Chapter
This chapter is designed to help you if you encounter problems while using Stalker ATS for Windows.
Help
Built-In Help
Stalker ATS was nearly 100 pages of help screens written into the program. The help system provides
detailed documentation on the installation and use of STATS. You can access the help system in a
number of ways.
On-line Help (Ctrl+H)
This help file can be accessed from the Stalker ATS menu. Select Help > Help or press Ctrl + H. The
contents page of this help file will appear. Select Help > How to Use Help from the main menu to get
more information about using the Windows Help System.
Press the F1 key at any
time to get context sensitive
help.
The underlined green
headings are links to
related topics. Click on the
heading to switch topics.
Context Sensitive Help (F1)
STALKER ATS has “context sensitive” help. This means that
detailed help about the actions you are performing (or trying to
perform) is available at almost any time. Context sensitive
help can be accessed in two ways.
• If a Help button one is visible in the window you are
working with, left click on it.
• Press F1 at any time to get help on your most
recent action.
For example, if you click on the HELP button or press F1 while
working with the Setup window, a help window will open at the
page describing how to use Setup. Similarly, if you press F1
while the mouse is positioned in the Statistics Window, your
Help System will display information about statistics.
The Help File
This help file can also be used as an “on-line manual” without
running Stalker ATS. To access this file directly double click
on the Stalker ATS Help icon in Program Manager.
(Windows 95 users may select Stalker ATS Help from the
Start Menu.)
Chapter 11
Troubleshooting
69
Hints
Hints are brief descriptions of functions that appear in little
boxes on the screen. Point the mouse at floppy disk icon on
the toolbar, for example and after a moment a hint box will
appear with the message “Save data file to disk file”.
Hints may also be displayed on the Status Bar at the bottom of the screen. Left click on the H button
at the bottom right corner of the screen and hints will be displayed continuously as the mouse moves
around the screen and the menu system. You may like to keep the Status Bar hints active the first few
times you use STALKER ATS until you become more familiar with the different operations. If you find
that hints are more annoying than they are helpful, select Help > Hints from the main menu to turn
them off.
Troubleshooting
Index
Troubleshooting Index
• Gun and Computer Will Not Communicate
• Windows 95 Taskbar Obstructs the Screen
• Program Stalls When Recording
• Program Locks Up
• Error Messages
• Quirks in the Processed Data
• Statistics Do Not Match Another Timing System
• Printing Problems
• Cannot Open a Radar Data File
• The Help File is Not Found
• Contacting Radar Sales, Inc.
70
70
71
71
71
71
71
72
72
72
73
70
Troubleshooting
Chapter 11
The Gun and Computer Will Not Communicate
First make sure you have read the Input Port section in Chapter 4 (page 26). If you are still unable to
get the Stalker radar gun and the computer talking, it will most likely be one of three reasons.
1. Computer Settings - the correct input port is not selected, or the com port is unavailable.
2. Bad Cable - the serial cable could be broken or defective.
3. Radar Gun - there may be no data output from the radar gun.
Computer Settings
By far the most common cause for communication problems is with computer settings. First attempt a
test recording with every input port option (set at the Radar Input page of the Setup Box). Second,
check to make sure no other hardware (mouse, or modem) is using or claiming the address for the
serial port. Third, check to see is the computer’s BIOS program is assigning a correct name and
address to the port, and that the BIOS is enabling the port at all times. Some power management
systems (usually controlled in the BIOS program) turn off the serial port when it is not in use to save
battery life. Try turning off all power management functions to eliminate this as a possible problem.
Refer to your computer’s manuals for information on the BIOS program. Often, to gain access to the
BIOS program, you must type F2 or F10 during the boot up period.
Bad Cable
Serial cables are cheap, both in price and often in quality. In may not be a bad idea to purchase
another cable just to rule out the cable as the cause of the problem. If you have been trying to link
cables together to gain length, use only one cable that is no more than 10 feet long. You could also
rule out the cable by using the cable with another system.
Radar Gun
If you have access to another computer, install Stalker ATS software on another computer and try a
test recording. If you are successful, then you can rule out the radar gun and the cable. If you cannot
get the gun to talk to another computer then it is possible the problem may be in the Stalker radar gun.
Over the years, Radar Sales has tracked about 0.75 percent failure related to data output. It is rare,
but not impossible for the problem to be in the gun.
If all else fails, you could ship your gun and computer to Radar Sales for diagnosis and setup.
Windows 95 Taskbar Obstructs the Screen
Stalker ATS for Windows
95 is designed to maximize
upon opening. If the
Windows 95 taskbar is not
set to Auto Hide, it will obstruct any windows that are maximized. There are two ways to fix this: you
can manually resize Stalker ATS so it the bottom edge is above the taskbar. Or, (this is the best
option) you can set the taskbar to auto hide, which will make the taskbar disappear when not in use.
Chapter 11
Troubleshooting
71
Auto Hide the Taskbar to Prevent Obstruction
1. Left click on the Windows 95 Start button.
2. Choose Settings and then Taskbar. This opens the Taskbar Properties box.
3. Check the Auto Hide option. This makes the bar disappear when not in use.
Program Stalls When Recording
If when attempting a recording, the text under the Radar Speedometer changes to recording, but then
locks or stalls the program, the problem is most like CPU power. You will need to disable the graphical
radar speedometer during recording sessions. Do this by checking the Disable Speedometer option
in the Setup Dialog Box.
Program Locks Up
Distribution versions of Stalker ATS have been tested on hundreds of different computer platforms,
and there should be no program crashes. If there is a crash, first make sure that you do not have a
conflicting default.slm or default.cfg file from an older version of Stalker ATS. Open Microsoft’s
Explorer program or the File Manager and look for files named default.slm or default.cfg in the
Stalker directory. Move these file(s) to another directory or subdirectory and restart Stalker ATS. If
the problem is fixed, then delete the file(s). You may then wish to recreate your users default statistic
list (see chapter 9). The default.cfg will be recreated when you exit Stalker ATS and answer Yes to the
question “Keep Changes to Stalker ATS Setup?”
If you continue to have any program crashes contact Radar Sales, Inc.
Error Messages
For space reasons, we will not list the 40 plus error messages that could be displayed in Stalker ATS.
For a detailed explanation of an error message, open the on screen help system, and search under
“error messages.” Toggle through the list to read about any messages that may appear.
Processed Data Curves Have Quirks at the Beginning or End
Stalker ATS uses various mathematical filtering techniques that can adversely effect some data points
at the beginning or end of trials. If you experience problems where trials start or end unusually, reedit
the trial (in Graph Mode) and exclude some data points around the area of trouble. Or, you could
experiment with using no filter on the trial.
Statistics Do No Match Another Timing System
First read the “Rollout” section in Chapter 9, and make sure the two timing systems are using the
same rollout distances. Stalker ATS can be accurate to about 1/100th second on good recordings
(recordings that include all of the start, have few dropouts, are clean, and are filtered appropriately).
Various filters can effect statistics by several hundredths of a second, and extended extrapolation at
the start might produce a curve that doesn’t accurately represent the actual motion at the start.
72
Troubleshooting
Chapter 11
Printing Problems
There are more variables with printers and printer drivers, than in any other area of computing.
Stalker ATS has been tested with a few dozen printers, but that only represents a fraction of the
available printers. Theoretically, the Windows environment makes printing a function of Windows, so
application programs need not be aware of the zillions of variables. However, the real world dictates
otherwise.
Statistics Do Not Fit on a Page
Set the statistic format to Rows if you are printing more that six stats at a time (See page 61).
Symbols Are Included on the Graphs
Before printing, make sure that no trials are currently selected (See page 51).
If you experience other printing problems, you may wish to contact your printer manufacturer.
Cannot Open a Radar File
If you receive error messages when attempting to open a radar data files, first check to make sure
both the raw and processed files are present in the same location (subdirectory). Use Explorer or File
Manager to look for the .RAD and .RDA versions of the data file.
If the raw data file is missing, you could rename another raw file with the missing file name, with the
understanding you will not be able to reedit the file again. If the processed file is missing, you could
rename another processed file with the missing name, reedit the run, and then resave the file.
If both files are present, but you still have problems, use Notepad or Wordpad to open the data files
and compare their structure to the examples on page 48. If there is file damage, you may be able to
fix it in notepad, and resave the file.
The Help File is Not Found
When the on screen help is opened, Stalker ATS runs a Windows help program, which loads the
Stalker ATS help document file. The name of the help program could be Winhelp.exe or
Winhlp32.exe. One of these files must be on your system and in the Windows directory in order to
access help. The Stalker help files are named Stalker3.hlp and Stalker4.hlp (depending upon which
version of Stalker ATS is used). See your Windows manual for more information on help files.
Chapter 11
Troubleshooting
73
Contacting Stalker Radar / Applied Concepts, Inc.
Applied Concepts, Inc. will provide three years of free technical support for registered Stalker ATS owners
during business hours. But, before you call, first look through this manual and the on screen help to
resolve your question. Only if you cannot find your answers should you call technical support.
When calling for technical support, have your radar gun, computer, Stalker ATS program diskettes, and
this manual in front of you.
Stalker Radar
730 F Avenue
Plano, TX 75074
Phone 972-398-3760
Fax 972-398-3781
www.stalkerradar.com
Hours
8:00 a.m. - 5:00 p.m.
Monday - Friday
Central Time Zone
74
Index
Chapter 12
Index
Acceleration Run 9, 34, 37, 47
Accept Changes 38, 42, 44
Activate 13, 61, 63
Add to List 13, 62, 63
Alt (Alternate) Key 21, 59
Angle Error 34, 35
Auto Clear 8, 31, 43
Auto Comment 30, 39
Auto Edit Raw Data 30, 38, 40
Auto Save 30, 39
Averaging a Region 59
Averaging Trials 54
Axis 57
Bitmap Files 14, 67
Bounce 47
Brake Test 9, 34, 37
Brief Report 14, 66
Choosing Statistics 13, 61
Clear Selection 63
Clipboard 14, 67
Closing Trials 53
Color Schemes 29
COM Port 26
Comments 24, 39
Communication 8, 70
Configuration Settings 25-26
Constant Speed Run 47
Contacting Radar Sales 73
Context-sensitive Help 68
Coordinates 58
Copy File(s) 52, 53
Copy Graph 14, 67
Chapter 12
Ctrl (Control) Key 14
Custom Statistics 13, 62
Data Type 27, 28, 42, 45-47
Deceleration Run 47
Decimal Units 27
Default Configuration 25, 71
Delete data file 53
Digital Filter 28, 45, 46
Directories 17, 19, 51, 52
Disable Speedometer 8, 28, 36, 71
Display Units 29
Distance 29, 34, 56, 62, 64
DOS Version 18
Dropouts 31, 43, 46, 47
Edit - Graph Mode 40-43
Edit - Text Mode 44, 45
Edit Menu 21
Editing 10, 11, 38, 40-45
End Measurement At 62, 63
Error Messages 24, 71
Escape (Esc) Key 57
Exclude 11, 38, 42, 43
Exit 25
Extrapolation 37, 46, 47
F1 Key 68
F2 Key 8, 36
F3 Key 36
Factory Defaults 25, 64
File Dialogs 51, 53
File Extensions 40, 48-53, 65, 72
File Locations 52
File Menu 21
Filter 28, 42, 44-46
Format 61
Graph Menu 21
Graph Mode Editing 10, 38
Graph Style 57
Chapter 12
Index
Graph Type 56
Graph Window 12, 55
Grid 57
Help 14, 68
Help Menu 21, 68
Hints 24, 69
Icons 22
Include 11, 42, 43
Input Port 8, 26, 70
Input Units 27
Installation 7, 17
Interpolation 46-47
Invalid COM Port 26
In-Vehicle 9, 34, 35
Invert Selection 63
Keyboard Record 9, 36
Leading Zeros 9
License Agreement 19
Line Width 58
Load List 65
Long File Names 15, 39
Main Menu 20, 21
Main Screen 20
Manual Save 30, 39, 51
Measurements 47
Memory Slots 11, 48, 49
Moving Average 46
New List 63
New Statistics 13, 62
NHRA Statistics 64
On-line Help 68
Opening Files 49, 72
Peak Mode 32
Peak Speeds 65
Plot Mode 50
Plot Status 12, 50
Popup Menus 12, 21, 24, 50, 55, 63
75
Print Dialog 66
Print Setup 14, 67
Printing Reports 14
Processed Data 10, 40, 41, 44, 48
Quick Save 30
Radar Gun Placement 9, 34
Radar Gun Settings 8, 27, 31, 32
Radar Speedometer 8, 9, 33, 35
Range 8, 32, 43
Raw Data 10, 40, 41, 44, 47, 48
Read Coordinates 58
Record Menu 9, 21, 36
Record Options 30
Recording Radar Data 9, 33
Region Box 11 ,42, 43, 56
Reject Changes 38, 42, 44
Replace Selection 13, 63
Requirements 15, 16
Restore Defaults 63
Right Click 12, 24
Rollout Distance 64
Running Stalker ATS 7, 19
Sample Data Files 7, 18
Save List 65
Save Options 30
Saved? 50
Saving Data 11
Saving Data 7, 39, 44, 51
Saving Settings 30
Scale 56
Screen Capture 14, 66
Screen Resolution 23, 66
Select Trial to Edit 13, 41
Selecting Data Points 11, 42
Selecting Trials 13, 41, 51
Sensitivity 9, 34
Serial Cable 70
76
Index
Serial Port 8, 16, 26, 32, 70
Setup Box 8, 26
Setup Menu 8, 32
Setup Stats 13
Shortcuts 21, 49, 66, 68
Squeeze 50
Start Measurement At 62, 63
Start Over 42, 44
Start-Stop 47
Statistics Type 13, 62
Statistics Window 12, 60
Stats Menu 21
Status Bar 20, 24
Sub Windows 12, 20, 22
SVGA 16, 23, 66
Symbols 58
Target Drive 7, 17
Taskbar 70, 71
Technical Support 73
Terrain Readings 34
Test Recording 8 ,26, 33
Ticks 57
Time / Date Stamp 24, 30
Timing 37,71
Title 14, 66
Toolbar 20-22
Transmitting 8, 32, 36
Transpose 12, 61
Trials 48
Trials Information 12, 13, 49-51
Trials Menu 21
Trigger (Gun) 8, 32
Trigger Recording 9, 32, 36, 37
Trimming (Zeros) 37, 46, 47
Tripod Mounted 32, 35
Uninstall 19
Units 8, 27, 29, 48
Chapter 12
Unknown 47
Unzoom 42, 57
Updates 76
User Default 13, 25, 63-65, 71
Versions 15, 18, 48
VGA 16, 23, 66
View Menu 21
Windows 3.1X 15, 17, 18, 37
Windows 95 15, 17, 18, 37, 70, 71
Windows NT 15
XMIT 8, 32, 36
Zoom 42, 56, 57
Program Updates
77
Program Updates
Program Updates
Radar Sales, Inc. may make periodic changes in Stalker ATS when problems are discovered, or
modest improvements are made. As a licensee of Stalker ATS for Windows versions 3.0 and 4.0, you
can receive minor updates free of charge. Major updates (version changes) may become available in
the future for a modest upgrade charge.
Minor updates can be downloaded from our website at www.radarsales.com. A password is required
for downloading updates, so first contact Radar Sales, Inc. for the password. Or, you can simply call to
have the latest upgrades sent to you on diskette.
Program Bugs
If you discover any errors or problems with the Stalker ATS program, please contact Radar Sales, Inc.
immediately at 612-533-1100 or you can E-Mail us at [email protected].
Comments and Suggestions
If you have any comments of suggestions on the software, we are anxious to hear from our
customers. Much of the development of Stalker ATS was based on customer suggestions and
recommendations. Please call, fax, or E-Mail your comments and suggestions to Robert Vanman
([email protected]).
78
Specifications
Specifications
The Stalker ATS Professional Radar
The Stalker ATS software program is written expressly to interface with the Stalker ATS Professional
Radar Gun. The Stalker ATS Professional Radar is manufacturing by Applied Concepts, Inc.
exclusively for Radar Sales, Inc.
Warranty Information
The Stalker ATS radar gun carries a three year parts and labor warranty. The batteries are
guaranteed for 90 days. Refer to the Stalker radar gun owner’s manual for gun operating instructions
and detailed warranty information.
General Specifications
Accuracy
Speed Range
Target Acquisition Time
Internal Sample Rate
Data Output Rate
Microwave System
3dB Rated Beamwidth
Receiver Type
Weight
Case
+ / - 0.1 MPH
1-300 MPH
0.01 Seconds
31.25 - 250 Samples per Second
31.25 Samples per Second
Ka Band, 20 mw, Dual Horn
9 Degrees Nominal
Direct conversion Homodyne
Using a Super Low Noise Schottky Barrier Mixer Diode
3.2 Pounds with the Battery Handle
High Impact Polycarbonate - Fully Shielded
Performance Specifications
Maximum Estimated Clocking Distances
Passenger Cars
8000 Feet Plus
Snowmobiles
3000 Feet
Personal Watercraft
1800 Feet
Baseballs
500 Feet
Specifications
79
Data Output
The Stalker ATS Professional Radar provides “constant rate” serial output through the 9-pin RS-232
output connector. The output data will coincide exactly with the speed reading shown in the lower
display window on the back of the radar gun. This speed is output at a constant rate of 31.25 updates
per second. The speed is selectable between either whole numbers or decimal numbers with
measurement units of MPH, KPH, or KNOTS.
No Speed Display
If the radar gun is transmitting (XMIT shown on the readout) AND no speeds are being registered, the
output data will be a speed reading of zero. If the radar is not transmitting (HOLD shown on the
readout) no data will be output.
Auto Clear Setting
The speed reading is transmitted as long as the speed is shown in the lower display window. If it is
desired for the speed reading to disappear immediately when the target disappears, set the Auto Clear
to 0SEC (0 seconds). For example: if the Auto Clear is set for 4 seconds (4SEC), the last speed
reading that is measured will stay in the lower display window for 4 seconds until it is automatically
cleared. During that 4 seconds, the last speed reading will be continuously output.
Data Output Specifications
Baud Rate
Number of Start Bits
Number of Stop Bits
Number of Data Bits
Number of Parity Bits
RS-232 Connector Type
Mating Connector Type
Data Out Pin
Signal Ground Pin
Time Between Speed Updates
Reading Per Second
Data Transmitted in Tenths Mode
Data Transmitted in Whole Mode
Leading Zero Suppression
9600
1
1
8
None
DE-9S (attached to right side of gun)
DE-9P (Radio Shack #276-1538)
Pin 2
Pin 5
0.032 Seconds
31.25
3 Digits, Period, 1 Digits, and CR
3 Digits and CR
No
80
Contact Information
Contacting Stalker Radar
Contacting Stalker Radar / Applied Concepts, Inc.
Stalker Radar will provide three years of free technical support for registered Stalker ATS owners.
Before You Call
• Look through this manual and the on screen help system to resolve your question.
• If your question is not answered in the support documentation, then call Stalker Radar
• Have all of these things together before calling:
Computer On and Ready.
Radar Gun (with a charged battery, and the serial cable).
Stalker ATS Program Diskettes.
This Manual.
Stalker Radar
2609 Technology Drive
Plano, TX 75074
Phone 972-398-3760
Fax 972-398-3781
www.stalkerradar.com
Hours
8:00 a.m. - 5:00 p.m.
Monday - Friday
Central Time Zone
c Copyright 1997, aci
All rights reserved.
Not responsible for typographical errors. Specifications subject to change without notice.
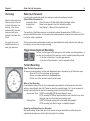
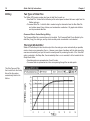
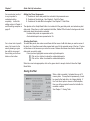
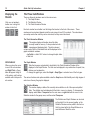
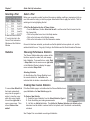
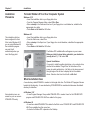
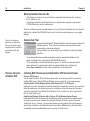
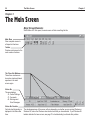
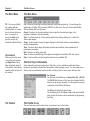

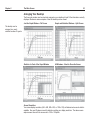
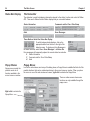
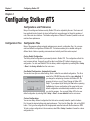
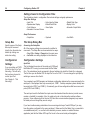

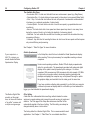
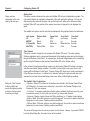
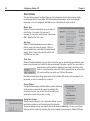


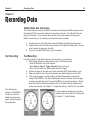

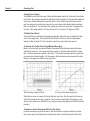
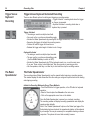

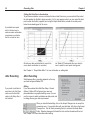
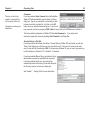

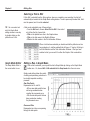
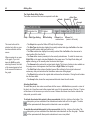

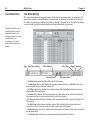
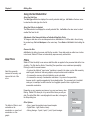


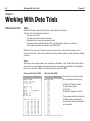
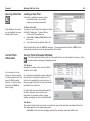
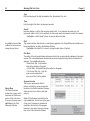
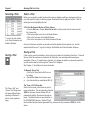
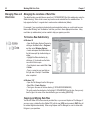
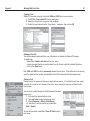
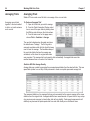
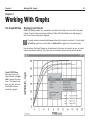
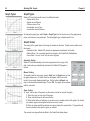
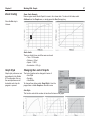
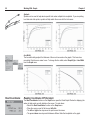
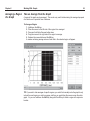
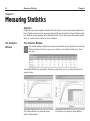
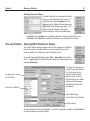
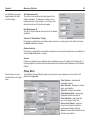
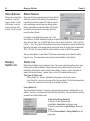
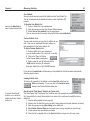

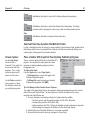

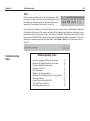


![20 [7] Don Libes, “Using expect to Automate Systems Administration](http://vs1.manualzilla.com/store/data/005773716_1-68a79e060d9ea16881001f4ab808f924-150x150.png)