1
Timeline Maker Professional - User Guide
7
Flag Chart
7.1
Overview
Bar Chart
65
In this topic: Overview, Components
Overview
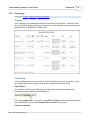
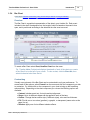
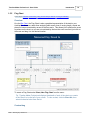
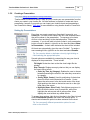
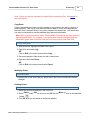
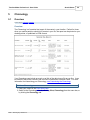
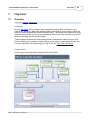
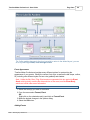
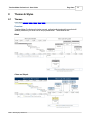
Like the Bar Chart, the Flag Chart is also a graphical representation of the data in your
timeline file. However, rather than assigning each event a bar of varying length, events are
placed in boxes connected by arrows to the time scale. This allows you to position the event
anywhere on the chart, as you are not restricted by the time the event occurred; just click on
the event and drag it to the desired location.
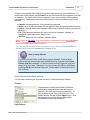
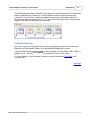
Timeline Maker Professional includes many different customization options for your Flag
Chart, including color, gradients, shadow effects, arrow and box styles, graphics and more.
For more information on customizing your Flag Chart, see Flag Chart, Formatting.
Components
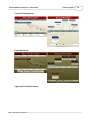
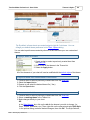
Click to learn more about each component of the Flag Chart:
©2001 - 2009 Progeny Software Inc.