1
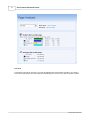
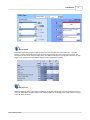
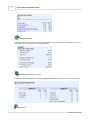
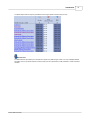
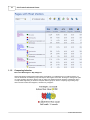
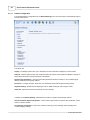
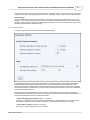
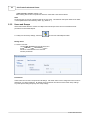
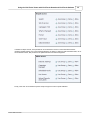
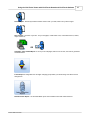
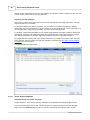
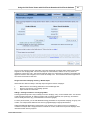
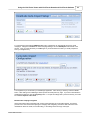
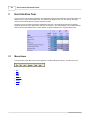
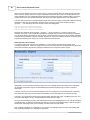
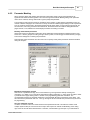
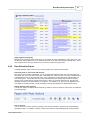
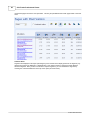
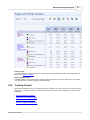
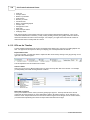
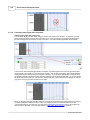
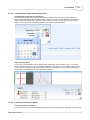
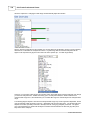
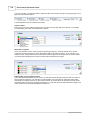
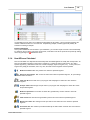
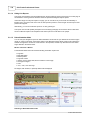
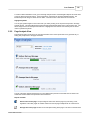
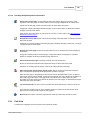
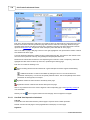
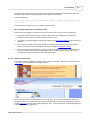
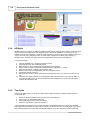
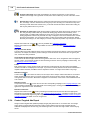
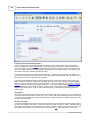
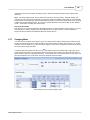
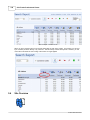
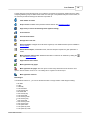
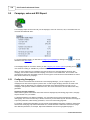
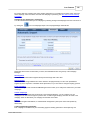
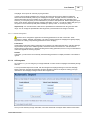
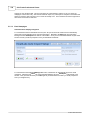
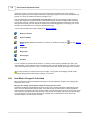
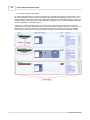
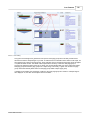
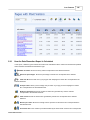
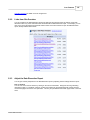
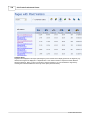
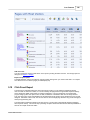
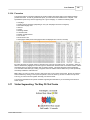
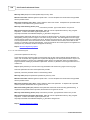
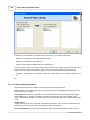
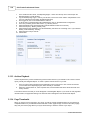
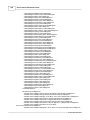
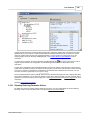
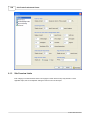
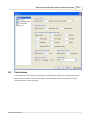
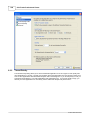
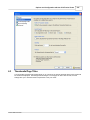
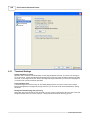
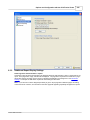
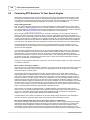
184
5.9
ClickTracks Professional Viewer
Data Dissection Report
The Data Dissection report shows a great deal of information in a tabular format.
You can shift between several types of 'visitor behavior' to measure. The types of data you can shift between
are:
Top search keywords
Top referrers
Pages with most visitors
Top entry pages
Top exit pages
Top Destinations (with JavaScript data collection only)
Countries with most visitors
Regions with most visitors
Internal search report data
Each of these visitor behaviors will have many values. For example, there will be many keywords that lead into
your site, many referrers, many visited pages, etc. The top values for one of these behaviors are listed on the
left and make up the rows of the table.
Several metrics are displayed for each value of this behavior, forming the columns of the table. The metrics are:
·
·
·
·
·
·
·
·
·
·
·
·
·
·
·
·
Total number of visitors
Percent of visitors
Unique visitors (Available when persistent cookies defined. See Persistent Cookies)
Total cost of visitors(if campaigns are configured)
Average Cost of Visitors (if campaigns are configured)
Purchases (if revenue tracking is configured)
Total revenue (if revenue tracking is configured)
Average revenue per visitor (if revenue tracking is configured)
Conversion rate (if revenue tracking is configured)
Return on advertising spend (ROAS) (if campaigns and revenue tracking are configured)
Cost per order (if campaigns and revenue tracking are configured)
Average visit length
Short visits
Average time on the site
Average page views per visitor
Total page views
In the example below, the visitor behavior selected is top visited pages
. The top visited pages are listed
along the left, and you can see the number of visitors who saw each page, the % of visitors who saw them, etc.
Only one behavior can be viewed at a time. Only one behavior can be viewed at a time, and you switch between
views by clicking on the icons at the top of the report.
© 2001-2008 ClickTracks