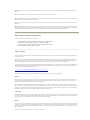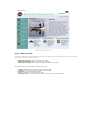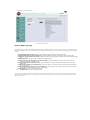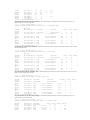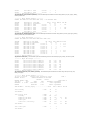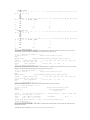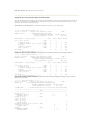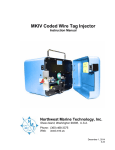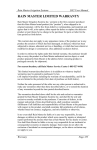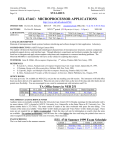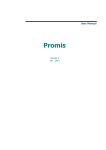
1
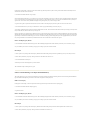
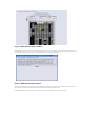
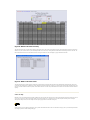
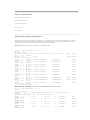
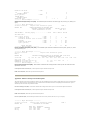
RMIS Web Site User Manual
March 2006
Table of Contents
Section 1. Introduction
Section 2. Hardware and Software Requirements
Section 3. Overview
Section 4. Using the RMIS Web site
Section 5. Running Reports
Section 6. Tutorial: Running a Release Report
Section 7. Tutorial: Running a Recovery Report
Section 8. Tutorial: Running a CSV Report With Email Delivery
Section 9. Data Status
Section 10. Help
Section 11. Contact Information
Appendix A. Releases Report Format Descriptions
Appendix B. Adclipped Releases Report Format Descriptions
Appendix C. Recoveries by Tag Code Report Format Descriptions
Appendix D. Recoveries by Hatchery Report Format Descriptions
Appendix E. All Recoveries Format Descriptions
Appendix F. Recoveries by Tag List Report Format Descriptions
Appendix G. Catch/Sample Report Format Descriptions
Appendix H. Locations Report Format Descriptions
Section 1. Introduction
This manual is intended for users of the Regional Mark Information System (RMIS) Web site operated by the Pacific States Marine Fisheries Commission (PSMFC).
Definitions
The "PSC Format V4.0 Specification" document contains a list of definitions that are used throughout the Regional Mark Information System (RMIS). Please read that document
and learn the various definitions so that you can more effectively use the RMIS Web site and analyze your data more decisively.
The following terms are used throughout this manual and are described here for reference.
Browser Delivery : An alternate method for delivery of report output. Suitable for small result sets and reports that run quickly.
CE : The Catch & Effort database. Contains the Catch & Effort and Location data defined in the "PSC Format V4.0 Specification".
CSV Report : A report in comma-separated-value (CSV) format. The first record of a CSV report contains comma-separated field names (example:
record_code,format_version,submission_date,reporting_agency), and all subsequent records hold comma-separated data (example: "T","4.0","20021202","CDFO"). CSV report
files can be imported into many popular personal computer database and spreadsheet programs.
CSV/HTM Data Field Chooser : A window that allows you to choose which data fields to include in your CSV or HTM report by clicking on PSC Common Names as
described in the "PSC Format V4.0 Specification".
CWT : The Coded Wire Tag database. Contains the Release, Recovery, Catch/Sample, and Location data defined in the "PSC Format V4.0 Specification".
Database : A collection of related information and their definitions.
Email Delivery : The default method for delivery of report output. Preferable for large result sets that take a long time to run or that produce large amounts of output.
HTM Report : A report in Hyper-Text Markup Language (HTML) format. HTM reports can be displayed as tables in a Web browser and can be imported into many popular
personal computer database and spreadsheet programs.
Key Field : A field on a Recovery Query Form that corresponds to an indexed column on the recovery table in the CWT database. Every recovery query must have at least one
key field filled in.
Pop-up Window : A window that open in your Web browser when you click on a link or a button on the RMIS Web site. Pop-up windows are displayed above the main RMIS
window and they must be closed in order to return to the underlying window. Two uses of pop-up windows in RMIS are to display help messages and to display forms that allow
the user to click on checkboxes to select PSC codes when using a Query Form.
Preview Window : A separate browser window in which you can preview the result set returned by your query prior to running a report.
Query Form : A Query Form is a set of parameters that identifies what data you want reported. Queries serve to restrict the amount of data retrieved from the database when a
report is run.
RMIS : The Web site that is used to create queries and run reports using data contained in the CWT and CE databases.
RMPC : Regional Mark Processing Center, The Pacific States Marine Fisheries office that provides for the planning, organization, direction and control of the centralized CWT
data repository at the direction of the Pacific Salmon Commission.
Tag List : A tag list is a list of up to 1,000 tag codes. Tag lists are used in the Recoveries by Tag List Query Form, which is optimized for quick retrieval of recovery data from
large tag lists.
Wild Card Searches : Searching for character string patterns within fields of character data. The most useful example of this is searching by location name when you don't know
the exact spelling of the name. If you know that the location name starts with HOH but you're not sure what comes after that, you can enter HOH% in the location name field to
search for all location names that start with HOH. Or you can enter %HOH% to search for all location names that contain HOH anywhere in the name.
Section 2. Hardware and Software Requirements
You need to have the following in order to use the RMIS Web site.
1. Operating System: Windows (2000/XP), Mac (OS X), Linux (RedHat/Fedora)
2. Web browser: Internet Explorer 6, Firefox 1.5, Netscape 7 or higher
3. Browser setting: JavaScript is required and session cookies must be enabled
4. Screen resolution: 1024 by 768 pixels or higher
Section 3. Overview
The Pacific States Marine Fisheries Commission hosts the Regional Mark Processing Center (RMPC). This office provides for the management of the centralized data repository
for Coded Wire Tag data.
The Coded Wire Tag (CWT) Database is designed to house information relating to the release, sample, and recovery of coded-wire tagged salmonids throughout the Pacific
region. These data flow to the PSMFC in the form of Pacific Salmon Commission (PSC) format datasets sent by reporting agencies and must meet stringent validation criteria for
inclusion in the permanent database. The RMIS Web site described in this manual is the means by which you may extract CWT data from this database.
Users of the RMIS Web site must be familiar with the document named "PSC Format V4.0 Specification". It is very important that users of CWT data understand the information
contained in this document in order to perform conclusive, accurate and responsible analysis of these data. If you do not have a copy of this document you may download an
electronic copy in Microsoft Word format at the following URL.
============== PSC_V40_Specification.doc ==============
There are four main classes of CWT data: Release, Catch/Sample, Recovery, and Location. These classes of data are described below.
Release
When a group of fish is released from a hatchery or other release location containing any number of coded-wire tagged fish, the group is associated with a unique coastwide Tag
Code. Any pertinent information regarding the release group is submitted to the coordinating state, provincial, or federal agency (i.e. Reporting Agency). That agency in turn
submits the information to the PSMFC. This information is known as Release data.
When groups of fish are released without coded-wire tagged fish present, the release group is called a non-associated group. Any pertinent information regarding the release
group is also submitted to the coordinating state, provincial, or federal agency where it is assigned a 12 character alpha-numeric identifier. This information is likewise submitted
to the PSMFC. As of March 2006 there were 40,544 tagged release groups and 87,934 non-associated release groups in the database. Tagged release groups are identified in the
CWT database as Record Code "T" and non-associated release groups are identified as Record Code "N".
Catch/Sample
Tagged fish are sampled at various commercial, recreational, and escapement fisheries coastwide by sampling agencies. These agencies usually record the sampling area, number
caught, percent of catch that was sampled, and related information. This information is called Catch/Sample data and is collected and submitted to the PSMFC on a yearly basis
by Reporting Agencies. As of March 2006 there were i274,614 Catch/Sample records in the database.
Recovery
When tags are removed from fish and decoded, the tag code, specific location of catch, date of catch, fishery, and related biological data are recorded. Where possible, the ratio of
the number of fish sampled to the total catch is multiplied by the total number of tags extracted to form the Estimated Number of fish. These data are assembled by the Reporting
Agency and are called Recovery data. These data are submitted to the PSMFC on a yearly basis along with Catch/Sample data. Individual recovery records correspond to one
observed (decoded) tag.
Each recovery record has an associated "tag status" . This status is coded as follows:
1.
2.
3.
4.
7.
8.
9.
Tag read OK
No tag
Tag lost before read
Tag not readable
Unresolved discrepancy
Head not processed
Pseudo tag, blank wire
Most of the recovery reports in RMIS include only recoveries with a status of "1" (Tag read OK). In addition to passing rigorous validation
tests, the status "1" recoveries must match by tag code with a tagged release group. As of March 2006 there were 4,897,735 status "1"
recovery records in the database.
Recoveries with a status other than "1" are only available in a few recovery reports, including PSC and CSV formats. As of March 2006 there were 1,187,187 non-status "1"
recoveries in the database.
Use of the term "recoveries" in this manual refers only to status "1" recoveries unless explicitly stated otherwise.
Location
The geographic locations of release, sample, and specific recovery of fish are also assembled by the Reporting Agency. Collectively, these are called Location data and are
submitted to the PSMFC along with all other classes of data.
There are five types of locations. Within each type of location, the location record is uniquely identified coastwide by a 19 character Location Code. That code is associated with
a textual description of the location. As of March 2006 there are 31,438 locations in the database.
The five types of locations are described as follows:
1. Recovery Location : Recovery locations indicate as closely as possible the actual geographic place where a tagged fish was caught.
They are usually specified within larger Catch locations in the sampling stratum. This type of location is found only in Recovery
data.
2. Catch Location : Catch locations correspond to geographic areas where sampling occurred for a given fishery. They may
encompass several recovery locations. This type of location is found only in Catch/Sample data.
3. Hatchery Location : Hatchery locations specify the name of the hatchery or rearing facility for non-wild release groups. This type
of location is found only in Release data.
4. Release Location : Release locations specify the geographic release location of the release group. It may differ from the hatchery
location. This type of location is found only in Release data.
5. Stock Location : Stock locations differ from all other locations in that they identify the brood stock or morphology of a release
group rather than a geographic location. Stocks usually correspond to the name of a stream reach but may be combined if the
stock was mixed. This type of location is found only in Release data.
Section 4. Using the RMIS Web site
This section describes the top-level menus in the RMIS Web site and outlines how to use an RMIS Query Form to create a query and retrieve records from the database.
Figure 1: RMIS Home Page
The initial page of the RMIS Web site contains three Reporting System options and six other options that can be selected depending on what you want to do. The three Reporting
System options represented as icons at the bottom of the page are:
1. RMIS Standard Reporting : Run reports using the CWT database
2. RMIS Catch & Effort Reporting : Run reports using the CE database
3. RMIS Analysis Reporting : Run CWT Analysis and Management Fishery Analysis reports
The six other options represented as links on the left side of the page are:
1. Overview : RMPC Introduction, CWT Program Overview, and RMPC Gallery
2. Committees : Pacific Salmon Commission and Regional Mark Committee
3. Publications : Documents Published by the RMPC
4. Forums : Pacific Salmon Commission Discussion Forums
5. News & Data Status : View data descriptions and status of data loads in the CWT and CE databases
Figure 2: RMIS Login page
From the RMIS Home Page clicking on either the RMIS Standard Reporting icon or the RMIS Catch & Effort icon leads to the RMIS Login page. The contents of this page are
determined by which database you chose, but for the purposes of this user manual the CWT database will be used as an example. Here are the start pages available on the RMIS
Login page:
1. Tagged Releases (Record Code T only) : Search for Release groups containing coded-wire tagged fish
2. Non-Associated Releases (Record Code N only) : Search for Release groups not containing any coded-wire tagged fish
3. All Releases (Tagged and Non-Associated) : Search for all release groups regardless of whether they contain coded-wire tagged
fish
4. Adclipped Releases : For reporting on ad-clipped and unclipped releases
5. Recoveries by Tag Code (Tag Status 1 only, limit 180 tags) : Choose this option if you want to search for recoveries by
specific tag codes or other Recovery fields
6. Recoveries by Hatchery (Tag Status 1 only) : Choose this option if you want to search for recoveries by hatchery or other
Release fields
7. All Recoveries (Tag Status 1-9, limit 180 tags) : Choose this option if you want to search for recoveries with tag status other
than 1 (Tag read OK)
8. Recoveries by Tag List (Tag Status 1-9, up to 1000 tags) : Choose this option if you want to search for recoveries by specific
tag codes and the number of tag codes in your search is large
9. Catch/Sample : Search for all Catch/Sample records
10. Location Codes : Search for all Location records
To login, enter your email address and click on the Login button. The first time you login you'll need to verify that you want to create a new account, and then on subsequent
logins your email address will be recognized as an existing user. After you click the Login button you'll have full access to all of the RMIS Reporting systems until you either
logout or close your browser.
Figure 3: RMIS Query Form
From the RMIS Login page clicking on Login button leads to the RMIS Query Form. The contents of the Query Form are determined by which type of CWT data you choose, but
the Query Forms all have the same general structure. The lefthand column of the Query Form is a menu of links that allow you to navigate between different types of CWT data.
The top line of the Query Form identifies the type of CWT data being queried. Beneath that are three rows of fields that you can use to build your query. Each field consists of a
name and a box. You can click on the name to display a pop-up window for help in filling in the box, or you can type the desired PSC codes directly into the box. In general you
can type as many codes as you want into each box, but each code must be on a separate line. The bottom line of the Query Form contains a Retrieve button -- click on the button
to run the query and see how many matching records it finds in the database.
Section 5. Running Reports
After you have created a query and successfully retrieved records from the database you can run a report and have the report results delivered to your email inbox or view the
report results in your Web browser.
Figure 4: RMIS Query Results
There are three required steps to run a report, and two additional steps depending on the type of report and whether you want to preview the data before running the report. Here
are the required steps for all reports.
1. Choose Report : Choose a report format from the pulldown menu.
2. Send To : Choose a delivery method for the report output (Email or Browser)
3. Run : Click on the Run button
And here are the two additional steps.
1. Preview : If you would like to preview the data returned by your query before running the report click on the Preview button
2. CSV/HTM Data Field Chooser : If you are running a CSV or HTM report you must choose the data fields to include in the report
These steps are described in more detail in the tutorial sections later in this manual. There is also context sensitive on-line help available on
the RMIS Query Results page which can be displayed by clicking on the Help icons.
Appendix A through Appendix H list the report formats available for each type of query form and show example report output.
Section 6. Tutorial: Running a Release Report
This example will show how to run a Release report using a wild card search. Starting from the RMIS Home Page select "RMIS Standard Reporting", then select "Tagged
Releases" to display the Releases Query Form.
Build a Release Query
The Query Form allows you to enter values in any or all of the fields to restrict the number of Releases that will be reported. For the purposes of this example, we will use a wild
card search to build a query that will report Release data from all release locations whose name begins with the word HOH.
1. Click in the box beneath the field name "Release Location Name".
2. Type HOH% in the box. (The % is a wild card character.)
Note About Wild Card Searches: Many character fields in the RMIS Query Forms allow "wild card" searches for matching patterns of characters within the field rather than
matching the full field value. To perform a wild card search, type the initial part of the pattern, followed by the % pattern matching character. For example, to match all release
location names that start with the word PHOH, type HOH%.
Retrieve and Display Query Results
1. Click on the Retrieve button at the bottom of the Query Form. This should display the Query Results window which tells you how many rows were found for your query.
2. If you would like to preview the rows returned by your query prior to running a report, click on the Preview button.
Note About the Preview Window: The Preview Windows allows you to page through the result set returned by your query using Next and Previous buttons. It displays actual
rows of data from the CWT database in HTML table format. In the case where there are less than 20 rows returned by your query the Next and Previous buttons aren't displayed.
If you want to see the SQL SELECT statement generated by your query click on the Show SQL button. When you are done with the Preview Window click the Close Preview
button to return to the Query Results page.
Run a Report
1. Choose a report to run by clicking on the "Choose Report:" pulldown menu and then clicking on the report named "RMPC Release book, side A (RBA)".
2. Choose a delivery method for your report by clicking on the "Browser" radio button in the "Send To:" box.
3. Click on the Run button to start the report. Depending on which Web browser you're using you may see the cursor turn into an hourglass or you may see a status message at the
top or the bottom of the browser window while the report is running.
4. When the report is done it will be displayed in your browser window. You can read the report in your browser window, or you can select the data in the browser window and
copy & paste it into another program, or you can save the data in the browser window to a file on your PC. When you are done with the report click on one of the buttons at the
top of the browser window to return to either the Query Results page or the Query Form page.
This concludes the example of running a Release report. Reports for the other type of PSC data can be run in a similar manner.
Section 7. Tutorial: Running a Recovery Report
This example will show how to run a Recovery report using a key field search and a pop-up window. Starting from the RMIS Home Page select "RMIS Standard Reporting", then
select "Recoveries by Tag Code" to display the Recoveries by Tag Code Query Form.
Build a Recovery Query
For the purposes of this example, we will use a tag code search to build a query that will report Recovery data for four tag codes from the Ambrose Ponds hatchery that were
released in 1987-1988 and recovered in 1988-1991.
1. Click in the box beneath the field name "Tag Code (key)".
Note About Key Fields: Because there are over 5 million recovery records in the CWT database it's necessary to use indexes to achieve acceptable performance when retrieving
recovery records. The indexes are represented on the recovery Query Form by "key" fields, and the rule is that every recovery query must include at least one key field. If you
neglect to enter a value in at least one key field RMIS will display a warning message when you try to retrieve the query results.
2. Type these four tag codes on separate lines: 065630, 065631, 065633, and 066147. Press the [Enter] key after each tag code to move the cursor to the next line.
3. Click on the field name "Recovery Year (key)". Each field name is a link to a pop-up window that helps you construct your query.
4. In the "Begin:" pulldown menu select 1988, and in the "End:" pulldown menu select 1991. Then click the Close button which will return you to the Query Form and you'll see
the years 1988, 1989, 1990, and 1991 in the "Recovery Year (key)" box.
Note Pop-Up Windows: Every field name on every RMIS query form has a context-sensitive pop-up window. In the case of fields with defined PSC codes, the pop-up window
will display the codes and associated descriptions and you can click on checkboxes to select the desired codes. In the case of year fields, the pop-up window let's you choose the
begin and end years and then fills in the intervening years. In the case of location fields, the pop-up window displays the top level of the geographic hierarchy of locations and
let's you navigate down the levels of the hierarchy to find the desired location codes or location names or PSC basins or PSC regions.
Retrieve and Display Query Results
1. Click on the Retrieve button at the bottom of the Query Form. This should display the Query Results window which tells you how many rows were found for your query.
2. If you would like to preview the rows returned by your query prior to running a report, click on the Preview button.
Run a Report
1. Choose a report to run by clicking on the "Choose Report:" pulldown menu and then clicking on the report named "Tag Summary by Recovery Year, Fishery (TS1-Rec)".
2. Choose a delivery method for your report by clicking on the "Browser" radio button in the "Send To:" box.
3. Click on the Run button to start the report.
4. When the report is done it will be displayed in your browser window.
This concludes the example of running a Recovery report.
Section 8. Tutorial: Running a CSV Report With Email Delivery
This example will show how to run a Location report producing an ASCII comma-separated-value output file and having it delivered via email. Starting from the RMIS Home
Page select "RMIS Standard Reporting", then select "Location Codes" to display the Locations Query Form.
Build a Location Query
For the purposes of this example, we will use a simple search to build a query that will report all Location data for one reporting agency.
1. Click in the box beneath the field name "Reporting Agency".
2. Type IDFG in the box.
Retrieve and Display Query Results
1. Click on the Retrieve button at the bottom of the Query Form. This should display the Query Results window which tells you how many rows were found for your query.
2. If you would like to preview the rows returned by your query prior to running a report, click on the Preview button.
Run a Report
1. Choose a report to run by clicking on the "Choose Report:" pulldown menu and then clicking on the report named "Comma-Separated Values custom file (CSV)".
2. Choose a delivery method for your report by clicking on the "Email" radio button in the "Send To:" box.
3. Click in the "Description:" field and type TESTING.
4. Scroll to the bottom of the Web page so you can see the entire section titled "CSV/HTM Data Field Chooser". In the left-hand box click on the line "[PSC] Location Code" and
then click on the ">" button, which will put "location_code" on the first line in the right-hand box. In the left-hand box click on the line "[PSC] Location Type" and then click on
the ">" button, which will put "location_type" on the second line in the right-hand box. In the left-hand box click on the line "[PSC] Name" and then click on the ">" button,
which will put "name" on the third line in the right-hand box.
5. Click on the Run button to start the report.
6. When the report starts running an Email Notification message will be displayed in your browser window.
Note About Email Delivery: The advantage of using Email delivery for RMIS reports is that you don't have to wait for the report to complete, you can continue working on other
tasks in your browser window while the report is running on the server. Email delivery isn't limited to CSV reports, it can be used with any RMIS report, and it is particularly
advantageous with large result sets that take a long time to run or that produce large amounts of output.
7. When the report is done you will receive an email message from [email protected]. The subject of the email message will identify the type of report, in this case it will
say "Locations CSV report from RMPC website". Open the email message and you will see the description TESTING at the top of the message followed by two links that allow
you to download the report output file in either text or zip format. The message tells you how large the two files are to help you decide which format to download. The zip file
will download faster, but it will need to be unzipped after the download using a program like WinZip. After you decide which format to download, click on the appropriate link to
start the download. The actual download steps will vary depending on which email program you're using, but most programs should allow you to save the file to a directory of
your choice on your PC's local disk.
8. After you have successfully downloaded the CSV file to your disk, you can import it into any personal computer program that can read CSV files. For example, it can be
imported into a Microsoft Excel spreadsheet or a Microsoft Access database table.
Note About HTM Reports: Like CSV reports, HTM reports allow you to create custom output files that can be easily imported into Excel and Access. The major difference
between CSV and HTM reports is that HTM report data is written in HTML table format which is easier to view in a Web browser window.
This concludes the example of running a CSV report with email delivery.
Section 9. Data Status
In addition to the RMIS Query System that provides access to Release, Recovery, Catch/Sample and Location data, there are a set of RMIS Data Status pages that provide
descriptions and load dates for the datasets in the CWT database. You can get to the RMIS Data Status Menu by clicking on the "News & Data Status" link on the left side of the
RMIS Home Page.
Figure 5: RMIS Data Status Menu
The Data Status Menu is a table with Dataset Descriptions in the first column and Dataset Load Dates in the second column. The rows of the table are the five types of data
available: Release, Recovery, Catch/Sample, Location and Catch & Effort. Clicking on one of the links in the Dataset Descriptions column displays the Data Descriptions
summary page.
Figure 6: RMIS Data Descriptions summary
The Data Descriptions summary page is a table with one column for each reporting agency and rows that vary depending on the type of data being displayed. For Release and
Location data there is only one row, and for Recovery and Catch/Sample data there is a row for each year. The legend above the table describes the meaning of the colors in the
cells and the labels on the buttons. Clicking on a button in one of the cells displays a pop-up Data Descriptions detail window.
Figure 7: RMIS Data Descriptions detail
The Data Descriptions detail pop-up window displays the descriptions submitted by the reporting agency for a particular dataset, as described in the Description section of the
"PSC Format V4.0 Specification" document. Descriptions are sorted by Submission date with the most recent submission on top.
Going back to the RMIS Data Status Menu, clicking on one of the links in the Dataset Load Dates column displays the Load Dates summary page.
Figure 8: RMIS Load Dates summary
The Load Dates summary page is a table with one column for each reporting agency and rows that vary depending on the type of data being displayed. For Release and Location
data there is only one row, and for Recovery and Catch/Sample data there is a row for each year. The legend above the table describes the meaning of the colors in the cells. The
labels on the buttons show the most recent load date for that cell. Clicking on a button in one of the cells displays a pop-up Load Dates detail window.
Figure 9: RMIS Load Dates detail
The Load Dates detail pop-up window displays the actual dates a particular dataset was loaded into the CWT database and validated with the rules defined in the "PSC Format
V4.0 Specification" document. Rows in the table are sorted by Dataset Processed date with the most recent date on top. The description column includes validation statistics (how
many rows passed the validation and how many failed), and also indicates the most recent date a fully validated dataset was moved into the CWT database and made available for
reporting.
Section 10. Help
RMIS has extensive on-line Help information available. In addition to the pop-up windows described in previous sections of this manual that provide help selecting PSC codes for
use on a Query Form, there is context-sensitive help available on most pages. The help icon is a question mark in a circle followed by the word "Help". Here's an example
showing how the help icon looks (note: this example icon doesn't open a pop-up window so don't bother clicking on it).
Clicking on a help icon on any RMIS page will display a pop-up window with detailed instructions on how to use the features of that page. After you've read the help information
close the pop-up window to continue working on the page.
Section 11. Contact Information
George Nandor: [email protected]
Jim Longwill: [email protected]
Dan Webb: [email protected]
Phone: (503) 595-3100
Fax: (503) 595-3232
Appendix A. Releases Report Format Descriptions
This appendix describes the report formats available in the "Tagged Releases", "Non-Associated Releases", and "All Releases" paths of the RMIS Query System, and shows
example output for all except CSV, HTM and PSC formats. CSV and HTM reports are custom designed by the user, as described earlier in this manual, so the format varies
depending on the fields chosen. PSC reports are described fully in the "PSC Format V4.0 Specification" document.
RMPC Release book, side A (RBA) : First side of the annual Release book published by the RMPC.
---------- Begin RBA Example ---------PAGE 1A
22:15:50 01/14/2003
Tag Code or. Tag Run. Spec Bd Rel. Hatchery Location...
CWT....
Loss
Non-CWT
Release ID.. Typ
Yr Agy
Mrk Cnt
Rate
Mrk Cnt
082240
0
Fall Coho 82 CDFO H-QUINSAM R
9,637 0.0302
6,886
082241
0
Fall Coho 82 CDFO H-QUINSAM R
9,800 0.0199
15,480
082242
0
Fall Coho 82 CDFO H-QUINSAM R
9,784 0.0199
15,455
082243
0
Fall Coho 82 CDFO H-QUINSAM R
9,830 0.0199
15,528
082244
0
Fall Coho 82 CDFO H-QUINSAM R
9,843 0.013
17,623
082245
0
Fall Coho 82 CDFO H-QUINSAM R
9,795 0.013
17,536
082246
0
Fall Coho 82 CDFO H-QUINSAM R
9,817 0.013
17,575
082247
0
Fall Chin 83 CDFO H-ROBERTSON CR
75,989 0.0089
980,473
082248
0
Fall Chin 83 CDFO H-ROBERTSON CR
76,471 0.005
971,816
082249
0
Fall Coho 83 CDFO H-CAPILANO R
75,569 0.0202
138,504
---------- End RBA Example ----------
Release Location....
First.
Last..
Release Release
R-QUINSAM R
840601
R-QUINSAM R
840601
R-QUINSAM R
840601
R-QUINSAM R
840601
R-QUINSAM R
840601
R-QUINSAM R
840601
R-QUINSAM R
840601
R-ROBERTSON CR
840605
840608
R-ROBERTSON CR
840605
840608
R-CAPILANO R
850604
RMPC Release book, side B (RBB) : Second side of the annual Release book published by the RMPC.
---------- Begin RBB Example ---------PAGE 1B
22:17:11 01/14/2003
Tag Code or. Tag Ct. T.L. Weight Length Rear
Comments................................
Release ID.. Typ Mhd Days (gm)
(mm) Type
082240
0
14 24.00
H
DENSITY LARGES
082241
0
8 20.00
H
DENSITY LARGES
082242
0
8 21.00
H
DENSITY MEDIUMS
082243
0
8 25.10
H
DENSITY LARGES
082244
0
12 18.20
H
DENSITY SMALLS
Rel.. Rel. St. Coord Stock Location......
Stage Type Int
Smolt E
03
S-QUINSAM R
LOW
Smolt E
03
S-QUINSAM R
MEDIUM
Smolt E
03
S-QUINSAM R
MEDIUM
Smolt E
03
S-QUINSAM R
MEDIUM
Smolt E
03
S-QUINSAM R
HIGH
082245
0
12 19.50
DENSITY MEDIUMS
082246
0
12 22.40
DENSITY LARGES
082247
0
3
4.10
CONTROL FOR 08/22/48
082248
0
3
4.60
DRY DIET
082249
0
26 15.10
ADRV-CWT;136395 UNTAG RV CLIP,
---------- End RBB Example ----------
H
Smolt E
03
S-QUINSAM R
HIGH
H
Smolt E
03
S-QUINSAM R
HIGH
H
Smolt B
03
S-ROBERTSON CR
OMP
H
Smolt B
03
S-ROBERTSON CR
WEST VAN
H
Smolt E
03
S-CAPILANO R
STERILE;
PSC 4.0 Data Exchange format (PRL) : Pacific Salmon Commission data exchange format for Release data. See "PSC Format V4.0
Specification" document.
Comma-Separated Values custom file (CSV) : Comma-separated-value report with fields selected by the user.
HTML custom table (HTM) : HTML table report with fields selected by the user.
Tag List (RTL) for copy/paste to new query : Generates a list of tag codes that can be copied to the clipboard and pasted into the tag code field on a Release or Recovery Query
Form.
---------- Begin RTL Example ---------082240
082241
082242
082243
082244
082245
082246
082247
082248
082249
---------- End RTL Example ---------Releases With Zero Rec. By Tag Code (RZ1) : Releases with zero recoveries sorted by tag code.
---------- Begin RZ1 Example ---------22:31:06 01/14/2003
Regional Mark Information System
REPORT: RZ1
RELEASES WITH ZERO RECOVERIES
BY TAG CODE
Tag Code
Rel. Hatchery
Agcy Location Name
633940
WDFW TURTLE ROCK HATCHERY
634319
WDFW CHIWAWA HATCHERY
---------- End RZ1 Example ----------
Spec
1st
Rel.
1992
1992
Coho
Chin
Last
Rel.
1992
1992
PAGE 1
Release
Location Name
COL.R. @ TURTLE ROCK
CHIWAWA R
45.0759
Releases With Zero Rec. By Hatchery (RZ2) : Releases with zero recoveries sorted by release agency and hatchery location name.
---------- Begin RZ2 Example ---------22:31:51 01/14/2003
Regional Mark Information System
REPORT: RZ2
RELEASES WITH ZERO RECOVERIES
BY HATCHERY
Rel. Hatchery
Spec 1st
Agcy Location Name
Rel.
WDFW CHIWAWA HATCHERY
Chin 1992
WDFW TURTLE ROCK HATCHERY Coho 1992
---------- End RZ2 Example ----------
Last
Rel.
1992
1992
Release
Location Name
CHIWAWA R
45.0759
COL.R. @ TURTLE ROCK
PAGE 1
Tag Code
634319
633940
CWT & Total Released By Year (RTR) : Summary of CWT released and total released sorted by species, release year, and state.
---------- Begin RTR Example ---------22:33:24 01/14/2003
Regional Mark Information System
REPORT: RTR
CWT & TOTAL RELEASED BY YEAR
Species Name
-----------Chinook
Chinook
Chinook
Chinook
Chinook
Chinook
Chinook
Release Year
-----------1990
1990
1990
1990
1990
1990
1990
Chinook
1990 subtotal
State
----AK
BC
CA
ID
NA
OR
WA
CWT Released
-----------1714973
7439880
2554642
1716011
0
4436352
11368295
-----------29230153
Total Released
-------------10245754
55429208
14201013
8143405
0
33738665
75656801
-------------197414846
PAGE 1
============
Chinook
TOTAL
29230153
---------- End RTR Example ----------
==============
197414846
Appendix B. Adclipped Releases Report Format Descriptions
This appendix describes the report formats available in the "Adclipped Releases" path of the RMIS Query System, and shows example output for all except CSV and HTM
formats. CSV and HTM reports are custom designed by the user, as described earlier in this manual, so the format varies depending on the fields chosen.
Ad-clipped Releases Summary (AS1) : Summary of ad-clipped and unclipped releases sorted by species, brood year and release year.
---------- Begin AS1 Example ---------10:21:27 01/15/2003
Regional Mark Information System
PAGE 1
REPORT: AS1
AD-CLIPPED RELEASES SUMMARY
SPECIES: Chinook
BROOD YEAR: 2000
RELEASE YEAR: 2000
S/P REGION BASIN
----TOTAL
UNKNOWN
CA
SACR
SACR
0
230119
CA
SACR
SACR
0
1357
WA
MPS
PUYA
0
4
HATCHERY/FACILITY
----- CWT TAGGED -----
------------ NON-CWT --------
AD-CLIPPED
UNCLIPPED
AD-CLIPPED
UNCLIPPED
222491
0
7628
0
1266
0
91
0
0
0
0
4
----------
----------
----------
----------
223757
0
7719
4
COLEMAN NFH
VOIGHTS CR HATCHERY
----- ---------Report Totals
0
231480
-----
Note: Numbers of adipose-clipped fish may be inaccurate due to incomplete data collection
and/or partial marking.
---------- End AS1 Example ---------Comma-Separated Values custom file (CSV) : Comma-separated-value report with fields selected by the user.
HTML custom table (HTM) : HTML table report with fields selected by the user.
Appendix C. Recoveries by Tag Code Report Format Descriptions
This appendix describes the report formats available in the "Recoveries by Tag Code" path of the RMIS Query System, and shows example output for all except CSV, HTM and
PSC formats. CSV and HTM reports are custom designed by the user, as described earlier in this manual, so the format varies depending on the fields chosen. PSC reports are
described fully in the "PSC Format V4.0 Specification" document.
Tag Detail by Recovery Year, Fishery (TD1-Rec) : This fixed-field report summarizes tag code recoveries by recovery year, agency, and fishery.
---------- Begin TD1-Rec Example ---------FORMAT: TAG DETAIL BY FISHERY (TD1) -- BY RECOVERY YEAR
TAGCODE
YEAR AGCY FC OBS'D
EST'D
082244
1984 CDFO 50
28
29
082244
1985 CDFO 10
28
123
082244
1985 CDFO 23
45
160
082244
1985 CDFO 40
99
355
082244
1985 CDFO 50
142
199
082244
1985 WDFW 23
2
4
082244
1985 WDFW 45
1
2
082244
1986 CDFO 40
1
4
---------- End TD1-Rec Example ----------
MEAS'D
AVG MM
21
42
559
601
2
655
Tag Detail by Run Year, Fishery (TD1-Run) : This fixed-field report summarizes tag code recoveries by run year, agency, and fishery.
---------- Begin TD1-Run Example ---------FORMAT: TAG DETAIL BY FISHERY (TD1) -- BY RUN YEAR
TAGCODE
082244
YEAR AGCY FC
1984 CDFO 50
OBS'D
28
EST'D
29
MEAS'D
AVG MM
082244
1985 CDFO 10
28
123
082244
1985 CDFO 23
45
160
082244
1985 CDFO 40
99
355
082244
1985 CDFO 50
142
199
082244
1985 WDFW 23
2
4
082244
1985 WDFW 45
1
2
082244
1986 CDFO 40
1
4
---------- End TD1-Run Example ----------
21
42
559
601
2
655
Tag Detail by Recovery Year, Site Name (TD2-Rec) : This fixed-field report summarizes recoveries of tag codes by recovery year,
agency, fishery, and recovery location code.
---------- Begin TD2-Rec Example ---------FORMAT: TAG DETAIL BY RECOVERY SITE NAME (TD2) -- BY RECOVERY YEAR
BRD- RECTAGCODE
YEAR YEAR AGCY FC SITE NAME
AVG MM
082244
1982 1984 CDFO 50 H-QUINSAM R
082244
1982 1985 CDFO 10 GSTR
530
082244
1982 1985 CDFO 10 GSTR
082244
1982 1985 CDFO 10 GSTR
450
082244
1982 1985 CDFO 10 GSTR
481
082244
1982 1985 CDFO 10 GSTR
082244
1982 1985 CDFO 10 GSTR
---------- End TD2-Rec Example ----------
SITE CODE
OBS'D
EST'D
MEAS'D
2FS99JNSTH0106
013-000 2MS04013
000
28
3
29
12
3
014-000 2MS04014
014-089 2MS04014
000
089
3
2
16
8
1
016-000 2MS04016
000
1
4
1
032-086 2MS04032
101-043 2MS04101
086
043
1
2
4
8
Tag Detail by Run Year, Site Name (TD2-Run) : This fixed-field report summarizes recoveries of tag codes by run year, agency, fishery,
and recovery location code.
---------- Begin TD2-Run Example ---------FORMAT: TAG DETAIL BY RECOVERY SITE NAME (TD2) -- BY RUN YEAR
BRD- RUNTAGCODE
YEAR YEAR AGCY FC SITE NAME
AVG MM
082244
1982 1984 CDFO 50 H-QUINSAM R
082244
1982 1985 CDFO 10 GSTR
530
082244
1982 1985 CDFO 10 GSTR
082244
1982 1985 CDFO 10 GSTR
450
082244
1982 1985 CDFO 10 GSTR
481
082244
1982 1985 CDFO 10 GSTR
082244
1982 1985 CDFO 10 GSTR
---------- End TD2-Run Example ----------
SITE CODE
OBS'D
EST'D
MEAS'D
2FS99JNSTH0106
013-000 2MS04013
000
28
3
29
12
3
014-000 2MS04014
014-089 2MS04014
000
089
3
2
16
8
1
016-000 2MS04016
000
1
4
1
032-086 2MS04032
101-043 2MS04101
086
043
1
2
4
8
Tag Detail by Recovery Month, Site Name (TD3) : This fixed-field report summarizes recoveries of tag codes by recovery year, agency,
fishery, recovery location code, and month.
---------- Begin TD3 Example ---------FORMAT: TAG DETAIL BY RECOVERY SITE/CAL. MONTH (TD3)
TAGCODE
YEAR
AVG MM
082244
1984
082244
1985
530
082244
1985
082244
1985
450
082244
1985
481
082244
1985
082244
1985
---------- End TD3
AGCY FC
SITE NAME
CDFO 50
CDFO 10
H-QUINSAM R
GSTR
2FS99JNSTH0106
013-000 2MS04013
CDFO 10
CDFO 10
GSTR
GSTR
CDFO 10
GSTR
CDFO 10 GSTR
CDFO 10 GSTR
Example ----------
SITE CODE
MO OBS'D
EST'D
MEAS'D
000 07
28
3
29
12
3
014-000 2MS04014
014-089 2MS04014
000 07
089 07
3
2
16
8
1
016-000 2MS04016
000 07
1
4
1
032-086 2MS04032
101-043 2MS04101
086 07
043 07
1
2
4
8
Tag Detail by Recovery Year, Site Name (TD4-Rec) : This fixed-field report summarizes recoveries of tag codes by recovery year,
agency, fishery, recovery location code.
---------- Begin TD4-Rec Example ---------FORMAT: TAG DETAIL BY SITE SHORT NAME (TD4) -- BY RECOVERY YEAR
TAGCODE
082244
082244
082244
082244
082244
YEAR
1984
1985
1985
1985
1985
AGCY
CDFO
CDFO
CDFO
CDFO
CDFO
FC
50
10
10
10
10
SITE NAME
H-QUINSAM R
GSTR
GSTR
GSTR
GSTR
013-000
014-000
014-089
016-000
OBS'D
28
3
3
2
1
EST'D
29
12
16
8
4
MEAS'D
AVG MM
3
530
1
1
450
481
082244
1985 CDFO 10 GSTR
032-086
082244
1985 CDFO 10 GSTR
101-043
---------- End TD4-Rec Example ----------
1
2
4
8
Tag Detail by Run Year, Site Name (TD4-Run) : This fixed-field report summarizes recoveries of tag codes by run year, agency, fishery,
recovery location code.
---------- Begin TD4-Run Example ---------FORMAT: TAG DETAIL BY SITE SHORT NAME (TD4) -- BY RECOVERY YEAR
TAGCODE
YEAR AGCY FC SITE NAME
OBS'D
082244
1984 CDFO 50 H-QUINSAM R
28
082244
1985 CDFO 10 GSTR
013-000
3
082244
1985 CDFO 10 GSTR
014-000
3
082244
1985 CDFO 10 GSTR
014-089
2
082244
1985 CDFO 10 GSTR
016-000
1
082244
1985 CDFO 10 GSTR
032-086
1
082244
1985 CDFO 10 GSTR
101-043
2
---------- End TD4-Run Example ----------
EST'D
29
12
16
8
4
4
8
MEAS'D
AVG MM
3
530
1
1
450
481
Tag Detail by Site, Statistical Week (TD5) : This fixed-field report summarizes recoveries of tag codes by recovery year, agency, fishery,
recovery location code, and statistical week.
---------- Begin TD5 Example ---------FORMAT: TAG DETAIL BY SITE SHORT NAME/STAT. WEEK (TD5)
TAGCODE
YEAR AGCY FC SITE NAME
082244
1984 CDFO 50 H-QUINSAM R
082244
1985 CDFO 10 GSTR
082244
1985 CDFO 10 GSTR
082244
1985 CDFO 10 GSTR
082244
1985 CDFO 10 GSTR
082244
1985 CDFO 10 GSTR
082244
1985 CDFO 10 GSTR
082244
1985 CDFO 10 GSTR
082244
1985 CDFO 10 GSTR
082244
1985 CDFO 10 GSTR
---------- End TD5 Example ----------
013-000
013-000
013-000
014-000
014-000
014-089
016-000
032-086
101-043
WK
-1
27
29
30
28
30
29
29
29
29
OBS'D
28
1
1
1
1
2
2
1
1
2
EST'D MEAS'D AVG MM
29
5
1
570
0
1
430
6
1
590
3
13
8
1
450
4
1
481
4
8
Tag Raw Zero Filled (TR1) : This fixed-field report lists individual tag code recoveries sorted by agency, fishery, and recovery date.
---------- Begin TR1 Example ---------082244
Coho 82 850706 CDFO 10 2MN57011
082244
Coho 82 850706 CDFO 10 2MN57000
082244
Coho 82 850706 CDFO 10 2MS04013
082244
Coho 82 850713 CDFO 10 2MS17118
082244
Coho 82 850713 CDFO 10 2MS04014
082244
Coho 82 850713 CDFO 10 2MS01027
082244
Coho 82 850713 CDFO 10 2MS02023
082244
Coho 82 850713 CDFO 10 2MN57011
---------- End TR1 Example ----------
000
000
000
000
000
070
000
042
0.00
4.88
5.46
0.00
2.68
6.01
5.38
5.18
580
564
570
541
0
640
533
590
Tag Summary by Recovery Year, Fishery (TS1-Rec) : This formatted report summarizes recoveries of tag codes by recovery year,
fishery, and agency.
---------- Begin TS1-Rec Example ---------18:37:23 01/15/2003
Regional Mark Information System
PAGE 1
REPORT: TS1-Rec
ANNUAL RECOVERIES BY REC YEAR
TAGCODE:
082244
RELEASE AGENCY: CDFO
STUDY TYPE: E
1982 Fall
Coho
#CWT:
9843
HATCHERY: H-QUINSAM R
RELEASED: 6/ 1/1984
LOSS RATE:
0.013
SITE: R-QUINSAM R
LENGTH:
#NON-CWT:
17623
STOCK: S-QUINSAM R
YEAR FISHERY 1984
Recovery Agency ................. OBS'D
Hatchery
- CDFO
1984 TOTALS:
1985
Estuary Sport
Hatchery
Mixed Net and Seine
Mixed Net and Seine
Ocean Sport
Ocean Troll (non-treaty)
-
WDFW
CDFO
CDFO
WDFW
CDFO
CDFO
1985 TOTALS:
1986
Ocean Sport
1986 TOTALS:
- CDFO
EST'D
MEAS'D
AVG MM
28
29
28
29
1
142
45
2
99
28
2
199
160
4
355
123
42
2
601
655
21
559
317
844
65
589
1
4
1
4
TOTALS FOR TAGCODE 082244
---------- End TS1-Rec Example ----------
346
878
65
589
Tag Summary by Run Year, Fishery (TS1-Run) : This formatted report summarizes recoveries of tag codes by run year, fishery, and
agency.
---------- Begin TS1-Run Example ---------18:38:38 01/15/2003
Regional Mark Information System
PAGE 1
REPORT: TS1-Run
ANNUAL RECOVERIES BY RUN YEAR
TAGCODE:
082244
RELEASE AGENCY: CDFO
STUDY TYPE: E
1982 Fall
Coho
#CWT:
9843
HATCHERY: H-QUINSAM R
RELEASED: 6/ 1/1984
LOSS RATE:
0.013
SITE: R-QUINSAM R
LENGTH:
#NON-CWT:
17623
STOCK: S-QUINSAM R
YEAR FISHERY 1984
Recovery Agency ................. OBS'D
Hatchery
- CDFO
1984 TOTALS:
1985
Estuary Sport
Hatchery
Mixed Net and Seine
Mixed Net and Seine
Ocean Sport
Ocean Troll (non-treaty)
-
WDFW
CDFO
CDFO
WDFW
CDFO
CDFO
1985 TOTALS:
1986
Ocean Sport
- CDFO
1986 TOTALS:
TOTALS FOR TAGCODE 082244
---------- End TS1-Run Example ----------
EST'D
MEAS'D
AVG MM
28
29
28
29
1
142
45
2
99
28
2
199
160
4
355
123
42
2
601
655
21
559
317
844
65
589
1
4
1
4
346
878
65
589
Tag Summary by Month, Site Name (TS2) : This formatted report summarizes recoveries of tag codes by recovery year, fishery, agency,
recovery location name, and month.
---------- Begin TS2 Example ---------18:41:13 01/15/2003
Regional Mark Information System
PAGE 1
REPORT: TS2
1984 RECOVERIES OF TAGCODE
082244
BY CALENDAR MONTH
1982 Fall
Coho
LENGTH:
RELEASE AGENCY: CDFO
#CWT:
9843
HATCHERY: H-QUINSAM R
RELEASED: 6/ 1/1984
LOSS RATE:
0.013
SITE: R-QUINSAM R
STUDY TYPE: E
#NON-CWT:
17623
STOCK: S-QUINSAM R
FISHERY AREA....... DATA
JAN
FEB
MAR
DEC
UNK TOTAL
Hatchery
- CDFO
H-QUINSAM R
OBS
28
28
EST
29
29
#LM
MM
FISHERY TOTALS:
OBS
28
28
EST
29
29
#LM
MM
TOTALS FOR 1984
OBS
28
28
EST
29
29
#LM
MM
---------- End TS2 Example ----------
APR
MAY
JUN
JUL
AUG
SEP
OCT
NOV
Tag Summary by Fortnt, Site Name (TS3) : This formatted report summarizes recoveries of tag codes by recovery year, fishery, agency,
recovery location name, and fortnight (2-week period).
---------- Begin TS3 Example ---------18:43:43 01/15/2003
PAGE 1
REPORT: TS3
Regional Mark Information System
1985 RECOVERIES OF TAGCODE
082244
1982 Fall
Coho
RELEASE AGENCY: CDFO
RELEASED: 6/ 1/1984
STUDY TYPE: E
#CWT:
LOSS RATE:
#NON-CWT:
BY STATISTICAL FORTNIGHT
LENGTH:
HATCHERY:
SITE: R-QUINSAM R
STOCK:
9843
0.013
17623
FISHERY/AREA
WEEK NUMBER:
2
4
6
8 10 12 14 16 18 20 22 24 26 28 30 32 34 36 38 40 42 44 46 48 50
54
UNK TOTAL
Mixed Net and Seine
- WDFW
5 PLUS 4 & 4B
OBS
1
1
EST
3
3
#LM
1
1
MM
630
630
SAN JUAN ISLANDS 7
OBS
1
1
EST
1
1
#LM
1
1
MM
680
680
FISHERY TOTALS:
OBS
1
1
2
EST
3
1
4
#LM
1
1
2
MM
630
680
655
TOTALS FOR 1985
OBS
1
1
2
EST
3
1
4
#LM
1
1
2
MM
630
680
655
---------- End TS3 Example ---------Tag Summary by Statwk, Site Name (TS4) : This formatted report summarizes recoveries of tag codes by recovery year, fishery,
agency, recovery location name, and statistical week.
---------- Begin TS4 Example ---------18:49:47 01/15/2003
PAGE 1
REPORT: TS4
1982 Fall
Coho
RELEASE AGENCY: CDFO
RELEASED: 6/ 1/1984
STUDY TYPE: E
#CWT:
LOSS RATE:
#NON-CWT:
FISHERY/AREA
Mixed Net and Seine
5 PLUS 4 & 4B
WEEK 1
2
3
4
5
6
22 23 24 25 26 27
OBS
EST
#LM
MM
WEEK 28 29 30 31 32 33
49 50 51 52 53 54 UNK
TOTAL
OBS
1
1
EST
3
3
#LM
1
1
MM
630
630
SAN JUAN ISLANDS 7
WEEK 1
2
3
4
5
6
22 23 24 25 26 27
OBS
EST
#LM
MM
WEEK 28 29 30 31 32 33
49 50 51 52 53 54 UNK
TOTAL
OBS
1
EST
1
#LM
1
MM
680
52
Regional Mark Information System
1985 RECOVERIES OF TAGCODE
082244
BY STATISTICAL WEEK
LENGTH:
HATCHERY: H-QUINSAM R
SITE: R-QUINSAM R
STOCK: S-QUINSAM R
9843
0.013
17623
- WDFW
7
8
9
10
11
12
13
14
15
16
17
18
19
20
21
34
35
36
37
38
39
40
41
42
43
44
45
46
47
48
7
8
9
10
11
12
13
14
15
16
17
18
19
20
21
34
35
36
37
38
39
40
41
42
43
44
45
46
47
48
1
1
1
680
22
49
FISHERY
WEEK
23 24
OBS
EST
#LM
MM
WEEK
50 51
OBS
TOTALS:
1
2
3
25 26 27
28
52
29
53
4
30 31
54 UNK
5
6
7
8
9
10
11
12
13
14
15
16
17
18
19
20
21
32 33
TOTAL
1
34
35
36
37
38
39
40
41
42
43
44
45
46
47
48
1
2
EST
3
1
#LM
1
1
630
680
4
2
MM
655
22
49
TOTALS FOR 1985
WEEK 1
2
3
4
23 24 25 26 27
OBS
EST
#LM
MM
WEEK 28 29 30 31
50 51 52 53 54 UNK
OBS
5
6
7
8
9
10
11
12
13
14
15
16
17
18
19
20
21
32 33
TOTAL
1
34
35
36
37
38
39
40
41
42
43
44
45
46
47
48
1
2
EST
3
1
#LM
1
1
4
2
MM
630
655
---------- End TS4 Example ----------
680
Tag Estimation Analysis by Rec Year (TA1-Rec) : This formatted report summarizes recoveries of tag codes by recovery year. The
column headers in the report header are determined by the actual years in the query results.
---------- Begin TA1-Rec Example ---------20:43:44 01/15/2003
Regional Mark Information System
PAGE 1
REPORT: TA1-Rec
TAGCODE ESTIMATION ANALYSIS BY RECOVERY YEAR (1984-1995)
Tagcode
Tagged Hatchery Name
Sp
Run BrYr
1990 1991 1992 1993 1994 1995
TT
082244
9843 H-QUINSAM R
Coho Fall 1982
878
---------- End TA1-Rec Example ----------
1984
1985
1986
29
844
4
1987
1988
1989
Tag Estimation Analysis by Run Year (TA1-Run) : This formatted report summarizes recoveries of tag codes by run year. The column
headers in the report header are determined by the actual years in the query results.
---------- Begin TA1-Run Example ---------20:42:50 01/15/2003
Regional Mark Information System
PAGE 1
REPORT: TA1-Run
TAGCODE ESTIMATION ANALYSIS BY RUN YEAR (1984-1995)
Tagcode
Tagged Hatchery Name
Sp
Run BrYr
1990 1991 1992 1993 1994 1995
TT
082244
9843 H-QUINSAM R
Coho Fall 1982
878
---------- End TA1-Run Example ----------
1984
1985
1986
29
844
4
1987
1988
1989
Species Survival Analysis (SA1) : This formatted report calculates release group percent survival.
---------- Begin SA1 Example ---------20:35:47 01/15/2003
PAGE 1
REPORT: SA1
Tagcode
BrYr Date Rel Release Location....
CWT. Total Rel #Obs. #Est.... % Surv
082244
1982 19840601 R-QUINSAM R
17623
27466
346
877.71
8.92
Regional Mark Information System
SPECIES SURVIVAL ANALYSIS
SPECIES: Coho
Hatchery Location...
#CWT.... LossRt
H-QUINSAM R
9843
#Non-
0
Release Group Percent Survival: (%.Surv) = (Total{Estimated.Number})(100) /
(Number.Released.CWT)
---------- End SA1 Example ---------PSC 4.0 Data Exchange format (PRC) : Pacific Salmon Commission data exchange format for Recovery data. See "PSC Format V4.0
Specification" document.
Comma-Separated Values custom file (CSV) : Comma-separated-value report with fields selected by the user.
HTML custom table (HTM) : HTML table report with fields selected by the user.
Appendix D. Recoveries by Hatchery Report Format Descriptions
This appendix describes the report formats available in the "Recoveries by Hatchery" path of the RMIS Query System, and shows example output for all except CSV, HTM and
PSC formats. CSV and HTM reports are custom designed by the user, as described earlier in this manual, so the format varies depending on the fields chosen. PSC reports are
described fully in the "PSC Format V4.0 Specification" document.
Annual Rec by Recovery Year, Fishery (HS1-Rec) : This formatted report summarizes recoveries by recovery year, fishery, and agency.
---------- Begin HS1-Rec Example ---------20:51:00 01/15/2003
Regional Mark Information System
REPORT: HS1-Rec
ANNUAL RECOVERIES BY REC YEAR
HATCHERY: HUMPTULIPS HATCHERY
STOCK: HUMPTULIPS R 22.0004
YEAR FISHERY 1992
Recovery Agency ................. OBS'D
Coastal Gillnet
- QDNR
Commercial Seine
- ADFG
Groundfish Observer (Gulf of Alaska - NMFS
Hatchery
- WDFW
Mixed Net and Seine
- CDFO
Sport (private)
- WDFW
1992 TOTALS:
---------- End HS1-Rec Example ----------
PAGE 1
SPECIES: Chinook
RUN: Fall
EST'D
4
3
1
6
1
1
9
0
8
6
4
3
16
30
MEAS'D
AVG MM
3
433
6
1
1
478
355
420
11
449
Annual Rec by Run Year, Fishery (HS1-Run) : This formatted report summarizes recoveries by run year, fishery, and agency.
---------- Begin HS1-Run Example ---------20:54:57 01/15/2003
Regional Mark Information System
REPORT: HS1-Run
ANNUAL RECOVERIES BY RUN YEAR
HATCHERY: HUMPTULIPS HATCHERY
STOCK: HUMPTULIPS R 22.0004
YEAR FISHERY 1992
Recovery Agency ................. OBS'D
Coastal Gillnet
- QDNR
Commercial Seine
- ADFG
Groundfish Observer (Gulf of Alaska - NMFS
Hatchery
- WDFW
Mixed Net and Seine
- CDFO
Sport (private)
- WDFW
1992 TOTALS:
---------- End HS1-Run Example ----------
PAGE 1
SPECIES: Chinook
RUN: Fall
EST'D
4
3
1
6
1
1
9
0
8
6
4
3
16
30
MEAS'D
AVG MM
3
433
6
1
1
478
355
420
11
449
Estimated Recoveries by Calendar Month (HS2) : This formatted report summarizes estimated recoveries by recovery year, fishery,
agency, and recovery month.
---------- Begin HS2 Example ---------20:55:35 01/15/2003
Regional Mark Information System
PAGE 1
REPORT: HS2
1992 ESTIMATED RECOVERIES (CALENDAR MONTH)
HATCHERY: HUMPTULIPS HATCHERY
SPECIES: Chinook
STOCK: HUMPTULIPS R 22.0004
RUN: Fall
FISHERY/AREA....... JAN FEB MAR APR MAY JUN JUL AUG SEP OCT NOV DEC UNK TOTAL
------------------------------------------------------------------------------1992
------------------------------------------------------------------------------Coastal Gillnet
- QDNR
HUMPTULIPS R 22.0004
3
6
9
FISHERY TOTALS:
3
6
9
Commercial Seine
- ADFG
AK M 1 NE 109-62
AK M 1 SE 102-10
AK M 1 SW 104-40
0
0
FISHERY TOTALS:
0
0
Groundfish Observer (Gulf of Alaska - NMFS
HIGH SEAS 3 57N 151W
8
8
FISHERY TOTALS:
8
8
Hatchery
- WDFW
HUMPTULIPS HATCHERY
3
3
6
FISHERY TOTALS:
3
3
6
Mixed Net and Seine
- CDFO
CN
086-313
FISHERY TOTALS:
Sport (private)
- WDFW
MARINE AREA 1
FISHERY TOTALS:
TOTALS FOR 1992
---------- End HS2 Example ----------
4
4
4
4
3
3
7
3
3
30
3
17
3
Annual Recoveries by Recovery Year (HS4) : This formatted report summarizes recoveries by tag code, recovery year, fishery, and
agency.
---------- Begin HS4 Example ---------20:56:25 01/15/2003
Regional Mark Information System
REPORT: HS4
ANNUAL RECOVERIES BY RECOVERY YEAR
HATCHERY: HUMPTULIPS HATCHERY
STOCK: HUMPTULIPS R 22.0004
YEAR FISHERY -
Recovery Agency ................. OBS'D
TAG CODE 634117
1992 Coastal Gillnet
- QDNR
Commercial Seine
- ADFG
Groundfish Observer (Gulf of Alaska - NMFS
Hatchery
- WDFW
Mixed Net and Seine
- CDFO
Sport (private)
- WDFW
TOTALS FOR YEAR:
---------- End HS4 Example ----------
PAGE 1
SPECIES: Chinook
RUN: Fall
EST'D
4
3
1
6
1
1
9
0
8
6
4
3
16
30
MEAS'D
AVG MM
3
433
6
1
1
478
355
420
11
449
Recovery Estimation Analysis by Year (HA2) : This formatted report summarizes estimated recoveries by stock, species, run, brood
year, and recovery year.
---------- Begin HA2 Example ---------20:57:06 01/15/2003
Regional Mark Information System
PAGE 1
REPORT: HA2
RECOVERY ESTIMATION ANALYSIS BY RECOVERY YEAR (1990-2002)
HATCHERY: HUMPTULIPS HATCHERY
Stock Name
Sp
Run Br 1990 1991 1992 1993 1994 1995 1996 1997 1998
2000 2001 2002
TT
HUMPTULIPS R 22.0004 Chin Fall 90
30
302
976 1348
111
1
HUMPTULIPS R 22.0004 Coho
90
53 1149
---------- End HA2 Example ----------
1999
PSC 4.0 Data Exchange format (PRC) : Pacific Salmon Commission data exchange format for Recovery data. See "PSC Format V4.0
Specification" document.
Comma-Separated Values custom file (CSV) : Comma-separated-value report with fields selected by the user.
HTML custom table (HTM) : HTML table report with fields selected by the user.
Appendix E. All Recoveries Report Format Descriptions
This appendix describes the report formats available in the "All Recoveries" path of the RMIS Query System, and shows example output for all except CSV, HTM and PSC
formats. CSV and HTM reports are custom designed by the user, as described earlier in this manual, so the format varies depending on the fields chosen. PSC reports are
described fully in the "PSC Format V4.0 Specification" document.
PSC 4.0 Data Exchange format (PRC) : Pacific Salmon Commission data exchange format for Recovery data. See "PSC Format V4.0 Specification" document.
Comma-Separated Values custom file (CSV) : Comma-separated-value report with fields selected by the user.
HTML custom table (HTM) : HTML table report with fields selected by the user.
Recoveries by Fin Mark (FM1) : This formatted reports summarizes observed recoveries by fin mark, mark code, recovery year, and agency.
---------- Begin FM1 Example ---------21:55:50 01/15/2003
Regional Mark Information System
REPORT: FM1
RECOVERIES BY FIN MARK
FIN MARK
Adclip
Adclip
MARK
CODE
5000
5000
REC.
YEAR
1984
1985
REPORTING
AGENCY
CDFO
CDFO
OBSERVED
28
314
PAGE 1
Adclip
5000 1985 WDFW
Adclip
5000 1986 CDFO
Adclip TOTAL
---------- End FM1 Example ----------
3
1
346
Appendix F. Recoveries by Tag List Report Format Descriptions
This appendix describes the report formats available in the "Recoveries by Tag List" path of the RMIS Query System. CSV and HTM reports are custom designed by the user, as
described earlier in this manual, so the format varies depending on the fields chosen. PSC reports are described fully in the "PSC Format V4.0 Specification" document.
PSC 4.0 Data Exchange format (PRC) : Pacific Salmon Commission data exchange format for Recovery data. See "PSC Format V4.0 Specification" document.
Comma-Separated Values custom file (CSV) : Comma-separated-value report with fields selected by the user.
HTML custom table (HTM) : HTML table report with fields selected by the user.
Appendix G. Catch/Sample Report Format Descriptions
This appendix describes the report formats available in the "Catch/Sample" path of the RMIS Query System. CSV and HTM reports are custom designed by the user, as described
earlier in this manual, so the format varies depending on the fields chosen. PSC reports are described fully in the "PSC Format V4.0 Specification" document.
PSC 4.0 Data Exchange format (PCS) : Pacific Salmon Commission data exchange format for Catch/Sample data. See "PSC Format V4.0 Specification" document.
Comma-Separated Values custom file (CSV) : Comma-separated-value report with fields selected by the user.
HTML custom table (HTM) : HTML table report with fields selected by the user.
Appendix H. Locations Report Format Descriptions
This appendix describes the report formats available in the "Location Codes" path of the RMIS Query System. CSV and HTM reports are custom designed by the user, as
described earlier in this manual, so the format varies depending on the fields chosen. PSC reports are described fully in the "PSC Format V4.0 Specification" document.
PSC 4.0 Data Exchange format (PLC) : Pacific Salmon Commission data exchange format for Location data. See "PSC Format V4.0 Specification" document.
Comma-Separated Values custom file (CSV) : Comma-separated-value report with fields selected by the user.
HTML custom table (HTM) : HTML table report with fields selected by the user.