1
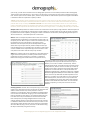
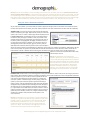
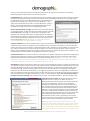
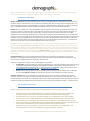
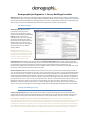
Demographix for Beginners 1: Survey Building Essentials What is this? One of a series of short documents, which combine together to make up the User Manual for Demographix. These documents let new users get up-to-speed quickly with building complex surveys; creating in-depth reports using filters and crosstabs of data; downloading data; managing surveys and users in a collaborative environment; and getting to grips with our easy-to-use panel management and email creation to get better responses from mailing lists. The Main Interface Workspace area: When you log-in you’ll see the surveys you have permissions to view, edit or analyse shown on the Workspace (headed Your Surveys) at left. There are three viewing tabs you can click on: Recently Accessed is the default view; Status View shows surveys listed according to whether they’re in production, live, closed to responses, etc; and Category View shows them in user-defined category folders. Hot tip: Initially you may see no surveys (because you haven’t created any yet) or just one (which you’ve been given permission to access). If you can see none, click on the Status tab and check the “In Production” folder. Information area: Also shown in the main interface is the Important Information section at right, which has two tabs: “Latest Updates” and “Documentation & Help”. Keep an eye on the latest updates from the team at Demographix letting you know about recent technical changes or occasional notices of upcoming downtime for maintenance. The Documentation & Help section includes access to these Beginner PDFs, as well as a random link to a Helpdesk FAQ – these can be very useful to check for fresh ideas and tips on usage. Account Functions menu: On the blue ribbon at top of the screen is a menu of shared account functionality available to you. The services shown here depend on your log-in status or the status of your account – so some of the following options may not be shown. Click on “Surveys” to see the top-level view of surveys available to you (the default view); “Panels” to access the panel management suite (however, note that this is not available to all users); “Lists” to create and edit lists of standard frequently-used answers to questions; “Media” to upload and edit images, audio and video files; “Scrapbook” to place questions for re-use in other surveys or sharing with others; “Search” to search the contents of all your surveys; and “Manage Your Account”, where you can keep your contact details up-to-date. The latter is essential if you want our Helpdesk to contact you when you have a query, or need to change your password. Some top-level log-ins will also have access to survey and user management tools through the latter link (see Demographix for Beginners 4 for further details). Creating and Editing a Survey Creating surveys and polls: If your log-in permits you to create a survey or quick poll from scratch, you will have two options under the Your Surveys area of the workspace: “Create new survey” and “Create new quick poll”. Click on either, and give the new survey/poll a name and internal reference in the Survey Properties, then save. You can now edit it… Hot tip: What’s the difference between a Survey and a Quick Poll? When you build a survey in Demographix, it automatically generates a URL for the survey when it is first previewed. This can be used to preview the survey as it is being developed and built. Once the survey has been published, and data starts to be collected, then analysis tools become available to you. Quick Polls, on the other hand, are for those who want to incorporate a simple one or two question poll on a website (sometimes in an iframe within a web page). These generate 2 URLs – the poll URL and the results page URL, both of which are needed by website designers to incorporate the poll and the “instant results” page after submission. www.demographix.com [email protected] +44 (0)20 7112 5111 EDIT option: If you have been given access to an existing survey, or are coming back to work on it, then simply click on the EDIT option beneath the survey’s name. The Editing interface is very similar to the main interface. It shows the survey content in the Workspace area at left, and the Survey Properties at right. Note also a second menu has appeared at the top of the survey in the blue ribbon, beneath the Account Functions. These are the functions available for this survey to you (depending on your permissions levels), and can include: Survey Properties, Appearance, Update/Preview pages, Publish. Hot tip: Take a moment to check all the parts of the Details tab in the Survey Properties. You may want to select a Progress bar for the survey; or enter a URL of a page to display after the survey has been submitted (make sure you tick the “Show even when survey is in pop-up” option to ensure the browser window is kept open); or change the text to be displayed when the survey has been closed to responses (the default is “This survey is now closed to responses” which works for most cases). There are other important options here too, such as advanced survey options, survey width and languages. Survey Properties: To begin there is no URL for your survey shown, but once you’ve previewed your survey for the first time, this will appear – then you will be able to give access to your survey to anyone on the internet. This URL does not change, even when the survey is published. Note also that if you have a log-in that allows you to assign access permissions for this survey to other colleagues or clients, there will be two tabs available that will enable this. How to Add Questions to a Survey and Edit them Adding questions: As you add new items to a survey (an image, a question, a new page, etc), or click on existing items to change them, then the properties for that item will show in the right-hand space where the Survey Properties is initially. In a new survey, for instance, you will see the title “First page - click to edit page title” and a text item: “CLICK HERE TO EDIT THIS TEXT OR CREATE YOUR FIRST QUESTION” in the workspace. By clicking on either pieces of text you can alter them to suit your needs. For instance, click on the text item and then either change its wording to the intro to your survey, or change it to a question by using the first drop-down box in the Details tab. The two images shown at right illustrate where we have first selected the “Single choice” question option from the item dropdown (top), and then chosen the “Horizontal” option in the next drop-down box (below). The latter indicates the answers will be displayed as a horizontal list, whereas you could chose to have them displayed vertically (a list) or a drop-down menu. Add the text of your question in the text field, and the list of possible answers (one per line) under that. Then save the question. When you save the question it will appear in the Workspace as a single-choice question with answers arranged horizontally. It’s easy to make changes once a question has been saved – e.g. choose “Vertical” to have the answers showing as a list, or change the text of the question or add new answer options. Then Save again. Hot tip: Have a good look at the options available to you under the QUESTION OR ITEM TYPE pull-down menu (question types include Matrix, Write-Ins, Sliders, Multimedia, and more) and also note that this menu includes components you can add to a survey that aren’t questions (e.g. pieces of text, images, and horizontal rules). Types of questions: It is useful to take a little time to consider the full range of question types available to survey builders in Demographix. Experienced survey designers know that use of a variety of types in a script get better response rates and better data. Single choice: Questions that can have only one answer from a list of options (“What sex are you?”, “What age group are you in?”, “Where do you live?”) form the basis of nearly all surveys. If you are thinking about analysis of data when building www.demographix.com [email protected] +44 (0)20 7112 5111 your survey, you will need to include some core demographic questions to cut and fliter/crosstab the data meaningfully. These questions have radio buttons* next to them, not tick boxes, ensuring that only one answer is selected at any given time. The last option can be an Other option, and the survey builder can add a Write-in question that appears when Other is selected to allow the respondent to specify in detail. *Hot tip: “Radio buttons” allow respondents to choose only one answer. If they try to select another answer, the first answer will automatically be unselected (remember the buttons on old transistor radios that would allow only one to be pressed down at any one time). THE BIGGEST MISTAKE that novice online survey builders make is to use a multi-choice question type (with tick boxes) for questions that need only a single answer (such as sex, age range, location). If you use tick boxes, some respondents will inadvertently select more than a single answer – invalidating the data they’ve submitted. Multiple choice: Respondents can select more than one answer from a list of options, using tick boxes. Advanced options in Demographix for survey designers include point-and-click enabling of: random rotation of the order of the list of answers (to prevent bias to the first options); limiting the number of choices that can be ticked; and designating the last option as “None of the above” – which will operate as a radio button. Matrix: These are compound questions where each row concerns a specified variable or statement, and respondents answer from a set of options per row. Where only one answer can be selected per row, the questions can have radio buttons or drop-down menus, whichever suits the layout best (see the example shown at right where there are just a few columns). Where multiple answers per row are allowed, there is a checkbox type. Two write-in matrix types are also available that let respondents type in their answers: a text entry matrix and another that will accept only numbers. Sliders: This question type can be regarded as a visual alternative to single-choice matrix questions, as sliders provide another way for respondents to select a response to a variable or a statement. Rather than having rows of radio buttons or drop-down menus, sliders let you slide an icon along an axis, and settle on a response (the exact response will show in the tool tip in a browser, so it can be a number or some words). See the example shown at left. The slider for item 1 has been moved to the position 6, which is shown in the tool tip. The tool tip changes as the slider is moved to show exactly what value it represents. The scale used here is 1 to 10, but sliders also allow Likert statements (e.g. Excellent to Very Poor, or Highly Satisfied to Highly Dissatisfied) and these will show as pieces of text in the tool tip. Note that the default position for the slider is 1, but that it has a grey slider icon. Once a value has been actively chosen, this icon turns to red, and when the survey is submitted, only those rows where active selection has been made will have the data saved. You can make this question compulsory, so every row must have an active selection. Ranking questions: Another often-used question type is the ranking question: the respondent is shown a list of items or statements and asked to select and rank all (or some) of these in order of preference. In Demographix, items are grabbed and dragged above a line to select and rank them. At right, you can see that the items that are selected are then shown in an ordered list above the grey line. When the survey is submitted we note the items that have been actively listed, and assign weighted values to them in the analysis. Ranking questions can be tailored so that the list is shown in a different random order each time the survey is served. You can also limit the number of items that can be ranked. For respondents who have difficulty using a mouse, the items can be selected using tab keys and moved by using the arrow keys. www.demographix.com [email protected] +44 (0)20 7112 5111 Hot tip: Once you start building a survey and adding new elements to it, we advise new users to update and preview the survey frequently while building it – check out that each item looks and works the way you want it, as you add it. Just click the “Preview pages” link in the survey function, and Demographix will run through your survey to check for conflicts, and then show a button saying “Show Preview”. Click on this and a preview of your survey will pop-up for you to check through it. Make sure all the conditionals, compulsory questions and derived questions work. Preview as much as you like. Using the Tabs in Question Properties As you add a new question, you will see that the question properties at right have a series of tabs. The Details tab shows the text of the question and answers, plus other special properties. Let’s look at what the three other tabs do individually: Validation tab: This is the tab that has a tick box that will make the question compulsory (see right). Respondents who don’t answer this question (or a row in a matrix or slider type) will be alerted by words (“ANSWER REQUIRED”) and background colours (see below left) to the fact that they must give an answer in order to proceed. In the example shown below, the respondent has missed out two rows of the matrix, which are highlighted. We highly recommend that you use this option with restraint. However, you may have a series of demographic questions (for example, age, sex, location) that you definitely want answered. Write-in questions have a second option – where the values entered can be validated (e.g. checked to ensure they are a number, email address, web address, UK post code or US zip code). Our system only checks that the entered values adhere to a basic format; it doesn’t check that an email address entered or website URL are working. We recommend you pipe the answer into a Yes/No single choice question to check with respondents that what they have entered is correct. Hot tip: As stated above, we recommend a judicious “light-touch” use of compulsory questions – if you make everything compulsory your response levels will suffer dramatically. Ask yourself: “What if the respondent has no answer or opinion here? Am I forcing them to enter false data?” Be careful to allow for all possible responses on a compulsory question – if a respondents option is not included, they will give you incorrect data or not complete. Conditions tab: Conditionality is one of Demographix’s most powerful features, and it’s easy to set-up using our point-andclick interface. Both individual questions and pages of questions can be made conditional on how a respondent answered a previous question. So, you can have a series of questions that you only show to respondents who answer Female to an initial “Are you: M/F” question. Conditional logic works by saying: “Hide this question, unless you answered a previous question with this (or these) answers”. See the example shown right, where this question will appear only to people who have said they are under the age of 45. Note that you can have multiple conditional control questions (i.e. respondents need to fulfil criteria of certain answers in several previous questions). Pages can also be conditional. So if you have 4 questions just for women, put them on a page and make the Page conditional on whether they ticked the Female option in the control question. Hot tip: Conditionality is an online version of “Jump to Question X” statements on paper surveys. But the logic is different: rather than thinking “jump to”, you need to get in the mind frame of “Show them this if they answered x (or x, y or z)”. The most common conditional question is a Write-In box, only shown if they tick “Other” (or “Other - please specify”). We suggest you try a few conditional questions and test them in Preview mode. www.demographix.com [email protected] +44 (0)20 7112 5111 Actions tab: Notice that there are quite a few important actions available on the question property’s Actions tab: here you can select actions such as: deleting a question, duplicating a question, or copying the question to the scrapbook. There is a different set of options on the Actions tab of a Page Properties box, such as Remove page break, Change order of pages in the survey, duplicate the page and Re-order questions/items on the page. We show the different sets of actions available for questions and pages below. Hot tip: Demographix gives you full flexibility to re-order your questionnaire (either the order of pages, or the order of questions on a page), but we recommend that every time you do, you should also update and preview/test the survey. Advanced features in survey editing Now that you know what types of questions you can use, and how easy it is to add new questions to a survey and control their properties, let’s look at some of the advanced features that are available to you. Derived answers: Demographix allows you to derive the answers shown in a range of questions from answers selected in a previous multiple-choice question. The types of questions that can have derived answers are: single-choice and multichoice questions, the rows in a matrix or slider question, and the available options listed on a ranking question. For example, you may have a list of supermarkets, and ask respondents to tick the ones they have shopped at in the previous month. In the following matrix or slider question, for example, you can ask them to state how satisfied they were with their last experience – but only show the names of the supermarkets they have pre-selected. Deriving answers is easily enabled through our point-and-click interface. On the Details tab of the question properties just click the tick box labelled “Derive visible rows from answers to a previous question” (see example right, which is deriving the rows to be used in a matrix question). A drop-down menu will appear showing all the previous multiple-choice questions in the survey. Select the one you want to derive your answer options from, and the list will appear, greyed-out, in the box below. Note that this connection is dynamic – if you subsequently change the list of answer options in the original control question, the derived answer possibilities will also change automatically. Hot tip: Please note that only multiple choice questions can serve as control questions. Single choice questions cannot. Also note that you can derive the options that were not selected in the original control question, by choosing the “Display non-selected options” radio button (see example above). Piped answers: The answer from a single-choice question or write-in can be piped into the question text of a subsequent question. This allows survey designers to create questions that are focussed and less open to misinterpretation. Here’s an example question: “You said your favourite colour is [piped answer from previous question]. Please tell us the main reason for this choice”. This facility is enabled by ticking the box in the Answer Piping section beneath the text of the question (see left). You must insert a double asterisk (**) into the question text where the previous answer will display. The Answer Piping section lets you choose the relevant question from a drop-down menu listing all previous single-choice questions. This feature is dynamic in the live www.demographix.com [email protected] +44 (0)20 7112 5111 survey, so if the respondent goes back to change the selection from the original control question, the survey will dynamically update the piped answer in the text of the question. Pre-defined lists: Each question has a box where you type in the possible answers, with each answer entered on a new line. But rather than typing in frequently-used lists each time you use them, Demographix allows you to use Pre-defined Lists. For example, you can have a standard Excellent-Poor range of answers (e.g. Excellent, Good, Average, Poor, Very poor) as a pre-defined list – it will appear in the dropdown list if you click on “Use pre-defined list”, and if you select it, the list will be populated into the Possible Answers text box. No worries about missing out an option or making spelling mistakes. Re-order questions/items on a page: This option can be accessed by clicking on the Page properties, and then the Actions tab. Select the option “Re-order QUESTIONS/ITEMS on this page”, and the Re-order Tool appears in the properties area. This looks very similar to a ranking question (see right); but with the text of the questions or objects showing in each bar. This tool allows you to drag-and-drop the questions/items into a new order, and then save the re-arranged page. Hot tip: We suggest you update and preview the survey every time after re-ordering questions on a page. Using the Scrapbook: If you have a complex question, and you want to add it to another survey, you can copy it into your Scrapbook, and then use the “Insert Question from Scrapbook” link at the bottom of any page in your survey. Select the question you want to insert and click the “Insert selected items” button. A question in your Scrapbook can only be seen by you, unless you choose to share it with the rest of the people in your account. Choose the “Share” button next to the question in the Scrapbook Manager. If you change your mind, click on the “X” symbol next to the Shared notification, and the system will unshare that question, and keep that item private to your log-in. Pre-selected answers: If you need to pre-select an answer option in a question, simply place an asterisk at the beginning of the line for that option (use no spaces) in the Possible Answers text box. When the survey is served, this option will be preselected (the radio button will be selected, or the tick box will display a tick). Hot tip: Be very careful when using this option. Many research professionals denigrate pre-selection as it can prejudice the respondent in favour of a particular answer, and respondents can feel they are being biased towards the answer. Page breaks: We always recommend you break your survey up into small pages of questions. This helps respondents focus on a small set of questions in bite-size chunks. It also improves survey response levels because respondents are not put off by long scrolling pages of questions. If you have added quite a few questions, you will see that respondents will need to scroll down the page, and this is something we do not recommend. A lot of questions on a single page is off-putting to respondents (it looks like too much hard work), so we suggest you break your survey up into pages with 2-3 questions per page. This will greatly increase your response rates, and also make your data more reliable as it helps focus respondents on one or two questions (or small groups of questions) at a time. To add a page break, simply click on the question that will be the first one on the new page. Click the Actions tab, and select “Insert page break before”. Give the new page a title! Update/preview as you build: We strongly recommend that you preview and test your survey as you build it. Click on the Update/preview link in the blue ribbon menu (see left). Be careful not to use the Publish button until your survey is fully built. Publishing and unpublishing surveys to see how they will look is time-consuming and resource-intensive. Previewing allows you to test out all the functionality quickly and make changes the most efficiently. You may even wish to share the survey in development with others – simply circulate the URL for them to preview it. The system will work through the pages of the survey you have already built, checking page and question conditions, and check that derived answers are all in order. It generates a report once the survey has been built, and then displays a “Show preview” button. Click this, and the survey will appear in a pop-up window. Hot tip: If you want to print out a copy of the survey, or send a version of it in PDF format to someone else, then note the “Printerfriendly version” option at the top right of the workspace in Edit mode. This will create a version of the survey that is fully checkable – for example, all options in a drop-down menu are shown, as well www.demographix.com [email protected] +44 (0)20 7112 5111 as full conditionality and validation shown. Common scripting errors can be easily identified in preview and PDF formats – such as, having a page with just one conditional question on it. If a respondent does not fulfil the condition to see the question, they will get a blank page. Changing the Appearance of Survey Customise Survey Appearance: Once you’ve started previewing your survey you’ll want to start making changes to the appearance of it. Every survey has its own “style sheet”, which can be fully customised. You can easily add logos to the top of every page of the survey, change its background colour, change fonts, font size and text spacing, and change the progress bar (if you’re using it). Clicking on the Appearance option in the blue ribbon Survey menu bar displays the control panel (shown at right) with the Text tab selected as default. Demographix allows you to control the style of the following textual elements of your survey: the Survey title, Page headers (if shown), Question text, Question answers, and three types of textual elements – large text, medium text and small text. You can also change the colour and fonts of the progress bar, if used. To make changes to one of these items first select it by clicking on the open red circle at its left. It will change to a full red circle when selected. (Note in the example at right that we have selected Small text to make our changes to). Now you can change its font face (using the pull-down menu as shown), tick the B box to change it to bold face or the I box to change to italic face. The coloured ABC symbol lets you change the colour of the font – either by selecting from a palette or by using web hex codes (such as #FF0000 for solid red). Hot tip: Note the other options for each text item: Font size, Space above, Space below and Line height. For example, Space above allows you to add more space between questions or around text items. Allied with line height you have a lot of power to alter the look of your survey so that it can look anything from “tight” to “spaced out”. Save: When you have made your changes you can click the “Pop-up sample” button to see the effect. When you are satisfied with the results, press the “Save” button to save your new stylesheet. However, the style changes will not be applied to your survey until you have pressed the “Update/preview” option on the Survey menu. Note that there are three other tabs on the Customise Survey Appearance control panel: Background, Page Header, Actions. The Background tab gives you tools to customise the background applied to every page in your survey. You may want to alter the colour of the background, or apply a banner image that you have uploaded through the Media option in the Account Functions menu. You can have repeating images, vertically and horizontally. The Page Header tab lets you change the header on each page: you can use the survey title, an image, or nothing. The Survey title is default, though often it is replaced by a logo – either left-aligned, centred or rightaligned. The survey title is then given on the first page by using a large text element. On subsequent pages just the logo appears, and page titles are used to signify the focus of what the questions on that page are about. The Actions tab has one of the most powerful Appearance options: here you can apply a style sheet from another survey. So, if a template survey has been created that prescribes textual elements and logos of your brand, the style sheet from it can be easily applied to your new survey. Hot tip: The Colour Picker is a pop-up that appears when you want to control the colour of a text element or the background colour of your survey. There is a lot of power in this controller (shown right). The top row (labelled “Colours in use”) shows the colours currently in use for the survey. Using this you can easily match colours between elements. The colours are shown from left to right in order of how they are listed on the Text tab – from Survey title to Progress bar. Hover over each to see what they are. If, for example, you wanted to match the progress bar colour to the survey title colour, simply click on the survey title colour shown on this row. Below this are a www.demographix.com [email protected] +44 (0)20 7112 5111 range of “Themed colours” in a drop-down list. Here you can select palettes of colours to create a harmonious looking survey. Use the circled + and – symbols at right to increase or decrease colour brightness. Publish and collect data Ready to publish? Once you’ve finished building your survey, have made alterations to the appearance, have sent round the URL to others to test and check, and are ready to start collecting data, then it’s time to press the Publish button. This option is available to all log-ins except Colleagues* and Clients. The Publish button is the last item, at right, on the Survey menu. *Colleagues will have to ask the manager who gave them access to the survey to publish it for them. Publish: When you publish your survey, Demographix will automatically create the back-end system to collect data, and the range of options to analyse the data. The In Production watermark surrounding your survey will now disappear – its absence shows that the survey is ready to receive data. The survey is now live, and anyone who clicks on the URL, completes the survey and clicks “Submit Answers”, will have their responses saved. It is important that you have finished testing your survey at this stage, or test data will be saved. The only way you can get rid of live test data is to Unpublish the survey (an option only available if there are fewer than 25 responses), which will delete all data collected and return the survey to In Production mode. Note: the Unpublish option is found under the Survey Properties menu, in the Details tab: click on the “Survey status” link and select Unpublish from the drop-down menu. Hot tip: A frequently asked question is: can I make changes to a survey after it’s published; for instance, I forgot to add a question answer. The short answer is “not easily”. Once the survey is published, very few changes can be made. You can alter the text of a question, if you’ve made a spelling mistake, but you can’t add, edit or rearrange answers. The only way you can make these changes is to Unpublish your survey (as above), and that is only possible if you spot your error before more than 25 responses have been submitted. We STRONGLY ADVISE that you test your survey thoroughly before you publish it. In the last resort, you can submit a Helpdesk ticket or phone Helpdesk to discuss your problem with us. If we can help, we will. Circulating the URL: You can now circulate the URL of the survey via email links or a website link. If you are using Panelwise, our emailing and panel management system, refer to the panel management documents elsewhere in this series for tips on email best practice for maximising response levels. There are a couple of other things to note. The Demographix system offers: Friendly URLs: Contact helpdesk if you need a friendlier URL that is to be made available in printed form. Copying a standard Demographix survey URL will invariably lead to mistakes and frustration. A FURL takes the form: www.completeasurvey.com/yourbrand or www.yoursurvey.co.uk/ABC2010, and a variety of domain names are available for you to choose from. See the Helpdesk for further details. Sources: You can add tags to the end of a survey URL to track where responses are coming from. For example, you could add ?website or ?email. We capture these and make them available in the analysis interface. Closing to responses: Once you’ve reached your cut-off date, you can close your survey to responses. The “Close to responses” option is found under the Survey Properties menu/Details tab, on the Survey status drop-down menu. We recommend that you do this when your fieldwork ends, in order to preserve the integrity of your data. Surveys left open to responses will mean data added after the cut-off data will have to be removed by individual response – a tedious process. Five Top Best Practice Tips: Finally, a few best practice tips to ensure your survey gets good results and saves you time! Draft your survey script in Microsoft Word or another text editor, where you can refine your conditional logic and the overall structure, and then cut and paste into Demographix. Preview and test your survey as you build it. Check your conditionality if you make changes. If you can’t see your changes, remember to use the Update/preview button – it builds a new version of the survey each time. Also make sure your browser is not cacheing previous versions. Don’t use tick boxes for single-choice questions! Radio buttons (single choice) and tick boxes (multichoice) allow respondents to give you the kind of data each question requires. Split your survey up into pages of 2-3 questions each, providing focus for respondents, and increasing response rates by not showing long pages of multiple questions. www.demographix.com [email protected] +44 (0)20 7112 5111