1
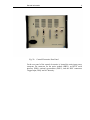
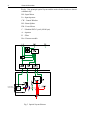
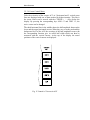
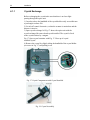
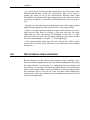
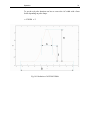
PulseScout Autocorrelator
PScout Series User’s Manual
ii
Preface
Warranty
Newport Corporation warrants that this product will be free from defects in
material and workmanship and will comply with Newport’s published
specifications at the time of sale for a period of one year from date of
shipment. If found to be defective during the warranty period, the product
will either be repaired or replaced at Newport's option.
To exercise this warranty, write or call your local Newport office or
representative, or contact Newport headquarters in Irvine, California. You
will be given prompt assistance and return instructions. Send the product,
freight prepaid, to the indicated service facility. Repairs will be made and the
instrument returned freight prepaid. Repaired products are warranted for the
remainder of the original warranty period or 90 days, whichever is longer.
Limitation of Warranty
The above warranties do not apply to products which have been repaired or
modified without Newport’s written approval, or products subjected to
unusual physical, thermal or electrical stress, improper installation, misuse,
abuse, accident or negligence in use, storage, transportation or handling. This
warranty also does not apply to fuses, batteries, or damage from battery
leakage.
This warranty is in lieu of all other warranties, expressed or implied,
including any implied warranty of merchantability or fitness for a particular
use. Newport Corporation shall not be liable for any indirect, special, or
consequential damages resulting from the purchase or use of its products.
First printing 2007
© 2007 by Newport Corporation. All rights reserved. No part of this manual
may be reproduced or copied without the prior written approval of Newport
Corporation.
This manual has been provided for information only and product
specifications are subject to change without notice. Any change will be
reflected in future printings.
Newport Corporation
1791 Deere Avenue
Irvine, CA, 92606 USA
P/N 90002247 Rev. A
Preface
iii
EU Declaration of Conformity
We declare that the accompanying product, identified with the
mark,
complies with requirements of the Electromagnetic Compatibility Directive,
89/336/EEC and the Low Voltage Directive 73/23/EEC.
Model Number: PScout Series Autocorrelator and all options
Year
mark affixed: 2007
Type of Equipment: Electrical equipment for measurement, control and
laboratory use
Standards Applied:
Compliance was demonstrated to the following standards to the extent
applicable:
EN 50082-1 Electromagnetic compatibility - Generic immunity standard Part 1: Residential, commercial and light industry
EN 55011 Radio Frequency Disturbance - Industrial, scientific and
medical (ISM) radio-frequency equipment - Radio disturbance characteristics
- Limits and methods of measurement (IEC CISPR/B/269/CDV)
EN 61010-1:2001, 2nd Edition “Safety requirements for electrical equipment
for measurement, control and laboratory use”
Bruno Rety
Group Director of PPT Instrument and Motion Europe
Micro-Controle Division of Newport Corporation
Zone Industrielle
45340 Beaune-la-Rolande, France
Dan Dunahay
Director of Quality Systems
Newport Corporation
1791 Deere Avenue
Irvine, Ca. 92606, USA
iv
Preface
Technical Support Contacts
North America & Asia
Europe
Newport Corporation Service Dept.
Newport/MICRO-CONTROLE S.A.
1791 Deere Ave. Irvine, CA 92606
Zone Industrielle
Telephone: (949) 253-1694
45340 Beaune la Rolande, FRANCE
Telephone: (800) 222-6440 x31694
Telephone: (33) 02 38 40 51 56
Asia
Newport Opto-Electronics
Technologies
253 Aidu Road, Bld #3, Flr 3, Sec C,
Shanghai 200131, China
Telephone: +86-21-5046 2300
Fax: +86-21-5046 2323
Newport Corporation Calling Procedure
If there are any defects in material or workmanship or a failure to meet
specifications, promptly notify Newport's Returns Department by calling
1-800-222-6440 or by visiting our website at www.newport.com/returns
within the warranty period to obtain a Return Material Authorization Number
(RMA#). Return the product to Newport Corporation, freight prepaid,
clearly marked with the RMA# and we will either repair or replace it at our
discretion. Newport is not responsible for damage occurring in transit and is
not obligated to accept products returned without an RMA#.
E-mail: [email protected]
When calling Newport Corporation, please provide the customer care
representative with the following information:
•
•
•
Your Contact Information
Serial number or original order number
Description of problem (i.e., hardware or software)
To help our Technical Support Representatives diagnose your problem,
please note the following conditions:
•
•
•
•
Is the system used for manufacturing or research and development?
•
Can you identify anything that was different before this problem occurred?
What was the state of the system right before the problem?
Have you seen this problem before? If so, how often?
Can the system continue to operate with this problem? Or is the system nonoperational?
Preface
v
Table of Contents
Warranty................................................................................................. ii
EU Declaration of Conformity.............................................................. iii
Technical Support Contacts .................................................................. iv
Table of Contents ....................................................................................v
1 General Information
1.1
1.2
Introduction ...................................................................................1
Optical Assembly ..........................................................................5
1.2.1 Overview ...........................................................................5
1.2.2 Time Delay ........................................................................5
1.2.3 Mixing Crystal...................................................................5
1.2.4 Signal Detection ................................................................6
2 Specifications and Models
2.1
2.2
4.2
4.3
4.4
4.5
4.6
9
Menu Structure Overview .............................................................9
Control Menus .............................................................................11
3.2.1 Main Menu ......................................................................11
3.2.2 Correlator Submenus .......................................................12
3.2.3 Other Submenus ..............................................................17
4 Installation
4.1
7
Specifications ................................................................................7
Standard PScout Series Products...................................................8
3 Menu Structure
3.1
3.2
1
21
Detector and Crystal Installation.................................................21
4.1.1 Crystal Exchange.............................................................22
4.1.2 Detector Exchange...........................................................23
Interconnect Cables .....................................................................24
Input Alignment...........................................................................24
4.3.1 Baseplate Attachment......................................................24
4.3.2 Input Laser Beam Alignment ..........................................25
Collinear Autcorrelation..............................................................26
Finding the Autocorrelation Trace ..............................................26
Non-Collinear Autocorrelation....................................................27
vi
Preface
5 Operation
5.1
5.2
5.3
5.4
5.5
5.6
Basic Operation ...........................................................................29
Scan Range Variation ..................................................................29
ZERO - Scan ................................................................................29
Low Pass Filter ............................................................................30
Interference Modulation ..............................................................30
Calculation of the ACF Half Width.............................................30
6 Troubleshooting
6.1
6.2
6.3
29
33
Rotation of Plane of Polarization ................................................33
Fundamental Overload ................................................................34
Common Errors ...........................................................................34
6.3.1 No SHG Signal ................................................................34
6.3.2 Input Power Too Small....................................................35
6.3.3 No Clear ACF..................................................................35
7 Safety
37
8 Factory Service Information
39
8.1
Service Form ...............................................................................39
1
General Information
1.1
Introduction
The PulseScout autocorrelator consists of two components, the optics module
shown in fig. 1 and the control electronics shown in fig. 2a and fig. 2b. The
optics module contains a Michelson-interferometer, the delay unit, the
interaction unit (SHG unit) and the detector head. The control electronics
contain the necessary drivers and amplifiers, the display, and the power
supply.
Fig. 1
Optics Module
1
2
General Information
The front panel of the control unit is shown in fig. 2a. There is a power
switch and the push buttons for controlling:
- the cursors < / CURSOR / >
- the phase matching angle TUNING + / - the scan ranges SCAN RANGE + / The front panel also includes a MAIN and RETURN buttons for navigating
the menu tree. MAIN takes you to the Main Menu, while RETURN takes you
back one level in the Menu Structure. Additionally, includes (6) soft keys at
the right edge of the display. The function of these keys depends on what
menu you are in. Please refer to Chapter 3 for menu details. A GAIN tuning
knob is located in the lower right corner of the front panel.
Fig. 2a
Control Electronics Front Panel
General Information
Fig. 2b
3
Control Electronics Rear Panel
At the rear panel of the control electronics is located the main input power
connector, the connector for the optics module (DB25), an RS232 serial
interface (DB9), optional spectrometer (DB15), and the BNC connectors
Trigger Input, Delay and AC Intensity.
4
General Information
In fig. 3 the principal optical layout and the main electrical units are shown
schematically.
IM - Input Mirror
IA - Input Aperture
CW - Control Window
BS - Beam Splitter
FM - Focus Mirror
C - Ultrathin SHG-Crystal (100/40 µm)
A - Aperture
Fi - Filter
Det - Detector module
Exchangeable
detector module
DET
Fig. 3 Optical Layout Scheme
General Information
5
1.2
Optical Assembly
1.2.1
Overview
The optical beam path can be traced in fig. 3. Entering the optical assembly
at the input aperture, the laser pulse is divided into two parts at the beam
splitter. Each part traverses an interferometer arm containing a retroreflector.
One of the retroreflectors is mounted on a special linear translation stage that
can change the length of one interferometer arm in a continuous fashion. The
two replica pulses then are recombined by the beam splitter, focused by a
mirror, and overlapped in a nonlinear optical crystal. Light generated in the
nonlinear crystal is then detected by a filtered photomultiplier (PMT) tube or
photodiode.
A portion of the back-reflected beams can be seen on the window next to the
input aperture and are used for alignment of the beam into the autocorrelator.
1.2.2
Time Delay
The time delay for generation of the autocorrelation trace is introduced by
movement of a retroreflector mounted on a linear delay stage.
Whenever the instrument is turned on, the delay stage will be oscillating at
its resonant frequency of approximately 10 Hz.
A voltage, proportional to the scaled position of the delay stage, is available
at the “X” BNC connector at the rear panel of the electronic controller.
1.2.3
Mixing Crystal
When tilted to the proper angle, a small amount of frequency doubled light is
generated in the nonlinear crystal.
In collinear geometry, the two replica pulses follow the same beam path and
generate second harmonic light whether or not they overlap temporally. The
intensity contrast between exactly overlapped pulses and pulses with no
overlap is 3:1.
In non-collinear geometry, only the second harmonic light produced by
temporal overlap is detected. Hence, the contrast between exactly overlapped
pulses and pulses with no overlap is infinite.
Normally, the nonlinear crystal is inaccessible because it is slightly
hygroscopic and can become fogged by high humidity. However, should the
crystal need to be cleaned or exchanged, it can be accessed by removal of the
upper cover of the optical assembly.
6
General Information
1.2.4
Signal Detection
Second harmonic light, generated in the mixing crystal is detected by a
photomultiplier tube or photodiode, which has been filtered to block
transmission of light at the wavelength of the laser. The photo detector
converts light intensity into an electronic signal. This signal is then
electronically amplified and filtered, and is available at the “Y” BNC
connector at the rear panel of the electronic controller.
2
Specifications and Models
2.1
Specifications
Optical parameters:
Max. scan range:
15 ps
Resolution:
<1 fs
Scan frequency (approx.):
20 Hz
Linearity distortions:
<1%
Input polarization:
E horizontal
(E vertical with polarization rotator)
Standard Wavelength Range:
700-1100 nm
Optional Wavelength Ranges:
420-550, 520-750, or 1000-1600 nm
(1)
< 10-4 W2 (PAV x PPEAK)
PMT Detector Sensitivity :
Photodiode Detector Sensitivity(1): 1W2 (PAV x PPEAK)
Input beam height adjustment:
75 - 115 mm
Electrical parameters:
Input Power:
Analog Outputs:
Serial Interface:
Trigger input:
Dimensions (L x W x H):
95-264 VAC, 50/60 Hz
0-10 VDC
RS232
5 V / 470 Ω
Optical Unit:
Control Electronics:
Alignment Base (max.)
104 x 141 x 111 mm
292 x 280 x 186 mm
62 x 148 x 132 mm
PPEAK x Tau = PAV x f_rep
Tau = Pulse duration
f_rep = Repetition rate
7
8
Specifications and Models
2.2
Standard PScout Series Products
Below is Newport’s standard PScout Series offering.
configurations are available by contacting Newport.
Other custom
Autocorrelators:
PSCOUT HR
PulseScout Autocorrelator, 50-3500fs, 700-1100nm, PMT
PSCOUT LR
PulseScout Autocorrelator, 50-3500fs, 700-1100nm, Photodiode
PSCOUTSP HR
PulseScout Autocorrelator, 20-3500fs, 700-1100nm, PMT
PSCOUTSP LR
PulseScout Autocorrelator, 20-3500fs, 700-1100nm, Photodiode
PulseScout Upgrades and Accessories:
PSCOUTUPG-BLUE1
Blue PMT Detector Module, 420-550nm
PSCOUTUPG-BLUE2
Blue PD Detector Module, 420-550nm
PSCOUTUPG-RED1
Red PMT Detector Module, 520-750nm
PSCOUTUPG-RED2
Red PD Detector Module, 520-750nm
PSCOUTUPG-HR
NIR PMT Detector Module, 700-1100nm
PSCOUTUPG-LR
NIR PD Detector Module, 700-1100nm
PSCOUTUPG-IR1
IR PMT Detector Module, 1000-1600nm
PSCOUTUPG-IR2
IR PD Detector Module, 1000-1600nm
PSCOUTUPG-SP
PSCOUT Short Pulse Conversion Kit, 20fs
PSPECNIR
CCD Spectrometer, 700-1100nm
PSPECVIS
CCD Spectrometer, 300-700nm
PSCOUT IEEE
PulseScout IEEE Inferface
PSCOUT USB
PulseScout USB Interface
PSCOUT WINDOWS
PulseScout Windows Control Software (RS232)
PSCOUT LABVIEW
PulseScout Labview Driver (RS232)
3
Menu Structure
3.1
Menu Structure Overview
The scan range SCAN RANGE +/-, the gain GAIN, the phase matching angle
TUNING +/-, and the cursors < / CURSOR / > are controlled directly with the
corresponding elements on the front panel (see fig. 2). The TRIGGER input
(BNC connector) is used to apply the trigger signal from the laser necessary
for an operation in the sampling mode.
All other functions are menu-controlled. Fig. 4 shows an overview of the
whole menu structure which is controlled by 6 soft keys at the right side of
the display. Framed texts indicate active commands, texts without frames are
for information only. The MAIN and RETURN buttons are used to navigate
back from the current menu.
In chapter 3.2 the menus, their functions and their handling are described in
detail.
9
10
Menu Structure
Fig. 4
Menu Structure
Menu Structure
3.2
11
Control Menus
After switching on and passing the initial routine the autocorrelator starts
with the last set of measuring parameters and the main menu (fig. 4) with the
actual detector signal being displayed.
3.2.1
Main Menu
With the corresponding keys the correlator menu can be activated, the
measurement can be stopped and different filter values for the AC signal
channel can be selected. At the lower right corner of the display the actual
parameters are shown:
- Scan range,
- Data acquisition mode,
- Correlator sensitivity,
- Average number,
- Delay resolution,
- Crystal tuning angle.
If activated, the measured data ACF half width (FWHM) is displayed on top
of the display.
12
Menu Structure
Fig. 5 Main Menu
3.2.2
Correlator Submenus
3.2.2.1 Correlator Basic Menu
By pressing the corresponding key one out of 5 submenus can be selected:
- SAVE/CALL - Saving the current ACF or
displaying saved ACF,
while stopping the measurement,
- SCANNER OFFSET - Control of interferometer Zero
position (peak centering)
- SENSITIVITY - Control of signal sensitivity,
- ACQUISITION - Control of data acquisition,
- DISPLAY MENU - Control of data display.
Menu Structure
13
Fig. 6 Correlator Basic Menu
3.2.2.2 Correlator Save/Call Menu
The controller features two memory places for ACF traces. With the
Save/Call function the ACF Memory can be controlled. SAVE M1 / SAVE M2
saves the current ACF to memory M1/M2. CALL M1 / CALL M2displays the
saved ACF of M1 / M2, while measurement is stopped.
Fig 7 Correlator Save/Call Menu
14
Menu Structure
3.2.2.3 Correlator Sensitivity
With the SENSITIVITY-function the signal amplification can be varied in
addition to the GAIN-function. By pressing the + or - key the sensitivity is
increased or decreased, respectively, by a factor of 3 in the range of 1 to 30.
The OFFSET parameter controls an offset voltage to compensate dark current
and other background signal components. It is stored separately for each
sensitivity level. Please note that the offset parameter is changed only after
releasing the button. Block the beam to set this parameter and make sure that
the signal level is not below zero (check with scope at the analog y-output) or
set slightly above lower edge of display.
Fig. 8 Correlator Sensitivity
3.2.2.4 Data Acquisition Menu
With the ACQUIRE MENU one can control:
- Measuring modes (untriggered for high repetition rates, triggered for
repetition rates < 10 kHz, envelope function for fringe resolved ACF,
- Delay resolution (for a reduction of measuring time at low repetition rates)
in Trigger and Fringes mode only
- Signal averaging (for noise suppression).
- Signal display smoothing for smoothing structured functions
The measuring mode is selected with the FREE RUN >>> TRIGG key. In
the untriggered mode (FREE RUN) the ACF data are measured continuously
with the maximum acquisition rate and displayed and refreshed immediately.
Menu Structure
15
In the triggered mode (TRIGGER) the delay and signal values are measured,
digitized and saved only synchronously to an electrical trigger pulse from the
measured laser applied at the trigger input. These pairs of measured data are
superposed until a complete ACF is displayed. Caution, there is no ACF
measurement without trigger pulse! The FRINGES-mode is a special function
to display fringe resolved ACFs. While acquiring with maximum rate, this
mode detects the maximum and minimum AC signal value of each delay
channel to display the envelope of a sinusoidal modulated collinear ACF. For
tuning the phase matching in this mode, it is necessary to switch to zero scan.
Fig. 9 Data Acquisition
3.2.2.5 ACF Resolution
With the ACF RESOL-function the delay resolution can be reduced for a
faster, but more inaccurate measurement in the trigger mode. By pressing the
„+“ or „-“ keys the resolution can be increased or reduced by a factor of 2 in
the range of 256 to 32.
16
Menu Structure
Fig. 10 ACF Resolution
3.2.2.6 ACF Averaging
With the AVER-function the ACF can be averaged over n cycles. The
displayed number n is the inverse weight, the actual measured signal value
influences the displayed ACF with. The response time of the displayed ACF
to variations is decreasing correspondingly. The average number is increased
or decreased by a factor of 2 by pressing + or - key.
Fig. 11
ACF Averaging
Menu Structure
3.2.3
17
Other Submenus
3.2.3.1 Display Menu
The DISPLAY MENU is used for controlling the displayed functions and
parameters. With this the parameter calculation can be switched on or off and
a bargraph menu can be selected.
This menu lets you control the data transfer rate of the serial interface, and
control the display brightness as well.
Fig. 12 Display Menu
3.2.3.2 Bargraph Menu
In the BARGRAPH MENU an analog bargraph displaying the actual ACF half
width is switched on and off.
18
Menu Structure
Fig. 13 Bargraph Menu
3.2.3.3 Cursor Basic Menu
The CURSOR MENU, which is activated at any time by a separate CURSOR
key below the display, controls the different cursors. These cursors allow
manual measurements at the ACF alternatively to the automatic FWHMreadout.
CURSOR
MENU
ACF
EXIT
Fig. 14 Cursor Basic Menu
Menu Structure
19
3.2.3.4 Cursor Control Menu
After the activation of the cursors ACF ∆τ 3 horizontal and 2 vertical green
lines are displayed with one of them marked by higher intensity. This one is
the cursor which can be moved with the CURSOR < / >-keys below the
display. By pressing the corresponding keys HOR 1/2 and VERT 1/2, the
active cursor can be changed.
The third horizontal line in the middle shows the half amplitude between the
lower and the upper horizontal cursors. When they are set to the peak and the
background level of the ACF the crossings of the half amplitude cursor with
the corresponding function give its actual half width which can then be
measured with the vertical cursors. At the top of the display the actual
positions of the vertical cursors are displayed.
Fig. 15 Control of Cursors in ACF
4
Installation
If the system has been shipped during the cold winter months, please allow
time for the instrument to warm slowly to the temperature of the laboratory.
4.1
Detector and Crystal Installation
An optics set consists of a crystal and a detector. For shipment the crystal is
removed and needs to be installed in the optics unit. The detector unit will be
installed when you receive the Pulse Scout. A detector unit has already been
pre-installed. If there are several detectors the detector for the laser
wavelength should be installed.
Fig. 16 Crystal and Detector Access
21
22
Installation
4.1.1
Crystal Exchange
Before exchanging the crystal make sure that there is no laser light
passing through the optics unit.
1) In order to have the handhold of the crystal holder easily accessible tune
crystal angle to about 500.
2) Switch off control electronics, so that the scanner is motionless and the
detector is inactive.
3) Open crystal exchange lid. Fig. 17 shows the optics unit with the
crystal exchange lid removed and crystal installed. The crystal is fixed
to the crystal retainer by a magnet.
Fig. 17 Open crystal container with Fig. 17 Close up of crystal
installed crystal
4) Remove the crystal by slightly tilting the handhold of the crystal holder
(see arrow in Fig. 17) and pulling it out.
Fig. 17 Crystal Compartment with Crystal Installed
Fig. 18 Crystal Assembly
Installation
23
Fig. 19 Crystal Compartment with Crystal Removed
4.1.2
Detector Exchange
Before exchanging the detector unit make sure that there is no laser
light passing through the optics unit.
1) Switch off control electronics and disconnect the cable to the optics
unit.
2) Unfasten the two fixing screws, pull out detector unit and replace with
the detector required for your actual laser wavelength to be measured.
3) Fasten fixing screws.
4) Connect controller to optics unit and switch on. The installed type of
detector (PMT or PD) is recognized automatically.
Fig. 20 Detector Module Exchange
24
Installation
4.2
Interconnect Cables
Interconnect the optical unit and control electronics with the 25-pin cable
provided. Connect the electronics to the main power source, using the AC
adapter. If using the optional spectrometer, connect with the 15-pin cable
provided with the spectrometer.
4.3
Input Alignment
4.3.1
Baseplate Attachment
By adjusting the columns the beam height can be varuied. They can be
positioned either above or below the base plate of the autocorrelator. Caution:
The columns and the screws function as a unit: Never unscrew the columns
completely, as they are connected by a spring which will come loose if the
columns are not tightenend to the screw!
In order to change the position of the columns, the whole leg (columns and
screw) has to be untightened. This can be achieved by using the foot clamps
as a wrench.
Attach the baseplate to the optical assembly, level the unit, and lock down the
adjustment feet.
1. Screw the two front feet into the base plate as shown in Figure 16.
2. Place the optical unit onto the baseplate, aligning the hole underneath the
control window with the pin in the baseplate.
3. Using the M6 screw provided, attach the optical unit to the base plate.
4. Level the base plate to the appropriate height.
Installation
25
Fig. 16 Adjustment Feet
4.3.2
Input Laser Beam Alignment
Direct a portion of the laser beam towards the autocorrelator, using an
appropriate optical element (glass plate, mirror, etc.) mounted in a good
mirror mount. The beam should enter through the input aperture of the
autocorrelator nearly perpendicular to the unit. The input beam must have
horizontal polarization, in order to satisfy the phasematch condition of the
nonlinear crystal, and have low angular divergence.
Bring the back reflection of the beam to match the cross wires at the control
window by alignment of the optical unit. If there are two back reflections
(noncollinear interaction) they can be united by turning the screw (see fig. 1).
26
Installation
Twisting the optical assembly in the horizontal plane will move the back
reflection in the horizontal plane and tilting the optical assembly up or down
with the third leg will move the back reflection up or down.
Once the optical assembly is grossly aligned, it should be clamped to the
table. Final adjustments can be made by adjustment of the mirror mount that
holds the sampling element.
For measurement of the AC signal tilt back the variable aperture.
4.4
Collinear Autcorrelation
Although it is often preferred to operate the autocorrelator in the backgroundfree, or non-collinear mode, it is sometimes easier to find an autocorrelation
signal in the collinear mode. If one has trouble finding the autocorrelation
trace, then turn the screw (see fig. 1) all the way in for collinear operation. In
collinear mode, you are guaranteed to see a signal from the autocorrelator if
the crystal is aligned at the proper angle, even if the two replica beams do not
overlap temporally or spatially. Hence, due to the fewer variables involved, it
is best to use this collinear configuration to begin with the optimization of the
autocorrelation trace.
4.5
Finding the Autocorrelation Trace
- Switch the autocorrelator ON.
- After an initialization period, the unit is ready for measurement.
- At first you will see a flat horizontal line over the whole screen. Slowly
increase the „GAIN“ until either a clear signal or noise is observed. If the
autocorrelator is responding to room lights, dim the lights or block off the
source of external light to the autocorrelator.
- Rotate the crystal by using the “Turning” knobs to find the optimal angle.
An optimally aligned crystal is characterized by a clear, angle dependent
signal maximum. The actual angle value for the crystal is shown in the lower
right corner of the display. If a limit is reached such that the numbered
displayed is no longer changing, reverse the drive direction.
Attention: Many laser sources have a small portion of second harmonic light
coincident with the fundamental laser pulse, and this small amount of light
may swamp the second harmonic signal that is generated by the thin crystal
inside the autocorrelator. To avoid this insert a long pass filter into the laser
beam such that the fundamental wavelength is transmitted and wavelengths in
the vicinity of the second harmonic are blocked.
Installation
27
- As a check for the real autocorrelation signal, block one of the beams of the
Michelson-Interferometer inside the autocorrelator. This can be done by
pushing the knobs on top of the autocorrelator. Blocking either beam
individually will eliminate the signal originating from the interaction of the
two beams. In addition, it will reduce the background away from the peak by
50%.
- Optimize the peak and the peak-to-background ratio of the autocorrelation
signal through adjustment of the crystal tilt, focus, scan range and filter.
- If there is no angle dependent signal or no peak, check that there is no stray
light from the laser beam by inserting a long pass filter into the beam.
Additionally, go back and recheck the alignment so that there is a back
reflection at the cross wires, that the input polarization is horizontal, and that
the laser is mode-locked (see chapter 7.1 “Troubleshooting”)
- If the autocorrelation signal goes off scale, decrease the „GAIN“ and/or
decrease the laser input power (ND-filters, lower reflectivity of the coupling
element etc.).
4.6
Non-Collinear Autocorrelation
Set the instrument to the collinear autocorrelation mode. Gradually, move
from the collinear configuration to the non-collinear configuration. By turning
the “Beam Distance” screw(see fig. 1) a configuration between collinear and
non-collinear can be chosen. The beam separation distance can be monitored
directly at the control window. In the non-collinear case the second (movable)
back reflection will be to the left side of the cross hairs. While changing the
beam distance, make sure to optimize the focus adjustment, the sensitivity and
the phase matching angle.
5
Operation
5.1
Basic Operation
1. Switch on the autocorrelator and wait for the instrument to finish its
initialization regimen.
2. Check the alignment.
3. Read the autocorrelation trace.
4. Remember, if the wavelength is changed, the phase matching angle will
need to be changed. In addition, the GAIN and focusing adjustment may
require reoptimization.
5.2
Scan Range Variation
Each scan range is measured by a delay sensor, stabilized and calibrated. The
delay output is normalized to appr. 0 ... 10V amplitude. After switching to
another scan range it takes some time (5 ... 30 s) to reach the new range.
5.3
ZERO - Scan
The ZERO SCAN-function stops the delay at the zero position. At the display
the signal values at different times are shown similar to an oscillograph. It is
thereby possible to observe amplitude modulations and to align the
autocorrelator to the maximum of the ACF.
29
30
Operation
5.4
Low Pass Filter
This switchable filter suppresses high frequency noise of the detector or the
interference fringes in the collinear case. For the measurement in triggered
mode and of a fringe resolved ACF it is automatically switched off.
5.5
Interference Modulation
If exactly aligned in the collinear case, the AF is superimposed by the
interference fringes of the interferometer (sinusoidal modulation - fringe
resolved ACF). They can either be averaged with the low pass filter (simple
intensity ACF) or displayed with the FRINGES-mode, displaying the
envelope of this function. This mode helps to check if the pulse is chirped.
In the triggered mode where this filter is not active and in the ZERO SCAN
the fringes simulate strong amplitude modulations, which make it difficult to
align the optimal phase matching. Therefore it is recommended to increase the
beam distance slightly to measure a collinear ACF without interferences.
5.6
Calculation of the ACF Half Width
For the calculation of the ACF half width the background value is taken at the
edge of the display. The difference of this value and the maximum is taken
and halved. After that, the crossings of this amplitude value and the ACF right
and left from the maximum are locked for. Their distance is the measured half
width which is displayed at the top of the display. That´s why the ACF peak
has to be zero at the edge of the display for measuring a correct value with
this algorithm (if necessary change the scan range).
After getting the ACF displayed one can measure the half width of the
autocorrelation function. It is defined as FWHM (Full Width at Half
Maximum) which means the width at the half intensity level between the
maximum of AC peak and the baseline outside the peak (fig. ?). Most
comfortable is the application of cursors, otherwise the oscilloscope grating
can be used. Measure ACF width b and complete scan width B (maximum
scan). Due to the automatic scan control the complete width B is defined by
the actually selected scan range. Therefore the autocorrelation half width
FWHM is calculated as:
FWHM = b/B x Scanbereich.
Operation
31
To get the real pulse duration one has to correct the AC-width with a form
factor depending on pulse shape:
τ = FWHM x F
Fig 16 Calculation of ACF Half Width
6
Troubleshooting
6.1
Rotation of Plane of Polarization
Usage of a Polarization Rotator (λ/2-plate)
The effect of polarization rotation can be very wavelength sensitive
depending on its type.
Rotation by a Double 90°-Beam Steering
Two mirrors mounted 45° to the input beam and steering it in different planes
cause an effective wavelength-insensitive 90° rotation of the plane of
polarization. Such a polarization rotator is included.
33
34
Troubleshooting
Fig. 17 Polarization rotator
6.2
Fundamental Overload
At very extreme wavelengths and input power levels the ACF can be
superposed by a larger background from the fundamental wave in the
collinear case. This can be avoided by using the non-collinear interaction or
the use of special filters and detectors.
6.3
Common Errors
6.3.1
No SHG Signal
Potential Causes:
1. Wrong polarization direction
2. Wrong alignment
3. No or too long input pulse
Check:
1a. Check with polarization rotator. (see 7.2.)
1b. Introduce a polarization rotator in the input beam.
2. Check beam position at input aperture.
3. Check back reflection at control window.
4. Check FOCUS-position.
5. Check phase matching.
6. Check with an independent method. (fast photodiode, spectral width
etc.)
Troubleshooting
6.3.2
35
Input Power Too Small
Potential Causes:
1. Delay-zero-position outside of scan range
2. Compare with sensitivity (see Specifications).
Check:
1. Check at wider scan ranges, check the DELAY-position (see
Specifications, offset setting)
6.3.3
No Clear ACF
Potential Causes:
Wrong scan range
No or too long input pulses
Check:
Check at wider scan ranges
Check with an independent method. (fast photodiode, spectral witdth…)
7
Safety
For the application of lasers you have to pay attention to safety rules
according to the used laser class! Incorrect handling and operation of lasers
can be hazardous to your health!
Prevent the Autocorrelator from humidity, because the SHG crystals are
slightly hygroscopic and they are not mounted in housing because of
dispersion.
37
8
Factory Service Information
8.1
Service Form
Newport Corporation
U.S.A. Office: 800-222-6440
FAX: 949/253-1479
Name_________________________________
Return Authorization # _________________________
(Please obtain RA# prior to return of item)
Company ___________________________________________________________________________
Address ______________________________
Date _______________________________________
Country _______________________________
Phone Number _______________________________
P.O. Number ___________________________
FAX Number_________________________________
Item(s) Being Returned:
Model # ______________________________
Serial # _____________________________________
Description __________________________________________________________________________
___________________________________________________________________________________
___________________________________________________________________________________
___________________________________________________________________________________
___________________________________________________________________________________
___________________________________________________________________________________
Reason for return of goods (please list any specific problems):
___________________________________________________________________________________
___________________________________________________________________________________
___________________________________________________________________________________
___________________________________________________________________________________
___________________________________________________________________________________
___________________________________________________________________________________
___________________________________________________________________________________
___________________________________________________________________________________
___________________________________________________________________________________
39
40
Factory Service Information
Notes:______________________________________________________________________________
___________________________________________________________________________________
___________________________________________________________________________________
___________________________________________________________________________________
___________________________________________________________________________________
___________________________________________________________________________________
___________________________________________________________________________________
___________________________________________________________________________________
___________________________________________________________________________________
___________________________________________________________________________________
___________________________________________________________________________________
___________________________________________________________________________________
___________________________________________________________________________________
___________________________________________________________________________________
___________________________________________________________________________________
___________________________________________________________________________________
___________________________________________________________________________________
___________________________________________________________________________________
___________________________________________________________________________________
___________________________________________________________________________________
___________________________________________________________________________________
___________________________________________________________________________________
___________________________________________________________________________________
___________________________________________________________________________________
___________________________________________________________________________________
___________________________________________________________________________________
___________________________________________________________________________________
___________________________________________________________________________________
___________________________________________________________________________________
___________________________________________________________________________________
___________________________________________________________________________________
___________________________________________________________________________________
___________________________________________________________________________________
___________________________________________________________________________________
___________________________________________________________________________________
___________________________________________________________________________________
___________________________________________________________________________________