1
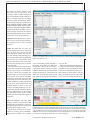
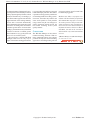
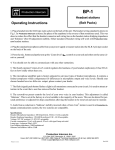
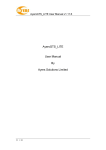
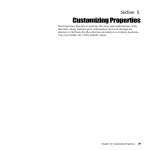
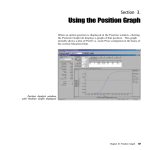
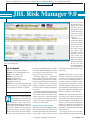
Stocks & Commodities V. 33:07 (42–45): Product Review: JBL Risk Manager 9.0 by Barbara Star, PhD
product review
JBL Risk Manager 9.0
that will identify
the country and exchange being used
and keep track of
information about
open and closed positions after trades
have been placed
(Figure 1).
But first, the user
needs to activate the
four tabs or buttons
at the bottom of the
screen that takes
the trader through
the simple steps
necessary to set the
conditions for the
trade. Each step
must be completed
before the program
Figure 1: JBL Trading Summary Screen. The trading summary page tracks the open and closed trade information, win/loss percentage,
drawdown, average dollar trade expectancy, and trading system efficiency for each portfolio. It also contains the tabs at the bottom of the screen allows you to enable
the next tab. The
that set up the trading portfolios.
program highlights
in yellow those arJBL Risk Manager
developer Joseph Barrington-Lew (JBL) eas that must be completed by the user
Malvern, Victoria 3144 Australia
created the JBL Risk Manager software in that step.
Website: www. jblriskmanager.com
to incorporate all of those factors, and
Phone: +61 3 9013 4123
more, in an easy-to-use format.
Portfolio: The first tab, create new/load
Mobile: +61 4 0938 7317
JBL Risk Manager is a standalone portfolio, is the place to create and name
Skype: barrington-lew
money manager and trade risk manage- a portfolio. The software permits the
Product: Money, risk, & trade
ment software program for stock traders user to create an unlimited number of
management software
that operates independent of any charting portfolios, which is useful for separatPrice: Free 14-day fully functional trial service, trading system, or brokerage ing different stock categories or stocks
period; one-time cost AUD$299 with platform. Currently, it provides access chosen by different trading systems or for
free upgrades for the first 12 months.
to 15 major stock exchanges throughout users with more than one trading account.
the world.
There is no limit to the number of stocks
The software requires local end-of-day that may be added to each portfolio.
by Barbara Star, PhD
price data downloaded in the MetaStock
data format, which is offered by many Settings: The next tab takes the user to
he best way to avoid blowing out vendors. However, if that data format the settings screen, where decisions are
your trading account is to develop is not available, the software furnishes made about trade length, trailing stops,
a consistent method of maintain- a link to the prices needed for the stock money management, and brokerage fees
ing control over your trading losses. symbol you wish to trade.
(Figure 2). The software automatically
Many traders think that using stop-losses
defaults to settings that probably suit
alone will do the trick, but that’s only one Simple four-step setup
most traders. However, each of the setpart of the equation. Successful equity The trader launches the JBL Risk Man- tings may be changed to meet individual
protection involves account manage- ager after deciding which stock to trade user preferences.
ment, position sizing, and sector balance but before placing the trade. The software
The settings screen also stores inforas well as good exit strategies. Program opens with a trading summary screen mation about the price data path location
T
Copyright © Technical Analysis Inc.
www.Traders.com
Stocks & Commodities V. 33:07 (42–45): Product Review: JBL Risk Manager 9.0 by Barbara Star, PhD
and choice of stock exchange. Users
may select from a large list of stock
exchanges. These include exchanges in
the US (NASDAQ, NYSE, AMEX) as
well as countries and cities including
Australia (ASX), New Zealand (NZX),
London (LSE), Singapore (SGX), Hong
Kong (HKEX), Bombay (BSE), India
(NSE), Shanghai (SSE), Toronto (TSX),
Sao Paulo (SAO), Berliner Borse (BSE),
and Deutsche Borse (XETRA). Once a
stock exchange is selected, the software
automatically inputs the correct currency
used for the stocks in that exchange.
Capital: In the third tab, manage capital,
the user types in the amount of money
in a trading account to allocate to this
portfolio.
Trade: The fourth tab, new trade, lets
the user identify the trade as either long
(buy) or short (sell), and lets the user
select the stock symbol, the expected
buy date, and the anticipated buy price.
It is recommended, but not required, that
the user also type in the market sector
for that stock and jot down in the diary
the reason for wanting to buy or sell that
particular stock.
From here, the software uses the information derived from the settings and the
manage capital pages to automatically
fill in the salient facts regarding the
potential trade, as seen in Figure 3 with
the long trade in Google Inc. (GOOG).
Among the automated items provided
on the trade screen is the amount of core
capital available for trading, the amount
of cash to use for the trade, the recommended number of shares to buy, the
total cost including brokerage fees, the
suggested initial stop, and the breakeven
price. For added measure, it also supplies
the daily floor traders’ pivots to help
identify potential near-term support or
resistance.
Survival features: The JBL Risk
Manager contains several features that
enable traders to maintain a consistent,
disciplined approach to preserving and
growing their trading account.
The software incorporates a concept
called core trading capital, which Barrington-Lew considers a more realistic
Figure 2: Settings Screen. Traders are able to select stocks from 15 major exchanges, insert brokerage fees, and
indicate preferred trading duration. The software automatically determines the appropriate type of trailing exit placement
and percent of trade size to risk.
view of the trading capital available to
the trader. According to the PDF user
manual that comes with the software,
core trading capital is based on a combination of available cash, plus any realized
trading capital, that is, your initial trade
value plus or minus the profit or loss
that would occur if each open position
stop were hit.
That concept underlies the calculations
for stop-loss and money management
guidelines. The first guideline is related
to initial risk management and is probably familiar to most traders. It states
that you should never risk more than
2% of your core trading capital on any
Figure 3: The Trade Screen with Google inc. (goog). Once the trader inserts the symbol and selects the
anticipated trade date, the software recommends the number of shares to purchase, initial stop, and displays the maximum
risk based on the last close. After confirming the quantity, it displays the breakeven price and which trailing stop is being
used, and whether to hold or exit the trade. The user may follow or change any of the recommendations. This trade in
GOOG was entered at the open on January 20, 2015 and closed by the trader at the open on January 28, 2015, the day
following the exit recommendation signaled at the close of the prior trading day.
Copyright © Technical Analysis Inc.
www.Traders.com
Stocks & Commodities V. 33:07 (42–45): Product Review: JBL Risk Manager 9.0 by Barbara Star, PhD
one trade. The second pertains to the
amount of trading capital available for
any one position. The guideline states
that you should never trade more than
20% of your core trading capital on any
one trade. In fact, to be on the safe side,
the JBL Risk Manager defaults to a 19%
trade size so that funds are available for
slippage or other expenses.
Both guidelines constitute the basic
rules for accounts $50,000 or less and
are automatically integrated into the
software calculations for each trade
entered. The percentages for risk and
position size decrease for trading accounts greater than $50,000.
The factors of risk and trade size, along
with the entry price and initial stop-loss,
determine the number of shares the program recommends per trade. Changes
the user makes to the entry or stop-loss
price may create a change in the number
of shares the program recommends in
order to maintain the proper risk and
trade size balance.
Stop-loss and profit-taking: The
program offers several built-in and
user-defined options for determining
stop-loss placement including initial
stops, trailing stops, profit-target stops,
and time-based stops.
The software recommends an initial
stop-loss placement based on an algorithm that prevents losing more than the
pre-allocated amount of trading capital.
However, the user may enter his or her
preferred initial stop.
Taking into consideration brokerage
fees, the software also determines the
breakeven price. Once the breakeven
price has been hit, the software converts
from the initial stop to a trailing stop that
uses either a modified average true range
(ATR) calculation or a fixed percentage, whichever the program determines
will provide the best profit safety. The
system highlights in red which trailing
stop is in control.
One of the more unique features of
the program is the way the software automatically changes the ATR and fixedpercentage stops depending on the user’s
trading length preferences—short-,
medium-, or longer-term. Some traders
prefer to be in a trade for only a few
days, others for weeks, and still others
for months. The program allows the user
to select independent time lengths for
each individual portfolio. For example,
in some cases, a person who usually is
a trend follower using the medium-term
length may decide to take a countertrend
trade expected to last only a few days.
For that trade, the user would select the
short length and the trailing stops would
adjust accordingly.
The trailing stops also change depending on the price of the stock. As can be
seen in the settings screen in Figure 2,
the ATR and fixed percent decrease for
higher-priced stocks. At any time during
the trade, the user may elect to override
the current trailing stop with one of his
or her stops. If a stock does not reach
breakeven within 10 days, the software
automatically suggests the user exit the
trade so the trading capital can be put
to better use.
At the end of each trading day, the user
updates new price information, either
from the data path or the Internet, for
the stocks being traded. If no stop has
been hit, the program produces a large
green sign that says “hold.” But once
price has triggered one of the stop-loss
levels, the software produces a large red
exit sign as seen with GOOG in Figure
3. It is then up to the user to determine
whether to exit the trade at some point
on the following day or whether to stay
in the trade. In the GOOG trade, the
recommendation to exit was given after
the close of trading on January 27, 2015.
JBL Risk Manager offers users an easy way
to improve their future trading performance
by giving them the ability to create and
backtest multiple portfolios.
Copyright © Technical Analysis Inc.
The actual exit occurred the following
day at the open. The user must manually
enter the actual exit price when the trade
has been closed.
Improve trading
performance
Not only did the creator of the JBL Risk
Manager wish to assist traders to be more
disciplined in the way they managed
money in their trading, he also wanted
to incorporate other aspects that have
a bearing on trading performance. For
instance, by inputting the sector category
when a trade is entered, users may avoid
overweighting certain market sectors in
their portfolio, such as technology or
energy stocks. This is reflected in one
of the categories along the top line of
the open trade information on the trading summary screen. Also, filling in the
diary section on the trade page with the
reasons for buying or selling a stock may
help traders identify those strategies and
entry methods that seem to produce the
best results.
The settings page contains a button
labeled RTC, which stands for risk
tolerance calculator. Here, traders may
obtain not only a realistic idea of how
much account loss they would suffer in
consecutive trading losses but also what
it would take to compound the growth
of their portfolio.
Information on the trading summary
screen goes beyond the usual profit and
loss numbers. It also permits comparing
the user’s portfolio to a market index such
as the Nasdaq or S&P 500 in order
to check whether his or her trades are
under- or outperforming the market.
Two other features are also based on
closed trades. One is known as trade
expectancy, which is the average dollar
amount a trader can expect to make or
lose per trade based on past closed trading results. Every trader knows that it is
the trade exit that determines whether
the trade has made or lost money. The
software displays that average amount
for the stocks in each portfolio.
The other feature included in the
program was developed by Van Tharp,
who is well-known in trading circles
for helping traders overcome problems
in the areas of trading psychology and
www.Traders.com
Stocks & Commodities V. 33:07 (42–45): Product Review: JBL Risk Manager 9.0 by Barbara Star, PhD
system performance. Barrington-Lew received permission from Tharp to include
Tharp’s System Quality Number, which
measures the efficiency of a trading system. That number appears near the lower
right-hand side of the trading summary
screen and is activated automatically
after a minimum of two trades have been
closed out. According to the user manual,
a number greater than 1.65 shows that a
trading system makes money better than
a chance occurrence. A number greater
than 2 indicates a very good system and
above 2.5 an excellent system.
The good news is that the JBL Risk
Manager offers users an easy way to
improve their future trading performance
by giving traders the ability to create and
backtest multiple portfolios. That makes
it possible to set up a practice portfolio for
each trading method or trading system.
In essence, the trader may backtest the
same stock symbols in each portfolio
using various entry & exit strategies to
quickly determine which provide the
best results according to the system
quality number.
Conclusion
The JBL Risk Manager is more than a
number-crunching machine. With its
many automated features, the software
promotes an objective decision-making
approach to controlling trading risk and
Copyright © Technical Analysis Inc.
preserving trading capital, which leads
to added staying power.
Barbara Star, PhD, is a frequent contributor to Technical Analysis of Stocks
& Commodities magazine. Currently,
she trades part-time and provides individual instruction and consultation to
those interested in technical analysis of
the financial markets. She lives in Woodland Hills, CA and can be reached at
818 224-4070 or by email at star4070@
aol.com.
‡JBL Risk Manager 9.0 (JBL Risk Manager)
‡See Editorial Resource Index
www.Traders.com