1
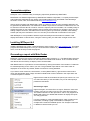
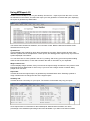
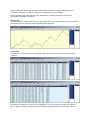
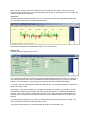
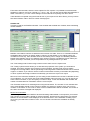
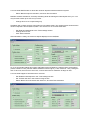
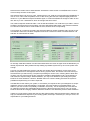
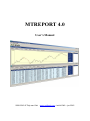
MTREPORT 4.0
User’s Manual
2006-2015 © Thijs van Vliet - www.mt4tools.com - build 1042 – jun 2015
General description
MTReport 4.0 is a software utility for analysing report files generated by MetaTrader.
MetaTrader is a Windows application by MetaQuotes Software Corporation, a company that develops
and implements professional, high quality online trading platforms for automated online brokerage
services in Forex, CFD, and Futures markets (www.metaquotes.net).
After a period of trading with MetaTrader, either on a demo or a live account, a trading statement can
be generated by MetaTrader. The statement is called a report and it is saved in HTML format, so it can
be viewed in browsers like IE or FireFox. Since the report is just a list of trades, it is not always easy to
assess the merits of your trading strategy just by looking at the trade list. For instance, when you are
trading multiple currencies, the trades on one currency pair may have been profitable, while trading
another pair may have resulted in a loss. It is not easy to find this kind of information in the report.
With MTReport 4.0 it is possible to load the report and analyse the information it contains. It will
display information in various forms, using the currency pairs you select with a single mouse click.
Installing MTReport 4.0
Installing MTReport 4.0 is easy. Just download the setup program from www.mt4tools.com. This setup
program will install MTReport 4.0 for you. Shortcuts will be created on your desktop and in your start
menu, so it will be easy to start the program.
Generating a report with MetaTrader
MTReport 4.0 works with reports generated by MetaTrader versions 3 or 4. The MetaTrader client has
a section called Terminal, which is on the bottom of the MetaTrader window. In the Terminal window,
click the tab Account History to display a list of closed trades.
With MetaTrader 4 it is possible to sort the trade list by clicking the header of the trade list. Trades will
be sorted depending on the column you click. The generated report will be in the same order as
displayed on the screen. By default, trades are sorted on closing date/time.
If you want to view comments, commissions, or taxes (MetaTrader 4), right-click the trade list and
check the appropriate option. Magic numbers in MetaTrader 4 will be entered in the report when the
Comments option is checked.
Right-click the trade list, and select the period you want to use. You
can select All History to see all trades, but you can also specify a
period like Last Month.
Generating a report
Right-click again, and select Save as report. Select the name and
location of the file you want to use for your report and click Save.
The default extension for the report file is .htm. It may happen that
MetaTrader opens your default web browser to display the report.
You may ignore this.
It is also possible to create a detailed report, which contains more
information, including a graph of the balance. MTReport 4.0
accepts both normal and detailed reports. For analysis it will make
no difference which format you use.
Using MTReport 4.0
Double-click the MTReport icon on your desktop. Choose File -> Open report from the menu, or click
the left button in the toolbar, and select the report you have generated. A window will open, displaying
the report as generated by MetaTrader.
The window also contains two listboxes, and a number of tabs. Both the listboxes and tabs will be
discussed here one by one.
Symbols list
This list displays the symbols for which there are trades in the report. Some reports will have many
different symbols, like the sample above. Other reports, like StrategyTester reports may only have one
symbol displayed in the listbox.
You can select one or more symbols in the list. Try clicking, and moving your mouse pointer holding
down the left mouse button, or click and hold down the shift or ctrl button on your keyboard.
Magic numbers list
This list displays magic numbers, if they are used in the reports. Magic numbers are only used in some
Expert Advisors for MetaTrader 4. Don’t worry if you never see a magic number in this list. Many
people never use them,
Report tab
This tab will show the original report, as generated by the MetaTrader client. Selecting symbols or
magic numbers will not change the view of the original report.
Summary tab
This tab will show a summary for your report. The amount of information may vary per report.
Some reports have no information for the initial deposit. Without that information, the return
percentage or the drawdown percentage cannot be calculated. If you want to see these numbers
anyway, select the Options tab, check the Initial deposit checkbox, and fill in a deposit amount.
Activate the summary tab again to view the return and drawdown percentages.
Other information, like extra deposits, fees, withdrawals, or rebates will only be shown if this
information is available in the report.
Balance tab
This tab will show a graph of the balance of your trades. Part of the graph may be red, which denotes
the trades where the maximum relative drawdown has happened.
Trades tabs
There are two Trades tabs, to show information about trades for the selected symbols and magic
numbers.
By default, the trades list is sorted on close date/time. You can sort the list on ticket, lots, duration,
pips, or open or closing date/time by double clicking the appropriate cells on the header of the list.
Both 1-pip and 1/10-pip reports are allowed. Pip-counts will have the same accuracy as the pipvsalues in the original report. You can delete trades from the list by selecting one or more trades, and
pressing Delete on your keyboard.
Times tab
This tab shows the profits and losses per hour of the week. By clicking the appropriate radiobutton,
you can select to use open or closing dates and times.
Note that the used time in the MetaTrader report is your brokers time.
Options tab
This tab is used for setting some options.
The Trade settings section is used for changing the initial deposit used for the trades. For instance, if
you would like to know the return of the trades with another initial deposit, just check the checkbox,
and fill in your new deposit. The summary and the trades list will be updated immediately.
To save the value for initial deposit, double-click the edit box. The next time MTReport is started, the
saved value will be used.
The Position sizing section allows you to change the number of lots used for your trades. You can
select a fixed number of lots per trade, with either a mini ($10000/lot) or a standard ($100000/lot)
account. You can also select a compounding number of lots, using the fixed amount settings. For
example, if the Fixed amount mini is $1000, then one mini lot will be traded for every $1000 of the
balance.
The Settings section allows you to select the minimum and maximum amount of lots to trade. The
minimum amount is also the lot step that will be used.
The Display section allows you to display either all trades or closed trades only.
From build 1039 onwards, there are some options for CSV exports. It is possible to set the decimal
separator to either a comma or a period (i.e. 1,23 or 1.23). You can also set the CSV field separator to
either a semicolon (;) or a tab. These settings can be useful when importing CSV file to Excel.
Trade duration is exported using the format hh:mm. If you import a CSV file to Excel, you may want to
format the Duration cells in Excel to custom format [u]:mm.
RiskSim tab
This tab is used for the RiskSim simulator. This simulator will simulate lots of trades, while calculating
certain statistics.
RiskSim uses random numbers to determine the outcome of a trade. There is no correlation between
simulated trades. However in real-life trading, chances are that trades in your trading system are
correlated in some way. Also, RiskSim does not use floating loss or margin for calculating statistics.
Results from RiskSim may be very different from results in real life. Use RiskSim to learn about your
system, but keep in mind that you are responsible for any trading decisions you take.
The Trade settings and Position sizing sections are the same as in the Options tab.
The Trading system section allows you to describe the properties of the system you would like to
simulate. Only three numbers are necessary for the simulation: average profit of wining trades,
average loss of losing trades, and the percentage of winning trades. Profits and losses can be entered
in pips or in dollars. If you want to use the numbers of the trades currently in the trades list (depending
on which symbols and magic numbers are selected), just click Auto import from report.
Max dd % is the maximum drawdown you are willing to take. RiskSim will use this to calculate the risk
of ruin statistics. You can specify how many trades RiskSim will use for each run. You can specify an
exact number of trades, or you can specify a number of days. In this case RiskSim will calculate the
number of trades based on information from the current report.
The Simulation section is for selecting and running the simulation. The number of runs indicates how
many times RiskSim should run the number of trades you entered. If trades is set to 100, one run
consists of 100 trades. If runs is set to 1000, a total of 100000 trades will be simulated. The results of
the 1000 runs will be averaged and displayed.
Monte Carlo simulation
After clicking Start simulation RiskSim will start simulating trades based on the specifics you entered.
The outcome of every trade is based on random numbers, and the winning percentage you entered.
Statistics of the simulation will be displayed in the Results section. If the simulation is taking up too
much time, just reduce the number of runs. You can do this even when the simulation is already
running.
Minimum deposit simulation
Use this if you need to know what the minimum deposit should be to safely trade a specific trading
system. RiskSim will run simulations, while decreasing your initial deposit. It will do so until the Risk of
ruin number (explained in the Results section) is about zero. This simulation gives most usable results
for position sizing with a fixed number of lots. This simulation will not work if the average profit per
trade is zero or less.
Minimum # of trades simulation
Use this if you need an indication of how many trades you need to complete before the return will be
larger than the drawdown you experienced. RiskSim will run simulations, while increasing the number
of trades for each run. It will do so until the return is larger the maximum drawdown. This simulation
will not work if the average profit per trade is zero or less.
The Results section shows the results of the simulation.
Perfect
Only visible for Monte Carlo simulations. The percentage of runs of which the balance
never goes below the initial deposit. This gives an indication of your chance of having
drawdown before you start winning.
Min deposit
Only visible for Minimum deposit simulations. The minimum deposit needed for trading
a specific trading system, while having a risk of ruin of around zero.
Min trades
Only visible for Minimum trades simulations. The minimum number of trades needed
before you can expect to have a return larger than your drawdown.
Error rate
This is an indication of the validity of the results. The error rate is solely dependent on
the number of trades. The more trades you use, the lower the error rate is, and the
more reliable the results are.
Risk of ruin
This number shows the percentage of runs that had a drawdown larger than the
maximum drawdown you entered in the Trading system section. You want this number
to be as low as possible.
Drawdown
This is the average drawdown experienced during all simulation runs.
Deviation
This gives an indication of how far the minimum and maximum balance results for all
trades of the simulation are apart.
Profit/trade
The average profit per trade. This is calculated (not simulated).
Profit/trade = (average profit * wins% - average loss * (100 - wins%) ) / 100
Balance
The average ending balance of all simulation runs.
Return
The average return percentage of all simulation runs.
RiskSim simulator example
Let’s go over an example to show what RiskSim is all about. Let’s assume you have $5000 to trade,
and are willing to withstand a maximum drawdown of 30%. Your trading system has the following
statistics:
Average win
Average loss
Percentage wins
Trades per year
3 pips
4 pips
60%
1000
Would you trade this system? What would your lot size be? How much would you make per year?
Let’s see what RiskSim tells us.
-
Start MTReport 4.0 and click the RS button on the toolbar
Set $5000 as initial deposit in the Trade settings section
Set 1 fixed # of mini lots in the Position sizing section
Enter the numbers 3, 4, 60, 30 and 1000 in the Trading system section
Select Monte Carlo simulation and 1000 runs, and click Start simulation
Within seconds RiskSim tells you the return for 1000 trades is about 4%. The ending balance is
$5197, so you would gain between about $200 after a year of trading. Not very exciting.
The perfect trade number tells us that in about 9% of the simulation runs, the balance was always
$5000 or higher. The risk of ruin of 0% tells us that the drawdown was never as bad as the 30% that
we entered. The average drawdown was only about 1.5%. That’s not bad.
Note that random numbers are used to determine the outcome of trades, so every time you run the
simulation you may have different results. In this case the deviation of about 0.6% tells us that we
don’t need to worry too much for now. Hover your mouse pointer above the balance box to see the
minimum and maximum ending balance of all runs. If the trades from your system are not correlated,
you may expect a balance between $5150 and $5250 after 1000 trades. You can also hover the
mouse pointer above the return, drawdown, and risk of ruin boxes to see the minimum and maximum
values.
Let’s see what RiskSim tells us about the minimum deposit needed to trade this system
-
Select Minimum deposit simulation, and click Start simulation
RiskSim will start simulations, and keep simulating while decreasing the initial deposit every run. You
may find this to take up too much of your time…
-
Change Runs to 10 to speed things up
Simulation will go faster, but less runs means a less reliable result. The results section shows that the
minimum deposit is around $400 or $500. Let’s see if this is an accurate estimation.
-
Set $500 as initial deposit in the Trade settings section
Change Runs to 100
Click Start simulation
After simulation is ready, the minimum deposit displayed is around $500.
So, if we would start trading this system with $500 instead of $5000, the relative return will be higher
(39.9% instead of 4.0%) and the relative drawdown will be higher (11.6% instead of 1.5%). During the
test of 100 runs, the risk of ruin was 0.0%, so there was never a drawdown as large as 30%.
Let’s see what happens if we trade some more lots.
-
Set $5000 as initial deposit in the Trade settings section
Set 10 fixed mini lots in the Position sizing section
Select Monte Carlo simulation and 1000 runs, and click Start simulation
Notice that the relative return and drawdown are about the same as the run with $500 and 1 mini lot.
This is exactly what we would expect.
Also notice that the risk of ruin is 0.9%, meaning that in 9 of 1000 runs we experienced a drawdown of
30% or more. This is still acceptable, since we are running this test with a deposit slightly below the
minimum. Try the Minimum deposit simulation again, to confirm that $5000 is enough to trade 10 mini
lots. Also try to use 1 standard lot, which should give the same result.
The minimum deposit needed to trade 1 mini lot was about $500. You could also try to trade 1 mini lot
per $500. Set Fixed mini amount to $500, check the appropriate radio button, and start the simulation.
You will notice that the return will be a little bit more, because of the compounding.
Let’s go back to 10 mini lots per trade, and select the Minimum trades simulation with runs set to 100.
This will take some time, but after completion it will show a minimum number of trades between 100
and 200. So what does that mean?
On average it will take between 100 and 200 trades before the return is higher than the drawdown you
already experienced. Many traders will stop trading a profitable system if they do not see profits soon
enough.
Let’s say you start trading this system, and after two weeks (about 40 trades) you are down some
$200. Hey! What’s this? I thought this was a winning system? Sure, but there’s a fat chance that you
will lose before you start winning. The perfect percentage is around 15%, meaning that in about 85%
of cases you will, at some point in time, experience a balance below $5000. And a 4% drawdown is
well within the expected range. Without RiskSim, you may have decided to quit trading the system
because of some drawdown. However, RiskSim tells us to continue trading, because the system is
profitable and performing as could be expected.
Use RiskSim to learn about your system, to reconsider your objectives and your willingness to accept
drawdown. Keep in mind that RiskSim is a simulator, and uses random uncorrelated trades. The
trades in your live account are probably correlated in some way. This is especially the case with the
so-called grid systems and martingale-based systems. Winners and losers tend to come in groups,
because of trends and ranging markets. RiskSim’s trades are not affected by these market conditions.
Trading is not only about entries and exits, but also about position sizing and expectancy. RiskSim will
help you evaluate these aspects of your trading system, but keep in mind that you, and you alone, are
responsible for your trading decisions.
Adding reports
Many FX brokers offer demo accounts that only last a couple of weeks. You definitely want to demo
trade your system longer than that, before going live. RiskSim offers the possibility of adding reports
together. By adding several consecutive demo reports, you can create a single report for a much
longer demo period.
MetaTrader’s StrategyTester will simulate trading systems for a single currency pair. You could create
several test reports for different currencies, and add these reports to create a single multi-currency test
report.
Adding reports is simple. Choose File -> Open report from the menu to load any report. Then choose
File -> Add report and select another report. The second report will be added to the first. Trades in the
report are sorted by closing date/time.
Keep in mind that large reports will take a long time to load. StrategyTester reports need even more
time to load because StrategyTester trades are described in several lines. Also, a StrategyTester
could easily have thousands of trades in it, which will slow down the loading of the report.
Exporting a report
If you have changed a report in any way, you may want to save the changed report. Also, you may
want to do some extra analysis of your trading in another program, for instance Microsoft Excel.
Choose File -> Export report from the menu to save your report as a htm file. You can open this new
report with you browser or with MTReport 4.0. The exported report will look similar to the reports
generated by MetaTrader.
Choose File -> Export report with graph to save the report with a graph of the balance. A htm file and a
jpg will be created. The exported report will look similar to the detailed reports as generated by
MetaTrader.
Choose File -> Export as csv (Excel) to save your trades in a CSV file, which can be imported in
programs like Excel. Fields in the file can be separated either by semicolons or by tabs. Use the
options tab to select the separation character.
Trade duration is exported using the format hh:mm. If you import a CSV file to Excel, you may want to
format the Duration cells in Excel to custom format [u]:mm.
Purchase MTReport 4.0
You can buy a licence to use MTReport 4.0 through the website www.mt4tools.com. Please check the
website for current pricing.
First download MTReport 4.0 from the website, and install it on your computer system. Without
purchasing you can start the program in 5 times, so you have an opportunity to test it. If you like the
program, you may want to purchase a license to remove the
To purchase a license, click the appropriate button on the website. You will be taken to an external
page to complete your payment. After the payment has completed successfully, you will receive an
email with an activation code.
Start MTReport 4.0 and select Help->Activate from the menu. This will work, even if your trial has
expired. Enter your email address and activation code, to activate your registration. You can now use
MTReport 4.0.
Please note that a license for MTReport 4.0 is valid for a single computer only.
MTReport 4.0 will only work on the computer you used to activate your registration. If you need to run
the software on more than one computer, you need to buy extra licenses.
Please note that you need internet access to run MTReport 4.0.
MTReport 4.0 will access an authorisation server on the internet, every time you start the program.
The program will not run if you do not have internet access.
Frequently asked questions
with answers…
After starting MTReport 4.0 a message appears: Cannot connect to internet...
MTReport 4.0 needs to connect to the authorisation server to check if you are registered or running in
trial mode. If it cannot connect to the authorisation server, MTReport will exit.
In the summary, the return and drawdown percentages are missing…
This is because there is no deposit in the report, so the initial balance is unknown. Select the Options
tab, check Initial deposit, and enter the deposit manually.
What are ‘per lot’ pips…
The pips (per lot) in the summary are calculated by subtracting the open and close prices from the
trades, and do not depend on the number of lots traded.
After starting MTReport 4.0 a message appears: Software has been compromised…
The MTReport executable has been altered, possibly by a virus. Please use you virus checker, and
download the original software from the website www.mt4tools.com. If you have registered MTReport,
your license will still be valid.
After starting MTReport 4.0 a message appears: Not enough rights to create or delete file…
MTReport 4.0 uses temporary files that are stored in the directory where the program resides. Make
sure you have rights to create, write, and delete files.
My report will not load, or will not load correctly…
Make sure the report is generated directly by MetaTrader. Do not use Word or any html-editor to
change the report. It is not possible to load the daily or monthly reports send by your broker. If you
think you have found an error in MTReport, please send the statement to [email protected].
Make sure to attach the statement as a separate file to your email.
Some reports take a long time to load…
Most reports load within seconds. However, reports with thousands of trades can take some time.
Keep in mind that MetaTrader never intended their reports to be processed like MTReport 4.0 does.
Especially StrategyTester can take a long time to load, because every trade is described in at least
two lines, one for opening the trade, one for closing, and possibly several lines to change the exit
criteria. All these lines have to be combined into one. When your report contains several thousands of
trades, this will take some time.
When adding StrategyTester reports, some of the order numbers are changed…
Order numbers from StrategyTester always start with one. When combining reports, the numbers have
to be made unique for the software to function properly.
My computer crashed and I had to install Windows again, but now MTReport is in trial mode…
Sorry to hear your computer crashed. Please go to the Support section on www.mt4tools.com to
request a new activation code. After entering you email address, you will receive a message with
further instructions. Since this is an automated process, you should be up and running within minutes.
Please note an activation code request will only work if you have purchased MTReport 4.0 in the past.
When loading a report, an error ‘Please use ascending ticket numbers’ is displayed…
Make sure that the StrategyTester results in MetaTrader have ascending ticket numers. In
MetaTrader, click on the # on the top bar of the results list to select either ascending or descending
order.
If have another problem / question / suggestion…
Please let me know at [email protected].
Disclaimer
General disclaimer
Trading any financial market involves risk. The MTReport 4.0 software, the website MT4TOOLS.COM
and its contents are neither a solicitation nor an offer to buy or sell any financial market. The contents
of this website and the MTReport 4.0 software are for general information purposes only.
MT4TOOLS and the author of the MTReport software assume no responsibility for errors, inaccuracies
or omissions in the MTReport software or this website. They do not warrant the accuracy or
completeness of the information, text, graphics, links or other items contained within these materials.
MT4TOOLS and the author of the MTReport software shall not be liable for any special, indirect,
incidental, or consequential damages, including without limitation losses, lost revenues, or lost profits
that may result from these materials.
Risk disclosure
Trading financial markets carries a high level of risk, and may not be suitable for all investors. Before
deciding to trade any financial market you should carefully consider your investment objectives, level
of experience, and risk appetite. The possibility exists that you could sustain a loss of some or all of
your initial investment and therefore you should not invest money that you cannot afford to lose. You
should be aware of all the risks associated with financial markets trading, and seek advice from an
independent financial advisor if you have any doubts. Past returns are not indicative of future results.
Privacy policy
Your privacy is important to us. We will never sell or rent your email address or any other personal
information to anyone.
Affiliation
MT4TOOLS.COM is not in any way affiliated with MetaQuotes Software Corporation.
MetaQuotes Software Corporation is a world leader in a number of successfully implemented online
trading platform solutions within a wide range of dynamic business environments. Currently, over 100
brokerage companies and banks from 30 countries worldwide have chosen their software solutions to
meet and accommodate high business and industrial demands. For more information, please visit the
MetaQuotes website.
Trademarks
MetaTrader is a registered trademark by MetaQuotes Software Corporation.