1
TriLookup™ Version 2.21 User’s Guide
Copyright © 2003 - 2009 Trimill Industrial Systems
All Rights Reserved
For latest news, see www.trimill.com
Trimill Industrial Systems Inc.
Table of Contents
LICENSE AND REGISTRATION ........................................................................................ 1
TRILOOKUP SOFTWARE LICENSE ......................................................................................... 1
HOW TO REGISTER ............................................................................................................. 3
Order form (USD) .......................................................................................................... 5
Order form (EUR) .......................................................................................................... 6
Order form (CAD) .......................................................................................................... 7
GENERAL INFORMATION ................................................................................................ 8
WINDOWS AND MACINTOSH VERSIONS OF TRILOOKUP .......................................................... 8
REVISION HISTORY ............................................................................................................. 9
INSTALLING AND UNINSTALLING TRILOOKUP .......................................................... 12
INSTALLING TRILOOKUP .................................................................................................... 12
PERMANENTLY UNINSTALLING TRILOOKUP ......................................................................... 13
LOADING TRILOOKUP USING EXCEL’S ADD-IN MANAGER...................................................... 14
UNLOADING TRILOOKUP USING EXCEL’S ADD-IN MANAGER ................................................. 15
USING TRILOOKUP......................................................................................................... 16
INTRODUCTION TO TRILOOKUP........................................................................................... 16
TRILOOKUP ONLINE HELP AND EXAMPLES .......................................................................... 19
USING TRILOOKUP FUNCTIONS IN EXCEL WORKSHEETS ...................................................... 21
PROBLEM AFTER MOVING WORKBOOKS WITH TRILOOKUP FUNCTIONS TO ANOTHER COMPUTER
....................................................................................................................................... 24
USING AN EXPLICIT REFERENCE TO TRILOOKUP.................................................................. 28
USING TRILOOKUP FUNCTIONS IN VBA CODE ..................................................................... 30
TRILOOKUP FUNCTIONS ............................................................................................... 32
INDEX OF TRILOOKUP FUNCTIONS ...................................................................................... 32
TVLOOKUP.................................................................................................................... 34
TVLKP............................................................................................................................ 37
THLOOKUP ................................................................................................................... 39
THLKP............................................................................................................................ 42
T2LOOKUP .................................................................................................................... 44
T2LKP ............................................................................................................................ 47
T3LOOKUP .................................................................................................................... 49
T3LKP ............................................................................................................................ 53
TVPOLYDATA ............................................................................................................... 55
THPOLYDATA ............................................................................................................... 59
TPOLY ........................................................................................................................... 63
PARAMETERS ................................................................................................................. 64
INTERPOLATE PARAMETER ................................................................................................ 64
Interpolate = 0: Exact Match Only ............................................................................. 65
Interpolate = 1: Exact Match or Next Lower Value .................................................... 65
Interpolate = 2: Exact Match or Next Higher Value ................................................... 65
Interpolate = 3: Closest Value ................................................................................... 65
TriLookup™ Version 2.21 User’s Guide
i
Trimill Industrial Systems Inc.
Interpolate = 4: Linear Interpolation........................................................................... 65
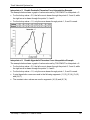
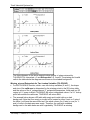
Interpolate = 5: Double Parabolic Piecewise Curve Interpolation.............................. 66
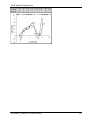
Interpolate = 6: Double Hyperbolic Piecewise Curve Interpolation............................ 66
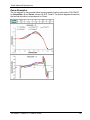
Interpolate = 7: Cubic Spline Curve Interpolation ...................................................... 67
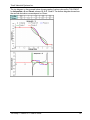
Interpolate = -1 to -20: Polynomial Curve Interpolation ............................................. 68
POWER PARAMETER ......................................................................................................... 70
MISSING_PTS AND EXTRAPOLATE PARAMETERS .................................................................. 72
SMOOTH_R2 PARAMETER ................................................................................................. 73
EXAMPLES (TRILOOKUP FUNCTIONS) ........................................................................ 75
TVLOOKUP & TVLKP EXAMPLES .................................................................................... 75
THLOOKUP & THLKP EXAMPLES ................................................................................... 77
T2LOOKUP & T2LKP EXAMPLES ..................................................................................... 79
T2LOOKUP & T2LKP Examples Without Missing and Invalid Cells............................ 79
T2LOOKUP Examples With Missing and Invalid Cells ................................................ 80
T3LOOKUP & T3LKP EXAMPLES ..................................................................................... 81
T3LOOKUP Single Area 3D Table Examples ............................................................. 81
T3LOOKUP & T3LKP Multi Area 3D Table Examples................................................. 83
T3LOOKUP Skewed 3D Table Examples ................................................................... 85
TVPOLYDATA EXAMPLES ............................................................................................... 87
THPOLYDATA EXAMPLES ............................................................................................... 89
TPOLY EXAMPLES ........................................................................................................... 91
EXAMPLES (PARAMETERS) .......................................................................................... 92
INTERPOLATE EXAMPLES ................................................................................................... 92
Interpolate = 1: Exact Match or Next Lower Value Example ..................................... 93
Interpolate = 2: Exact Match or Next Higher Value Example..................................... 93
Interpolate = 3: Closest Value Example .................................................................... 94
Interpolate = 4: Linear Interpolation Example............................................................ 94
Interpolate = 5: Double Parabolic Piecewise Curve Interpolation Example ............... 95
Interpolate = 6: Double Hyperbolic Piecewise Curve Interpolation Example ............. 95
Interpolate = 7: Cubic Spline Curve Interpolation Example ....................................... 96
Interpolate = -1 to -20: Polynomial Curve Interpolation Example .............................. 96
POWER EXAMPLES ........................................................................................................... 98
MISSING_PTS AND EXTRAPOLATE AND EXAMPLES ............................................................. 100
Missing_pts and Extrapolate for One Lookup Variable (TVLOOKUP and THLOOKUP).... 100
Missing_pts and Extrapolate for Two Lookup Variables (T2LOOKUP) ..................... 101
Missing_pts and Extrapolate for Three Lookup Variables (T3LOOKUP)................... 103
SMOOTH_R2 EXAMPLE .................................................................................................. 105
EXAMPLE WORKBOOKS ............................................................................................. 106
TRILOOKUP INTERACTIVE EXAMPLES ................................................................................ 106
TVLOOKUP & TVLKP Interactive Example Worksheet............................................. 108
T2LOOKUP & T2LKP Interactive Example Worksheet ............................................. 109
T3LOOKUP & T3LKP Interactive Example Worksheet ............................................. 111
TVPOLYDATA & TPOLY Interactive Example Worksheet ........................................ 113
TRILOOKUP PRACTICAL EXAMPLES .................................................................................. 115
GLOSSARY .................................................................................................................... 117
TriLookup™ Version 2.21 User’s Guide
ii
Trimill Industrial Systems Inc.
License and Registration
TriLookup Software License
YOUR AGREEMENT TO THIS LICENSE
You should carefully read the following terms and conditions before using, installing or
distributing this software. Unless you have a different license agreement signed by Trimill
Industrial Systems ("Trimill") your use, distribution, or installation of TriLookup indicates
your acceptance of this agreement ("License").
If you do not agree to all of the terms and conditions of this License, then do not copy,
install, distribute or use any copy of TriLookup with which this License is included.
You may not alter or modify the TriLookup software in any way, nor give anyone
permission to do so. You may not rent, lease, modify, translate, reverse engineer,
decompile, disassemble, or create derivative works based on, TriLookup. You may not
make access to TriLookup available to others in connection with a service bureau,
application service provider, or similar business.
All rights of any kind for TriLookup which are not expressly granted in this License are
entirely and exclusively reserved to and by Trimill.
SHAREWARE VERSION
You have the right to test this program for a period of 30 days. You are allowed to copy
this Shareware version (and ONLY the Shareware version) and give it to any other person,
as long as it is not modified in any way. Under modifications is understood the changing,
adding or removing of any files of this package without a written permission from Trimill.
You are NOT allowed to pack this program together with a commercial program or a book.
Shareware dealers are allowed to sell the Shareware version for a small fee, but it must be
clear to the buyer that he/she isn't receiving the full version! The distribution on CD-ROM is
also permitted, as long as the original files are not changed in any way. Please contact
Trimill if you want to distribute the program with a different installation program, changed
files etc.
Use of this software after the trial period of 30 days is in violation of international Copyright
law!
REGISTRATION
This program is neither freeware nor public domain. Use after the 30 day trial period
requires registration. The registration fee is only USD 20.- or EUR 20.- or CAD 30.- for a
personal license. See How to Register for details on registration.
REGISTERED VERSION (PERSONAL LICENSE)
The registered version may be installed on as many computers as desired, as long as it is
used by only one person at any one time (I.e. one installation at home and one at the office
used by the same person). The usage by multiple people at the same time (on multiple
computers) requires additional licenses.
TriLookup™ Version 2.21 User’s Guide
1
Trimill Industrial Systems Inc.
ADDITIONAL LICENSES (MULTI-USER LICENSES)
Additional licenses allow an institution, company or school to install the program on
multiple computers or on a server. All licenses are issued to the same (company) name,
which appears in the About TriLookup dialog. The program must not run on more
machines at the same time than there are licenses purchased. Additional licenses cost
USD 10.- or EUR 10.- or CAD 15.-for the 2nd to 10th license, etc. (see additional licenses
for details). For larger amounts than 1000 please contact Trimill. Each additional license
also allows a single user to use the program at home.
WARRANTY DISCLAIMERS AND LIABILITY LIMITATIONS
TRILOOKUP, AND ANY AND ALL ACCOMPANYING SOFTWARE, FILES, DATA AND
MATERIALS, ARE DISTRIBUTED AND PROVIDED "AS IS" AND WITH NO
WARRANTIES OF ANY KIND, WHETHER EXPRESS OR IMPLIED. You acknowledge
that good data processing procedure dictates that any program, including TriLookup, must
be thoroughly tested with non-critical data before you rely on it, and you hereby assume
the entire risk of using the program. THIS DISCLAIMER OF WARRANTY CONSTITUTES
AN ESSENTIAL PART OF THIS LICENSE.
ANY LIABILITY OF TRIMILL WILL BE LIMITED EXCLUSIVELY TO REFUND OF
REGISTRATION FEE, IF ANY. IN ADDITION, IN NO EVENT SHALL TRIMILL, OR ITS
PRINCIPALS, SHAREHOLDERS, OFFICERS, EMPLOYEES, AFFILIATES,
CONTRACTORS, SUBSIDIARIES, OR PARENT ORGANIZATIONS, BE LIABLE FOR
ANY INDIRECT, INCIDENTAL, CONSEQUENTIAL, OR PUNITIVE DAMAGES
WHATSOEVER RELATING TO THE USE OF TRILOOKUP, OR TO YOUR
RELATIONSHIP WITH TRIMILL.
IN ADDITION, IN NO EVENT DOES TRIMILL AUTHORIZE YOU TO USE TRILOOKUP IN
APPLICATIONS OR SYSTEMS WHERE ITS FAILURE TO PERFORM CAN
REASONABLY BE EXPECTED TO RESULT IN A SIGNIFICANT PHYSICAL INJURY, OR
IN LOSS OF LIFE. ANY SUCH USE BY YOU IS ENTIRELY AT YOUR OWN RISK, AND
YOU AGREE TO HOLD TRIMILL HARMLESS FROM ANY AND ALL CLAIMS OR
LOSSES RELATING TO SUCH UNAUTHORIZED USE.
GENERAL
This License is the complete statement of the agreement between the parties on the
subject matter, and merges and supersedes all other or prior understandings, purchase
orders, agreements and arrangements. This License shall be governed by the laws of the
Province of British Columbia, Canada. Exclusive jurisdiction and venue for all matters
relating to this License shall be in the courts located in the Province of British Columbia,
Canada, and you consent to such jurisdiction and venue. There are no third party
beneficiaries of any promises, obligations or representations made by Trimill herein. Any
waiver by Trimill of any violation of this License by you shall not constitute or contribute to
a waiver of any other or future violation by you of the same provision, or any other
provision, of this License.
Copyright © 2003, 2004 Trimill Industrial Systems, All rights Reserved.
TriLookup™ Version 2.21 User’s Guide
2
Trimill Industrial Systems Inc.
How to Register
Thank you very much for your interest in TriLookup. This program is Shareware. A
personal license costs 20 USD or 20 EUR or 30 CAD. Additional licenses (registered to
the same name) are available at reduced prices for companies and institutions
The unregistered copy of TriLookup is provided at no charge to the user, for a 30 day
evaluation period. You are encouraged to pass copies of this software along to your
friends and colleagues for evaluation. If you find the program useful and wish to continue
using it beyond the 30 day evaluation period, payment of a registration fee is required. See
TriLookup Software License for details.
Registering Over the Internet
We offer online registration on our homepage. We use PayPal service for credit card
orders. All orders that are less than USD 200 must be processed this way.
http://www.trimill.com/TriLookup/Register.htm
Registering Through the Mail (USD 200 or more)
Only for orders of $200 or more you can print out an Order Form [Order Form (USD),
Order Form (Euro), Order Form (CAD)] and mail it to us the together with your payment.
•
Personal check or cashier's check,
•
International money order;
•
Cash by registered mail, at your own risk!
•
Purchase Orders accepted from recognized businesses and institutions (Net 30 ARO).
What You Will Receive
We will send your registration information (preferably via e-mail). Click on the [Enter
Registration Code] button in the TriLookup start-up window (shown every time you start
Excel) and you will be prompted to enter your Registered User Name and the
corresponding Registration Code. Once entered, the startup screen will be disabled and
your User Name will be displayed in the About TriLookup window (select Help |
TriLookup Help | About from Excel’s menu).
You will also receive a receipt for your records, indicating that the program is properly
registered. For multi-user and/or networked versions, a hard copy of the site license
certificate can be requested for your records.
Free Lifetime Upgrades Policy
After registering your copy of TriLookup, you will have free access to all future revisions
and versions of this program.
TriLookup™ Version 2.21 User’s Guide
3
Trimill Industrial Systems Inc.
Additional Licenses
Additional licenses allow an institution, company or school to install the program on
multiple computers or on a server. All licenses are issued to the same (company) name,
which appears in the About TriLookup dialog. The program must not run on more
machines at the same time than there are licenses purchased.
The cost of TriLookup licenses is as follows:
• 1st license
USD 20.- / Eur 20.- / CAD 30.•
2nd – 10th license
USD 10.- / Eur 10.- / CAD 15.-
for each additional license
•
11th – 25th license
USD 8.- / Eur 8.- / CAD 12.-
for each additional license
•
26th – 100th license
USD 6.- / Eur 6.- / CAD 9.-
for each additional license
•
101st – 1000th license
USD 4.- / Eur 4.- / CAD 6.-
for each additional license
For larger amounts than 1000 please contact us by e-mail to [email protected].
Examples for calculating additional licenses:
• License for 5 users: 20. + 4x10.
= USD 40.-
•
License for 10 users: 20. + 9x10.
= USD 110.-
•
License for 15 users: 20. + 9x10. + 5x8.
= USD 150.-
•
License for 25 users: 20. + 9x10. + 15x8.
= USD 230.-
•
License for 50 users: 20. + 9x10. + 15x8. + 25x6.
= USD 380.-
•
License for 100 users: 20. + 9x10. + 15x8. + 75x6.
= USD 680.-
•
License for 250 users: 20. + 9x10. + 15x8. + 75x6. + 150x4.
= USD 1280.-
Order of additional licenses to an already existing license:
An existing license can always be extended by additional licenses. Such additional
licenses cost the difference between old and new license. Minimum amount for additional
licenses (repeat order) is USD 20.- or EUR 20.- or CAD 30.Example: License extension from a 5 user license to a 30 user license:
5x10. + 15x8. + 5x16. = USD 200.If you have any questions, please ask by e-mail to [email protected]. At your request, we
can send you a special order form for additional licenses by e-mail.
TriLookup™ Version 2.21 User’s Guide
4
Trimill Industrial Systems Inc.
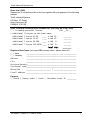
Order form (USD)
Please print, fill out and send this order form together with your payment to the following
address:
Trimill Industrial Systems
530 West 19th Street
North Vancouver, BC
CANADA V7M 1X9
Order TriLookup License(s)
( ) TriLookup personal license
USD __20.-_
+ Additional licenses to the same name:
Additional license 02-10,
____ x USD 10._______
Additional license 11-25,
____ x USD 8._______
Additional license 26-100, ____ x USD 6._______
Additional license 101-1000,____ x USD 4._______
Total USD:
________
Registered User Name (your name OR company name - please check off):
( ) Name
_______________________________________________
( ) Company
_______________________________________________
Address
_______________________________________________
City
_______________________________________________
State/Country _______________________________________________
Zip/Postal code_______________________________________________
Phone/FAX
_______________________ / _____________________
E-mail address _______________________________________________
Payment:
( )Check ( )Money Order ( )Cash ( )Purchase Order #: _________
TriLookup™ Version 2.21 User’s Guide
5
Trimill Industrial Systems Inc.
Order form (EUR)
Please print, fill out and send this order form together with your payment to the following
address:
Trimill Industrial Systems
530 West 19th Street
North Vancouver, BC
CANADA V7M 1X9
Order TriLookup License(s)
( ) TriLookup personal license
EUR __20.-_
+ Additional licenses to the same name:
Additional license 02-10,
____ x EUR 10._______
Additional license 11-25,
____ x EUR 8._______
Additional license 26-100, ____ x EUR 6._______
Additional license 101-1000,____ x EUR 4._______
Total EUR:
________
Registered User Name (your name OR company name - please check off):
( ) Name
_______________________________________________
( ) Company
_______________________________________________
Address
_______________________________________________
City
_______________________________________________
State/Country _______________________________________________
Zip/Postal code_______________________________________________
Phone/FAX
_______________________ / _____________________
E-mail address _______________________________________________
Payment:
( )Check ( )Money Order ( )Cash ( )Purchase Order #: _________
TriLookup™ Version 2.21 User’s Guide
6
Trimill Industrial Systems Inc.
Order form (CAD)
Please print, fill out and send this order form together with your payment to the following
address:
Trimill Industrial Systems
530 West 19th Street
North Vancouver, BC
CANADA V7M 1X9
Order TriLookup License(s) Price includes GST (GST Reg. No: 87997 2826)
( ) TriLookup personal license
CAD __30.-_
+ Additional licenses to the same name:
Additional license 02-10,
____ x CAD 15._______
Additional license 11-25,
____ x CAD 12._______
Additional license 26-100, ____ x CAD 9._______
Additional license 101-1000,____ x CAD 6._______
Total CAD:
________
Registered User Name (your name OR company name - please check off):
( ) Name
_______________________________________________
( ) Company
_______________________________________________
Address
_______________________________________________
City
_______________________________________________
Province/Country______________________________________________
Zip/Postal code_______________________________________________
Phone/FAX
_______________________ / _____________________
E-mail address _______________________________________________
Payment:
( )Check ( )Money Order ( )Cash ( )Purchase Order #: _________
TriLookup™ Version 2.21 User’s Guide
7
Trimill Industrial Systems Inc.
General Information
Windows and Macintosh Versions of TriLookup
Starting in version 2.2, in addition to Windows, TriLookup is also supported on Excel for
Macintosh versions 98, 2001, and X.
The eleven TriLookup worksheet functions work exactly the same way on both Windows
and Macintosh, and on all supported versions of Excel (Excel 97 or higher on Windows
and Excel 98 or higher on Macintosh).
However, there are a some differences between the Windows and Macintosh
implementations of TriLookup in the following areas:
•
The automated setup program for installing and uninstalling TriLookup is provided only
for Windows. Macintosh version has to be installed manually.
•
Windows version includes a complete online help file TriLookup.hlp that can be
accessed from Excel’s Help menu, from the Paste Function dialog and from the
TriLookup example workbooks. Although Macintosh version contains the same help
file, it can only be displayed by Excel 98. Since Excel versions 2001 and X cannot
display the “.hlp” files, the Macintosh version of TriLookup also includes a collection of
help files in HTML format that can be viewed using any Web browser. The HTML help
files can be accessed from Excel’s Help menu and from the TriLookup example
workbooks, but not from the Paste Function dialog.
Note that the HTML help files do not contain the examples for TriLookup functions and
parameters. If you wish to view these examples on the Macintosh with Excel versions
2001 and X you must download this pdf version of TriLookup User's Guide from
http://www.trimill.com/TriLookup/Download.htm.
•
In Windows version the TriLookup functions appear in the TriLookup category of the
Paste Function dialog. In Macintosh version the TriLookup functions appear in the
built in Lookup & Reference category of the Paste Function dialog.
•
Only Windows version of TriLookup displays short help messages for each of the
function parameters in the Formula Palette dialog.
•
A potential problem with broken references that occurs after moving workbooks with
TriLookup functions to another computer generally affects only Macintosh version. See
Problem After Moving Workbooks with TriLookup Functions to Another
Computer for details.
Notes
• Any differences between the two versions of TriLookup are highlighted thought this
manual as follows: Windows Macintosh.
•
Although the messages and dialog boxes in the Macintosh version of Excel look
differently from the ones shown in this document (that have been generated by the
Windows version), their essence is the same.
•
The Excel shortcut keys given in this document apply only to the Windows version.
TriLookup™ Version 2.21 User’s Guide
8
Trimill Industrial Systems Inc.
Revision History
Version 2.21 (15-Mar-2009)
• Minor revision with no change to TriLookup.xla (no need to reinstall).
•
Added automatic installation for Excel 2007.
•
Minor updates to Help file and User’s Manual.
•
Note: in order to display TriLookup on-line help in Windows Vista and Windows Server
2008 you must download and install WinHlp32.exe for Windows Vista or Windows
Server 2008. See Microsoft Knowledge Base Article #917607.
Version 2.2 (02-Jun-2004)
• From this version on TriLookup will also work on Excel for Macintosh versions 98,
2001, and X.
•
Fixed a bug in the TVPOLYDATA and THPOLYDATA functions that caused R² to be
calculated as 1 when the actual value of R² was less than 0.01.
•
Changed the way the best fit curve is determined by the TVPOLYDATA and
THPOLYDATA functions. The curve with the maximum value of R² is selected as the
best fit curve, as stated in TriLookup documentation. Previous versions picked the
curve with the minimum Sum(Error²). While in most cases the maximum R²
corresponds to the minimum Sum(Error²), sometimes the two don't coincide.
•
TriLookup example workbooks were reformatted to use old style Forms controls
instead of ActiveX controls on the worksheets. This solved compatibility issue on
Macintosh and it also shortens the time required to open the example workbooks.
•
A new combo box has been added to the worksheets in the Interactive Examples
workbook which lets you select whether or not to hide the #N/A points on the line
diagrams. The process of removing the #N/A points can take a long time on a slow
computer.
•
Starting in this version, the evaluation version of TriLookup will stop functioning after 30
days and all TriLookup functions will return the following message:
“Error: TriLookup 30 day evaluation period expired!”
Version 2.1 (21-Mar-2004)
• A new parameter called Index_mode has been added to the TVLOOKUP, TVLKP,
THLOOKUP, THLKP, TVPOLYDATA and THPOLYDATA functions. Index_mode is
used to explicitly choose the way lookup and return rows/columns are selected: either
by their titles (Index_mode = FALSE), or by their index number, i.e. the position in
Table_array (Index_mode = TRUE).
Note that in version 2.0 the way of identifying lookup and return rows/columns was not
explicitly specified. Instead, identifying a row/column by its title took precedence over
specifying it by its index number, which in some cases could have caused ambiguity
regarding which row/column is being selected. This ambiguity has been eliminated with
the addition of the Index_mode parameter.
TriLookup™ Version 2.21 User’s Guide
9
Trimill Industrial Systems Inc.
Note that Index_mode is the last parameter in the list, it is optional and its default value
is FALSE. Therefore, the formulas created with TriLookup versions 1.x, (which only
allows selecting lookup and return rows/columns by titles) will not be affected and can
be used without modifications. However, the formulas created with TriLookup version
2.0 that implicitly use row/column selection by index number, have to be modified by
setting Index_mode = TRUE.
Version 2.0 (19-Mar-2004)
• Thanks to Laurent Longre’s FunCustomize.dll add-in, the problem described in section
Problem After Moving Workbooks with TriLookup Functions to Another
Computer was eliminated. The new workbooks will automatically reference TriLookup
2.0 if you refer to any of the TriLookup functions in the cell formulas. The references
will stay valid after the workbook is moved from one computer to another.
•
Thanks to Laurent Longre’s FunCustomize.dll add-in, the Formula Palette dialog now
also displays a short help message for each of the function parameters.
•
In addition to identifying the lookup and return rows/columns by their titles, you can now
also use the Lookup_title and Return_title parameters to specify the lookup and return
rows/columns by their position in Table_array (1 for the first row/column, 2 for the
second row/column, etc.). The affected functions are TVLOOKUP, TVLKP,
THLOOKUP, THLKP, TVPOLYDATA and THPOLYDATA.
•
The TriLookup functions now appear in a separate TriLookup function category in the
Paste Function dialog.
•
Fixed the bug that caused T2LOOKUP, T2LKP, T3LOOKUP and T3LKP functions to
return a #VALUE error when the number of rows multiplied by the number of columns
exceeded 32767.
Version 1.2 (15-Jan-2004)
• The setup program will now also install TriLookup for Excel 2003 in addition to Excel
97, 2000 and 2002 (XP).
•
Fixed a bug in handling extrapolation for Interpolate (X/Y/Z_interpolate) = 6, when the
values of the last three points in the series (the ones used to calculate the extrapolated
result) are not uniformly ascending or uniformly descending, i.e., they produce a local
maximum or a local minimum.
Versions 1.0 and 1.1 return Excel’s #VALUE error, even for Error_msg = TRUE.
Version 1.2 returns a #N/A error, or if Error_msg = TRUE the following error message:
“N/A {Err.315} Cannot extrapolate for Interpolate = 6, when the end 3-point segment
has a minimum or a maximum.”
•
Changed the way extrapolation is performed when Interpolate (X/Y/Z_interpolate) = 6.
Versions 1.0 and 1.1 extrapolate by extending the hyperbolic curve defined by the end
3-point segment. Due to divergent nature of the hyperbolic curve, this usually leads to
highly unpredictable results.
Version 1.2 extrapolates by extending the tangent drawn through the end point of the
TriLookup™ Version 2.21 User’s Guide
10
Trimill Industrial Systems Inc.
hyperbolic curve defined by the end 3-point segment. The extrapolated values now lie
on a straight line, which makes the results of extrapolation much more predictable.
•
Fixed a bug in the Interactive Examples workbook which prevented hiding of the #N/A
points on the line graphs.
Version 1.1 (29-Sep-2003)
• Added switching to manual calculation when loading interactive example to avoid
recalculation.
•
Fixed a bug in processing tables with constant Y values in TVPOLYDATA and
THPOLYDATA.
Version 1.0 (26-Mar-2003)
• Initial release of TriLookup.
TriLookup™ Version 2.21 User’s Guide
11
Trimill Industrial Systems Inc.
Installing and Uninstalling TriLookup
Installing TriLookup
Windows
To install TriLookup on a Windows computer please follow the procedure outlined below:
•
Download TriLookup setup file TriLookup_XX_Setup.exe to any folder on your
computer.
Note that XX indicates TriLookup version number, for example, 22 means version 2.2.
•
Close all running programs. In particular, be sure to close Excel.
•
Run the TriLookup Setup program (double-click on TriLookup_XX_Setup.exe in the
Windows explorer or run it through the Windows Start | Run... dialog), and follow the
prompts.
•
The Setup program will install TriLookup.xla add-in files and optional online help and
example files in a folder that you specify.
•
After the Setup program has successfully completed the installation, you can start
Excel. TriLookup add-in will be installed and loaded in all supported versions of Excel
that are installed on your computer.
Note: In order for TriLookup to work, you must have Microsoft® Excel version 97, 2000,
2002 (XP) , 2003 or 2007 installed on your computer.
Macintosh
To install TriLookup on a Macintosh please follow the procedure outlined below:
•
Download TriLookup zip file TriLookup_XX_Mac.zip.
Note that XX indicates TriLookup version number, for example, 22 means version 2.2.
•
Unzip (expand) the contents of TriLookup_XX_Mac.zip to a new separate folder on
your Hard Drive.
•
Start Excel and on the Tools menu, click Add-Ins.
•
Click [Select], go to the folder into which you have unzipped the TriLookup zip file,
select TriLookup.xla and click [Open].
•
Answer No when asked to copy TriLookup.xla to the Add-ins folder. Note that if you
answer Yes to this question TriLookup will still work, however, it will not be able to
locate and display the included online help files.
Note: In order for TriLookup to work, you must have Microsoft® Excel for Macintosh
version 98, 2001, or X installed on your computer.
TriLookup™ Version 2.21 User’s Guide
12
Trimill Industrial Systems Inc.
Permanently Uninstalling TriLookup
Windows
To uninstall TriLookup and permanently remove it from a Windows computer please
follow the procedure outlined below:
Step 1
• Unload TriLookup using Excel’s add-in manager. This is not a necessary step, but it is
highly recommended in order to avoid a File not found error message next time you
start Excel.
•
Close Excel if it is running.
Step 2
Option a)
• Click the Windows Start button, point to Settings, and then click Control Panel.
•
Double-click the Add/Remove Programs icon.
•
Click Trimill TriLookup on the Install/Uninstall tab, and then click Add/Remove.
•
Confirm that you wish to uninstall TriLookup and all of its components by clicking on
the [Yes] button.
Option b)
• Click the Windows Start button, point to Programs | TriLookup, and click on
Uninstall TriLookup.
•
Confirm that you wish to uninstall TriLookup and all of its components by clicking on
the [Yes] button.
Macintosh
To uninstall TriLookup and permanently remove it from a Macintosh computer please
follow the procedure outlined below:
•
Unload TriLookup using Excel’s add-in manager.
•
Find the folder in which you installed TriLookup and move it to trash.
•
On Excel’s Tools menu, click Add-Ins and in the Add-Ins available box, select the
check box next to TriLookup.
•
Answer Yes when asked whether to delete TriLookup.xla from the list.
TriLookup™ Version 2.21 User’s Guide
13
Trimill Industrial Systems Inc.
Loading TriLookup Using Excel’s Add-in Manager
If you have previously unloaded TriLookup but haven’t uninstalled it from your computer,
you can load it again using Excel’s add-in manager.
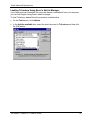
To load TriLookup, please follow the procedure outlined below:
•
On the Tools menu, click Add-Ins.
•
In the Add-Ins available box, select the check box next to TriLookup and then click
the [OK] button.
TriLookup™ Version 2.21 User’s Guide
14
Trimill Industrial Systems Inc.
Unloading TriLookup Using Excel’s Add-in Manager
If you are not using the TriLookup add-in often, you can unload it to conserve memory and
reduce the time it takes to start Excel. Unloading TriLookup removes its custom functions
from Excel, but the TriLookup add-in program remains installed on your computer so you
can easily load it again.
You should also unload TriLookup before permanently uninstalling it.
Note: When you unload the TriLookup add-in from Microsoft Excel, it is not removed from
your computer system.
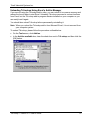
To unload TriLookup, please follow the procedure outlined below:
•
On the Tools menu, click Add-Ins.
•
In the Add-Ins available box, clear the check box next to TriLookup and then click the
[OK] button.
TriLookup™ Version 2.21 User’s Guide
15
Trimill Industrial Systems Inc.
Using TriLookup
Introduction to TriLookup
For latest news, see http://www.trimill.com/TriLookup/TriLookup.htm.
What is TriLookup?
TriLookup is an add-in for Microsoft® Excel for Windows versions 97, 2000, 2002 (XP),
2003 and 2007 and Excel for Macintosh versions 98, 2001 and X. When installed,
TriLookup adds eleven powerful lookup and interpolation worksheet functions to Excel,
which offer greatly enhanced functionality compared to Excel's built-in lookup functions.
You can use them to perform simple table lookup, as well as, interpolation and
extrapolation from tables with one, two or three independent variables.
All TriLookup functions can be accessed through Excel’s Function Wizard (select
Function... from the Inset worksheet menu, or click on the Paste Function button
in
the standard toolbar). See Using TriLookup Functions in Excel Worksheets for details.
TriLookup add-in package includes a comprehensive online help and a couple of example
spreadsheets that demonstrate the capabilities and the proper usage of the added
functions. You can access the online help and example files by selecting TriLookup Help
from Excel’s Help menu. See TriLookup Online Help and Examples for details.
TriLookup It is written entirely in Visual Basic for Applications (VBA).
Shareware
TriLookup is Shareware, i.e. you can test the fully functional evaluation version for 30
days. After this trial period, you must register or delete the program from your hard disk.
You may also freely redistribute this program. See How to Register and TriLookup
Software License for further information.
The evaluation version of TriLookup is fully functional and differs from the registered
version only by displaying “TriLookup splash screen” every time you start Excel.
TriLookup is Copyright © by Trimill Industrial Systems All Rights Reserved.
Do I Need TriLookup?
You will benefit from using TriLookup if your requirements go beyond the limited
capabilities of the built-in Excel’s lookup functions (MATCH, LOOKUP, VLOOKUP and
HLOOKUP) and/or if you wish to use Excel to fit polynomial curves through sets of X-Y
points. For example, you may have encountered some of the following problems:
•
Excel’s HLOOKUP and VLOOKUP built-in functions require that you specify the
sequential number of the table row or column containing the data. Therefore, if you
later modify your lookup table by inserting or deleting rows or columns, you must
remember to go back and update the row/column numbers in the formulas using
HLOOKUP and VLOOKUP functions. Otherwise, you may get the #VALUE! errors, or
incorrect results by inadvertently retrieving data from unintended rows or columns.
•
If you have an error in a cell formula using the built-in lookup functions, you will
probably receive an Excel error code, such as #VALUE! or #N/A. Since you get no
explanation about what caused the error, you can spend a lot of time trying to debug it.
TriLookup™ Version 2.21 User’s Guide
16
Trimill Industrial Systems Inc.
•
Excel’s built-in lookup functions cannot retrieve an interpolated value when the lookup
value falls in-between the values that are given in the lookup table. At best, you can get
an “approximate match”, described in Excel’s help topic for VLOOKUP as “...
approximate match is returned. In other words, if an exact match is not found, the next
largest value that is less than lookup_value is returned”. For example, if the lookup
column contains values ... 1, 10, 100, 1000 ... and your lookup value is 99, then the
“approximate match” will return the table value for 10.
•
If you have a 2D lookup table in which the return values depend on two lookup
variables, X and Y, you have to use a convoluted formula to retrieve a value from the
table, for example:
=INDEX(LookupTable,MATCH(Y_value,LeftColumn,1),MATCH(X_value,TopRow,1))
Notice that in order to accomplish this simple task, you need to enter three lookup
functions and separately reference three ranges of cells (one for the whole lookup
table, one for the leftmost column and one for the topmost row). However, if there is no
exact match for both X and Y lookup values, the best you can get is an “approximate
match”, as described in the paragraph above.
•
Suppose that you have a 3D lookup table (made up of a series of 2D lookup tables) in
which the return values depend on three lookup variables, X, Y and Z. While it is still
possible to use Excel’s lookup and reference functions to retrieve a value from a 3D
table, it requires that you use a separate cell with a formula similar to the one in the
paragraph above to perform X-Y lookup in each component 2D table, and then use an
additional cell formula to perform Z lookup. Again, if there is no exact match for X, Y
and Z lookup values, you can only get an “approximate match”, as described above.
•
If you want to fit a polynomial curve through a set of X-Y points you can, in theory, find
its coefficients it by using Excel’s built-in TREND and LINEST functions. In practice,
however, you will probably give up before you get this method to work. Alternatively,
you can insert an X-Y chart using the table data as a source, then add a polynomial
trendline, display its equation on chart, cut and paste the trendline equation into a cell,
and after some editing obtain a working formula for the polynomial curve. In addition to
the number of steps involved, the problem with this method is that the maximum
polynomial order that you can use is 6.
If you have encountered any of the difficulties described above, then you should find
TriLookup functions helpful in your work.
TriLookup Functions Feature Highlights
• TVLOOKUP (TVLKP) and THLOOKUP (THLKP) functions are enhanced versions of
Excel’s VLOOKUP and HLOOKUP built-in functions. They allow you to assign any
column or row of a rectangular cell range as a lookup and return row/column, by simply
specifying the row/column title or its index (number).
•
T2LOOKUP and T2LKP functions allow you to retrieve values from 2D tables that have
two independent variables, X and Y.
•
T3LOOKUP and T3LKP functions allow you to retrieve values from 3D tables that have
three independent variables, X, Y and Z.
TriLookup™ Version 2.21 User’s Guide
17
Trimill Industrial Systems Inc.
•
Depending on the values of optional parameters, all TriLookup functions listed above
can calculate the return value by interpolating or extrapolating table values.
•
Several modes of interpolation are available including closest value lookup, linear
interpolation, curve interpolation using parabolic and hyperbolic piecewise curves,
cubic splines and polynomial curves of order up to 20.
•
TriLookup functions can process tables with missing and invalid values by either
returning #N/A values in the areas of missing data, or by interpolating and extrapolating
from the valid table values.
•
TVPOLYDATA and THPOLYDATA functions allow you to easily determine polynomial
curve coefficients, with order up to 20. The polynomial curves are fitted through the X-Y
data points given in a multi-column or a multi-row table, using the least squares
method.
•
The TVPOLYDATA and THPOLYDATA functions automatically determine the best fit
polynomial curve, with an option of taking into account the smoothness of the curve
between the X-Y data points.
•
TPOLY function calculates the return value (Y) of a Y = f(X) polynomial curve for a
given lookup value (X) and an array of polynomial curve coefficients. Optionally, it can
return the value of a derivative (1st, 2nd, 3rd, etc) for the given lookup value (X).
•
In case of an error, all TriLookup functions (except TPOLY) can either return a standard
Excel error code (such as #NA or #VALUE!), or a detailed text error message indicating
the nature of the error and pointing to the cause of it. This feature can be very helpful
when debugging your spreadsheet.
TriLookup™ Version 2.21 User’s Guide
18
Trimill Industrial Systems Inc.
TriLookup Online Help and Examples
TriLookup add-in package includes the following online help and examples:
•
Online help file (TriLookup.hlp). Note: in order to display TriLookup.hlp in Windows
Vista and Windows Server 2008 you must download and install WinHlp32.exe for
Windows Vista or Windows Server 2008. See Microsoft Knowledge Base Article
#917607.
•
Two Excel workbooks with interactive and practical examples that demonstrate the
capabilities and the proper usage of TriLookup functions.
•
Macintosh version of TriLookup also includes a collection of help files in HTML format
that can be viewed using any Web browser.
Once TriLookup is installed, the online help can be accessed from Excel by selecting
TriLookup Help on the Help menu and then clicking Help (in Excel 2007 click on Add-Ins
banner and then TriLookup Help).
The interactive and practical example workbooks can be accessed by selecting TriLookup
Help on the Help menu, then Example Workbooks and then clicking on Interactive or
Practical.
If you are using a Windows version of TriLookup, or a Macintosh version with Excel 98,
you can also get help on individual TriLookup functions from the Paste Function and
Formula Palette Excel dialogs by clicking on the help button
and then clicking on Help
with this feature | Help on selected function in the Office Assistant’s dialog balloon.
Note: Windows version includes a complete online help file TriLookup.hlp that can be
accessed from Excel’s Help menu, from the Paste Function dialog and from the
TriLookup example workbooks. Although Macintosh version contains the same help
file, it can only be displayed by Excel 98. Since Excel versions 2001 and X cannot
display the “.hlp” files, the Macintosh version of TriLookup also includes a collection
TriLookup™ Version 2.21 User’s Guide
19
Trimill Industrial Systems Inc.
of help files in HTML format that can be viewed using any Web browser. The HTML
help files can be accessed from Excel’s Help menu and from the TriLookup
example workbooks, but not from the Paste Function dialog.
TriLookup™ Version 2.21 User’s Guide
20
Trimill Industrial Systems Inc.
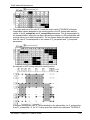
Using TriLookup Functions in Excel Worksheets
Once installed, TriLookup functions can be accessed by typing in the function name,
followed by parameters in parentheses, into an Excel worksheet cell. For example, if you
wish to use the T2LOOKUP function to retrieve interpolated values from a 2D X-Y lookup
table, you could type the following formula into a cell:
=T2LOOKUP(5.5,0.9,$B$6:$E$10,4,4,1,,,,,,TRUE)
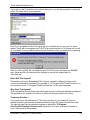
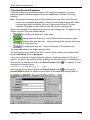
Another way of accessing TriLookup functions is to use Excel’s Paste Function dialog by
selecting Function... from the Inset worksheet menu, or by clicking on the Paste
Function button
located in the standard toolbar (in Excel 97 and 2000 only). Either way
will activate the Paste Function dialog, which will let you interactively select the function
you wish to use.
In Windows version all TriLookup functions are located in the separate TriLookup function
category.
In Macintosh version all TriLookup functions are located in the built-in Lookup &
Reference function category.
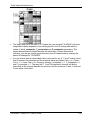
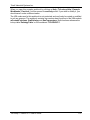
After selecting the desired function and clicking on the [OK] button, you will be prompted to
interactively enter the function parameters through Excel’s Formula Palette dialog box:
TriLookup™ Version 2.21 User’s Guide
21
Trimill Industrial Systems Inc.
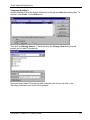
Note that the parameter help in the Formula Palette dialog box is only available in the
Windows version.
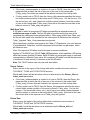
If you wish to change parameter values in a cell that already contains a TriLookup function,
you can do that either manually by editing the cell formula text, or interactively by selecting
the cell and then clicking on the Paste Function button . For example, if a cell contains
the following formula:
=T2LOOKUP(5.5,0.9,$B$6:$E$10,4,4,1,,,,,,TRUE)
then selecting the cell and clicking on the Paste Function button
will invoke the
Formula Palette dialog box with the current values of the parameters already filled in:
This method is especially useful for functions that have many optional parameters, such as
T2LOOKUP and T3LOOKUP.
Obtaining Help on TriLookup Functions and Parameters
You can display online help on the selected TriLookup function and its parameters by
pressing the <F1> key while in the Paste Function dialog or the Formula Palette dialog,
or by clicking on the
button in the bottom left corner of the dialog box and then clicking
TriLookup™ Version 2.21 User’s Guide
22
Trimill Industrial Systems Inc.
on Help with this feature | Help on selected function in the Office Assistant’s dialog
balloon.
Note that this feature is not available in Macintosh version with Excel 2001 and Excel X.
TriLookup™ Version 2.21 User’s Guide
23
Trimill Industrial Systems Inc.
Problem After Moving Workbooks with TriLookup Functions to Another
Computer
Windows
Thanks to implementing Laurent Longre’s FunCustomize.dll add-in, the problem described
in this section was eliminated in the TriLookup Windows Version 2.0. Any new workbooks
you create will automatically link to TriLookup if you reference any of the TriLookup
functions in cell formulas. The references will stay valid even after the workbook has been
moved from one computer to another.
However, any existing workbooks that have references to TriLookup version 1.x will
continue to cause the problem described below. The problem will also occur if you
explicitly establish a workbook reference to TriLookup.xla from the VBA editor, as
described in section Using an Explicit Reference to TriLookup.
Macintosh
Unfortunately, the above fix is unavailable for Macintosh. Therefore, the problem described
in this section still applies to all Macintosh versions of TriLookup.
The Problem
Due to inner workings of Excel, there is a potential problem when distributing workbooks
that use any external add-in, including TriLookup. When moving or copying a worksheet
that references TriLookup functions from one computer to another, you may encounter a
problem with broken references (links) to TriLookup, even if the TriLookup add-in is
properly installed and loaded on both computers.
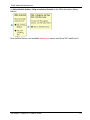
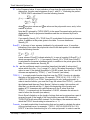
Example of What Can Happen
Suppose that you have TriLookup installed on your computer and that you have created a
workbook containing the following formula in one of the cells:
=TVLKP(0.75,$A$3:$D$8,"X2","Y1",4)
The above cell formula evaluates properly on your computer by referencing the TVLKP
function. Next, you copy your workbook to another computer, which also has TriLookup
installed. However, when you open the workbook on the other computer, Excel gives you
the following error message:
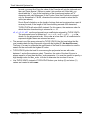
If you click on [No], the above cell referencing TVLKP (and any other cell referencing any
other TriLookup function) will return the #NAME? error value. When you select the cell,
you will see in the formula bar that the above formula has been changed and now reads
something like:
='C:\Program Files\Trimill\TriLookup\TriLookup.xla'!TVLKP(0.75,$A$3:$D$8,"X2","Y1",4)
TriLookup™ Version 2.21 User’s Guide
24
Trimill Industrial Systems Inc.
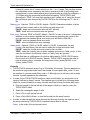
If you click on the [Yes] button in the above dialog box, you will be prompted to locate the
locate TriLookup.xla on your computer:
Even if you go ahead and find TriLookup.xla, your troubles are not over yet! For some
reason, Excel will not recognize that TVLKP is a custom function in TriLookup.xla, but will
try to evaluate it as a workbook name and will, therefore, show you another error warning:
After you click on [OK], the cell referencing the TVLKP function will return the #NAME?
error value and the cell formula will be changed to include the original path to
TriLookup.xla.
When Will This Happen?
This problem will occur if and only if TriLookup is installed in different folders on the
source and destination computers (for example, in “C:\Program Files\Trimill\TriLookup” on
one computer and in “C:\Program Files\Excel Add-Ins” on the other computer).
Why Does This Happen?
This is caused by the way Excel internally keeps record of references between workbooks.
The problem is not unique to TriLookup, it affects all third party add-ins for Excel.
Temporary Solution 1
If you have only a few references to TriLookup functions in your workbook, you can
manually edit the cell formulas and delete the hard coded TriLookup.xla path from them.
You can also use Excel’s search and replace to delete the 'C:\Program
Files\Trimill\TriLookup\TriLookup.xla'! string from all of your worksheet formulas at
once. That should fix the problem.
TriLookup™ Version 2.21 User’s Guide
25
Trimill Industrial Systems Inc.
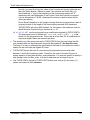
Temporary Solution 2
Another method of fixing the broken references is through the Links Excel dialog box. To
access it, click Links... on the Edit menu.
Then click on [Change Source...]. Excel will show the Change Links dialog that will
prompt you to locate TriLookup.xla.
Once you have located TriLookup.xla and confirmed your choice, the links to the
TriLookup functions in your book will be updated
TriLookup™ Version 2.21 User’s Guide
26
Trimill Industrial Systems Inc.
Permanent Solution
The downside of the two temporary solutions described above is that the same problem
will occur every time you copy the workbook from one computer to another, which, in the
long run, can become quite annoying. A permanent solution involves a bit more work, but it
will probably be worth it.
To enable the workbook to automatically find the path to TriLookup on any computer on
which TriLookup is installed, you need to Use an Explicit Reference to TriLookup, as
described in the following section.
TriLookup™ Version 2.21 User’s Guide
27
Trimill Industrial Systems Inc.
Using an Explicit Reference to TriLookup
You will need to use an explicit reference to TriLookup if:
•
In Windows version if you are having problems with broken links to TriLookup functions
in any existing workbooks that were created using TriLookup version 1.x, as described
in Problem After Moving Workbooks with TriLookup Functions to Another
Computer.
•
In Macintosh version if you want to create a portable version of the workbook that can
be moved or copied between computers, as described in Problem After Moving
Workbooks with TriLookup Functions to Another Computer.
•
You want to call TriLookup functions from VBA code, as described in Using TriLookup
Functions in VBA Code.
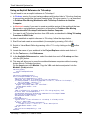
In order to establish an explicit reference to TriLookup, follow the steps below:
1. Start Excel and create a new workbook (for example by pressing <Ctrl><N>).
2. Switch to Visual Basic Editor by pressing <Alt><F11> or by clicking on the
button.
toolbar
3. Locate the name of your workbook in the Project Explorer window and click on it.
4. On the Tools menu, click References.
5. In the Available References box, select the check box next to TriLookup and then
click the [OK] button.
6. This step will allow you to move the workbook between computers without causing
broken links to TriLookup functions:
On the Insert menu click Module. Copy the VBA code below and paste it into the
Module1 (Code) window:
Sub Auto_Open()
GetTriLookupReference
End Sub
Sub GetTriLookupReference()
Dim TriLookupFileName As String
Application.ScreenUpdating = False
'Read the full path to TriLookup.xla from the Registry
TriLookupFileName = GetSetting(appname:="Trimill", section:="TriLookup", _
key:="FileName", Default:="")
If TriLookupFileName = "" Then
MsgBox "TriLookup Addin not installed."
ThisWorkbook.Saved = True
Exit Sub
End If
'Add a reference to TriLookup to this file using Registry info
On Error GoTo TriLookupRefError
ThisWorkbook.VBProject.References.AddFromFile TriLookupFileName
Application.ScreenUpdating = True
ThisWorkbook.Saved = False
Exit Sub
TriLookupRefError:
'Ignore error if the reference to TriLookup is already active
If Err <> 32813 Then
MsgBox Title:="TriLookup Reference", _
Prompt:="Error: " & Err & ": " & Err.Description
ThisWorkbook.Saved = True
End If
Application.ScreenUpdating = True
End Sub
TriLookup™ Version 2.21 User’s Guide
28
Trimill Industrial Systems Inc.
7. Return to Excel by closing Visual Basic Editor or by pressing <Alt><F11>.
8. (Optional) At this point, you can save the file as an Excel template (.xlt), so that in the
future you can use the template for creating new workbooks, instead of going through
the steps described above. This will ensure that the workbooks based on this template
will be properly set to reference TriLookup and will have the required VBA code already
built in.
9. You can now enter formulas using TriLookup functions. Save the workbook when you
done.
Once the workbook referencing TriLookup functions is set up in this way, you can freely
copy it from one computer to another without having to worry about broken references.
Note Regarding Excel for Windows Versions 2002 (XP) and Higher
Opening a workbook containing the VBA code from step 6 in Excel for Windows versions
2002 (XP), 2003 and 2007 will cause the following error message:
Error: 1004: Programmatic Access to Visual Basic Project is Not Trusted
Cause
Microsoft Excel 2002 contains a new security feature that allows you to choose whether or
not programmatic access to the Visual Basic project should be trusted. The default setting
is to not trust programmatic access to the Visual Basic project.
The VBA code shown in step 6 above programmatically establishes a reference from the
workbook that contains it to TriLookup.xla.
Solution
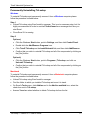
To allow programmatic access to TriLookup, and all other Visual Basic projects, follow
these steps:
1. On the Tools menu, point to Macro and then click Security (in Excel 2007 Click on
Office button, then Excel Options and select Trust Center).
2. In the Security dialog box, click the Trusted Sources tab (in Excel 2007 click Trust
Center Settings).
3. Click to select the Trust Access to Visual Basic Project check box (in Excel 2007
click Trust access to VBA project object model).
In case you don’t plan to use your workbook on different computers, you can also resolve
this problem by skipping step 6.
TriLookup™ Version 2.21 User’s Guide
29
Trimill Industrial Systems Inc.
Using TriLookup Functions in VBA Code
Once you have installed TriLookup, you can use its worksheet functions in your own VBA
code. In order to do this, you must first establish a reference to TriLookup.xla from your
workbook (see Using an Explicit Reference to TriLookup).
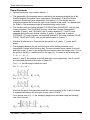
With a little bit of VBA programming, you can define your own custom worksheet functions
based on TriLookup functions. This can be useful if plan to use many references to the
same TriLookup function with the constant values for most of the parameters.
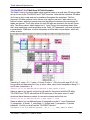
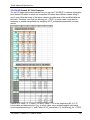
For example, suppose you have the following lookup table, with the name “MyTable”
assigned to the cell range $A$2:$D$7:
Also, suppose that every time you lookup a value from the above table, you want to:
•
Assign the column titled “X” as the lookup column;
•
use double parabolic interpolation (Interpolate = 5) with curve averaging using a sine
curve (Power = 0);
•
extrapolate up to 0.5 units past minimum and maximum table lookup values (i.e.,
lookup for any values between 0.5 and 5.5);
•
allow missing or invalid cells;
•
return a detailed error message in case of an error.
To accomplish the above task, you can use the TVLOOKUP function in your cell formula.
For example, assuming the lookup value of 0.75 and the return column title Y1, the
corresponding cell formula would be:
=TVLOOKUP(0.75,MyTable,"X","Y1",5,0.5,0,TRUE,TRUE)
Since you plan to use this formula in many cells of your workbook, but only wish to change
the lookup value and the title of the return column, you can simplify the cell formulas by
creating your own custom sheet function using VBA. The custom function (named
MyLookup in the example below) has only 2 parameters: Lookup_value and Return_title,
while all other parameters that MyLookup passes to TVLOOKUP are kept constant.
The following VBA code defines the MyLookup custom sheet function, assuming that the
range named MyTable is located in the worksheet named ‘MyTable Sheet’:
Function MyLookup(Lookup_value, Return_title)
Const Worksheet_name = "MyTable Sheet"
Const Table_array_name = "MyTable"
Const Lookup_title = "X"
Const Interpolate = 5
Const Extrapolate = 0.5
Const Power = 0#
Const Missing_pts = True
Const Error_Msg = True
TriLookup™ Version 2.21 User’s Guide
30
Trimill Industrial Systems Inc.
On Error GoTo SomethingWrong
With ThisWorkbook.Worksheets(Worksheet_name)
MyLookup = TVLOOKUP(Lookup_value, .Range(Table_array_name), Lookup_title, _
Return_title, Interpolate, Extrapolate, Power, Missing_pts, Error_Msg)
End With
Exit Function
SomethingWrong:
MyLookup = "#Error in Custom Function."
End Function
Assuming you have entered the above code into a VBA Code Module of the workbook
named ‘My Workbook.xls’ (which contains the worksheet named ‘MyTable Sheet’ with
the lookup table ‘MyTable’), you can now replace the following formula referencing
TVLOOKUP:
=TVLOOKUP(0.75,MyTable,"X","Y1",5,0.5,0,TRUE,TRUE)
with the formula below referencing MyLookup:
=MyLookup(0.75,"Y1")
You can use this formula in all worksheets of ‘My Workbook.xls’. You can also use the
MyLookup function in other workbooks, by prefixing it with the workbook name:
='My Workbook.xls'!MyLookup(0.75,"Y1")
or by establishing the reference to ‘My Workbook.xls’ through Tools | References from the
Visual Basic Editor menu.
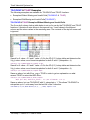
Example
TriLookup Practical Examples workbook contains two custom sheet functions in the
VBA module mCustomFunctions: GasEnthalpy and GasTemperature. Both
functions reference the lookup table ‘EnthalpyTable’ on the worksheet ‘TVLOOKUP
2’. The same module also contains the Sub named GetTriLookupReference that
can be used to automatically establish the reference to TriLookup.xla.
TriLookup™ Version 2.21 User’s Guide
31
Trimill Industrial Systems Inc.
TriLookup Functions
Index of TriLookup Functions
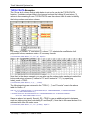
TVLOOKUP
Searches a 2D multi column table for the lookup value in the lookup column and
returns a value from the same row of the return column. It can use interpolation and
can process missing or invalid values.
TVLKP
Simplified version of TVLOOKUP. Searches a 2D multi column table for the lookup
value in the lookup column and returns a value from the same row of the return
column. It can use interpolation.
THLOOKUP
Searches a 2D multi row table for the lookup value in the lookup row and returns a
value from the same column of the return row. It can use interpolation and can
process missing or invalid values.
THLKP
Simplified version of THLOOKUP. Searches a 2D multi row table for the lookup
value in the lookup row and returns a value from the same column of the return row.
It can use various types of interpolation.
T2LOOKUP
Searches a 2D (X-Y) table for X values in topmost row and Y values in leftmost
column, and returns a value from the intersecting row and column. It can use
interpolation and can process missing or invalid values.
T2LKP
Simplified version of T2LOOKUP. Searches a 2D (X-Y) table for X values in
topmost row and Y values in leftmost column, and returns a value from the
intersecting row and column. It can use interpolation.
T3LOOKUP
Searches a 3D (X-Y-Z) table for X, Y and Z values. Returns a value V(x,y,z) from
the intersecting row, column and table. It can use interpolation and can process
missing or invalid values.
T3LKP
Simplified version of T3LOOKUP. Searches a 3D (X-Y-Z) table for X, Y and Z
values. Returns a value V(x,y,z) from the intersecting row, column and table. It can
use interpolation.
TriLookup™ Version 2.21 User’s Guide
32
Trimill Industrial Systems Inc.
TVPOLYDATA
Calculates polynomial curve coefficients up to a specified order (using the least
squares method) for the X-Y data points given in a multi-column table. It also
determines the best fit curve.
THPOLYDATA
Calculates polynomial curve coefficients up to a specified order (using the least
squares method) for the X-Y data points given in a multi-row table. It also
determines the best fit curve.
TPOLY
Returns the Y value of a polynomial curve for given a lookup value (X), polynomial
order and an array of polynomial curve coefficients. It can optionally return the value
of a derivative.
TriLookup™ Version 2.21 User’s Guide
33
Trimill Industrial Systems Inc.
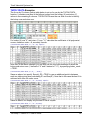
TVLOOKUP
Identifies lookup column and return column of a 2D multi column table by searching for the
specified lookup and return titles in the topmost row of the table, or by column index
numbers; then searches for the specified lookup value in the lookup column and returns a
value from the same row of the return column. Depending on optional parameters, it can
calculate the return value by interpolating or extrapolating table values. If desired, it can
also process tables with missing or invalid values.
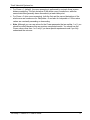
Syntax
TVLOOKUP (Lookup_value, Table_array, Lookup_title, Return_title, Interpolate,
Extrapolate, Power, Missing_pts, Error_msg, Index_mode)
Lookup_value For Interpolate = 0, 1, or 2 it is the numeric or text value to be found in the
lookup column; for Interpolate < 0 or Interpolate > 2 it is a numeric value that is
compared to the values in the lookup column and for which an interpolated value
from the return column is calculated.
Table_array is the lookup table. It is a single area rectangular range of cells that contains
lookup column and return column. The first (topmost) row contains column titles.
Table_array must contain a minimum of 2 rows and 2 columns. It can also be a
reference to a range name.
Lookup_title For Index_mode = FALSE it is the exact value (numeric or text - not case
sensitive) to be found in the first (topmost) row of the lookup table in order to identify
the lookup column. TVLOOKUP searches this column for the specified lookup
value. Any column in the Table_array can be specified as the lookup column.
For Index_mode = TRUE it specifies the lookup column index number (position of
the lookup column in Table_array: 1 for the first column, 2 for the second column,
etc.).
Return_title For Index_mode = FALSE is the exact value (numeric or text - not case
sensitive) to be found in the first (topmost) row of the lookup table in order to identify
the return column. TVLOOKUP returns the value from this column, or uses it to
calculate the interpolated return value. Any column in the Table_array can be
specified as the return column.
For Index_mode = TRUE it specifies the return column index number (position of
the return column in Table_array: 1 for the first column, 2 for the second column,
etc.).
Interpolate Optional, whole number between -20 and 7, default = 0. It is the type of
interpolation to be used in determining the return value. The following types of
interpolation can be used:
0 Exact match only (default);
1 Exact or next lower value;
2 Exact or next higher value;
3 Closest value;
4 Linear interpolation;
5 Double parabolic piecewise curve interpolation;
6 Double hyperbolic piecewise curve interpolation;
TriLookup™ Version 2.21 User’s Guide
34
Trimill Industrial Systems Inc.
7 Cubic spline curve interpolation;
-1 to -20 Polynomial curve interpolation (order n = -Interpolate);
For Interpolate <> 0, the values in the lookup column must be constantly ascending
or descending. For example, the following array of values is invalid: 2, 3, 3, 4.
For Interpolate < 0 or Interpolate > 2, the values in both lookup column and return
column must be numeric.
Extrapolate Optional, any number, default = 0 (no extrapolation). Determines whether to
perform extrapolation and the size of extrapolation interval (how far to extrapolate
past the minimum and maximum values in the lookup column). The following values
can be used:
0 Do not extrapolate;
> 0 Extrapolate, extrapolation interval = Extrapolate
< 0 Extrapolate, extrapolation interval = Extrapolate * (LCmin – LCmax)
(LCmax and LCmin are maximum and minimum values in the lookup column,
respectively).
The size of extrapolation interval also determines how the missing points will be
processed. See Missing_pts and Extrapolate for details.
Extrapolation can only be done on numeric values, and if Interpolate < 0 or
Interpolate > 2.
Power Optional, any number, default = 1. This is the exponent used for averaging in
double parabolic interpolation (Interpolate = 5) and double hyperbolic interpolation
(Interpolate = 6). The weight used for averaging between the left and the right curve
is raised to this power. In a special case for Power = 0 the averaging weight is
calculated using a sine curve.
Missing_pts Optional, TRUE or FALSE, default = FALSE. Determines whether to allow
blank and non-numeric cells in the lookup column and return column. It has no
effect when Interpolate = 0. In that case the table may contain any values.
FALSE blank and non-numeric cells are NOT allowed;
TRUE blank and non-numeric cells are allowed. How the table with missing points
(blank and non-numeric cells) will be processed also depends on the extrapolation
interval.
Error_msg Optional, TRUE or FALSE, default = FALSE. In case of an error, it determines
whether or not to return a detailed text error message indicating the cause of the
error instead of a standard Excel error code (such as #NA or #VALUE!).
FALSE return a standard Excel error code;
TRUE return a detailed text error message.
Index_mode Optional, TRUE or FALSE, default = FALSE. It determines the way
Lookup_title and Return_title are used to select the lookup and return columns.
FALSE select the lookup and return columns by the column titles;
TRUE select the columns by the column index numbers (positions in Table_array).
In this case the column titles in the topmost row of Table_array are ignored.
Note that there is a difference in the lookup table used by TVLOOKUP versus
Excel's built-in VLOOKUP function. Namely, TVLOOKUP requires the table to have
a header row, wheather it's being used (Index_mode=FALSE) or not
(Index_mode=TRUE).
TriLookup™ Version 2.21 User’s Guide
35
Trimill Industrial Systems Inc.
Remarks
• If you do NOT need to extrapolate, or process tables with blank and non-numeric cells,
you can also use the simplified TVLKP function. It uses default values for the following
parameters:
Extrapolate = 0 (no extrapolation);
Power = 1 (linear curve averaging for Interpolate = 5 and Interpolate = 6);
Missing_pts = FALSE (blank and non-numeric cells are NOT allowed).
•
Use THLOOKUP instead of TVLOOKUP when your lookup and return values are
located in table rows.
TriLookup™ Version 2.21 User’s Guide
36
Trimill Industrial Systems Inc.
TVLKP
TVLKP is a simplified version of TVLOOKUP function that uses default parameter values.
It identifies lookup column and return column of a 2D multi column table by searching for
the specified lookup and return titles in the topmost row of the table, or by column index
numbers; then searches for the specified lookup value in the lookup column and returns a
value from the same row of the return column. Depending on an optional parameter, it can
calculate the return value by interpolating table values.
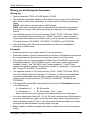
Syntax
TVLKP (Lookup_value, Table_array, Lookup_title, Return_title, Interpolate, Error_msg,
Index_mode)
Lookup_value For Interpolate = 0, 1, or 2 it is the numeric or text value to be found in the
lookup column; for Interpolate < 0 or Interpolate > 2 it is a numeric value that is
compared to the values in the lookup column and for which an interpolated value
from the return column is calculated.
Table_array is the lookup table. It is a single area rectangular range of cells that contains
lookup column and return column. The first (topmost) row contains column titles.
Table_array must contain a minimum of 2 rows and 2 columns. It can also be a
reference to a range name.
Lookup_title For Index_mode = FALSE it is the exact value (numeric or text - not case
sensitive) to be found in the first (topmost) row of the lookup table in order to identify
the lookup column. TVLKP searches this column for the specified lookup value. Any
column in the Table_array can be specified as the lookup column.
For Index_mode = TRUE it specifies the lookup column index number (position of
the lookup column in Table_array: 1 for the first column, 2 for the second column,
etc.).
Return_title For Index_mode = FALSE it is the exact value (numeric or text - not case
sensitive) to be found in the first (topmost) row of the lookup table in order to identify
the return column. TVLKP returns the value from this column, or uses it to calculate
the interpolated return value. Any column in the Table_array can be specified as the
return column.
For Index_mode = TRUE it specifies the return column index number (position of
the return column in Table_array: 1 for the first column, 2 for the second column,
etc.).
Interpolate Optional, whole number between -20 and 7, default = 0. It is the type of
interpolation to be used in determining the return value. The following types of
interpolation can be used:
0 Exact match only (default);
1 Exact or next lower value;
2 Exact or next higher value;
3 Closest value;
4 Linear interpolation;
5 Double parabolic piecewise curve interpolation;
6 Double hyperbolic piecewise curve interpolation;
TriLookup™ Version 2.21 User’s Guide
37
Trimill Industrial Systems Inc.
7 Cubic spline curve interpolation;
-1 to -20 Polynomial curve interpolation (order n = -Interpolate);
For Interpolate <> 0, the values in the lookup column must be constantly ascending
or descending. For example, the following array of values is invalid: 2, 3, 3, 4.
For Interpolate < 0 or Interpolate > 2, the values in both lookup column and return
column must be numeric.
Error_msg Optional, TRUE or FALSE, default = FALSE. In case of an error, it determines
whether or not to return a detailed text error message indicating the cause of the
error instead of a standard Excel error code (such as #NA or #VALUE!).
FALSE return a standard Excel error code;
TRUE return a detailed text error message.
Index_mode Optional, TRUE or FALSE, default = FALSE. It determines the way
Lookup_title and Return_title are used to select the lookup and return columns.
FALSE select the lookup and return columns by the column titles;
TRUE select the columns by the column index numbers (positions in Table_array).
In this case the column titles in the topmost row of Table_array are ignored.
Note that there is a difference in the lookup table used by TVLKP versus Excel's
built-in VLOOKUP function. Namely, TVLKP requires the table to have a header
row, wheather it's being used (Index_mode=FALSE) or not (Index_mode=TRUE).
Remarks
• TVLKP is a simplified version of the TVLOOKUP function. It uses default values for the
following parameters:
Extrapolate = 0 (no extrapolation);
Power = 1 (linear order curve averaging for Interpolate = 5 and Interpolate = 6);
Missing_pts = FALSE (blank and non-numeric cells are NOT allowed).
•
If you need to extrapolate, or process tables with blank and non-numeric cells, you
must use the TVLOOKUP function.
TriLookup™ Version 2.21 User’s Guide
38
Trimill Industrial Systems Inc.
THLOOKUP
Identifies lookup row and return row of a 2D multi row table by searching for the specified
lookup and return titles in the leftmost column of the table, or by row index numbers; then
searches for the specified lookup value in the lookup row and returns a value from the
same column of the return row. Depending on optional parameters, it can calculate the
return value by interpolating or extrapolating table values. If desired, it can also process
tables with missing or invalid values.
Syntax
THLOOKUP (Lookup_value, Table_array, Lookup_title, Return_title, Interpolate,
Extrapolate, Power, Missing_pts, Error_msg, Index_mode)
Lookup_value For Interpolate = 0, 1, or 2 it is the numeric or text value to be found in the
lookup row; for Interpolate < 0 or Interpolate > 2 it is a numeric value that is
compared to the values in the lookup row and for which an interpolated value from
the return row is calculated.
Table_array is the lookup table. It is a single area rectangular range of cells that contains
lookup row and return row. The first (leftmost) column contains row titles.
Table_array must contain a minimum of 2 rows and 2 columns. It can also be a
reference to a range name.
Lookup_title For Index_mode = FALSE it is the exact value (numeric or text - not case
sensitive) to be found in the first (leftmost) column of the lookup table in order to
identify the lookup row. THLOOKUP searches this row for the specified lookup
value. Any row in the Table_array can be specified as the lookup row.
For Index_mode = TRUE it specifies the lookup row index number (position of the
lookup row in Table_array: 1 for the first row, 2 for the second row, etc.).
Return_title For Index_mode = FALSE it is the exact value (numeric or text - not case
sensitive) to be found in the first (leftmost) column of the lookup table in order to
identify the return row. THLOOKUP returns the value from this row, or uses it to
calculate the interpolated return value. Any row in the Table_array can be specified
as the return row.
For Index_mode = TRUE it specifies the return row index number (position of the
return row in Table_array: 1 for the first row, 2 for the second row, etc.).
Interpolate Optional, whole number between -20 and 7, default = 0. It is the type of
interpolation to be used in determining the return value. The following types of
interpolation can be used:
0 Exact match only (default);
1 Exact or next lower value;
2 Exact or next higher value;
3 Closest value;
4 Linear interpolation;
5 Double parabolic piecewise curve interpolation;
6 Double hyperbolic piecewise curve interpolation;
7 Cubic spline curve interpolation;
-1 to -20 Polynomial curve interpolation (order n = -Interpolate).
TriLookup™ Version 2.21 User’s Guide
39
Trimill Industrial Systems Inc.
For Interpolate <> 0, the values in the lookup row must be constantly ascending or
descending. For example, the following array of values is invalid: 2, 3, 3, 4.
For Interpolate < 0 or Interpolate > 2, the values in both lookup row and return row
must be numeric.
Extrapolate Optional, any number, default = 0 (no extrapolation). Determines whether to
perform extrapolation and the size of extrapolation interval (how far to extrapolate
past the minimum and maximum values in the lookup row). The following values
can be used:
0 Do not extrapolate;
> 0 Extrapolate, extrapolation interval = Extrapolate
< 0 Extrapolate, extrapolation interval = Extrapolate * (LRmax – LRmin)
(LRmax and LRmin are maximum and minimum values in the lookup row,
respectively).
The size of extrapolation interval also determines how the missing points will be
processed. See Missing_pts and Extrapolate for details.
Extrapolation can only be done on numeric values, and if Interpolate < 0 or
Interpolate > 2.
Power Optional, any number, default = 1. This is the exponent used for averaging in
double parabolic interpolation (Interpolate = 5) and double hyperbolic interpolation
(Interpolate = 6). The weight used for averaging between the left and the right curve
is raised to this power. In a special case for Power = 0 the averaging weight is
calculated using a sine curve.
Missing_pts Optional, TRUE or FALSE, default = FALSE. Determines whether to allow
blank and non-numeric cells in the lookup row and return row. It has no effect when
Interpolate = 0. In that case the table may contain any values.
FALSE blank and non-numeric cells are NOT allowed;
TRUE blank and non-numeric cells are allowed. How the table with missing points
(blank and non-numeric cells) will be processed also depends on the extrapolation
interval.
Error_msg Optional, TRUE or FALSE, default = FALSE. In case of an error, it determines
whether or not to return a detailed text error message indicating the cause of the
error instead of a standard Excel error code (such as #NA or #VALUE!).
FALSE return a standard Excel error code;
TRUE return a detailed text error message.
Index_mode Optional, TRUE or FALSE, default = FALSE. It determines the way
Lookup_title and Return_title are used to select the lookup and return rows.
FALSE select the lookup and return rows by the row titles;
TRUE select the rows by the row index numbers (positions in Table_array). In this
case the row titles in the leftmost column of Table_array are ignored.
Note that there is a difference in the lookup table used by THLOOKUP versus
Excel's built-in HLOOKUP function. Namely, THLOOKUP requires the table to have
a header column, wheather it's being used (Index_mode=FALSE) or not
(Index_mode=TRUE).
TriLookup™ Version 2.21 User’s Guide
40
Trimill Industrial Systems Inc.
Remarks
• If you do NOT need to extrapolate, or process tables with blank and non-numeric cells,
you can also use the simplified THLKP function. It uses default values for the following
parameters:
Extrapolate = 0 (no extrapolation);
Power = 1 (linear order curve averaging for Interpolate = 5 and Interpolate = 6);
Missing_pts = FALSE (blank and non-numeric cells are NOT allowed).
•
Use TVLOOKUP instead of THLOOKUP when your lookup and return values are
located in table columns.
TriLookup™ Version 2.21 User’s Guide
41
Trimill Industrial Systems Inc.
THLKP
THLKP is a simplified version of THLOOKUP function that uses default parameter values.
It identifies lookup row and return row of a 2D multi row table by searching for the specified
lookup and return titles in the leftmost column of the table, or by row index numbers; then
searches for the specified lookup value in the lookup row and returns a value from the
same column of the return row. Depending on an optional parameter, it can calculate the
return value by interpolating table values.
Syntax
THLKP (Lookup_value, Table_array, Lookup_title, Return_title, Interpolate,
Error_msg, Index_mode)
Lookup_value For Interpolate = 0, 1, or 2 it is the numeric or text value to be found in the
lookup row; for Interpolate < 0 or Interpolate > 2 it is a numeric value that is
compared to the values in the lookup row and for which an interpolated value from
the return row is calculated.
Table_array is the lookup table. It is a single area rectangular range of cells that contains
lookup row and return row. The first (leftmost) column contains row titles.
Table_array must contain a minimum of 2 rows and 2 columns. It can also be a
reference to a range name.
Lookup_title For Index_mode = FALSE it is the exact value (numeric or text - not case
sensitive) to be found in the first (leftmost) column of the lookup table in order to
identify the lookup row. THLKP searches this row for the specified lookup value.
Any row in the Table_array can be specified as the lookup row.
For Index_mode = TRUE it specifies the lookup row index number (position of the
lookup row in Table_array: 1 for the first row, 2 for the second row, etc.).
Return_title For Index_mode = FALSE it is the exact value (numeric or text - not case
sensitive) to be found in the first (leftmost) column of the lookup table in order to
identify the return row. THLKP returns the value from this row, or uses it to calculate
the interpolated return value. Any row in the Table_array can be specified as the
return row.
For Index_mode = TRUE it specifies the return row index number (position of the
return row in Table_array: 1 for the first row, 2 for the second row, etc.).
Interpolate Optional, whole number between -20 and 7, default = 0. It is the type of
interpolation to be used in determining the return value. The following types of
interpolation can be used:
0 Exact match only (default);
1 Exact or next lower value;
2 Exact or next higher value;
3 Closest value;
4 Linear interpolation;
5 Double parabolic piecewise curve interpolation;
6 Double hyperbolic piecewise curve interpolation;
7 Cubic spline curve interpolation;
-1 to -20 Polynomial curve interpolation (order n = -Interpolate).
TriLookup™ Version 2.21 User’s Guide
42
Trimill Industrial Systems Inc.
For Interpolate <> 0, the values in the lookup row must be constantly ascending or
descending. For example, the following array of values is invalid: 2, 3, 3, 4.
For Interpolate < 0 or Interpolate > 2, the values in both lookup row and return row
must be numeric.
Error_msg Optional, TRUE or FALSE, default = FALSE. In case of an error, it determines
whether or not to return a detailed text error message indicating the cause of the
error instead of a standard Excel error code (such as #NA or #VALUE!).
FALSE return a standard Excel error code;
TRUE return a detailed text error message.
Index_mode Optional, TRUE or FALSE, default = FALSE. It determines the way
Lookup_title and Return_title are used to select the lookup and return rows.
FALSE select the lookup and return rows by the row titles;
TRUE select the rows by the row index numbers (positions in Table_array). In this
case the row titles in the leftmost column of Table_array are ignored.
Note that there is a difference in the lookup table used by THLKP versus Excel's
built-in HLOOKUP function. Namely, THLKP requires the table to have a header
column, wheather it's being used (Index_mode=FALSE) or not
(Index_mode=TRUE).
Remarks
• THLKP is a simplified version of the THLOOKUP function. It uses default values for the
following parameters:
Extrapolate = 0 (no extrapolation);
Power = 1 (linear curve averaging for Interpolate = 5 and Interpolate = 6);
Missing_pts = FALSE (blank and non-numeric cells are NOT allowed).
•
If you need to extrapolate, or process tables with blank and non-numeric cells, you
must use the THLOOKUP function.
TriLookup™ Version 2.21 User’s Guide
43
Trimill Industrial Systems Inc.
T2LOOKUP
Searches a 2D (X-Y) lookup table for horizontal (X) values in topmost row and vertical (Y)
values in leftmost column and returns a value V(x,y) from the intersecting row and column.
Depending on optional parameters, it can also interpolate and extrapolate table values in
both horizontal (X) and/or vertical (Y) directions. If desired, it can also process tables with
missing or invalid values.
Syntax
T2LOOKUP (X_value, Y_value, Table_XY, X_interpolate, Y_interpolate, X_extrapolate,
Y_extrapolate, X_power, Y_power, Do_Y_1st, Missing_pts, Error_msg)
X_value is X-axis lookup value. For X_interpolate = 0, 1, or 2 it is the numeric or text
value to be found in the X-axis (topmost row of Table_XY). For X_interpolate < 0 or
X_interpolate > 2 it is a numeric value to be found in the X-axis. If no exact match is
found, T2LOOKUP performs interpolation (or optional extrapolation) in the
horizontal (X) direction.
Y_value is Y-axis lookup value. For Y_interpolate = 0, 1, or 2 it is the numeric or text
value to be found in the Y-axis (leftmost column of Table_XY). For Y_interpolate < 0
or Y_interpolate > 2 it is a numeric value to be found in the Y-axis. If no exact match
is found, T2LOOKUP performs interpolation (or optional extrapolation) in the vertical
(Y) direction.
Table_XY is the lookup table. It is a single area 2D rectangular range of cells that
contains X-axis in the topmost row and Y-axis in the leftmost column, with the topleft cell being ignored. The remainder of Table_XY contains data area with return
values for each X-Y point. Table_XY must have a minimum of 2 rows and 2
columns. It can also be a reference to a range name.
X_interpolate and Y_interpolate Optional, whole number between -20 and 7, default = 0.
The types of interpolation to be used in the horizontal (X) and vertical (Y) directions
respectively, when determining the return value. Any of the following types of
interpolation can be used independently for each axis:
0 Exact match only (default);
1 Exact or next lower value;
2 Exact or next higher value;
3 Closest value;
4 Linear interpolation;
5 Double parabolic piecewise curve interpolation;
6 Double hyperbolic piecewise curve interpolation;
7 Cubic spline curve interpolation;
-1 to -20 Polynomial curve interpolation (order n = -Interpolate).
For X/Y_interpolate <> 0, the values in the corresponding axis must be constantly
ascending or descending. For example, the following array of values is invalid: 2, 3,
3, 4.
For X/Y_interpolate < 0 or X/Y_interpolate > 2, the corresponding axis and all
return values must be numeric.
X_extrapolate and Y_extrapolate Optional, any number, default = 0 (no extrapolation).
Determines whether to perform extrapolation in the horizontal (X) and vertical (Y)
TriLookup™ Version 2.21 User’s Guide
44
Trimill Industrial Systems Inc.
directions respectively, and the sizes of extrapolation intervals (how far to
extrapolate past the minimum and maximum values in X-axis and Y-axis). The
following values can be used:
0 Do not extrapolate;
> 0 Extrapolate along X/Y axis, X/Y extrapolation interval = X/Y_extrapolate
< 0 Extrapolate along X/Y axis, X/Y extrapolation interval = X/Y_extrapolate *
(Amax – Amin)
(Amax and Amin are maximum and minimum values in the corresponding axis).
The sizes of extrapolation intervals also determine how the missing points will be
processed. See Missing_pts and Extrapolate for details.
Extrapolation can only be done on numeric values, for X/Y_interpolate < 0 or
X/Y_interpolate > 2.
X_power and Y_power Optional, any number, default = 1. These are the exponents used
for averaging in double parabolic interpolation (Interpolate = 5) and double
hyperbolic interpolation (Interpolate = 6) in the horizontal (X) and vertical (Y)
directions, respectively. The weight used for averaging between the left and the
right curve is raised to this power. In a special case for Power = 0 the averaging
weight is calculated using a sine curve.
Do_Y_1st Optional, TRUE or FALSE, default = FALSE. Determines the order in which
interpolations along X-axis and Y-axis are performed, when both are required.
FALSE first perform interpolation along X-axis for the given X_value within each
row of the table. Then perform interpolation along Y-axis for the given Y_value
using the interpolated values obtained for each row.
TRUE first perform interpolation along Y-axis for the given Y_value within each
column of the table. Then perform interpolation along X-axis for the given X_value
using the interpolated values obtained for each column.
If the 3D surface described by the X-Y lookup table is reasonably smooth and there
are few missing points, then the values returned by T2LOOKUP will not change
significantly when you alter the order of interpolation.
Missing_pts Optional, TRUE or FALSE, default = FALSE. Determines whether to allow
blank and non-numeric cells in Table_XY. It has no effect when both X_interpolate
= 0 and Y_interpolate = 0. In that case the table may contain any values.
FALSE blank and non-numeric cells are NOT allowed;
TRUE blank and non-numeric cells are allowed. How the table with missing points
(blank and non-numeric cells) will be processed also depends on the X and Y
extrapolation intervals.
Error_msg Optional, TRUE or FALSE, default = FALSE. In case of an error, it determines
whether or not to return a detailed text error message indicating the cause of the
error instead of a standard Excel error code (such as #NA or #VALUE!).
FALSE return a standard Excel error code;
TRUE return a detailed text error message.
Remarks
• If you do NOT need to extrapolate, or process tables with blank and non-numeric cells,
or use different types of interpolation along X and Y axes, you can also use the
simplified T2LKP function. It uses the same value of the Interpolate parameter for both
TriLookup™ Version 2.21 User’s Guide
45
Trimill Industrial Systems Inc.
X and Y axes. It also uses default values for the following parameters:
X/Y_extrapolate = 0 (no extrapolation);
X/Y_power = 1 (linear curve averaging for Interpolate = 5 and Interpolate = 6);
Do_Y_1st = FALSE (First interpolate along X-axis, for X_value, then along Y-axis);
Missing_pts = FALSE (blank and non-numeric cells are NOT allowed).
TriLookup™ Version 2.21 User’s Guide
46
Trimill Industrial Systems Inc.
T2LKP
T2LKP is a simplified version of T2LOOKUP that uses default parameter values. It
searches a 2D (X-Y) lookup table for horizontal (X) values in topmost row and vertical (Y)
values in leftmost column and returns a value V(x,y) from the intersecting row and column.
Depending on an optional parameter, it can interpolate table values in both horizontal (X)
and vertical (Y) directions.
Syntax
T2LKP (X_value, Y_value, Table_XY, Interpolate, Error_msg)
X_value is X-axis lookup value. For Interpolate = 0, 1, or 2 it is the numeric or text value
to be found in the X-axis (topmost row of Table_XY). For Interpolate < 0 or
Interpolate > 2 it is a numeric value to be found in the X-axis. If no exact match is
found, T2LKP performs interpolation in the horizontal (X) direction.
Y_value is Y-axis lookup value. For Interpolate = 0, 1, or 2 it is the numeric or text value
to be found in the Y-axis (leftmost column of Table_XY). For Interpolate < 0 or
Interpolate > 2 it is a numeric value to be found in the Y-axis. If no exact match is
found, T2LKP performs interpolation in the vertical (Y) direction.
Table_XY is the lookup table. It is a single area 2D rectangular range of cells that
contains X-axis in the topmost row and Y-axis in the leftmost column, with the topleft cell being ignored. The remainder of Table_XY contains data area with return
values for each X-Y point. Table_XY must have a minimum of 2 rows and 2
columns. It can also be a reference to a range name.
Interpolate Optional, whole number between -20 and 7, default = 0. The type of
interpolation to be used in both horizontal (X) and vertical (Y) directions when
determining the return value. Any of the following types of interpolation can be used:
0 Exact match only (default);
1 Exact or next lower value;
2 Exact or next higher value;
3 Closest value;
4 Linear interpolation;
5 Double parabolic piecewise curve interpolation;
6 Double hyperbolic piecewise curve interpolation;
7 Cubic spline curve interpolation;
-1 to -20 Polynomial curve interpolation (order n = -Interpolate).
For Interpolate <> 0, the values in both axes must be constantly ascending or
descending. For example, the following array of values is invalid: 2, 3, 3, 4.
For Interpolate < 0 or Interpolate > 2, the values in the whole 2D lookup table must
be numeric.
Error_msg Optional, TRUE or FALSE, default = FALSE. In case of an error, it determines
whether or not to return a detailed text error message indicating the cause of the
error instead of a standard Excel error code (such as #NA or #VALUE!).
FALSE return a standard Excel error code;
TRUE return a detailed text error message.
Remarks
TriLookup™ Version 2.21 User’s Guide
47
Trimill Industrial Systems Inc.
•
T2LKP is a simplified version of the T2LOOKUP function. It uses the same value of the
Interpolate parameter for both X and Y axes. It also uses default values for the
following parameters:
X/Y_extrapolate = 0 (no extrapolation);
X/Y_power = 1 (linear curve averaging for Interpolate = 5 and Interpolate = 6);
Do_Y_1st = FALSE (First interpolate along X-axis, for X_value, then along Y-axis);
Missing_pts = FALSE (blank and non-numeric cells are NOT allowed).
•
If you need to extrapolate, or process tables with blank and non-numeric cells, or use
different types of interpolation along X and Y axes, you must use the T2LOOKUP
function.
TriLookup™ Version 2.21 User’s Guide
48
Trimill Industrial Systems Inc.
T3LOOKUP
Searches a 3D (X-Y-Z) lookup table for horizontal (X) values in topmost row, vertical (Y)
values in leftmost column and table (Z) values in the top left corners of each 2D table that
is a part of the 3D lookup table. Returns a value V(x,y,z) from the intersecting row, column
and table. Depending on optional parameters, it can interpolate and extrapolate return
values in X, Y and Z directions. If desired, it can also process 3D tables with missing or
invalid values.
Syntax
T3LOOKUP (X_value, Y_value, Z_value, Table_XYZ, Table_Ygap, Table_Ysize,
X_interpolate, Y_interpolate, Z_interpolate, X_extrapolate, Y_extrapolate,
Z_extrapolate, X_power, Y_power, Z_power, Do_Y_1st, Missing_pts, Error_msg)
X_value is X-axis lookup value. For X_interpolate = 0, 1, or 2 it is the numeric or text
value to be found in the X-axis (topmost row of the first 2D table of Table_XYZ). For
X_interpolate < 0 or X_interpolate > 2 it is a numeric value to be found in the Xaxis. If no exact match is found, T3LOOKUP performs interpolation (or optional
extrapolation) in the horizontal (X) direction.
Y_value is Y-axis lookup value. For Y_interpolate = 0, 1, or 2 it is the numeric or text
value to be found in the Y-axis (leftmost column of the first 2D table of Table_XYZ).
For Y_interpolate < 0 or Y_interpolate > 2 it is a numeric value to be found in the Yaxis. If no exact match is found, T3LOOKUP performs interpolation (or optional
extrapolation) in the vertical (Y) direction.
Z_value is Z-axis lookup value. For Z_interpolate = 0, 1, or 2 it is the numeric or text
value to be found in the Z-axis (top left corner cells of each 2D table that is a part of
the 3D table Table_XYZ). For Z_interpolate < 0 or Z_interpolate > 2 it is a numeric
value to be found in the Z-axis. If no exact match is found, T3LOOKUP performs
interpolation (or optional extrapolation) in the Z direction (between individual 2D
tables that are part of Table_XYZ).
Table_XYZ is the lookup table. It is a 3D table that contains multiple 2D tables, where
each 2D table is a rectangular range of cells and where each 2D table corresponds
to a different Z-axis value. All component 2D tables must be the same size in
horizontal (X) and vertical (Y) direction as the first 2D table. There are two different
ways of specifying the 3D lookup table:
•
As a Single Area Table – All component 2D tables are contained in a single
rectangular range of cells, with the first 2D table on top and the subsequent ones
below it. In order for the T3LOOKUP function to be able to differentiate between
individual 2D tables, you must specify the values for Table_Ygap, Table_Ysize
(see below).
•
As a Multi Area Table – Each component 2D table is specified as a separate
area in a multiple area range of cells, with the first 2D table specified as the first
area of the range, and the subsequent ones listed after it. If Table_XYZ refers to
a multiple area range, only the top-left cells need to be specified for the
subsequent 2D tables.
If you use a multiple area table, T3LOOKUP will ignore the values for
TriLookup™ Version 2.21 User’s Guide
49
Trimill Industrial Systems Inc.
Table_Ygap, Table_Ysize.
Note that all component 2D tables must be located on a same worksheet.
The first 2D table contains X-axis in its topmost row and Y-axis in its leftmost
column. In the remaining 2D tables the topmost rows and the leftmost columns are
ignored. The Z-axis cells are located in the top left corner cells of each component
2D table. The remainder of the 2D tables (excluding topmost rows and leftmost
columns) contain data areas with return values for each X-Y-Z point.
The component 2D tables in Table_XYZ must contain a minimum of 2 rows and 2
columns. The number of 2D tables in Table_XYZ must be between 1 and 255.
Table_XYZ can also be a reference to a range name.
Table_Ygap Optional, whole number between 0 and 255, default = 0. It is only used
when Table_XYZ refers to a single area table, to determine the number of rows
separating component 2D tables. For example, if Table_Ygap = 2, then two rows
above each component 2D table (including the first 2D table) are ignored. The value
of this parameter is ignored if Table_XYZ refers to a Multi Area Table.
Table_Ysize Optional, whole number between 2 and 32767. It is used only when
Table_XYZ refers to a single area table, to determine the number of rows in each
component 2D table, excluding the separator rows. If omitted, it is assumed to be
equal to the total number of rows in Table_XYZ minus the value for Table_Ygap
(i.e. it is assumed that Table_XYZ contains only one 2D table). The value of this
parameter is ignored if Table_XYZ refers to a Multi Area Table.
X_interpolate, Y_interpolate and Z_interpolate Optional, whole number between -20 and
7, default = 0. The types of interpolation to be used in the horizontal (X) and vertical
(Y) directions and between component 2D tables (Z direction), respectively, when
determining the return value. Any of the following types of interpolation can be used
independently for each axis:
0 Exact match only (default);
1 Exact or next lower value;
2 Exact or next higher value;
3 Closest value;
4 Linear interpolation;
5 Double parabolic piecewise curve interpolation;
6 Double hyperbolic piecewise curve interpolation;
7 Cubic spline curve interpolation;
-1 to -20 Polynomial curve interpolation (order n = -Interpolate).
For X/Y/Z_interpolate <> 0, the values in the corresponding axis must be constantly
ascending or descending. For example, the following array of values is invalid: 2, 3,
3, 4.
For X/Y/Z_interpolate < 0 or X/Y/Z_interpolate > 2, the corresponding axis and all
return values must be numeric.
X_extrapolate, Y_extrapolate and Z_extrapolate Optional, any number, default = 0 (no
extrapolation). Determines whether to perform extrapolation in the horizontal (X)
and vertical (Y) directions and between component 2D tables (Z direction),
respectively, and the sizes of extrapolation intervals (how far to extrapolate past the
minimum and maximum values in X-axis, Y-axis and Z-axis).
0 Do not extrapolate;
TriLookup™ Version 2.21 User’s Guide
50
Trimill Industrial Systems Inc.
> 0 Extrapolate, extrapolation interval = Extrapolate
< 0 Extrapolate, extrapolation interval = Extrapolate * (Amax – Amin)
(Amax and Amin are maximum and minimum values in the corresponding axis).
The sizes of extrapolation intervals also determine how the missing points will be
processed. See Missing_pts and Extrapolate for details.
Extrapolation can only be done on numeric values, for X/Y_interpolate < 0 or
X/Y_interpolate > 2.
X_power, Y_power and Z_power Optional, any number, default = 1. These are the
exponents used for averaging in double parabolic interpolation (Interpolate = 5) and
double hyperbolic interpolation (Interpolate = 6) in the horizontal (X) and vertical (Y)
directions and between 2D tables (Z direction), respectively. The weight used for
averaging between the left and the right curve is raised to this power. In a special
case for Power = 0 the averaging weight is calculated using a sine curve.
Do_Y_1st Optional, TRUE or FALSE, default = FALSE. Determines the order in which
interpolations for X_value and Y_value are performed, when both are required. Note
that the interpolation along Z-axis (between the 2D component tables), if required, is
always performed last.
FALSE first perform interpolation along X-axis for the given X_value within each
row of each 2D component table. Then perform interpolation along Y-axis for the
given Y_value using the interpolated values obtained for each row in each 2D table.
TRUE first perform interpolation along Y-axis for the given Y_value within each
column of each 2D component table. Then perform interpolation along X-axis for the
given X_value using the interpolated values obtained for each column in each 2D
table.
If the 3D surfaces described by the component 2D tables are reasonably smooth
and with few missing points, then the values returned by T3LOOKUP will not
change significantly when you alter the order of X and Y interpolation.
Missing_pts Optional, TRUE or FALSE, default = FALSE. Determines whether to allow
blank and non-numeric cells in Table_XYZ. It has no effect when X_interpolate,
Y_interpolate and Z_interpolate all equal 0. In that case the table may contain any
values.
FALSE blank and non-numeric cells are NOT allowed;
TRUE blank and non-numeric cells are allowed. How the table with missing points
(blank and non-numeric cells) will be processed also depends on the X, Y and Z
extrapolation intervals.
Error_msg Optional, TRUE or FALSE, default = FALSE. In case of an error, it determines
whether or not to return a detailed text error message indicating the cause of the
error instead of a standard Excel error code (such as #NA or #VALUE!).
FALSE return a standard Excel error code;
TRUE return a detailed text error message.
Remarks
• If you do NOT need to extrapolate, or process tables with blank and non-numeric cells,
or use different types of interpolation along X, Y and Z axes, you can also use the
simplified T3LKP function. It uses the same value of the Interpolate parameter for all
three axes and can only process Multi Area Tables. It also uses default values for the
TriLookup™ Version 2.21 User’s Guide
51
Trimill Industrial Systems Inc.
following parameters:
Table_Ygap and Table_Ysize (not used for a multi area 3D table);
X/Y/Z_extrapolate = 0 (no extrapolation);
X/Y/Z_power = 1 (linear curve averaging for Interpolate = 5 and Interpolate = 6);
Do_Y_1st = FALSE (first interpolate along X-axis, then along Y-axis and finally along Zaxis);
Missing_pts = FALSE (blank and non-numeric cells are NOT allowed).
TriLookup™ Version 2.21 User’s Guide
52
Trimill Industrial Systems Inc.
T3LKP
T3LKP is a simplified version of T3LOOKUP that uses default parameter values. It
searches a 3D (X-Y-Z) lookup table for horizontal (X) values in topmost row, vertical (Y)
values in leftmost column and table (Z) values in the top left corners of each 2D table that
is a part of the 3D lookup table. Returns a value V(x,y,z) from the intersecting row, column
and table. Depending on an optional parameter, it can interpolate return values in X, Y and
Z directions.
Syntax
T3LKP (X_value, Y_value, Z_value, Table_XYZ, Interpolate, Error_msg)
X_value is X-axis lookup value. For Interpolate = 0, 1, or 2 it is the numeric or text value
to be found in the X-axis (topmost row of the first 2D table of Table_XYZ). For
Interpolate < 0 or X_interpolate > 2 it is a numeric value to be found in the X-axis. If
no exact match is found, T3LKP performs interpolation in the horizontal (X)
direction.
Y_value is Y-axis lookup value. For Interpolate = 0, 1, or 2 it is the numeric or text value
to be found in the Y-axis (leftmost column of the first 2D table of Table_XYZ). For
Interpolate < 0 or Interpolate > 2 it is a numeric value to be found in the Y-axis. If
no exact match is found, T3LKP performs interpolation in the vertical (Y) direction.
Z_value is Z-axis lookup value. For Interpolate = 0, 1, or 2 it is the numeric or text value
to be found in the Z-axis (top left corner cells of each 2D table that is a part of the
3D table Table_XYZ). For Interpolate < 0 or Interpolate > 2 it is a numeric value to
be found in the Z-axis. If no exact match is found, T3LKP performs interpolation in
the Z direction (between individual 2D tables that are part of Table_XYZ).
Table_XYZ is the lookup table. It is a 3D table that contains multiple 2D tables, where
each 2D table is a rectangular ranges of cells and where each 2D table corresponds
to a different Z-axis value. All component 2D tables must be the same size in
horizontal (X) and vertical (Y) direction as the first 2D table.
T3LKP can only use Multi Area Tables, where each component 2D table is
specified as a separate area in a multiple area range of cells. The first 2D table is
specified as the first area of the range and the subsequent ones are listed after it.
Note that only the top-left cells need to be specified for the subsequent 2D tables.
Note that all component 2D tables must be located on a same worksheet.
The first 2D table contains X-axis in its topmost row and Y-axis in its leftmost
column. In the remaining 2D tables the topmost rows and the leftmost columns are
ignored. The Z-axis cells are located in the top left corner cells of each component
2D table. The remainder of the 2D tables (excluding topmost rows and leftmost
columns) contain data areas with return values for each X-Y-Z point.
The component 2D tables in Table_XYZ must contain a minimum of 2 rows and 2
columns. The number of 2D tables in Table_XYZ must be between 1 and 255.
Table_XYZ can also be a reference to a range name.
Interpolate Optional, whole number between -20 and 7, default = 0. The type of
interpolation to be used in all three directions (X, Y and Z) when determining the
return value. Any of the following types of interpolation can be used:
TriLookup™ Version 2.21 User’s Guide
53
Trimill Industrial Systems Inc.
0 Exact match only (default);
1 Exact or next lower value;
2 Exact or next higher value;
3 Closest value;
4 Linear interpolation;
5 Double parabolic piecewise curve interpolation;
6 Double hyperbolic piecewise curve interpolation;
7 Cubic spline curve interpolation;
-1 to -20 Polynomial curve interpolation (order n = -Interpolate).
For Interpolate <> 0, the values in all axes must be constantly ascending or
descending. For example, the following array of values is invalid: 2, 3, 3, 4.
For Interpolate < 0 or Interpolate > 2, the values in the whole 3D lookup table must
be numeric.
Error_msg Optional, TRUE or FALSE, default = FALSE. In case of an error, it determines
whether or not to return a detailed text error message indicating the cause of the
error instead of a standard Excel error code (such as #NA or #VALUE!).
FALSE return a standard Excel error code;
TRUE return a detailed text error message.
Remarks
• T3LKP is a simplified version of the T3LOOKUP function. It uses the same value of the
Interpolate parameter for all three axes and can only process Multi Area Tables. It
also uses default values for the following parameters:
Table_Ygap and Table_Ysize (not used for a multi area 3D table);
X/Y/Z_extrapolate = 0 (no extrapolation);
X/Y/Z_power = 1 (linear curve averaging for Interpolate = 5 and Interpolate = 6);
Do_Y_1st = FALSE (first interpolate along X-axis, then along Y-axis and finally along Zaxis);
Missing_pts = FALSE (blank and non-numeric cells are NOT allowed).
•
If you need to extrapolate, or process tables with blank and non-numeric cells, or use
different types of interpolation along X, Y and Z axes, or wish to specify a Single Area
3D Table, you must use the T3LOOKUP function.
TriLookup™ Version 2.21 User’s Guide
54
Trimill Industrial Systems Inc.
TVPOLYDATA
Identifies lookup (X) and return (Y) columns of a 2D multi column table by searching for the
specified lookup and return titles in the topmost row of the table, or by column index
numbers; then calculates polynomial curve coefficients up to a specified order (maximum
order = 20). The polynomial curves are fitted using the least squares method through the
X-Y data points given in the lookup column and return column of the table. You can assign
any column of the table as the lookup (X) column and return (Y) column by simply
specifying the column titles. The function also determines the best fit curve (the one with
the maximum value of R²).
Syntax
TVPOLYDATA (Table_array, Lookup_title, Return_title, Max_order, Smooth_R2,
Normalized, Missing_pts, Error_msg, Index_mode)
Table_array is the lookup table. It is a single area rectangular range of cells that contains
lookup (X) and return (Y) columns. The first (topmost) row contains column titles.
Table_array must contain a minimum of 2 rows and 2 columns. It can also be a
reference to a range name.
Lookup_title For Index_mode = FALSE it is the exact value (numeric or text - not case
sensitive) to be found in the first (topmost) row of the table in order to identify the
lookup column. TVPOLYDATA uses the values in this column as the X
(independent variable) coordinates of the set of points through which to fit the
polynomial curves. Any column in the Table_array can be specified as the lookup
column.
For Index_mode = TRUE it specifies the lookup column index number (position of
the lookup column in Table_array: 1 for the first column, 2 for the second column,
etc.).
Return_title For Index_mode = FALSE it is the exact value (numeric or text - not case
sensitive) to be found in the first (topmost) row of the table in order to identify the
return column. TVPOLYDATA uses the values in this column as the Y (dependant
variable) coordinates of the set of points through which to fit the polynomial curves.
Any column in the Table_array can be specified as the return column.
For Index_mode = TRUE it specifies the return column index number (position of
the return column in Table_array: 1 for the first column, 2 for the second column,
etc.).
Max_order is the maximum order n for which the polynomial curves should be
calculated. The valid values are 1 to 20. TVPOLYDATA calculates the coefficients
for every polynomial curve with the order between 1 and the maximum order. In
case the maximum order n equals or exceeds the number of valid X-Y points in the
lookup table (p), TVPOLYDATA automatically reduces it to one less than the
number of points (n = p - 1).
Smooth_R2 Optional, TRUE or FALSE, default = FALSE. When set to TRUE,
TVPOLYDATA uses additional in-between points when calculating the R-squared
value (R²) and the sum of error squares (residuals) of the polynomial curve
(Sum(E²)). The Smooth_R2 parameter also affects which curve will be picked as the
best fit curve – the one with the highest R² and lowest Sum(E²).
TriLookup™ Version 2.21 User’s Guide
55
Trimill Industrial Systems Inc.
Normalized Optional, TRUE or FALSE, default = FALSE. When set to TRUE,
TVPOLYDATA first performs a linear transformation (mapping) of the original
lookup (X) values into X’ values which lie in the -1 to +1 range. This can help reduce
the calculation errors (caused by the limits in precision of the 32 bit floating point
computations) in some cases where the polynomial order n is high (for example n >
15). When using the polynomial coefficients returned by TVPOLYDATA with
Normalized = TRUE, you must first transform the X values into X’ using the Ax and
Bx coefficients (also returned by TVPOLYDATA) in the following way: X’ = Ax•X +
Bx.
Missing_pts Optional, TRUE or FALSE, default = FALSE. Determines whether to allow
blank and non-numeric cells in the lookup column and return column.
FALSE blank and non-numeric cells are NOT allowed;
TRUE blank and non-numeric cells are ignored.
Error_msg Optional, TRUE or FALSE, default = FALSE. In case of an error, it determines
whether or not to return a detailed text error message indicating the cause of the
error instead of a standard Excel error code (such as #NA or #VALUE!).
FALSE return a standard Excel error code;
TRUE return a detailed text error message.
Index_mode Optional, TRUE or FALSE, default = FALSE. It determines the way
Lookup_title and Return_title are used to select the lookup and return columns.
FALSE select the lookup and return columns by the column titles;
TRUE select the columns by the column index numbers (positions in Table_array).
In this case the column titles in the topmost row of Table_array are ignored.
Note that there is a difference in the lookup table used by TVPOLYDATA versus
Excel's built-in VLOOKUP function. Namely, TVPOLYDATA requires the table to
have a header row, wheather it's being used (Index_mode=FALSE) or not
(Index_mode=TRUE).
Remarks
• TVPOLYDATA returns an array of up to 22 rows by 26 columns. The size depends on
the maximum polynomial order used: the number of rows equals Max_order + 2 and
the number of columns equals Max_order + 6. Although you do not have use an array
formula, it greatly speeds up the calculation.
•
In order for the TVPOLYDATA function to return the full table, you must enter it in a
range of cells as an Array Formula. The simplest way to do that is by following these
steps (for more information on array formulas see Excel’s Array Formulas help topic):
1. Eter the formula in the top left cell of the range in which you want to return the
TVPOLYDATA table.
2. Select the rectangular range of cells.
3. Press <F2> to edit the top left cell.
4. Press <Ctrl><Shift><Enter> to turn the formula into the array formula.
•
In order to help interpret the values returned by the array formula, the topmost row of
the array returned by TVPOLYDATA contains column titles as follows:
Order is the order of the polynomial curve.
TriLookup™ Version 2.21 User’s Guide
56
Trimill Industrial Systems Inc.
R² is the R-squared value. It is an indication of how close the polynomial curve fits the
data points. Its value can be between 0 and 1, with R² = 1 indicating the perfect
fit. TVPOLYDATA calculates R² from the following formula:
where are given values and
number of points.
are values on the polynomial curve, and p is the
Note that R² returned by TVPOLYDATA is the same R-squared value as the one
displayed by Excel for polynomial trendlines and the one returned by Excel’s
RSQ function.
If you specify Smooth_R2 = TRUE, then R² is calculated for the extra in-between
points, in addition to the points given in the table. For more details see
Smooth_R2.
Sum(E²) is the sum of error squares (residuals) of a polynomial curve. It is another
indication of how close the polynomial curve fits the data points. It is calculated
from the following formula:
Lower values of Sum(E²) indicate a better fit. In case of a perfect fit Sum(E²) = 0,
which corresponds to R² = 1. If you specify Smooth_R2 = TRUE, then Sum(E²)
is calculated for the extra in-between points, in addition to the points given in the
table. For more details see Smooth_R2.
Ax, Bx are the coefficients used to normalize (transform) the table X values into X’
values which lie in the -1 to +1 range (X’ = Ax•X + Bx) when Normalized = TRUE
option is used. If the default Normalized = FALSE is used, then the “Ax” and “Bx”
columns are replaced by “TPOLY(...)” and “Formula” (see below).
TPOLY(...) is a ready-made formula string that uses the TPOLY function to calculate
the value of the polynomial curve, for example, “TPOLY(X,4,{-3.12,-1.97,0.172,4.86E-03,4.41E-05})” is a TPOLY formula string for a 4th order polynomial. In
order to use the formula, you must first Copy the value of the TPOLY(...) cell into
the clipboard and then use Paste Special | Values to paste it into another cell.
After that, you should add the “=” sign to the beginning of the formula and
replace all “X” characters with valid references to the X value. Note that
TPOLY(...) is returned only for Normalized = FALSE, otherwise the column is
used to return the Ax value (see above).
Due to Excel’s limitation on the length of strings that can be returned as a part of
an array formula, if the length of the formula string exceeds 255 characters,
TVPOLYDATA will return #N/A instead. For this reason, the maximum order for
which the TPOLY formula string is returned is n = 11.
Formula is a ready-made inline formula string that can be used to calculate the value
of the polynomial curve, for example, “-15.97+1.109*X-2.091E-02*X^2+1.32104*X^3” is an inline formula string for a 3rd order polynomial. In order to use the
TriLookup™ Version 2.21 User’s Guide
57
Trimill Industrial Systems Inc.
formula, you must first Copy the value of the Formula cell into the clipboard and
then use Paste Special | Values to paste it into another cell. After that, you
should add the “=” sign to the beginning of the formula and replace all “X”
characters with valid references to the X value. Note that Formula is returned
only for Normalized = FALSE, otherwise the column is used to return the Bx
value (see above).
Due to Excel’s limitation on the length of strings that can be returned as a part of
an array formula, if the length of the formula string exceeds 255 characters,
TVPOLYDATA will return #N/A instead. For this reason, the maximum order for
which the inline formula string is returned is n = 10.
c0, c1, c2, c3...c20 are the polynomial curve coefficients returned by TVPOLYDATA.
The polynomial curve is defined as Y = c0 + c1•X + c2•X² + c3•X³ + .... + cn•X ;
where n is the polynomial order. If the order n is less than 20, all coefficients for
exponents higher than n are returned as zeros.
•
The second row of the array returned by TVPOLYDATA (the first one below the title
row) contains data for the polynomial curve with the highest R² (the best fit curve).
That way, if is easy to reference the coefficients of the best fit curve without a need to
search for the curve with the highest R² value.
•
TVPOLYDATA picks the best fit curve among the polynomial curves with order
between 1 and n (the maximum order). Therefore, the order of the best fit curve is
always equal to or less than the Max_order parameter. You must be careful to specify a
high enough value for Max_order in order to determine the true best fit curve.
•
Use THPOLYDATA instead of TVPOLYDATA when your lookup (X) and return (Y)
values are located in table rows.
TriLookup™ Version 2.21 User’s Guide
58
Trimill Industrial Systems Inc.
THPOLYDATA
Identifies lookup (X) and return (Y) rows of a 2D multi row table by searching for the
specified lookup and return titles in the leftmost column of the table, or by row index
numbers; then calculates polynomial curve coefficients up to a specified order (maximum
order = 20). The polynomial curves are fitted using the least squares method through the
X-Y data points given in the lookup row and return row of the table. You can assign any
row of the table as the lookup (X) row and return (Y) row by simply specifying the row
titles. The function also determines the best fit curve (the one with the maximum value of
R²).
Syntax
THPOLYDATA (Table_array, Lookup_title, Return_title, Max_order, Smooth_R2,
Normalized, Missing_pts, Error_msg, Index_mode)
Table_array is the lookup table. It is a single area rectangular range of cells that contains
lookup (X) and return (Y) rows. The first (leftmost) column contains row titles.
Table_array must contain a minimum of 2 rows and 2 columns. It can also be a
reference to a range name.
Lookup_title For Index_mode = FALSE it is the exact value (numeric or text - not case
sensitive) to be found in the first (leftmost) column of the table in order to identify the
lookup row. THPOLYDATA uses the values in this row as the X (independent
variable) coordinates of the set of points through which to fit the polynomial curves.
Any row in the Table_array can be specified as the lookup row.
For Index_mode = TRUE it specifies the lookup row index number (position of the
lookup row in Table_array: 1 for the first row, 2 for the second row, etc.).
Return_title For Index_mode = FALSE it is the exact value (numeric or text - not case
sensitive) to be found in the first (leftmost) column of the table in order to identify the
return row. THPOLYDATA uses the values in this row as the Y (dependant variable)
coordinates of the set of points through which to fit the polynomial curves. Any row
in the Table_array can be specified as the return row.
For Index_mode = TRUE it specifies the return row index number (position of the
return row in Table_array: 1 for the first row, 2 for the second row, etc.).
Max_order is the maximum order n for which the polynomial curves should be
calculated. The valid values are 1 to 20. THPOLYDATA calculates the coefficients
for every polynomial curve with the order between 1 and the maximum order. In
case the maximum order n equals or exceeds the number of valid X-Y points in the
lookup table (p), THPOLYDATA automatically reduces it to one less than the
number of points (n = p - 1).
Smooth_R2 Optional, TRUE or FALSE, default = FALSE. When set to TRUE,
THPOLYDATA uses additional in-between points when calculating the R-squared
value (R²) and the sum of error squares (residuals) of the polynomial curve
(Sum(E²)). The Smooth_R2 parameter also affects which curve will be picked as the
best fit curve – the one with the highest R² and lowest Sum(E²).
Normalized Optional, TRUE or FALSE, default = FALSE. When set to TRUE,
THPOLYDATA first performs a linear transformation (mapping) of the original
TriLookup™ Version 2.21 User’s Guide
59
Trimill Industrial Systems Inc.
lookup (X) values into X’ values which lie in the -1 to +1 range. This can help reduce
the calculation errors (caused by the limits in precision of the 32 bit floating point
computations) in some cases where the polynomial order n is high (for example n >
15). When using the polynomial coefficients returned by THPOLYDATA with
Normalized = TRUE, you must first transform the X values into X’ using the Ax and
Bx coefficients (also returned by THPOLYDATA) in the following way: X’ = Ax•X +
Bx.
Missing_pts Optional, TRUE or FALSE, default = FALSE. Determines whether to allow
blank and non-numeric cells in the lookup row and return row.
FALSE blank and non-numeric cells are NOT allowed;
TRUE blank and non-numeric cells are ignored.
Error_msg Optional, TRUE or FALSE, default = FALSE. In case of an error, it determines
whether or not to return a detailed text error message indicating the cause of the
error instead of a standard Excel error code (such as #NA or #VALUE!).
FALSE return a standard Excel error code;
TRUE return a detailed text error message.
Index_mode Optional, TRUE or FALSE, default = FALSE. It determines the way
Lookup_title and Return_title are used to select the lookup and return rows.
FALSE select the lookup and return rows by the row titles;
TRUE select the rows by the row index numbers (positions in Table_array). In this
case the row titles in the leftmost column of Table_array are ignored.
Note that there is a difference in the lookup table used by THPOLYDATA versus
Excel's built-in HLOOKUP function. Namely, THPOLYDATA requires the table to
have a header column, wheather it's being used (Index_mode=FALSE) or not
(Index_mode=TRUE).
Remarks
• THPOLYDATA returns an array of up to 22 rows by 26 columns. The size depends on
the maximum polynomial order used: the number of rows equals Max_order + 2 and
the number of columns equals Max_order + 6. Although you do not have use an array
formula, it greatly speeds up the calculation.
•
In order for the THPOLYDATA function to return the full table, you must enter it in a
range of cells as an Array Formula. The simplest way to do that is by following these
steps (for more information on array formulas see Excel’s Array Formulas help topic):
5. Eter the formula in the top left cell of the range in which you want to return the
THPOLYDATA table.
6. Select the rectangular range of cells.
7. Press <F2> to edit the top left cell.
8. Press <Ctrl><Shift><Enter> to turn the formula into the array formula.
•
In order to help interpret the values returned by the array formula, the topmost row of
the array returned by THPOLYDATA contains column titles as follows:
Order is the order of the polynomial curve.
TriLookup™ Version 2.21 User’s Guide
60
Trimill Industrial Systems Inc.
R² is the R-squared value. It is an indication of how close the polynomial curve fits the
data points. Its value can be between 0 and 1, with R² = 1 indicating the perfect
fit. THPOLYDATA calculates R² from the following formula:
where are given values and
number of points.
are values on the polynomial curve, and p is the
Note that R² returned by THPOLYDATA is the same R-squared value as the one
displayed by Excel for polynomial trendlines and the one returned by Excel’s
RSQ function.
If you specify Smooth_R2 = TRUE, then R² is calculated for the extra in-between
points, in addition to the points given in the table. For more details see
Smooth_R2.
Sum(E²) is the sum of error squares (residuals) of a polynomial curve. It is another
indication of how close the polynomial curve fits the data points. It is calculated
from the following formula:
Lower values of Sum(E²) indicate a better fit. In case of a perfect fit Sum(E²) = 0,
which corresponds to R² = 1. If you specify Smooth_R2 = TRUE, then Sum(E²)
is calculated for the extra in-between points, in addition to the points given in the
table. For more details see Smooth_R2.
Ax, Bx are the coefficients used to normalize (transform) the table X values into X’
values which lie in the -1 to +1 range (X’ = Ax•X + Bx) when Normalized = TRUE
option is used. If the default Normalized = FALSE is used, then the “Ax” and “Bx”
columns are replaced by “TPOLY(...)” and “Formula” (see below).
TPOLY(...) is a ready-made formula string that uses the TPOLY function to calculate
the value of the polynomial curve, for example, “TPOLY(X,4,{-3.12,-1.97,0.172,4.86E-03,4.41E-05})” is a TPOLY formula string for a 4th order polynomial. In
order to use the formula, you must first Copy the value of the TPOLY(...) cell into
the clipboard and then use Paste Special | Values to paste it into another cell.
After that, you should add the “=” sign to the beginning of the formula and
replace all “X” characters with valid references to the X value. Note that
TPOLY(...) is returned only for Normalized = FALSE, otherwise the column is
used to return the Ax value (see above).
Due to Excel’s limitation on the length of strings that can be returned as a part of
an array formula, if the length of the formula string exceeds 255 characters,
THPOLYDATA will return #N/A instead. For this reason, the maximum order for
which the TPOLY formula string is returned is n = 11.
Formula is a ready-made inline formula string that can be used to calculate the value
of the polynomial curve, for example, “-15.97+1.109*X-2.091E-02*X^2+1.32104*X^3” is an inline formula string for a 3rd order polynomial. In order to use the
TriLookup™ Version 2.21 User’s Guide
61
Trimill Industrial Systems Inc.
formula, you must first Copy the value of the Formula cell into the clipboard and
then use Paste Special | Values to paste it into another cell. After that, you
should add the “=” sign to the beginning of the formula and replace all “X”
characters with valid references to the X value. Note that Formula is returned
only for Normalized = FALSE, otherwise the column is used to return the Bx
value (see above).
Due to Excel’s limitation on the length of strings that can be returned as a part of
an array formula, if the length of the formula string exceeds 255 characters,
THPOLYDATA will return #N/A instead. For this reason, the maximum order for
which the inline formula string is returned is n = 10.
c0, c1, c2, c3...c20 are the polynomial curve coefficients returned by THPOLYDATA.
The polynomial curve is defined as Y = c0 + c1•X + c2•X² + c3•X³ + .... + cn•X ;
where n is the polynomial order. If the order n is less than 20, all coefficients for
exponents higher than n are returned as zeros.
•
The second row of the array returned by THPOLYDATA (the first one below the title
row) contains data for the polynomial curve with the highest R² (the best fit curve).
That way, if is easy to reference the coefficients of the best fit curve without a need to
search for the curve with the highest R² value.
•
THPOLYDATA picks the best fit curve among the polynomial curves with order
between 1 and n (the maximum order). Therefore, the order of the best fit curve is
always equal to or less than the Max_order parameter. You must be careful to specify a
high enough value for Max_order in order to determine the true best fit curve.
•
Use TVPOLYDATA instead of THPOLYDATA when your lookup (X) and return (Y)
values are located in table columns.
TriLookup™ Version 2.21 User’s Guide
62
Trimill Industrial Systems Inc.
TPOLY
Returns the Y value of a polynomial curve for a given lookup value (X), polynomial order n
and an array of polynomial curve coefficients. It can also be used to calculate any
derivative of the polynomial curve.
Syntax
TPOLY (Lookup_value, Order, Coef_array, Derivative)
Lookup_value is a numeric value of the independent (X) variable for which TPOLY will
calculate the Y value of the polynomial curve.
Order is the order n of the polynomial curve. It must be a whole non-negative number (0,
1, 2, 3...etc). Although there is no upper limit for the Order, the practical limit for the
32 bit floating point computation is between 15 and 20.
Coef_array is the array of coefficients of the polynomial curve. The coefficients must be
given in the ascending order, starting from c0 (c0, c1, c2, c3 .... cn). Coef_array can
either be a reference to a single row or a single column range of cells, or it can be
specified as an in-line array, such as {3.443,-0.822,0.329,-0.04,0.0011}.
Derivative Optional, a whole non-negative number (0, 1, 2, 3...etc), default = 0. If a nonzero value (m) is specified, TPOLY will return the
derivative (
) of the
polynomial curve for the X coordinate specified by Lookup_value.
Remarks
• The polynomial curve is defined as Y = c0 + c1•X + c2•X² + c3•X³ + .... + cn• X , where c0,
c1, c2, c3 .... cn are polynomial coefficients and n is the order of the curve.
•
In case of an error, such as specifying a negative order or not having enough
coefficients in the array for the given order, TPOLY will return Excel’s #VALUE! error
code. Unlike other TriLookup functions, TPOLY does not offer the option of returning a
detailed text error message indicating the cause of the error.
TriLookup™ Version 2.21 User’s Guide
63
Trimill Industrial Systems Inc.
Parameters
Interpolate Parameter
•
Optional parameter, whole number between -20 and 7, default = 0.
•
This parameter determines if and what type of interpolation should be used when
calculating the return value.
•
The functions with one lookup variable (TVLOOKUP, THLOOKUP, TVLKP and
THLKP), use only one Interpolate parameter. The T2LOOKUP function, which has 2
lookup (independent) variables (X and Y), and T3LOOKUP with 3 lookup variables (X,
Y and Z), have separate interpolation settings for each lookup variable: X_interpolate,
Y_interpolate and, in case of T3LOOKUP, Z_interpolate. However, the simplified
versions of these functions, T2LKP and T3LKP, respectively, use the same value of
Interpolate for all lookup variables.
•
Note that all references to Interpolate below also pertain to X_interpolate, Y_interpolate
and Z_interpolate.
•
Interpolate must be specified as a whole number between -20 and 7 (default is 0).
•
If you use any of the lookup functions to extrapolate beyond the minimum and
maximum lookup values (by specifying Extrapolate <> 0), the extrapolation will be done
by extending the last segment of the interpolation curve. Therefore, the returned
extrapolated values will also depend on the value of the Interpolate parameter.
Types of interpolation
• Interpolate = 0: Exact Match Only
•
Interpolate = 1: Exact Match or Next Lower Value
•
Interpolate = 2: Exact Match or Next Higher Value
•
Interpolate = 3: Closest value
•
Interpolate = 4: Linear Interpolation
•
Interpolate = 5: Double Parabolic Piecewise Curve Interpolation
•
Interpolate = 6: Double Hyperbolic Piecewise Curve Interpolation
•
Interpolate = 7: Cubic Spline Curve Interpolation
•
Interpolate = -1 to -20: Polynomial Curve Interpolation
TriLookup™ Version 2.21 User’s Guide
64
Trimill Industrial Systems Inc.
Interpolate = 0: Exact Match Only
• This is the default value for Interpolate.
•
Works in a way similar to Excel’s built-in VLOOKUP and HLOOKUP functions with the
range_lookup parameter set to FALSE.
•
No interpolation is performed. A value is returned only if an exact match can be found
for the lookup value in the lookup area. Otherwise, the #N/A error code is returned.
•
Lookup and return values can be numeric or text and can be given in any order.
Interpolate = 1: Exact Match or Next Lower Value
• Works in a way similar to Excel’s built-in VLOOKUP and HLOOKUP functions with the
range_lookup parameter set to TRUE.
•
No interpolation is performed. A value from the data area corresponding to the largest
value that is less than or equal to the lookup value in the lookup area is returned. If the
lookup value is smaller than the smallest value in the lookup area, the #N/A error code
is returned.
•
Lookup and return values can be numeric or text. In addition, the lookup values must
be constantly ascending or descending. For example, the following arrays of lookup
values are invalid: (2, 3, 3, 4); (“z”, “w”, “v”, “x”).
Interpolate = 2: Exact Match or Next Higher Value
• No interpolation is performed. A value from the data area corresponding to the smallest
value that is greater than or equal to the lookup value in the lookup area is returned. If
the lookup value is greater than the largest value in the lookup area, the #N/A error
code is returned.
•
Lookup and return values can be numeric or text. In addition, the lookup values must
be constantly ascending or descending. For example, the following arrays of lookup
values are invalid: (2, 3, 3, 4); (“z”, “w”, “v”, “x”).
Interpolate = 3: Closest Value
• Returns the value from the data area that corresponds to the value in the lookup area
that is closest to the lookup value.
•
All lookup and return values must be numeric. In addition, the lookup values must be
constantly ascending or descending. For example, the following array of lookup values
is invalid: 2, 3, 3, 4.
Interpolate = 4: Linear Interpolation
• Interpolate using a straight line between the points corresponding to two values in the
lookup area that surround the lookup value on each side (one is less than and the other
is greater than the lookup value).
•
This is the simplest way of interpolating between the table values. Although the curve it
produces has sharp corners at each table point, the interpolated values between the
points are always predictable, without any “humps” or “dips”. When extrapolating past
TriLookup™ Version 2.21 User’s Guide
65
Trimill Industrial Systems Inc.
the minimum and maximum lookup values, linear interpolation is the safest and most
predictable method.
•
This is also the fastest type of interpolation because it only has to process the values of
two table points in order to calculate the interpolated return value. The calculation
speed may be important if you are dealing with large 2D or 3D tables and/or have a
slow computer.
•
All lookup and return values must be numeric. In addition, the lookup values must be
constantly ascending or descending. For example, the following array of lookup values
is invalid: 2, 3, 3, 4.
Interpolate = 5: Double Parabolic Piecewise Curve Interpolation
• Interpolate by averaging between two smooth parabolic curves (“left” and “right” curve),
each drawn through 3 out of 4 points surrounding the lookup value in the lookup area
(two on each side of the lookup value).
•
The parabolic curve equation is Y = c0 + c1•X + c2•X², where X is the lookup value and
Y is the return value.
•
This type of interpolation is somewhat slower than linear, but it is significantly faster
than spline or polynomial because it only has to process the values of four table points
in order to calculate the interpolated return value. The calculation speed may be
important if you are dealing with large 2D or 3D tables and/or have a slow computer.
•
All lookup and return values must be numeric. In addition, the lookup values must be
constantly ascending or descending. For example, the following array of lookup values
is invalid: 2, 3, 3, 4.
•
The way curve averaging is performed depends on the value of the Power parameter.
•
If the lookup value lies between the two lowest or the two highest values in the lookup
area (i.e. if it is in one of the two end segments), then the interpolation is done along
only one parabolic curve drawn through the 3 points surrounding the lookup value.
•
The double parabolic piecewise curve used in this type of interpolation always passes
through all table points. Its first derivative is continuous throughout the whole curve,
while its second derivative generally shows a discontinuity (jump) at each point used to
define the curve. The shape of the curve for any lookup value is determined only by the
four neighboring points (two at either side).
•
If there are only two valid lookup points in the table then the linear interpolation is
performed instead.
Interpolate = 6: Double Hyperbolic Piecewise Curve Interpolation
• Interpolate by averaging between two smooth hyperbolic (“left” and “right” curve), each
drawn through 3 out of 4 points surrounding the lookup value in the lookup area (two on
each side of the lookup value).
•
The hyperbolic curve equation is Y = c0 + c1 / (X + c2).
•
A three point hyperbolic curve is used if the return values for the 3 adjacent points are
constantly increasing or decreasing.
TriLookup™ Version 2.21 User’s Guide
66
Trimill Industrial Systems Inc.
•
If the return values for the 3 points are NOT constantly increasing or decreasing, then
the value of the middle point is used as a return value in the whole 3-point segment,
excluding the end points of the segment, which retain their own value.
•
This type of interpolation may not be suited for tables in which the return values are not
constantly ascending or descending, especially if a local minimum or maximum is
present in either of the end 3-point segments. If a local minimum or maximum is
present in any curve segment other than the end segments (such as segment 4,5,6 in
the example), the averaging between the left and right curves will smooth out the
sudden jumps in return values, producing an acceptable interpolated curve.
•
This type of interpolation is somewhat slower than linear, but it is significantly faster
than spline or polynomial, because it only has to process the values of four table points
in order to calculate the interpolated return value. The calculation speed may be
important if you are dealing with large 2D or 3D tables and/or have a slow computer.
•
In cases where there are relatively large distances between table points, and the return
values are constantly ascending or descending, this type of interpolation usually
produces a smoother interpolated curve when compared to all other curvilinear
interpolation types. This is because hyperbolic curves do not produce the “humps” and
“dips” between the table points. However, when extrapolating past the minimum and
maximum lookup values, this type of interpolation can produce unpredictable results.
•
All lookup and return values must be numeric. In addition, the lookup values must be
constantly ascending or descending. For example, the following array of lookup values
is invalid: 2, 3, 3, 4.
•
The way curve averaging is performed depends on the value of the Power parameter.
•
If the lookup point lies between the two lowest or the two highest values in the lookup
area (i.e. if it is in one of the two end segments), then the interpolation is done along
only one hyperbolic curve (“left” or “right”) drawn through the 3 points surrounding the
lookup value.
•
The double hyperbolic piecewise curve used in this type of interpolation always passes
through all the points. If the return values are constantly increasing or decreasing, its
first derivative is continuous throughout the whole curve. The second derivative
generally shows a discontinuity (jump) at each point used to define the curve. The
shape of the curve at any lookup value is determined only by the four neighboring
points (two at either side).
•
If there are only two valid lookup points in the table then linear interpolation is
performed instead.
•
Starting in Version 1.2, the extrapolation for Interpolate = 6 is done by extending the
tangent drawn through the end point of the hyperbolic curve defined by the end 3-point
segment. The extrapolated values now lie on a straight line, which makes the results of
extrapolation much more predictable.
Interpolate = 7: Cubic Spline Curve Interpolation
• Interpolate using a natural cubic spline curve drawn through all the points defined by
the pairs of values in the lookup area and the data area.
TriLookup™ Version 2.21 User’s Guide
67
Trimill Industrial Systems Inc.
•
This type of interpolation is slower than linear and piecewise parabolic or hyperbolic,
because it has to process the values of all table points in order to calculate the
interpolated return value. The calculation speed may be important if you are dealing
with large 2D or 3D tables and/or have a slow computer.
•
All lookup and return values must be numeric. In addition, the lookup values must be
constantly ascending or descending. For example, the following array of lookup values
is invalid: 2, 3, 3, 4.
•
The natural cubic spline is a third degree piecewise polynomial curve that always
passes through all the points. The first and second derivatives of the whole curve are
continuous and the second derivatives at each end of the curve are equal zero. The
shape of the spline curve for any lookup value (X) is determined by ALL table points.
•
If there are only two valid lookup points in the table then linear interpolation is
performed instead.
Interpolate = -1 to -20: Polynomial Curve Interpolation
• Interpolation is performed using a polynomial curve Y = c0 + c1•X + c2•X² + c3•X³ + .... +
cn•X , with order n = -Interpolate. The polynomial curve is fitted using the least squares
method through the data points given in the lookup area (X values) and the data area
(Y values) of the table.
•
This type of interpolation should generally be used if data points are scattered around
and you wish to return the value from the polynomial trendline drawn through the
points, which generally does not pass through all of them. Using the polynomial
interpolation allows you to do so directly, without first having to calculate the values of
the polynomial coefficients (which you can do using the TVPOLYDATA or
THPOLYDATA functions), and then using the obtained coefficients to calculate the
return value from the polynomial curve (which you can do using the TPOLY function).
•
This type of interpolation is slower than linear and piecewise parabolic or hyperbolic
because it has to process the values of all table points in order to calculate the
interpolated return value. The calculation speed may be important if you are dealing
with large 2D or 3D tables and/or have a slow computer.
•
All lookup and return values must be numeric. In addition, the lookup values must be
constantly ascending or descending. For example, the following array of lookup values
is invalid: 2, 3, 3, 4.
•
Although you can specify any order between 1 and 20, you should avoid the values
over 15 (i.e., Interpolate < -15) because they may cause excessive calculation errors
due to precision limits imposed by the 32 bit floating point computation.
•
If the specified order n equals or exceeds the number of valid points in the lookup table
(p), it is automatically reduced to one less than the number of points (n = p - 1).
•
In a general case where the specified order n is less than the number of points minus 1
(n < p - 1), the fitted polynomial curve will not pass through all the points (as show by
the curve drawn for Interpolate = -5 in the example). If you have a large number of
points, say over 15, and want the interpolation curve to pass through every single point,
you should consider using a different type of interpolation (see Interpolate = 4, 5, 6 and
7).
TriLookup™ Version 2.21 User’s Guide
68
Trimill Industrial Systems Inc.
•
All derivatives of the polynomial curve are continuous and the shape of the curve for
any lookup value (X) is determined by all the points.
•
Internally, TriLookup functions calculate the polynomial interpolation curve coefficients
after first normalizing the range of lookup values. This is done by performing a linear
transformation (mapping) of the original lookup (L) values into L’ values which lie in the
-1 to +1 range. This procedure helps reduce the calculation errors (caused by the limits
in precision of the 32 bit floating point computations) in some cases where the
polynomial order n is high (for example n > 15).
TriLookup™ Version 2.21 User’s Guide
69
Trimill Industrial Systems Inc.
Power Parameter
•
Optional parameter, any number, default = 1.
•
This parameter is the exponent used in calculating the averaging weights the in the
Double Parabolic Piecewise Curve Interpolation (Interpolate = 5) and the Double
Hyperbolic Piecewise Curve Interpolation (Interpolate = 6). The weight used for
averaging between the left and the right curve is raised to this power. In a special case
for Power = 0 the averaging weight is calculated using a sine curve.
•
The functions with one lookup variable (TVLOOKUP and THLOOKUP), use only one
Power parameter. The T2LOOKUP function, which has 2 lookup (independent)
variables (X and Y), and T3LOOKUP with 3 lookup variables (X, Y and Z), have
separate settings for each lookup variable: X_power, Y_power and, in case of
T3LOOKUP, Z_power. However, all simplified versions of TriLookup functions (TVLKP,
THLKP, T2LKP and T3LKP), use only the default value of Power = 1.
•
Note that all references to Power below also pertain to X_power, Y_ power and Z_
power.
•
The averaging between the left and right curve in the double piecewise curve
Interpolation is done in the following way: The two calculated return values for the left
and right curves (YL and YR) are weighted based on how close the lookup value (X) is to
the point on the left (XL) and the point on the right (XR). It is done in the following way:
Y = WL · YL + WR · YR
where WL and WR are weights for the left and right curve, respectively. How WL and WR
are calculated depends on the value of Power (P).
For P <> 0, the following formulas are used:
For X <= (XL + XR) / 2
For X > (XL + XR) / 2
Note that the above formulas ensure that the curve averaging in the XL and XR interval
is symmetrical between left and right, for any value of Power P.
For a special case of P = 0, the averaging weights are calculated using the following
sine curve formula:
TriLookup™ Version 2.21 User’s Guide
70
Trimill Industrial Systems Inc.
•
For Power = 1 (default), the curve averaging is performed by a simple linear inverse
distance weighting. The first derivative of the whole curve is continuous, while the
second derivative generally has a discontinuity at each table point.
•
For Power = 0 (sine curve averaging), both the first and the second derivatives of the
whole curve are continuous for Interpolate = 5 and also for Interpolate = 6 if the return
values are constantly ascending or descending.
•
Note: Although you can use values for the Power parameter that are neither 1 or 0, you
should be careful because this can produce unexpected results. You should use the
Power values other than 1 or 0 only if you have special requirements and if you fully
understand the outcome.
TriLookup™ Version 2.21 User’s Guide
71
Trimill Industrial Systems Inc.
Missing_pts and Extrapolate Parameters
Missing_pts
• Optional parameter, TRUE or FALSE, default = FALSE.
•
This parameter determines whether to allow blank and non-numeric cells in the lookup
table. It has no effect when Interpolate = 0, in which case the table may contain any
values.
FALSE blank and non-numeric cells are NOT allowed;
TRUE blank and non-numeric cells are allowed. How the table with missing points
(blank and non-numeric cells) will be processed also depends on the extrapolation
interval.
•
The simplified versions of TriLookup functions (TVLKP, THLKP, T2LKP and T3LKP),
use only the default value of Missing_pts = FALSE. Therefore, in order to process
lookup tables with blank and non-numeric cells, you must use the full versions of the
TriLookup functions (TVLOOKUP, THLOOKUP, T2LOOKUP and T3LOOKUP).
•
How the missing points will be processed depends on the size of extrapolation
interval(s), as shown below.
Extrapolate
• Optional parameter, any number, default = 0 (no extrapolation).
•
Determines whether to perform extrapolation and the size of extrapolation interval (how
far to extrapolate past the minimum and maximum values in the lookup area).
•
The functions with one lookup variable (TVLOOKUP and THLOOKUP), use only one
Extrapolate parameter. The T2LOOKUP function, which has 2 lookup (independent)
variables (X and Y), and T3LOOKUP with 3 lookup variables (X, Y and Z), have
separate extrapolation settings for each lookup variable: X_extrapolate, Y_extrapolate
and, in case of T3LOOKUP, Z_extrapolate.
•
The simplified versions of TriLookup functions (TVLKP, THLKP, T2LKP and T3LKP),
use only the default value of Extrapolate = 0. Therefore, in order to use extrapolation,
or process lookup tables with blank and non-numeric cells, you must use the full
versions of the TriLookup functions (TVLOOKUP, THLOOKUP, T2LOOKUP and
T3LOOKUP).
•
The extrapolation interval (E) is determined by the value of the Extrapolate parameter
in the following way:
For Extrapolate >= 0 ->
E = Extrapolate
For Extrapolate < 0
E = Extrapolate * (Lmin – Lmax)
->
where Lmax and Lmin are maximum and minimum values in the lookup area.
•
For a zero extrapolation interval (E = 0), the TriLookup functions return #N/A whenever
the lookup value falls into a gap in the lookup table, where either lookup and/or return
value is missing or invalid. For E > 0, the return values will be calculated for all lookup
points that lay within E distance from the edges of the gap.
•
Note: It makes no difference whether the lookup or return value or both are missing or
invalid.
TriLookup™ Version 2.21 User’s Guide
72
Trimill Industrial Systems Inc.
Smooth_R2 Parameter
•
Optional parameter, TRUE or FALSE, default = FALSE.
•
This parameter determines whether to use additional in-between points when
calculating the R-squared value (R²) and the sum of error squares (residuals) of the
polynomial curve (Sum(E²)).
•
For Smooth_R2 = FALSE, the R² and Sum(E²) values returned by TVPOLYDATA and
THPOLYDATA indicate only how closely the polynomial curve fits the set of table data
points, regardless of what the curve looks like between the points. In some cases, parts
of the best fit curve (the one with the highest R²) for Smooth_R2 = FALSE can be
highly unstable, having extreme local minimums or maximums between the data points.
However, this will not affect the values of R² and Sum(E²), nor is it obvious from the
values of the polynomial coefficients. The only way to discover such instability is to plot
the polynomial curve values, calculated at closely spaced X intervals (see the example
below).
•
For Smooth_R2 = TRUE, the R² and Sum(E²) values returned by TVPOLYDATA and
THPOLYDATA indicate how closely and smoothly the polynomial curve fits the set of
table data points. They are calculated by also taking into account the shape of the
curve between the table data points. If parts of a polynomial curve are unstable, having
local minimums or maximums between the data points, the value of R² will be reduced,
and the value of Sum(E²) increased. As a result, the best fit curve (the one with the
highest R²) picked by TVPOLYDATA and THPOLYDATA will be the one with least
instabilities that comes close to all table data points. Generally, this is the curve that
you would pick out as the best one from the diagram showing polynomial curves of
different orders (see the example). The advantage is that, in order to determine the
polynomial curve that best approximates your set of data points, you don’t have to go
through the trouble of calculating and plotting a multi curve diagram. All you need to do
is specify Smooth_R2 = TRUE.
•
If Smooth_R2 = TRUE, then TVPOLYDATA and THPOLYDATA calculate (R²) and
Sum(E²) using the following procedure:
•
Insert a single extra point in the middle of each interval between the table data
points.
•
The X and Y coordinates of the extra points are calculated as follows:
X = (XL + XR) / 2
Y = (YL + YR) / 2
where the L subscripts denote the point on the left, and the R subscripts the point
on the right.
•
•
Calculate R² (R-squared value) and Sum(E²) (sum of error squares), taking into
account all table points and the in-between extra points.
R² is an indication of how close the polynomial curve fits the set of table plus extra
points. Its value can be between 0 and 1, with R² = 1 indicating the perfect fit.
TVPOLYDATA and THPOLYDATA calculate R² from the following formula:
TriLookup™ Version 2.21 User’s Guide
73
Trimill Industrial Systems Inc.
where denote Y values of table points and extra in-between points, are the Y
values on the polynomial curve, and p is the total number of points (table + extra).
•
Sum(E²) is the sum of error squares (residuals) of a polynomial curve. It is calculated
from the following formula:
Sum(E²) is another indication of how close the polynomial curve fits the set of data +
extra points, with lower values indicating a better fit. In case of a perfect fit Sum(E²) = 0,
which corresponds to R² = 1.
TriLookup™ Version 2.21 User’s Guide
74
Trimill Industrial Systems Inc.
Examples (TriLookup Functions)
TVLOOKUP & TVLKP Examples
The 6-row by 4-column lookup table below is set up for use by the TVLOOKUP and
TVLKP functions. It contains column titles in the topmost row and the lookup and return
values in the remaining 5 rows. TVLOOKUP and TVLKP use the column titles in order to
identify the lookup column and the return column.
Search for value = 2.75 in the lookup column titled 1 and return a value from the return
column "Y1"; use a third order polynomial interpolation (Interpolate = -3).
=TVLKP(2.75,$B$5:$E$10,1,"Y1",-3) equals 0.36819308
Search for value = 0.75 in the lookup column "X2" and return the corresponding value from
the return column "Y1"; use a linear interpolation (Interpolate = 4).
=TVLKP(0.75,$B$5:$E$10,"X2","Y1",4) equals 0.317954545
Same as above, but use the column index numbers instead of column titles (3 instead of
“X2” and 2 instead of “Y1”) to specify the lookup and return columns (Index_mode =
TRUE).
=TVLKP(0.75,$B$5:$E$10,3,2,4,,TRUE) equals 0.317954545
Search for value = 0.75 in the lookup column "X2" and return a value from the return
column "Y2"; use a linear interpolation (Interpolate = 4).
=TVLKP(0.75,$B$5:$E$10,"X2","Y2",4) equals #VALUE!
Same as above, but with Error_msg = TRUE in order to get an explanation on what
caused TVLKP to return the #VALUE! Error.
=TVLKP(0.75,$B$5:$E$10,"X2","Y2",4,TRUE) equals:
#VALUE! {Err.402} 2 missing or invalid cells found in Return column titled "Y2"
(all cells must be numeric for Interpolate < 0 or > 2, and Missing_pts = FALSE).
Search for value = 0.75 in the lookup column "X2" and return a value from the return
column "Y2"; use the default "exact match" (Interpolate = 0).
=TVLKP(0.75,$B$5:$E$10,"X2","Y2",,TRUE) equals:
#N/A {Err.312} Invalid Lookup_value = .75 (cannot find exact match in Lookup
Column titled "X2").
Same as above, but using the "exact or next lower value" (Interpolate = 1) mode, which is
similar to the Excel's built in VLOOKUP function.
=TVLKP(0.75,$B$5:$E$10,"X2","Y2",1,TRUE) equals Text
TriLookup™ Version 2.21 User’s Guide
75
Trimill Industrial Systems Inc.
Search for value = 0.75 in the lookup column "X2" and return a value from the return
column "Y2"; use a linear interpolation (Interpolate = 4). Also set Missing_pts = TRUE to
allow processing of lookup column and return column containing missing (empty) and
invalid (non-numeric) cells.
=TVLOOKUP(0.75,$B$5:$E$10,"X2","Y2",4,,,TRUE,TRUE) equals:
#N/A {Err.408} Invalid Lookup_value = 0.75 (out of bounds due to missing or
invalid cells in Return column titled "Y2").
Same as above, but with Extrapolate = 2. This allows TVLOOKUP to extrapolate up to 2
units away from the last valid cell.
=TVLOOKUP(0.75,$B$5:$E$10,"X2","Y2",4,2,,TRUE,TRUE) equals 0.561785714
Same as above, but using different lookup column and return column ("Y1" and "X2",
respectively). Note: if Interpolate <> 0, then the values in the lookup column must be
constantly increasing or decreasing.
=TVLOOKUP(0.75,$B$5:$E$10,"Y1","X2",4,2,,TRUE,TRUE) equals:
#VALUE! {Err.310} Invalid Lookup Column titled "Y1" for Interpolate <> 0 (values
not constantly increasing or decreasing: .38; .5; .45).
TriLookup™ Version 2.21 User’s Guide
76
Trimill Industrial Systems Inc.
THLOOKUP & THLKP Examples
The 4-row by 6-column lookup table below is set up for use by the THLOOKUP and
THLKP functions. It contains row titles in the leftmost column and the lookup and return
values in the remaining 5 columns. THLOOKUP and THLKP use the row titles in order to
identify the lookup row and return row.
Search for value = 2.75 in the lookup row titled 1 and return a value from the return row
"Y1"; use a third order polynomial interpolation (Interpolate = -3).
=THLKP(2.75,$B$5:$G$8,1,"Y1",-3) equals 0.36819308
Search for value = 0.75 in the lookup row "X2" and return the corresponding value from the
return row "Y1"; use a linear interpolation (Interpolate = 4).
=THLKP(0.75,$B$5:$G$8,"X2","Y1",4) equals 0.317954545
Same as above, but use the row index numbers instead of row titles (3 instead of “X2” and
2 instead of “Y1”) to specify the lookup and return rows (Index_mode = TRUE).
=THLKP(0.75,$B$5:$G$8,3,2,4,,TRUE) equals 0.317954545
Search for value = 0.75 in the lookup row "X2" and return a value from the return row "Y2";
use a linear interpolation (Interpolate = 4).
=THLKP(0.75,$B$5:$G$8,"X2","Y2",4) equals #VALUE!
Same as above, but with Error_msg = TRUE in order to get an explanation on what
caused THLKP to return the #VALUE! Error.
=THLKP(0.75,$B$5:$G$8,"X2","Y2",4,TRUE) equals:
#VALUE! {Err.401} 2 missing or invalid cells found in Return row titled "Y2" (all
cells must be numeric for Interpolate < 0 or > 2, and Missing_pts = FALSE).
Search for value = 0.75 in the lookup row "X2" and return a value from the return row "Y2";
use the default "exact match" (Interpolate = 0).
=THLKP(0.75,$B$5:$G$8,"X2","Y2",,TRUE) equals:
N/A {Err.312} Invalid Lookup_value = .75 (cannot find exact match in Lookup Row
titled "X2").
Same as above, but using the "exact or next lower value" (Interpolate = 1) mode, which is
similar to the Excel's built in VLOOKUP function.
=THLKP(0.75,$B$5:$G$8,"X2","Y2",1,TRUE) equals Text
Search for value = 0.75 in the lookup row "X2" and return a value from the return row "Y2";
use a linear interpolation (Interpolate = 4). Also set Missing_pts = TRUE to allow
processing of lookup row and return row containing missing (empty) and invalid (nonnumeric) cells.
=THLOOKUP(0.75,$B$5:$G$8,"X2","Y2",4,,,TRUE,TRUE) equals:
#N/A {Err.407} Invalid Lookup_value = 0.75 (out of bounds due to missing or
invalid cells in Return row titled "Y2").
TriLookup™ Version 2.21 User’s Guide
77
Trimill Industrial Systems Inc.
Same as above, but with Extrapolate = 2. This allows THLOOKUP to extrapolate up to 2
units away from the last valid cell.
=THLOOKUP(0.75,$B$5:$G$8,"X2","Y2",4,2,,TRUE,TRUE) equals 0.561785714
Same as above, but using different lookup row and return row ("Y1" and "X2",
respectively). Note: if Interpolate <> 0, then the values in the lookup row must be
constantly increasing or decreasing.
=THLOOKUP(0.75,$B$5:$G$8,"Y1","X2",4,2,,TRUE,TRUE) equals:
#VALUE! {Err.310} Invalid Lookup Row titled "Y1" for Interpolate <> 0 (values not
constantly increasing or decreasing: .38; .5; .45).
TriLookup™ Version 2.21 User’s Guide
78
Trimill Industrial Systems Inc.
T2LOOKUP & T2LKP Examples
The following examples are available for T2LOOKUP and T2LKP functions:
•
Examples Without Missing and Invalid Cells(T2LOOKUP & T2LKP)
•
Examples With Missing and Invalid Cells(T2LOOKUP)
T2LOOKUP & T2LKP Examples Without Missing and Invalid Cells
The 5-row by 4-column lookup table below is set up for use by the T2LOOKUP and T2LKP
functions. It contains X-axis values in the topmost row, Y-axis values in the leftmost
column and the return values in the remaining area. The contents of the top left corner cell
is ignored.
Search for X value = 3.5 and Y value = 0.9 in the 2D (X-Y) lookup table and determine the
V(x,y) return value; use a linear interpolation for both X and Y (Interpolate = 4).
=T2LKP(3.5,0.9,$B$6:$E$10,4) equals 0.611
Search for X value = 5.5 and Y value = 0.9 in the 2D (X-Y) lookup table and determine the
V(x,y) return value; use a linear interpolation for both X and Y (Interpolate = 4).
=T2LKP(5.5,0.9,$B$6:$E$10,4) equals #N/A
Same as above, but with Error_msg = TRUE in order to get an explanation on what
caused T2LKP to return the #N/A Error.
=T2LKP(5.5,0.9,$B$6:$E$10,4,TRUE) equals:
#N/A {Err.311} Invalid X_value = 5.5 (out of bounds: 3 to 5).
Same as above, but use T2LOOKUP with X_extrapolate = 1. This allows T2LOOKUP to
extrapolate up to 1 units away from the last cell in the X direction.
=T2LOOKUP(5.5,0.9,$B$6:$E$10,4,4,1,,,,,,TRUE) equals 0.54
TriLookup™ Version 2.21 User’s Guide
79
Trimill Industrial Systems Inc.
T2LOOKUP Examples With Missing and Invalid Cells
The 5-row by 4-column table below can be used by T2LOOKUP even though it contains
missing (blank) and invalid (non numeric) cells.
Search for X value = 3.5 and Y value = 0.9 in the 2D (X-Y) lookup table and determine the
V(x,y) return value; use a linear interpolation for both X and Y (4).
=T2LOOKUP(3.5,0.9,$B$29:$E$33,4,4) equals #VALUE!
Same as above, but with Error_msg = TRUE in order to get an explanation on what
caused T2LOOKUP to return the #VALUE! Error.
=T2LOOKUP(3.5,0.9,$B$29:$E$33,4,4,,,,,,,TRUE) equals:
#VALUE! {Err.403} 3 missing or invalid cells found in data area (all cells must be
numeric for Missing_pts = FALSE).
Same as above, but with Missing_pts = TRUE in order to allow processing of missing
(empty) and invalid (non-numeric) cells.
=T2LOOKUP(3.5,0.9,$B$29:$E$33,4,4,,,,,,TRUE,TRUE) equals:
#N/A {Err.409} Invalid lookup point [X_value = 3.5, Y_value = 0.9], (out of bounds
due to missing or invalid cells in data area).
Same as above, but with X_extrapolate = 1 and Y_extrapolate = 1. This allows
T2LOOKUP to extrapolate up to 1 units away from the last valid cell in both X and Y
directions.
=T2LOOKUP(3.5,0.9,$B$29:$E$33,4,4,1,1,,,,TRUE,TRUE) equals 0.6265
TriLookup™ Version 2.21 User’s Guide
80
Trimill Industrial Systems Inc.
T3LOOKUP & T3LKP Examples
The following examples are available for T3LOOKUP and T3LKP functions:
•
Single Area 3D Table Examples (T3LOOKUP)
•
Multi Area 3D Table Examples(T3LOOKUP & T3LKP)
•
Skewed 3D Table Examples (T3LOOKUP)
T3LOOKUP Single Area 3D Table Examples
The 21-row by 4-column lookup table below is set up for use by the T3LOOKUP function. It
is a single area 3D table containing 3 component 2D tables, separated by 2 separator rows
(Table_Ygap = 2). Each 2D table has 5 rows (Table_Ysize = 5). The first (topmost) 2D
table contains X-axis values in its topmost row and Y-axis values in its leftmost column,
while the topmost rows and the leftmost columns of the remaining 2D tables are ignored.
The Z-axis values for each 2D table are located in the top-left corner cells. The return
values, which depend on X, Y and Z, are in the remaining area.
Search for X value = 3.5, Y value = 0.9 and Z value = 1.25 in the single area 3D (X-Y-Z)
lookup table and determine the V(x,y,z) return value; use the "closest value" matching
along X, Y and Z axes (X/Y/Z_interpolate = 3).
=T3LOOKUP(3.5,0.9,1.25,$B$9:$E$29,2,5,3,3,3,,,,,,,,,TRUE) equals: 0.03
TriLookup™ Version 2.21 User’s Guide
81
Trimill Industrial Systems Inc.
Same as above, but use a linear interpolation along X, Y and Z axes (X/Y/Z_interpolate =
4).
=T3LOOKUP(3.5,0.9,1.25,$B$9:$E$29,2,5,4,4,4,,,,,,,,,TRUE) equals 0.25375
Same as above, but use a double parabolic piecewise curve interpolation along the X-axis
(X_interpolate = 5), a polynomial curve interpolation with order n = 3 along the Y-axis
(Y_interpolate = -3) and a cubic spline curve interpolation along the Z-axis (Z_interpolate =
7).
=T3LOOKUP(3.5,0.9,1.25,$B$9:$E$29,2,5,5,-3,7,,,,,,,,,TRUE) equals 0.064854531
Search for X value = 3.5, Y value = 0.9 and Z value = 2.5 in the single area 3D (X-Y-Z)
lookup table and determine the V(x,y,z) return value; use a linear interpolation along X, Y
and Z axes (X/Y/Z_interpolate = 4).
=T3LOOKUP(3.5,0.9,2.5,B9:E29,2,5,4,4,4,,,,,,,,,TRUE) equals:
#N/A {Err.311} Invalid Z_value = 2.5 (out of bounds: 0.5 to 2).
Same as above, but add Z_extrapolate = 0.5 to allow T3LOOKUP to extrapolate up to 0.5
units past the minimum and maximum Z-axis values.
=T3LOOKUP(3.5,0.9,1.25,B9:E29,2,5,4,4,4,,,0.5,,,,,,TRUE) equals 0.25375
TriLookup™ Version 2.21 User’s Guide
82
Trimill Industrial Systems Inc.
T3LOOKUP & T3LKP Multi Area 3D Table Examples
The three 5-row by 4-column tables below together make up a multi area 3D lookup table,
set up for use by the T3LOOKUP and T3LKP functions. Note that the individual 2D tables
don't have to be in order and can be scattered throughout the worksheet. The first
(topmost) 2D table contains X-axis values in its topmost row and Y-axis values in its
leftmost column, while the topmost rows and the leftmost columns of the remaining 2D
tables are ignored. The Z-axis values for each 2D table are located in the top-left corner
cells. The return values, which depend on X, Y and Z are in the remaining areas. Note
that, when specifying a multi area table as the Table_XYZ parameter, you must enclose it
in parentheses. Otherwise, it will be interpreted as more than one parameter, which will
cause an error.
Search for X value = 3.5, Y value = 0.9 and Z value = 1.25 in the multi area 3D (X-Y-Z)
lookup table and determine the V(x,y,z) return value; use a linear interpolation along X, Y
and Z axes (Interpolate = 4).
=T3LKP(3.5,0.9,1.25,(B60:E64,C66:F70,D72:G76),4,TRUE) equals 0.25375
Same as above, but specify only the top left cells for the second and third 2D table.
T3LOOKUP and T3LKP assume that all 2D tables are of the same size in X and Y
directions (have the same number of rows and columns) as the first one.
=T3LKP(3.5,0.9,1.25,(B60:E64,C66,D72),4,TRUE) equals 0. 25375
Same as above, but use different types of interpolation in the X, Y and Z directions:
X_interpolate = 4 (linear), Y_interpolate = 7 (spline) and Z_interpolate = 5 (double
parabolic). For this you must use the T3LOOKUP function.
=T3LOOKUP(3.5,0.9,1.25,(B60:E64,C66,D72),,,4,7,5,,,,,,,,,TRUE) equals 0.059425
TriLookup™ Version 2.21 User’s Guide
83
Trimill Industrial Systems Inc.
Same as above, but the multiple area range specified as the Table_XYZ parameter not
enclosed it in parentheses. T3LOOKUP returns the Excel #VALUE! error code because
too many parameters are specified.
=T3LOOKUP(3.5,0.9,1.25,B60:E64,C66,D72,,,4,7,5,,,,,,,,,TRUE) equals #VALUE!
TriLookup™ Version 2.21 User’s Guide
84
Trimill Industrial Systems Inc.
T3LOOKUP Skewed 3D Table Examples
The two 3D tables below demonstrate how you can use T3LOOKUP to retrieve information
from skewed 3D tables in which the component 2D tables have different values along X
and Y axes. Note that many of the return values in the data area of the modified table are
left blank. Therefore, you must set Missing_pts = TRUE. In some cases it may also be
necessary to enable extrapolation by assigning X/Y/Z_extrapolate parameters non zero
values.
Search for X value = 5, Y value = 0.9 and Z value = 1.25 in the single area 3D (X-Y-Z)
lookup table and determine the V(x,y,z) return value; use a double parabolic piecewise
curve interpolation along X, Y and Z axes (X/Y/Z_interpolate = 5); set Missing_pts = TRUE
TriLookup™ Version 2.21 User’s Guide
85
Trimill Industrial Systems Inc.
=T3LOOKUP(5.7,0.9,1.25,$A$121:$G$138,0,6,5,5,5,,,,,,,,TRUE,TRUE) equals -0.1000785
Search for X value = 4.2, Y value = 0.9 and Z value = 1.25 in the single area 3D (X-Y-Z)
lookup table and determine the V(x,y,z) return value; use linear interpolation along X, Y
and Z axes (X/Y/Z_interpolate = 4); set Missing_pts = TRUE
=T3LOOKUP(4.2,0.9,1.25,$A$121:$G$138,0,6,4,4,4,,,,,,,,TRUE,TRUE) equals:
#N/A {Err.421} Invalid lookup point [X_value = 4.2, Y_value = 0.9, Z_value =
1.25], (out of bounds due to missing or invalid cells in data area).
Same as above, but allow extrapolation up to 1.5 units along X, Y and Z axes
(X/Y/Z_extrapolate = 1.5).
=T3LOOKUP(4.2,0.9,1.25,$A$121:$G$138,0,6,4,4,4,1.5,1.5,1.5,,,,,TRUE,TRUE) equals 0.3221
TriLookup™ Version 2.21 User’s Guide
86
Trimill Industrial Systems Inc.
TVPOLYDATA Examples
The 10-row by 4-column lookup table below is set up for use by the TVPOLYDATA
function. It contains column titles in the topmost row and the lookup (X) and return (Y)
values in the remaining 9 rows. TVPOLYDATA uses the column titles in order to identify
the lookup column and return column.
For lookup (X) column "X" and return (Y) column "Y1" calculate the coefficients of all
polynomial curves; maximum order = 8; use array formula.
{=TVPOLYDATA($A$6:$D$15,"X","Y1",8)} equals:
Note that, in the above example, you can also use the column index numbers to select the
lookup and return columns (1 instead of “X” and 2 instead of “Y1”), by specifying
Index_mode = TRUE:
{=TVPOLYDATA($A$6:$D$15,1,2,8,,,,,TRUE)}
The following strings are returned in the "TPOLY(…)" and "Formula" rows in the above
table for Order = 4:
TPOLY(X,4,{3.4434310371708,-0.82230762016921,0.328609594844368,-4.04670971229965E02,1.04673785827208E-03})
3.4434310371708-0.82230762016921*X+0.328609594844368*X^2-4.04670971229965E02*X^3+1.04673785827208E-03*X^4
Same as above, but specify Smooth_R2 = TRUE to use an additional point in-between
each two table points when calculating R² and Sum(E²). Note that in this case the best fit is
achieved with a the 5th order curve.
{=TVPOLYDATA($A$6:$D$15,"X","Y1",8,TRUE)} equals:
TriLookup™ Version 2.21 User’s Guide
87
Trimill Industrial Systems Inc.
Same as above, but display only the best fit curve.
{=TVPOLYDATA($A$6:$D$15,"X","Y1",8, TRUE)} equals:
For lookup (X) column "X" and return (Y) column "Y3" return the coefficients the best fit
polynomial curve; maximum order = 8; use array formula.
{=TVPOLYDATA($A$6:$D$15,"X","Y3",8)} equals:
Same as above, but add a cell with the same formula with Error_msg = TRUE to return a
detailed text error message indicating the cause of the error.
=TVPOLYDATA($A$6:$D$15,"X","Y3",8,,,,TRUE) equals:
#VALUE! {Err.402} 2 missing or invalid cells found in Return column titled "Y3"
(all cells must be numeric for Missing_pts = FALSE).
Same as above, but set Missing_pts = TRUE. Note that the maximum order has been
reduced to 6 because of the two missing X-Y points.
{=TVPOLYDATA($A$6:$D$15,"X","Y3",8,,,TRUE)} equals:
TriLookup™ Version 2.21 User’s Guide
88
Trimill Industrial Systems Inc.
THPOLYDATA Examples
The 4-row by 10-column lookup table below is set up for use by the THPOLYDATA
function. It contains row titles in the leftmost column and the lookup (X) and return (Y)
values in the remaining 9 columns. THPOLYDATA uses the row titles in order to identify
the lookup row and return row.
For lookup (X) row "X" and return (Y) row "Y1" calculate the coefficients of all polynomial
curves; maximum order = 8; use array formula.
{=THPOLYDATA($B$5:$K$8,"X","Y1",8)} equals:
Note that, in the above example, you can also use the row index numbers to select the
lookup and return rows (1 instead of “X” and 2 instead of “Y1”), by specifying Index_mode
= TRUE:
{=THPOLYDATA($B$5:$K$8,1,2,8,,,,,TRUE)}
Same as above, but specify Smooth_R2 = TRUE to use an additional point in-between
each two table points when calculating R² and Sum(E²). Note that in this case the best fit is
achieved with a the 5th order curve.
{=THPOLYDATA($B$5:$K$8,"X","Y1",8,TRUE)} equals:
Same as above, but display only the best fit curve. equals:
{=THPOLYDATA($B$5:$K$8,"X","Y1",8,TRUE)}
TriLookup™ Version 2.21 User’s Guide
89
Trimill Industrial Systems Inc.
For lookup (X) row "X" and return (Y) row "Y3" return the coefficients the best fit
polynomial curve; maximum order = 8; use array formula.
{=THPOLYDATA($B$5:$K$8,"X","Y3",8)} equals:
Same as above, but add a cell with the same formula with Error_msg = TRUE to return a
detailed text error message indicating the cause of the error.
=THPOLYDATA($B$5:$K$8,"X","Y3",8,,,,TRUE) equals:
#VALUE! {Err.402} 2 missing or invalid cells found
cells must be numeric for Missing_pts = FALSE).
in Return row titled "Y3" (all
Same as above, but set Missing_pts = TRUE. Note that the maximum order has been
reduced to 6 because of the two missing X-Y points.
{=THPOLYDATA($B$5:$K$8,"X","Y3",8,,,TRUE)} equals:
TriLookup™ Version 2.21 User’s Guide
90
Trimill Industrial Systems Inc.
TPOLY Examples
The table below contains coefficients for polynomial curves of order 1 to 5. The coefficients
are arranged in the ascending order (c0, c1, c2, etc), so that they can be used by the
TPOLY function. Similar tables are returned by TVPOLYDATA and THPOLYDATA
functions.
Calculate the (Y) value of the 5th order polynomial curve for X = 2.3, using the coefficients
from the above table.
=TPOLY(6.5,$A$6,$B$6:$G$6) equals 2.4547125
Calculate the second derivative (d²Y/dX²) of the 5th order polynomial curve for X = 2.3,
using the coefficients from the above table.
=TPOLY(6.5,$A$6,$B$6:$G$6,2) equals -0.5046
Calculate the (Y) value of the 4th order polynomial curve for X = 6.5, using the coefficients
from the above table.
=TPOLY(6.5,$A$7,$B$7:$F$7) equals 2.97881875
Same as above, but specify the polynomial coefficients as an inline array, starting from c0.
The text of this formula can be copied from the "TPOLY(…)" column returned by
TVPOLYDATA and THPOLYDATA.
=TPOLY(6.5,4,{3.443,-0.822,0.329,-0.04,0.0011}) equals 2.97881875
Same as above, but using an inline polynomial formula. The text of this formula can be
copied from the "Formula" column returned by TVPOLYDATA and THPOLYDATA.
=3.443-0.822*6.5+0.329*6.5^2-0.04*6.5^3+0.0011*6.5^4 equals 2.97881875
TriLookup™ Version 2.21 User’s Guide
91
Trimill Industrial Systems Inc.
Examples (Parameters)
Interpolate Examples
The following examples are available for the Interpolate parameter, based on the type of
Interpolation:
•
Interpolate = 1: Exact Match or Next Lower Value
•
Interpolate = 2: Exact Match or Next Higher Value
•
Interpolate = 3: Closest value
•
Interpolate = 4: Linear Interpolation
•
Interpolate = 5: Double Parabolic Piecewise Curve Interpolation
•
Interpolate = 6: Double Hyperbolic Piecewise Curve Interpolation
•
Interpolate = 7: Cubic Spline Curve Interpolation
•
Interpolate = -1 to -20: Polynomial Curve Interpolation
TriLookup™ Version 2.21 User’s Guide
92
Trimill Industrial Systems Inc.
Interpolate = 1: Exact Match or Next Lower Value Example
The example below shows a graph of values returned by THLOOKUP for Interpolate = 1.
Interpolate = 2: Exact Match or Next Higher Value Example
The example below shows a graph of values returned by THLOOKUP for Interpolate = 2.
TriLookup™ Version 2.21 User’s Guide
93
Trimill Industrial Systems Inc.
Interpolate = 3: Closest Value Example
The example below shows a graph of values returned by THLOOKUP for Interpolate = 3.
Interpolate = 4: Linear Interpolation Example
The example below shows a graph of values returned by THLOOKUP for Interpolate = 4.
TriLookup™ Version 2.21 User’s Guide
94
Trimill Industrial Systems Inc.
Interpolate = 5: Double Parabolic Piecewise Curve Interpolation Example
The example below shows a graph of values returned by THLOOKUP for Interpolate = 5.
•
For the lookup value = 3.5, the left curve is drawn through the points 2, 3 and 4, while
the right curve is drawn through the points 3, 4 and 5.
•
For the lookup value = 1.5, only the curve drawn through points 1, 2 and 3 is used.
Interpolate = 6: Double Hyperbolic Piecewise Curve Interpolation Example
The example below shows a graph of values returned by THLOOKUP for Interpolate = 6.
•
For the lookup value = 3.5, the left curve is drawn through the points 2, 3 and 4, while
the right curve is drawn through the points 3, 4 and 5.
•
For the lookup value = 1.5, only the curve drawn through points 1, 2 and 3 is used.
•
3-point hyperbolic curves are used in the following segments: (1,2,3), (2,3,4), (3,4,5)
and (5,6,7)
•
The constant return values are used in segments: (4,5,6) and (6,7,8).
TriLookup™ Version 2.21 User’s Guide
95
Trimill Industrial Systems Inc.
Interpolate = 7: Cubic Spline Curve Interpolation Example
The example below shows a graph of values returned by THLOOKUP for Interpolate = 7.
Interpolate = -1 to -20: Polynomial Curve Interpolation Example
The example below shows graphs of values returned by THLOOKUP for Interpolate = -5
and -7.
TriLookup™ Version 2.21 User’s Guide
96
Trimill Industrial Systems Inc.
TriLookup™ Version 2.21 User’s Guide
97
Trimill Industrial Systems Inc.
Power Examples
The top diagram in the example below shows graphs of values returned by THLOOKUP
for Interpolate = 5 and Power values of 0, 0.5, 1 and 2. The bottom diagram shows how
the second derivative curves depend on Power.
TriLookup™ Version 2.21 User’s Guide
98
Trimill Industrial Systems Inc.
The top diagram in the example below shows graphs of values returned by THLOOKUP
for Interpolate = 6 and Power values of 0, 0.5, 1 and 2. The bottom diagram shows how
the second derivative curves depend on Power.
TriLookup™ Version 2.21 User’s Guide
99
Trimill Industrial Systems Inc.
Missing_pts and Extrapolate and Examples
The following examples are available for the Missing_pts and Extrapolate parameters:
•
For One Lookup Variable (TVLOOKUP & THLOOKUP)
•
For Two Lookup Variables (T2LOOKUP)
•
For Three Lookup Variables (T3LOOKUP)
Missing_pts and Extrapolate for One Lookup Variable (TVLOOKUP and THLOOKUP)
• For functions that use one lookup variable (TVLOOKUP and THLOOKUP), it is
relatively simple to predict where they will return an interpolated value and where they
will return #N/A, depending on the missing lookup/return points in the table and the
value of the Extrapolate parameter. This is demonstrated in the example below.
•
You can ensure that an interpolated value is returned for any lookup value between the
minimum and the maximum table lookup values by setting Extrapolate = -1. That way
the extrapolation interval will be the same size as the interval between the minimum
and the maximum lookup values in the table.
TriLookup™ Version 2.21 User’s Guide
100
Trimill Industrial Systems Inc.
The three diagrams in the above example show graphs of values returned by
THLOOKUP for Interpolate = 5 and Extrapolate = 0, 1 and 2. The missing and invalid
cells in the table above the diagrams are shown on the shaded background.
Missing_pts and Extrapolate for Two Lookup Variables (T2LOOKUP)
• For the T2LOOKUP function, which uses two lookup variables (X and Y), the shape
and size of the valid area is determined by the missing points in the 2D lookup table
and the values of the X_extrapolate and Y_extrapolate parameters. Valid area is a 2D
region in X-Y space in which T2LOOKUP will return interpolated values. If a X-Y lookup
point falls outside the valid area, T2LOOKUP will return #N/A.
•
The example below shows a 2D table with empty and invalid cells on a dark
background. Note that if an empty or invalid cell is located in either X-axis or Y-axis of
the table, it will have the same effect as if the whole column (for X-axis) or row (for Yaxis) of cells in the data area was empty. Therefore, the cells with a shaded
background in the table below are also regarded by T2LOOKUP as missing.
TriLookup™ Version 2.21 User’s Guide
101
Trimill Industrial Systems Inc.
•
The shape and size of the valid X-Y area (the one in which T2LOOKUP will return
interpolated values) depends on the missing points in the 2D lookup table and the
values of the X_extrapolate and Y_extrapolate parameters. This is demonstrated in
the example below, where the top figure shows the contents of a 2D lookup table with
missing values (on a dark background). The two figures below the table demonstrate
how the valid X-Y area depends on the values of X_extrapolate and Y_extrapolate
parameters.
An example of a 2D lookup table with missing values.
A diagram showing the valid X-Y area (shaded) for the above table, for X_extrapolate =
0 and Y_extrapolate = 0. If a X-Y lookup point falls outside the valid area, T2LOOKUP
TriLookup™ Version 2.21 User’s Guide
102
Trimill Industrial Systems Inc.
will return #N/A. The valid table points are marked with ●, while the missing points are
marked with ○.
A diagram showing the valid X-Y area (shaded) for the above table, for X_extrapolate =
0.18 and Y_extrapolate = 0.36. If a X-Y lookup point falls outside the valid area,
T2LOOKUP will return #N/A. The valid table points are marked with ●, while the
missing points are marked with ○.
•
You can ensure that an interpolated value is returned for any X and Y lookup values
that lie between the minimum and the maximum table axis values (Xmin < X < Xmax;
Ymin < Y < Ymax) by setting X_extrapolate = -1 and Y_extrapolate = -1. That way the
X and Y extrapolation intervals will be the same size as the intervals between the
minimum and the maximum X-axis and Y-axis values in the table.
Missing_pts and Extrapolate for Three Lookup Variables (T3LOOKUP)
• For the T3LOOKUP function, which uses three lookup variables (X, Y and Z), the
shape and size of the valid region is determined by the missing points in the 3D
lookup table and the values of the X_extrapolate, Y_extrapolate and Z_extrapolate
parameters. Valid region is a 3D region in X-Y-Z space in which T3LOOKUP will return
interpolated values. If a X-Y-Z lookup point falls outside the valid region, T3LOOKUP
will return #N/A.
•
The example below shows a 3D table with empty and invalid cells on a dark
background. Note that if an empty or invalid cell is located in the X-axis, Y-axis or Zaxis of the table, it will have the same effect as if the whole column (for X-axis) or row
(for Y-axis) or 2D table (for Z-axis) of cells in the data area was empty. Therefore, the
cells with a shaded background in the table below are also regarded by T3LOOKUP as
missing.
TriLookup™ Version 2.21 User’s Guide
103
Trimill Industrial Systems Inc.
•
The shape and size of the valid X-Y-Z region (the one in which T3LOOKUP will return
interpolated values) depends on the missing points in the 3D lookup table and the
values of the X_extrapolate, Y_extrapolate and Z_extrapolate parameters. This
cannot be easily demonstrated because the valid region is three-dimensional.
However, you can get a pretty good idea about how it is determined by studying the
above 2D example for T2LOOKUP.
•
You can ensure that an interpolated value is returned for any X, Y and Z lookup values
that lie between the minimum and the maximum table axis values (Xmin < X < Xmax;
Ymin < Y < Ymax; Zmin < Z < Zmax) by setting X_extrapolate = -1, Y_extrapolate = -1
and Z_extrapolate = -1. That way the X, Y and Z extrapolation intervals will be the
same size as the intervals between the minimum and the maximum X-axis, Y-axis and
Z-axis values in the table.
TriLookup™ Version 2.21 User’s Guide
104
Trimill Industrial Systems Inc.
Smooth_R2 Example
The example below demonstrates the use of extra in-between points to easily determine
the polynomial curve that best approximates a set of data points defined by a table of X
and Y values.
The above table with 12 X-Y points (named “Table”) is used by TVPOLYDATA to calculate
the polynomial curve coefficients and the values of R² and Sum(E²). The maximum
possible order is 11 (max order = number of points - 1). The array formula and the first 3
columns and 6 rows of values returned by TVPOLYDATA for Smooth_R2 = FALSE are
shown below.
{=TVPOLYDATA(Table,"X","Y ",11,FALSE)}
The array formula and the first 3 columns and 6 rows of values returned by TVPOLYDATA
for Smooth_R2 = TRUE are shown below.
{=TVPOLYDATA(Table,"X ","Y ",11,TRUE)}
TriLookup™ Version 2.21 User’s Guide
105
Trimill Industrial Systems Inc.
Example Workbooks
TriLookup Interactive Examples
This Excel workbook is provided as a part of TriLookup documentation. It contains
interactive examples that demonstrate the use and capabilities of different TriLookup
functions. The interactive examples also show line and surface graphs of values returned
by the functions.
The worksheets in this workbook are protected, so that you cannot accidentally change the
contents of the cells with formulas. Only the following cells can be edited:
•
The cells in the Lookup Tables;
•
The cells with a colored background in the Parameter Tables.
If you wish to edit any of the other cells, or change anything else on the worksheets, you
can do that by first unprotecting the worksheet by clicking on Tools | Protection |
Unprotect Sheet.
If you wish to examine or change parameter values in a cell that contains a TriLookup
function, you can do that either manually by editing the cell formula text, or interactively by
selecting the cell and then clicking on the Paste Function button . For example, if a cell
contains the following formula:
=T2LOOKUP(5.5,0.9,$B$6:$E$10,4,4,1,,,,,,TRUE)
then selecting the cell and clicking on the Paste Function button
will invoke the
Formula Palette dialog box with the current values of the parameters already filled in:
When opened, this workbook sets Excel’s Calculation option to Manual. This has been
done because some of the example worksheets can take several seconds to recalculate. It
is recommended that you recalculate the sheet after completing any changes by clicking
on the [Recalculate Sheet] button, rather than pressing <F9> or <Shift><F9>. Using the
[Recalculate Sheet] button will ensure that diagram captions are updated and that any
#N/A points are removed from the line diagrams.
TriLookup™ Version 2.21 User’s Guide
106
Trimill Industrial Systems Inc.
When you open this example workbook by clicking on Help | TriLookup Help | Example
Workbooks | Interactive, it will be opened in read-only mode. If you wish to modify it, you
should save it under a different name.
The VBA code used in this workbook to automate certain procedures (e.g., restore tables ,
set diagram titles, etc.) is not protected, and can freely be copied or modified to suit any
purpose.
This example workbook contains the following 4 worksheets:
1. ‘TVLOOKUP & TVLKP’
2. ‘T2LOOKUP & T2LKP’
3. ‘T3LOOKUP & T3LKP’
4. ‘TVPOLYDATA & TVPOLY’
TriLookup™ Version 2.21 User’s Guide
107
Trimill Industrial Systems Inc.
TVLOOKUP & TVLKP Interactive Example Worksheet
The large combo box in the top left corner of worksheet offers a choice between using the
more complex TVLOOKUP or the simplified TVLKP function. When you switch from one
function to the other, all references to the function in the worksheet, as well as the lists of
parameters, are automatically updated. Note that in the remainder of the text below,
TVLOOKUP stands for either TVLOOKUP or TVLKP.
The Parameters Table in the top left corner of this worksheet allows you to interactively
change the parameters of the TVLOOKUP function by modifying the values in the cells
with a colored background. After you are done, click on the small [Calc] button in the top
left corner to recalculate and display the new TVLOOKUP Value in the large merged cell at
the top of the table. The Cell Formula cell shows the formula used to return the value
above it.
Note that the parameters in the Parameter Table that have a yellow background color also
affect the diagram.
The lookup table for this example is given under the title Table. It is a 2D multi column
table with column titles in the topmost row of the table. You can edit the column titles and
data area cells in order to investigate how TVLOOKUP works with different data sets. You
can at any point restore the original data set by clicking on the [Restore Table] button.
Note that Restore Table won't work properly if you have inserted or deleted any rows or
columns in the table.
The table titled TVLOOKUP Returned Values for the Diagrams contains V(x) values
returned by TVLOOKUP an array of closely spaced lookup values. It is used to plot the
diagram shown at the top of the worksheet. The diagram shows five different curves of
TVLOOKUP returned values for five different values of the Interpolate parameter. You can
change the values for Interpolate used on the diagram by editing the values in the topmost
row of the TVLOOKUP Returned Values for the Diagrams table. You can also select
different lookup column and return column by changing the Lookup_title and Return_title
parameter values in Parameters Table. The little squares on the diagram indicate the
coordinates of the all the points defined by pairs of values in the lookup column and return
column of the lookup table.
The Diagram Settings combo box contains two options: Use Original Limits and
Extrapolated Limits. When Use Original Limits is selected, the minimum and maximum
limits for the lookup value on the diagram are the same as the minimum and maximum
values in the lookup column. If Extrapolated Limits is chosen, the diagram limits are
extended to also show the extrapolated values returned by TVLOOKUP. How far the limits
will be extended depends on the Extrapolate value in the Parameters Table
The #N/A Points combo box contains two options: Hide #N/A Points and Don’t Hide
#N/A Points. When Hide #N/A Points is selected, all #N/A points caused by missing or
invalid table values are removed from the line diagram. On a slow computer the process of
removing the #N/A points can take a long time. In that case you should select Don’t Hide
#N/A Points.
After changing any of the parameters, click on the [Recalculate Sheet] button to update all
tables and diagrams on the worksheet. This is necessary because the Calculation option
for this workbook is set to Manual.
TriLookup™ Version 2.21 User’s Guide
108
Trimill Industrial Systems Inc.
T2LOOKUP & T2LKP Interactive Example Worksheet
The large combo box in the top left corner of worksheet offers a choice between using the
more complex T2LOOKUP or the simplified T2LKP function. When you switch from one
function to the other, all references to the function in the worksheet, as well as the lists of
parameters, are automatically updated. Note that in the remainder of the text below,
T2LOOKUP stands for either T2LOOKUP or T2LKP.
The Parameters Table in the top left corner of this worksheet allows you to interactively
change the parameters of the T2LOOKUP function by modifying the values in the cells
with a colored background. After you are done, click on the small [Calc] button in the top
left corner to recalculate and display the new T2LOOKUP Value in the large merged cell at
the top of the table. The Cell Formula cell shows the formula used to return the value
above it.
Note that the parameters in the Parameter Table that have a yellow background color also
affect the diagrams.
The lookup table for this example is given under the title "Table". It is a 2D (X-Y) table. You
can edit its X-axis, Y-axis and data area cells in order to investigate how T2LOOKUP
works on different data sets. You can at any point restore the original data set by clicking
on the [Restore Table] button. Note that Restore Table won't work properly if you have
inserted or deleted any rows or columns in the table.
The table titled T2LOOKUP Returned Values for the Diagrams contains V(x,y) values
returned by T2LOOKUP for an array of closely spaced X and Y values. It is used to plot
the two diagrams shown on the right hand side of this worksheet. The line diagram on top
shows a series of curves of T2LOOKUP returned values. It also shows the V(x,y) table
values of the all the X-Y points given in the lookup table. You can chose which one of the
two independent variables (X or Y) will be plotted on the horizontal axis (X/Y=Variable)
and which variable will be incremented from one curve to the next (X/Y=Discrete) by
picking from the left combo box under the Diagram Settings title. Note that the surface
chart below shows the “Variable” variable (X or Y) on the two horizontal axes, and the
return value V(x,y) on the vertical axis.
The third diagram on this worksheet (the one on the left) shows a surface chart of the all
the V(x,y) points given in the lookup table, with X and Y values on the two horizontal axes,
and the return value (V) on the vertical axis.
The right combo box under the Diagram Settings title contains two options: Use Original
Limits and Extrapolated Limits. When Use Original Limits is selected, the minimum
and maximum limits for X and Y variables on the diagrams are the same as the minimum
and maximum values in the X-axis and Y-axis in the lookup table. If Extrapolated Limits
is chosen, the diagram limits are extended to also show the extrapolated values returned
by T2LOOKUP. How far the limits will be extended depends on the X_extrapolate and
Y_extrapolate values in the Parameters Table.
The #N/A Points combo box contains two options: Hide #N/A Points and Don’t Hide
#N/A Points. When Hide #N/A Points is selected, all #N/A points caused by missing or
invalid table values are removed from the line diagram. On a slow computer the process of
removing the #N/A points can take a long time. In that case you should select Don’t Hide
#N/A Points.
TriLookup™ Version 2.21 User’s Guide
109
Trimill Industrial Systems Inc.
In order to examine the two surface diagrams from any angle, you can use the horizontal
and vertical scroll bars in the top-right corner of the chart on the left to change their
rotation and elevation properties.
After changing any of the parameters, click on the [Recalculate Sheet] button to update all
tables and diagrams on the worksheet. This is necessary because the Calculation option
for this workbook is set to Manual.
TriLookup™ Version 2.21 User’s Guide
110
Trimill Industrial Systems Inc.
T3LOOKUP & T3LKP Interactive Example Worksheet
The large combo box in the top left corner of the worksheet offers a choice between using
the more complex T3LOOKUP or the simplified T3LKP function. When you switch from
one function to the other, all references to the function in the worksheet, as well as the lists
of parameters, are automatically updated. Note that in the remainder of the text below,
T3LOOKUP stands for either T3LOOKUP or T3LKP.
The Parameters Table in the top left corner of this worksheet allows you to interactively
change the parameters of the T3LOOKUP function by modifying the values in the cells
with a colored background. After you are done, click on the small [Calc] button in the top
left corner to recalculate and display the new T3LOOKUP Value in the large merged cell at
the top of the table. The Cell Formula cell shows the formula used to return the value
above it.
Note that the parameters in the Parameter Table that have a yellow background color also
affect the diagrams.
The lookup table for this example is given under the title Table, TableMA. It is a 3D (X-YZ) table that contains multiple 2D (X-Y for Z=const) tables. You can edit its X-axis, Y-axis,
Z-axis and data area cells in order to investigate how T3LOOKUP works on different data
sets. You can at any point restore the original data set by clicking on the [Restore Table]
button. Note that Restore Table won't work properly if you have inserted or deleted any
rows or columns in the table.
The combo box to the right of the [Restore Table] button lets you select between the
Single Area Table and Multi Area Table mode of specifying the Table_XYZ parameter to
be used throughout this worksheet. The sheet range name Table refers to a single area
range containing the whole 3D (X-Y-Z) lookup table, while the sheet range name TableMA
refers to a multiple area range containing an array of references to all individual 2D (X-Y,
for Z=const) tables that are a part of the 3D lookup table. Note that the T3LKP function can
only use the Multiple Area Table.
The table titled T3LOOKUP Returned Values for the Diagrams contains V(x,y,z) values
returned by T3LOOKUP for an array of closely spaced X, Y and Z values. It is used to plot
the two diagrams shown on this worksheet. The line diagram on top shows a series of
curves of T3LOOKUP returned values. You can chose which one of the three independent
variables (X, Y or Z) will be plotted on the horizontal axis (X/Y/Z=Variable), which variable
will be incremented from one curve to the next (X/Y/Z=Discrete) and which variable will be
kept constant (X/Y/Z=Constant) by picking from the left combo box under the Diagram
Settings title. The same settings will also apply to the surface chart below, which shows
the Variable and Discrete variables on the two horizontal axes and the return value
V(x,y,z) on the vertical axis, while keeping the Constant variable unchanged. The
Constant variable will have the value specified in the X_value, Y_value or Z_value cell in
the Parameters Table (depending on which one is set as constant).
The right combo box under the Diagram Settings title contains two options: Use Original
Limits and Extrapolated Limits. When Use Original Limits is selected, the minimum
and maximum limits for X, Y and Z variables on the diagrams are the same as the
minimum and maximum values in the X-axis, Y-axis, Z-axis in the lookup table. If
Extrapolated Limits is chosen, the diagram limits are extended to also show the
TriLookup™ Version 2.21 User’s Guide
111
Trimill Industrial Systems Inc.
extrapolated values returned by T3LOOKUP. How far the limits will be extended depends
on the X_extrapolate, Y_extrapolate and Z_extrapolate values in the Parameters Table.
The #N/A Points combo box contains two options: Hide #N/A Points and Don’t Hide
#N/A Points. When Hide #N/A Points is selected, all #N/A points caused by missing or
invalid table values are removed from the line diagram. On a slow computer the process of
removing the #N/A points can take a long time. In that case you should select Don’t Hide
#N/A Points.
In order to examine the surface diagram from any angle, you can use the horizontal and
vertical scroll bars in its top-right corner to change its rotation and elevation properties.
After changing any of the parameters, click on the [Recalculate Sheet] button to update all
tables and diagrams on the worksheet. This is necessary because the Calculation option
for this workbook is set to Manual.
You can click on the [Animate] button, located between the two diagrams, to see how the
returned values (and diagrams) change when the variable selected as X/Y/Z=Discrete is
incremented from its minimum to its maximum limit. The size of the increment depends on
the limits and the number of animation steps, which can be chosen through the Step cell to
the right of the [Animate] button.
Note: If you have a slow computer, the animation may take a long time to complete. You
can make it shorter by reducing the number of steps, by using linear interpolation
(by choosing X/Y/Z_interpolate = 4) and by setting Missing_pts = FALSE.
In order to interrupt the animation, press <Ctrl><Break> at any point and then click
on the [End] button in the dialog box.
TriLookup™ Version 2.21 User’s Guide
112
Trimill Industrial Systems Inc.
TVPOLYDATA & TPOLY Interactive Example Worksheet
The TVPOLYDATA Parameters Table in the top left corner of this worksheet allows you
to interactively change the parameters of the TVPOLYDATA function by modifying the
values in the cells with the yellow background. When you are done, click on the [Calc]
button to recalculate and display the first 2 rows and 7 columns of the array returned by
TVPOLYDATA. The first row contains the column headers and the second row holds the
values for the best fit curve (the one with the highest R²). The large merged cell at the top
of the table is reserved for the display of a detailed text error message in case
TVPOLYDATA returns an error.
The Cell Formula cell shows the array formula used to return the values above it. The
TOPLY(...) and Formula cells contain pasted Values of the TOPLY(...) and Formula cells
above.
Note that the parameters in TVPOLYDATA Parameter Table with a yellow background
color also affect the curves shown in the diagram.
The TPOLY Parameters Table below the TVPOLYDATA Parameter Table allows you to
interactively change the parameters of the TPOLY function by modifying the values in the
cells with the colored background. When you are done, click on the [Calc] button to
recalculate and display the value returned by the TPOLY function. Note that the formula
for calculating the TPOLY value shown in this table is set up in such a way that the
polynomial coefficients are retrieved from the TVPOLYDATA Returned Values (Array
Formula), from the row that that has the same Order as the Order parameter specified in
the TPOLY Parameters Table.
The lookup table for this example is given under the title Table. It is a 50-row 8-column
multi column table, with column titles in the topmost row of the table. You can edit the
column titles and data area cells in order to investigate how TVPOLYDATA works on
different data sets. You can at any point restore the original data set by clicking on the
[Restore Table] button. Note that Restore Table won't work properly if you have inserted
or deleted any rows or columns in the table.
The [Change # of Points to:] button, and the value in the yellow background cell to the
right, allow you to easily change the number of X-Y points in the lookup table to anywhere
between 2 and 49. The extra return rows are commented out and hidden. Note that when
you set the number of points to less than 49, you must set the Missing_pts parameter in
the TVPOLYDATA Parameters Table to TRUE.
The table titled TVPOLYDATA Returned Values (Array Formula) is a 22-row by 26column range of cells that contains TVPOLYDATA function entered as an array formula. It
shows all the values returned by TVPOLYDATA for a set of parameters given in the
TVPOLYDATA Parameters Table. The polynomial coefficients from this table are used to
plot the diagram at the top of this worksheet. The diagram shows five polynomial curves four with the highest order values returned by TVPOLYDATA, plus the one determined to
be the best fit curve. You can easily change the order of the displayed curves by
changing the Max_order parameter in the TVPOLYDATA Parameters Table. You can
also select different lookup column and return column by changing the Lookup_title and
Return_title values in TVPOLYDATA Parameters Table.
The smaller diagram below shows a plot of R² values versus the polynomial Order from
the data in the TVPOLYDATA Returned Values (Array Formula) table.
TriLookup™ Version 2.21 User’s Guide
113
Trimill Industrial Systems Inc.
The Forecast Forward and Forecast Back values above the main diagram set the lower
and upper limits for the X variable when calculating and displaying the polynomial curves.
They determine how far to go beyond the minimum and maximum values in the lookup
column of the lookup table.
After changing any of the parameters, click on the [Recalculate Sheet] button to update all
tables and diagrams on the worksheet. This is necessary because the Calculation option
for this workbook is set to Manual.
TriLookup™ Version 2.21 User’s Guide
114
Trimill Industrial Systems Inc.
TriLookup Practical Examples
This Excel workbook is provided as a part of TriLookup documentation. It contains
practical examples that demonstrate the use and capabilities of different TriLookup
functions.
Note: The practical examples given in this workbook have been taken from reference
literature for mechanical engineering. However, these examples were NOT meant
to provide any useful information, but only to demonstrate the use TriLookup
functions. Consequently, they should not be used for any other purpose.
Most of the examples in this workbook are set up in the following way. The table(s) on top
contain 4 types of cells (see example below):
•
No shading with black text – fixed labels;
•
Shaded green with black text – lookup values that the user must type in;
•
•
Shaded yellow with black text – lookup values that the user can either type
in or pick from a drop-down list;
No shading with blue text – values returned by a TriLookup function.
The large table below is the lookup table with data.
The worksheets in this workbook are NOT protected. When opened, this workbook sets
Excel’s Calculation option to Automatic.
If you wish to examine or change parameter values in a cell that contains a TriLookup
function, you can do that either manually by editing the cell formula text, or interactively by
selecting the cell and then clicking on the Paste Function button . For example, if a cell
contains the following formula:
=T2LOOKUP(5.5,0.9,$B$6:$E$10,4,4,1,,,,,,TRUE)
then selecting the cell and clicking on the Paste Function button
will invoke the
Formula Palette dialog box with the current values of the parameters already filled in:
TriLookup™ Version 2.21 User’s Guide
115
Trimill Industrial Systems Inc.
When you open this example workbook by clicking on Help | TriLookup Help | Example
Workbooks | Practical, it will be opened in read-only mode. If you wish to modify it, you
should save it under a different name.
The VBA code used in this workbook is not protected, and can freely be copied or modified
to suit any purpose. The workbook contains two custom sheet functions in the VBA module
mCustomFunctions: GasEnthalpy and GasTemperature. Both functions reference the
lookup table ‘EnthalpyTable’ on the worksheet ‘TVLOOKUP 2’.
TriLookup™ Version 2.21 User’s Guide
116
Trimill Industrial Systems Inc.
Glossary
Data Area
Data area is the region of the lookup table which contains the return values:
•
For T2LOOKUP and T2LKP functions, the data area is located in the body of the 2D
table, excluding the topmost row and the leftmost column.
•
For T3LOOKUP and T3LKP functions, the data areas are located in the body of
each component 2D table, excluding their topmost rows and leftmost columns.
Lookup Area
Lookup Area is the region of the lookup table which contains an array of values that are
compared to the lookup value:
•
For TVLOOKUP, TVLKP and TVPOLYDATA functions, the lookup area is the
Lookup Column, with the title (in the topmost cell) equal to the Lookup_title
parameter.
•
For THLOOKUP, THLKP and THPOLYDATA functions, the lookup area is the
Lookup Row, with the title (in the leftmost cell) equal to the Lookup_title parameter.
•
For T2LOOKUP, T2LKP, T3LOOKUP and T3LKP functions, the lookup areas for X,
Y and Z values are the X-axis, Y-axis and Z-axis, respectively.
Lookup Column
Lookup column is the column of the lookup table which contains an array of values that
are compared to the lookup value in TVLOOKUP, TVLKP and TVPOLYDATA
functions.
Which table column will be the lookup column is determined by the Lookup_title and
Index_mode parameters:
•
If the Index_mode parameter is omitted or it is set to FALSE, then the Lookup_title
parameter has to match the title of any one of the columns in the lookup table
(Table_array). Column titles are located in the topmost row of the lookup table.
•
If Index_mode is set to TRUE, then the Lookup_title parameter specifies the lookup
column index number (position of the lookup column in Table_array: 1 for the first
column, 2 for the second column, etc.), and it has to be a whole number between 1
and the number of columns in the lookup table (Table_array). Note that in this case
the column titles in the topmost row of Table_array are ignored.
Lookup Row
Lookup row is the row of the lookup table which contains an array of values that are
compared to the lookup value in THLOOKUP, THLKP and THPOLYDATA functions.
Which table row will be the lookup row is determined by the Lookup_title and
Index_mode parameters:
TriLookup™ Version 2.21 User’s Guide
117
Trimill Industrial Systems Inc.
•
If the Index_mode parameter is omitted or it is set to FALSE, then the Lookup_title
parameter has to match the title of any one of the rows in the lookup table
(Table_array). Row titles are located in the leftmost column of the lookup table.
•
If Index_mode is set to TRUE, then the Lookup_title parameter specifies the lookup
row index number (position of the lookup row in Table_array: 1 for the first row, 2 for
the second row, etc.), and it has to be a whole number between 1 and the number
of rows in the lookup table (Table_array). Note that in this case the row titles in the
leftmost column of Table_array are ignored.
Multi Area Table
A 3D table in which all component 2D tables are specified as separate areas in a
multiple area range of cells. The first 2D table is specified as the first area of the
range and the subsequent ones are listed after it. When using a Multi Area Table, only
the top-left cells need to be specified for the subsequent 2D tables and the values for
Table_Ygap and Table_Ysize parameters are ignored.
When specifying a multiple area range as the Table_XYZ parameter, you must enclose
it in parentheses. Otherwise, it will be interpreted as more than one parameter, which
will cause an error.
Note: All component 2D tables must be located on a same worksheet.
Applies to T3LOOKUP and T3LKP Table_XYZ parameter, which specifies a 3D lookup
table that contains multiple 2D tables. Each 2D table is a rectangular range of cells and
corresponds to a different Z-axis value. All component 2D tables must be the same size
in horizontal (X) and vertical (Y) direction as the first 2D table.
Note: The T3LKP function can only use multi area tables.
Return Column
Return column is the region of the lookup table which contains the return values in
TVLOOKUP, TVLKP and TVPOLYDATA functions.
Which table column will be the return column is determined by the Return_title and
Index_mode parameters:
•
If the Index_mode parameter is omitted or it is set to FALSE, then the Return_title
parameter has to match the title of any one of the columns in the lookup table
(Table_array). Column titles are located in the topmost row of the lookup table.
•
If Index_mode is set to TRUE, then the Return_title parameter specifies the return
column index number (position of the return column in Table_array: 1 for the first
column, 2 for the second column, etc.), and it has to be a whole number between 1
and the number of columns in the lookup table (Table_array). Note that in this case
the column titles in the topmost row of Table_array are ignored.
Return Row
Return row is the region of the lookup table which contains the return values in
THLOOKUP, THLKP and THPOLYDATA functions.
Which table row will be the return row is determined by the Return_title and
Index_mode parameters:
TriLookup™ Version 2.21 User’s Guide
118
Trimill Industrial Systems Inc.
•
If the Index_mode parameter is omitted or it is set to FALSE, then the Return_title
parameter has to match the title of any one of the rows in the lookup table
(Table_array). Row titles are located in the leftmost column of the lookup table.
•
If Index_mode is set to TRUE, then the Return_title parameter specifies the return
row index number (position of the return row in Table_array: 1 for the first row, 2 for
the second row, etc.), and it has to be a whole number between 1 and the number
of rows in the lookup table (Table_array). Note that in this case the row titles in the
leftmost column of Table_array are ignored.
Shareware
Shareware lets you try a program for a period of time before you buy it. Since you've
tried a shareware program, you know whether it will meet your needs before you pay
for it. If you use this program for a longer time than the specified trial period (30 days),
you are expected to register it. A licensed version of this product includes the
permanent right to use the product for an unlimited time. The licensed version also
disables the registration screen when starting the program.
Single Area Table
A 3D table in which all component 2D tables are contained in a single rectangular
range of cells, with the first 2D table on top and the subsequent ones below it. In order
for the T3LOOKUP function to be able to differentiate between individual 2D tables, you
must specify the correct values for Table_Ygap and Table_Ysize parameters.
Applies to T3LOOKUP Table_XYZ parameter, which specifies a 3D lookup table that
contains multiple 2D tables. Each 2D table is a rectangular range of cells and
corresponds to a different Z-axis value. All component 2D tables must be the same size
in horizontal (X) and vertical (Y) direction as the first 2D table.
Note: The T3LKP function cannot use single area tables.
X-axis
X-axis is a row of X lookup values in a 2D (X-Y) or a 3D (X-Y-Z) lookup table. In a
2D lookup table X-axis is located in the topmost row of the lookup table, excluding
the top left cell. In a 3D lookup table X-axis is located in topmost row of the first 2D
table, excluding the top left cell.
Y-axis
Y-axis is a column of Y lookup values in a 2D (X-Y) or a 3D (X-Y-Z) lookup table. In
a 2D lookup table Y-axis is located in the leftmost column, excluding the top left cell.
In a 3D lookup table Y-axis is located in leftmost column of the first 2D table,
excluding the top left cell.
Z-axis
Z-axis is an array Z lookup values in a 3D (X-Y-Z) lookup table. The Z-axis cells are
located in the top left corner cells of each component 2D table.
TriLookup™ Version 2.21 User’s Guide
119