1
M-PLOT 2001
product manual
user manual
M-PLOT 2001
user manual
Document number 003.2001.02-e
19. September 2001
AUTHOR
Written and illustrated by Markus Meinl.
PDF document created with Adobe Distiller.
© 1996-2001, M-QUEST Software Corporation - All rights reserved.
The information in this book is published without regard for a possible patent protection. Product names are used without guarantee of the free usability. During the compiling of texts and illustrations was proceeded with greatest care. In spite of that, mistakes
cannot be excluded completely. M-QUEST and the author cannot take over either legal
responsibility or any liability for erroneous information and their results.
All rights reserve, also the one of the photomechanical fabrication and the retention in
electronic media. The industrial use of the software is only permissible if this rightvalidly was acquired.
SDRC, I-DEAS, I-DEAS Master Series, Drafting, Drafting Detailing and Master Drafting are registered trade marks of Structural Dynamics Research Corporation, HP, HPUX, HP-GL, HP-GL/2, RTL and PCL are registered trade marks of Hewlett Packard
Company, PostScript, PS, EPS, PDF, Acrobat Reader and Distiller are registered trade
marks of Adobe Systems Incorporation, ESC/P2 and EPSON are registered trade marks
of SEICO and EPSON Corporation, sgi and IRIX are registered trade marks of Silicon
Graphics Incorporation, AIX and IBM are registered trade marks of International Business Corporation, Solaris and SUN are registered trade marks of Sun Microsystems Incorporation, Windows and Windows NT, Windows 2000, Windows 95 and Windows
98 are registered trade marks of Microsoft Corporation, Intel is a registered trade mark
of Intel Corporation, CorelDRAW and Corel are registered trade marks of Corel Corporation.
M-PLOT, user manual
Document number 003.2001.02-e
Table of contents
Table of contents
I.
Introduction
xix
What you should know before you read this book...................................................
xx
What this manual includes .......................................................................................
xxi
Further information .................................................................................................. xxii
Conventions.............................................................................................................. xxii
1.
Working with M-PLOT
23
Start and Exit of M-PLOT........................................................................................
24
Start on the console .............................................................................................
24
Example of UNIX platforms..........................................................................
25
Example of Windows NT/2000 .....................................................................
25
Start as a shortcut ................................................................................................
25
Exit ......................................................................................................................
25
Properties of the main window.................................................................................
26
Commands in the action bar.....................................................................................
27
Menu "File".........................................................................................................
27
Menu "Settings" ..................................................................................................
27
Menu "Help" .......................................................................................................
28
v
M-PLOT: Table of contents
2.
vi
Browse the operating system environment..............................................................
28
Set file types .......................................................................................................
29
Display selected file ...........................................................................................
30
Select files for plot jobs .....................................................................................
30
Start/Stop plot process.............................................................................................
31
Change output filters ..........................................................................................
31
Restore modifications on output device .............................................................
32
Number of plots..................................................................................................
32
Remove files from plot list.................................................................................
32
Preview pictures with M-PREV
33
Start and Exit of M-PREV.......................................................................................
34
Start on the console ............................................................................................
34
Example of UNIX platforms .........................................................................
35
Example of Windows NT/2000 ....................................................................
35
Start as a shortcut ...............................................................................................
35
Exit .....................................................................................................................
35
Properties of the main window................................................................................
36
Commands in the action bar ....................................................................................
37
Menu "File" ........................................................................................................
37
Menu "Settings" .................................................................................................
38
Menu "Help".......................................................................................................
38
Commands in the icon bar .......................................................................................
39
Show individual images .....................................................................................
39
Printing image file ..............................................................................................
39
Zoom...................................................................................................................
40
Resize .................................................................................................................
40
Call from M-PLOT..................................................................................................
41
Table of contents
3.
4.
M-PLOT and external applications
43
Prerequisite...............................................................................................................
44
Declare SDRC environment in M-QUEST .........................................................
44
Example of UNIX platforms..........................................................................
44
Example of Windows NT/2000 .....................................................................
45
Adapt SDRC environment ..................................................................................
45
Check the communication...................................................................................
45
Drafting Detailing and Master Drafting...................................................................
46
Macro menu ........................................................................................................
47
Selection of the file format ............................................................................
47
Selection of the drawing sheets......................................................................
48
Selection of the print area ..............................................................................
48
Print parameter ....................................................................................................
49
Settings................................................................................................................
50
I-DEAS Master Series ..............................................................................................
51
Macro menu ........................................................................................................
52
Print parameter ....................................................................................................
53
Problems during the creation of the picture file..................................................
53
Update ......................................................................................................................
54
Printing in the background
55
Start of M-PLOT batch ............................................................................................
56
Example of UNIX platforms ...............................................................................
58
Example of Windows NT/2000 ..........................................................................
58
Special notes .......................................................................................................
58
vii
M-PLOT: Table of contents
5.
viii
Print pictures with M-PRINT
59
Start of M-PRINT....................................................................................................
60
Start of M-PRINT from external applications.........................................................
61
Example of UNIX platforms ..............................................................................
63
Example of Windows NT/2000..........................................................................
63
Properties of the main window................................................................................
64
Output device .....................................................................................................
65
Print range ..........................................................................................................
66
Copies.................................................................................................................
66
Style information on output format ....................................................................
67
Properties of an output filter....................................................................................
68
Picture dimensions .............................................................................................
69
Print quality ........................................................................................................
69
Paper size............................................................................................................
70
Output size..........................................................................................................
71
Paper size ......................................................................................................
71
Size ................................................................................................................
71
Scale ..............................................................................................................
72
Resolution .....................................................................................................
72
Orientation..........................................................................................................
73
Color output........................................................................................................
73
Dither image .......................................................................................................
74
Rendering ...........................................................................................................
75
Color correction..................................................................................................
76
Compression.......................................................................................................
77
Smoothing of the color palette (JPEG) ..............................................................
78
Coding operation (JPEG) ...................................................................................
78
Version of the output format (PDF) ...................................................................
79
Table of contents
6.
Simplify...............................................................................................................
80
Profiles (CGM) ...................................................................................................
81
File type (CGM)..................................................................................................
82
Paper bin..............................................................................................................
83
Output bin............................................................................................................
83
Features ...............................................................................................................
83
Preview.....................................................................................................................
84
Preview pictogram...............................................................................................
85
Enhance rendering..........................................................................................
85
Options ................................................................................................................
85
State.....................................................................................................................
88
Special feature..........................................................................................................
89
The use of weight filters
90
Call of the dialog box "Weight filters" ....................................................................
91
From M-ADMIN.................................................................................................
91
From M-PLOT or M-PREV ................................................................................
91
Properties of the main view......................................................................................
92
Create, change or delete entry in list...................................................................
93
Define standard pallet for weight filters ..................................................................
95
Notebook: Color table .........................................................................................
96
Notebook: Line table...........................................................................................
98
Properties of the weight filter................................................................................... 100
Notebook: Color table ......................................................................................... 100
Notebook: Line table........................................................................................... 101
Notebook: Colors ................................................................................................ 102
Notebook: Lines .................................................................................................. 103
Further information .................................................................................................. 104
ix
M-PLOT: Table of contents
7.
8.
x
The use of color filters
106
Call of the dialog box "Color filters" ......................................................................
107
From M-ADMIN ................................................................................................
107
From M-PLOT or M-PREV ...............................................................................
107
Properties of the main view.....................................................................................
108
Create, change or delete entry in list ..................................................................
109
Properties of the color filter ....................................................................................
111
Notebook: Color table ........................................................................................
111
Notebook: Color assignment ..............................................................................
113
Further information .................................................................................................
114
The use of style filters
116
Call of the dialog box "Style filters" .......................................................................
117
From M-ADMIN ................................................................................................
117
From M-PLOT or M-PREV ...............................................................................
117
Properties of the main view.....................................................................................
118
Create, change or delete entry in list ..................................................................
119
Properties of the style filter .....................................................................................
121
Border dimensions..............................................................................................
122
External settings .................................................................................................
124
Default settings...................................................................................................
126
Further information .................................................................................................
128
Table of contents
9.
Setting-up of device filters
130
Call of the dialog box "Device filters" ..................................................................... 131
From M-ADMIN................................................................................................. 131
From M-PLOT or M-PREV ................................................................................ 131
Properties of the main view...................................................................................... 132
Create, change or delete entry in list................................................................... 133
Choose a new output filter ....................................................................................... 135
File filter (translator)........................................................................................... 137
Emulation ............................................................................................................ 138
HP-GL (Graphic Language)........................................................................... 138
HP-GL/2 (Graphic Language Extended) ....................................................... 139
HP-RTL (Raster Transfer Language) ............................................................ 139
HP-PCL (Printer Command Language) ......................................................... 140
HP-PCL/GL2.................................................................................................. 140
Epson ESC/P2 ................................................................................................ 141
Adobe PS (PostScript) ................................................................................... 141
Adobe EPS (Encapsulated PostScript)........................................................... 142
Adobe PDF (Portable Document Format) ..................................................... 142
TIFF (Tagged Image File Format) ................................................................. 143
JPEG (Join Photographic Experts Group) ..................................................... 143
PNG (Portable Network Graphics) ................................................................ 143
PFF (Picture Formated File) .......................................................................... 144
CGM (Computer Graphics Metafile)............................................................. 144
xi
M-PLOT: Table of contents
A.
B.
xii
Properties of the device filter ..................................................................................
145
Modifications on current device.........................................................................
145
External settings .................................................................................................
146
Print commands..................................................................................................
147
Change print command .................................................................................
148
Restrictions..............................................................................................................
149
Set new criteria...................................................................................................
150
Unknown host/user.............................................................................................
150
Selection according to registered host/user........................................................
151
Further information .................................................................................................
153
M-PLOT installation
154
The directory structure of M-PLOT ........................................................................
155
cmd.win and cmd.unix directory.......................................................................
156
mplot directory ..................................................................................................
157
custom directory ................................................................................................
157
M-PLOT parameter .................................................................................................
158
Examples
162
Example 1................................................................................................................
163
What you learn in this example..........................................................................
163
Starting position .................................................................................................
163
What can the customer do for us? .................................................................
163
How do we want to proceed? ........................................................................
163
Create a new weight filter ..................................................................................
165
Create new color table for customer ..................................................................
166
Check line table..................................................................................................
170
Assign a specific color to a line weight .............................................................
171
Table of contents
Assign line type to a specific line weight ........................................................... 173
Save new weight filter......................................................................................... 174
How can I access this weight filter?.................................................................... 175
Practices .............................................................................................................. 176
Different pen assignment on pen plotter........................................................ 176
Line weights are constantly too thick on a printer......................................... 177
Line weights are not correct on a printer ....................................................... 178
A specific color can not be evaluated ............................................................ 179
Example 2................................................................................................................. 180
What you learn in this example........................................................................... 180
Starting position .................................................................................................. 180
What can the customer do for us?.................................................................. 180
How do we want to proceed?......................................................................... 180
Create a new color filter...................................................................................... 181
Extend colors for customer ................................................................................. 182
Assign new colors ............................................................................................... 184
Save new color filter ........................................................................................... 185
How can I access this color filter? ...................................................................... 186
Practices .............................................................................................................. 187
Make modifications on drawing visible......................................................... 187
Archive external file formats ......................................................................... 188
Example 3................................................................................................................. 189
What you learn in this example........................................................................... 189
Starting position .................................................................................................. 189
Create a new style filter for FEM........................................................................ 190
Modify properties................................................................................................ 191
Save new style filter ............................................................................................ 192
How can I access these style filters?................................................................... 193
xiii
M-PLOT: Table of contents
xiv
Example 4................................................................................................................
194
What you learn in this example..........................................................................
194
Starting position .................................................................................................
194
Organize device list ............................................................................................
195
Shift filters CGM and SDRC ........................................................................
196
Deleting of the submenu "Raster/Image Formats"........................................
196
Deleting of the submenu "Printer Formats" ..................................................
197
Add a new submenus.....................................................................................
198
Install color plotter for design department .........................................................
199
Check default values of the device filter.......................................................
206
Replace or update device drivers from library..............................................
206
Replace or update device drivers manually ..................................................
207
Save modified device filters ...............................................................................
208
Install color printer for design department.........................................................
208
Install laser printer for operations and design department .................................
209
Install FEM document program..........................................................................
211
PDF archive for PDM system ............................................................................
214
Example of a script file for Windows NT/2000............................................
214
CGM file for CorelDRAW.................................................................................
217
Adapt the CorelDRAW filter ........................................................................
218
Comments................................................................................................................
222
Illustrations
Illustrations
Illustration 1-1
Main window of M-PLOT ...........................................................
26
Illustration 2-1
Main window of M-PREV ...........................................................
36
Illustration 3-1
File format selection.....................................................................
47
Illustration 3-2
Selection drawing sheets..............................................................
48
Illustration 3-3
Print area selection.......................................................................
48
Illustration 3-4
Macro menu in I-DEAS ...............................................................
52
Illustration 5-1
Main window of M-PRINT..........................................................
64
Illustration 5-2
Properties of an output filter ........................................................
68
Illustration 5-3
Print preview of M-PRINT ..........................................................
84
Illustration 6-1
Weight filters - Main view ...........................................................
92
Illustration 6-2
Weight filters - Palette, notebook "Color table"..........................
96
Illustration 6-3
Weight filters - Palette, color selection........................................
97
Illustration 6-4
Weight filters - Palette, notebook "Line table"............................
98
Illustration 6-5
Weight filters - Line definition ....................................................
99
Illustration 6-6
Weight filter - Notebook "Color table" ....................................... 100
Illustration 6-7
Weight filter - Notebook "Line table".......................................... 101
Illustration 6-8
Weight filter - Notebook "Color" ................................................ 102
Illustration 6-9
Weight filter - Notebook "Line"................................................... 103
xv
M-PLOT: Illustrations
xvi
Illustration 7-1
Color filters - Main view.............................................................
108
Illustration 7-2
Color filter - Notebook "Color table" .........................................
111
Illustration 7-3
Color filter - Color selection .......................................................
112
Illustration 7-4
Color filter - Notebook "Color assignment" ...............................
113
Illustration 8-1
Style filters - Main view..............................................................
118
Illustration 8-2
Style filter - Properties ................................................................
121
Illustration 8-3
Style filter - Margin settings........................................................
122
Illustration 8-4
Style filter - Picture origins .........................................................
123
Illustration 9-1
Device filters - Main view...........................................................
132
Illustration 9-2
Device filter - New device filter from library ............................
135
Illustration 9-3
Device filter - Properties of the selected device filter.................
145
Illustration 9-4
Device filter - Change print command for device filter ..............
148
Illustration 9-5
Device filters - Activating restriction of the device list ..............
149
Illustration 9-6
Device filters - Example of restriction on a workstation ............
152
Illustration A-1 M-PLOT directory tree, part 1 ....................................................
155
Illustration A-2 M-PLOT directory tree, part 2 ....................................................
156
Illustration B-1 Example 1 - Create a new weight filter.......................................
165
Illustration B-2 Example 1 - Create a new color table .........................................
167
Illustration B-3 Example 1 - Mix a new color ......................................................
168
Illustration B-4 Example 1 - Updated color table with new mixed color.............
169
Illustration B-5 Example 1 - Use standard line table............................................
170
Illustration B-6 Example 1 - Assign colors to a line weight.................................
172
Illustration B-7 Example 1 - Assign line type to a line weight.............................
173
Illustration B-8 Example 1 - Selection of the new weight filter in M-PRINT .....
175
Illustration B-9 Example 2 - Create a new color filter .........................................
181
Illustration B-10 Example 2 - Define a new output color.......................................
182
Illustration B-11 Example 2 - Mix color "water-blue" ...........................................
183
Illustration B-12 Example 2 - Expanded color list .................................................
183
Illustrations
Illustration B-13 Example 2 - Assign output colors ................................................ 184
Illustration B-14 Example 2 - Selection of the new color filter in M-PRINT......... 186
Illustration B-15 Example 3 - Style filter for FEM ................................................. 189
Illustration B-16 Example 3 - Create new style filter.............................................. 190
Illustration B-17 Example 3 - Settings for FEM style filter .................................... 191
Illustration B-18 Example 3 - Selection of the new style filter in M-PRINT ......... 193
Illustration B-19 Example 4 - Current device filters ............................................... 195
Illustration B-20 Example 4 - Reordered device list ............................................... 198
Illustration B-21 Example 4 - Install color plotter for design dep........................... 199
Illustration B-22 Example 4 - Select plotter from device library ............................ 200
Illustration B-23 Example 4 - Integrated color plotter into device list.................... 201
Illustration B-24 Example 4 - Properties of the color plotter.................................. 202
Illustration B-25 Example 4 - Enter print command ............................................... 204
Illustration B-26 Example 4 - Set print command for color plotters....................... 205
Illustration B-27 Example 4 - Defaults of color plotter .......................................... 206
Illustration B-28 Example 4 - Create FEM documentation..................................... 211
Illustration B-29 Example 4 - Print command for FEM program ........................... 212
Illustration B-30 Example 4 - Inquiry mask of FEM program ................................ 213
Illustration B-31 Example 4 - Install PDF filter for PDM system........................... 215
Illustration B-32 Example 4 - Command line for external script file...................... 216
Illustration B-33 Example 4 - Install CGM filter for CorelDRAW ........................ 217
xvii
M-PLOT: Illustrations
xviii
Introduction
I. Introduction
This documentation describes the print program M-PLOT and the additional help programs. M-PLOT is a component of the M-QUEST product family and can be used
seamlessly with all other products of M-QUEST.
xix
M-PLOT: Introduction
What you should know before you read this book
This manual provides that you are familiar with your operating system. Commands and
instructions for the different platforms are performed separately. If you work on a
UNIX platform, it is provided that you understand the most important UNIX commands. You should also be able to set-up a print queue.
M-PLOT does not arrange any print queue. These must already be installed and to be
functional. If a print out does not appear on the output device, the error does not have to
appear urgent at M-PLOT. Therefore it is necessary that you understand the cycle of
operations of your printer queue.
xx
Introduction
What this manual includes
This manual contains following chapters:
· Chapter 1, "Working with M-PLOT" presents a survey of the graphical user interface of M-PLOT, the peculiarities and the commands for the call on the console.
· Chapter 2, "Preview pictures with M-PREV" allows the viewing of the supported
input formats. The graphical user interface and the call on the console are described
shortly.
· Chapter 3, "M-PLOT and external applications" show starting of M-PLOT from external programs. It is shown the necessary settings and the graphical user interface.
· Chapter 4, "Printing in the background" describes the M-PLOT batch enhancements.
This application converts all input files into the corresponding output formats in the
background. No graphical user interface occurs to the user.
· Chapter 5, "Print pictures with M-PRINT" present a survey of the instructions for
the conversion of the output format. These settings are directly used by all M-PLOT
applications.
· Chapter 6, "The use of weight filters" describes the procedure for the evaluation of
graphics attributes. The input format is evaluated by means of the defined thickness
information and modified the output format directly.
· Chapter 7, "The use of color filters" explained how input colors are exchanged in
simple way into new output colors.
· Chapter 8, "The use of style filters" show, as the appearance of the output format
simply and fast can be changed.
· Chapter 9, "Setting-up of device filters" describes the procedure for the setting-up,
the changing and the deleting of device filters. The releasing of devices to a certain
host or users is explained by means of an example.
· Appendix A, "M-PLOT installation" allows the optimal tuning of M-PLOT. The
setup of the parameter files and the directory structure are explained.
· Appendix B, "Examples" explained the different setting possibilities of M-PLOT.
Solutions are shown from the experience of the previous version by means of simple
examples.
xxi
M-PLOT: Introduction
Further information
M-PLOT is integrated in the M-QUEST architecture. Central settings, the administration and the licensing are guaranteed through other products. For further information
please consult the corresponding manuals.
· M-ADMIN 2001 configures all M-QUEST products, the work environment and as
well as the external applications.
· M-LOCK 2001 describes the licensing of M-QUEST products and the installation of
a license server.
Conventions
Subsequently the conventions are listed which ones are used in this manual:
· Bold - highlights and window names.
· Italic - buttons, entry names and notebooks.
· Normal - general text.
· "Quotation mark" - menu title and sub menus.
· Fix width - file names, directories, environment variables, source code, examples
and command syntax.
· Bold and fix width - input through customers, keyboard commands <Ctrl> are
marked between < and > sign.
Quotation marks are also used, when the text is not contiguous within the context. A
button becomes characterized with "New entry…".
xxii
Working with M-PLOT
1. Working with M-PLOT
M-PLOT is a stand alone application for viewing and printing of image files and Drafting drawings directly on operating system level. All input formats can be sent to a
printer queue and all of them can be converted at the same time.
Restriction:
Input formats of Drafting can only be converted when the program draftbatch is installed and a valid Drafting license is present. If you are working with I-DEAS 8 or
higher, the Drafting drawings are ignored.
23
M-PLOT: Chapter 1
Start and Exit of M-PLOT
M-PLOT can be started in different kind and manner. For which kind you decide depends on the type of use and the available operating system.
In this manual we go out that the search path is set-up to the start directory of the MQUEST installation. To find out more for this purpose please contact the user manual
M-ADMIN 2001.
Start on the console
In order to start M-PLOT on the console, use following syntax:
mplot ?-option, -option ...? ?file, file ...?
An option begins always with a minus sign (-).
Option
Description
-h
Lists all available options. M-PLOT is not started.
-lx
Switches the user language. The placeholder (x) is to replace with one
of the following numbers:
0 - English, 1 - French, 2 - German and 3 - Italian.
-rf
Removes all input files, which were declared in the argument string.
Please be careful with this option.
As arguments as many as desired input files can be delivered. These can be local or provided with absolute paths. Environment variables can be used also. These must be set
during the startup and must be valid.
24
Working with M-PLOT
Example of UNIX platforms
$ mplot
$ mplot -l2 $HOME/ideas/8.501000.dwg
$ mplot test.pff /data/pff/*.pff
Example of Windows NT/2000
> mplot
> mplot -l2 %HOMEPATH%\ideas\8.501000.dwg
> mplot test.pff D:\data\pff\*.pff
Start as a shortcut
M-PLOT can be run also via a shortcut. This cycle of operations is applied under Windows NT/2000. If you work on a UNIX platform, you can make also a shortcut on your
desktop. Please consult for this purpose the manual of your operating system manufacturer.
Remark:
During the installation of M-PLOT the shortcut icon is created under Windows
NT/2000 automatically. If that is not the case, this can be done also manually. Please
consult for this purpose the online help of Windows NT/2000.
You can do a double click on the icon and M-PLOT starts. The language cannot be
changed directly. The shortcut must be edited for this purpose. You add for this purpose
the option -lx at the end of the command. The (x) corresponds in this case to the languages: 0 = English, 1 = French, 2 = German and 3 = Italian.
Exit
In order to exit M-PLOT, choose "Exit" in the menu "File". All hanging jobs are
stopped, open previews are closed and the console released.
25
M-PLOT: Chapter 1
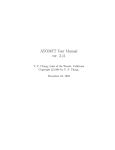
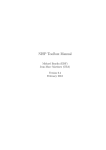
Properties of the main window
If M-PLOT is started, the main window appears. This is divided as follows:
· An action bar with commands for the call of further instructions. Instructions, which
are acting at other places, are not performed in the action bar.
· The operating system environment tree. The startup path can be set in the parameter
file. If this is not set or unavailable, the current start directory is used by M-PLOT.
· Selection menu for the input filters. If the filter is changed, all paths are updated below the marked folder.
· File list for the printing process. All ready input files for the conversion are listed.
The sequence is determined by the selection. If M-PLOT is executed with an argument string of input files, these are brought in this list.
· Status bar for output of information like process state, file size etc..
Illustration 1-1
26
Main window of M-PLOT
Working with M-PLOT
Commands in the action bar
The instruction set was reduced to the minimum. For that you find only few menu
commands in the action bar.
Menu "File"
Command
Description
"Exit"
Terminates M-PLOT. All open previews and existing jobs in
the process list are exited. This command can also be executed directly from the keyboard with <Ctrl><x>.
Menu "Settings"
When you are not the author on the file mplot.set, or you don't have any write authorizations on this file, the command is disabled. Following instructions stand for the
selection:
Command
Description
"Weight filters..."
Colors or line types can be assigned to specific line weights.
The settings are in the file mplot.wgt stored (see also chapter 6).
"Color filters..."
The input colors can be converted into new output colors.
All settings are stored in the file mplot.map (see chapter 7).
"Style filters..."
You can generate your own printing styles and store it into
the file mplot.sty (see chapter 8).
"Device filters..."
New device filters can be arranged. Restrictions can be set to
registered users or host names. The settings are stored in the
file mplot.set (see chapter 9).
27
M-PLOT: Chapter 1
Menu "Help"
Command
Description
"User manual"
Opens this document with the external application "Adobe Acrobat Reader".
"Version..."
The current M-PLOT version is shown to you.
Browse the operating system environment
On the operating system environment you can directly view drawings and image files or
mark drawings and image files for the printing process.
Directories are opened or closed by a double click. The same can be achieved, when
you click on the directory indicator or . If no files are displayed below the marked directory, no files are available according to the file filter. The indicator disappears and
becomes first again visible, when you open the parent directory.
28
Working with M-PLOT
Set file types
The filter file types help you to list only the files that are valid input formats for MPLOT. Following input formats are supported:
Filter
Extension Format
Description
"SDRC picture file"
pff
- ASCII
The binary format *.pfb as well as the encouraged image file *.pfr are not supported.
"SDRC Drafting"
dwg
asc
- Binary
- Text
Until I-DEAS MS7, the local Drafting drawings can be
read directly. For this purpose, the application draftbatch is necessary.
"CGM meta file"
cgm
- Binary
- CALS
- ASCII
Only the CGM 1.0 release is supported. All other releases cause an error message.
"TIFF image file "
tiff
tif
- Uncompressed
- Packbits
- Fax CCITT G3
- Fax CCITT G4
- CCITT RLE
Reads all TIFF pictures to and with release 6.0. The
color formats RGB, gray, color pallet and monochrome
are supported. The compression LZW is not supported
from license reasons.
"JPEG image file "
jpeg
jpg
all of them
Reads all JPEG pictures to and with release 6.2. The
color formats RGB, gray and color pallet are supported.
"PNG image file"
png
all of them
The complete standard is supported. The alpha channel
is evaluated too.
"All files"
All listed filters are considered. The Drafting filter is
not considered when the I-DEAS version is larger than
eight.
Was the file structure meanwhile changed, this will not be updated automatically in MPLOT. This can be done manually when you close and open the directory again. That
can be done by clicking onto the directory indicator or through a double click on the
directory names.
29
M-PLOT: Chapter 1
Display selected file
With a double click onto the selected row, the linked display application is opened. The
display applications can be defined in the M-QUEST parameter file. If several files are
selected, the command is vain.
If a Drafting drawing is opened, the command line application draftbatch must be installed and a valid Drafting license must be present. When the display application was
not changed in the M-QUEST parameter file, the drawing is first converted into a PFF
file. The new image file receives a name extension and is stored in the temporary directory of M-PLOT. You can define Drafting to be the display application. Change for this
purpose the M-QUEST parameter file.
Remark:
When you work with I-DEAS 8 or higher, you cannot consider any Drafting drawing
directly of the operating system level. It simply takes to much time to load the complete
I-DEAS module in memory.
Select files for plot jobs
You can mark individual files with the <Ctrl> or <Shift> key. Through pressing and
moving the left mouse button selects several file. Press then the right mouse button. A
menu appears at the mouse pointer and you can move the selected files into the right
window, when you select the command "Mark for plot". The location of the original
files does not change in this case. Only a reference is made.
You can change at any time into other directories and select further files to move them
to the plot process list. M-PLOT notices the locations of the original files. When you
moved too many files, select these files in the right window and press the right mouse
button. You can remove them by the command "Remove plot" from the plot process
list.
30
Working with M-PLOT
Start/Stop plot process
You can start the plot process. All files in the right window are converted upon request
into the output format and sent according to the specifications to the output filters.
Since the requests can be very different, you have some possibilities to handle the output.
A double click onto an input format does not start the display application M-PREV. In
this case the application M-PRINT is started. You can look up more precise information
in the chapter 5.
The plot process can be started if the button "Start plot" is pressed. The text of the button changes in "Stop plot" and allows you to halt the plot process at any time. A file,
which just is converted, cannot be aborted. All further files are stopped. M-PLOT
marks out the file, which is just in process. You will see that at the printer symbol.
Remark:
According to the size of the file, which just is in process, the abnormal exit of the plot
process can use some time.
Change output filters
If at least a file is available in the job list, the standard output filter is set automatically.
This corresponds not to the default printer of your operating system, but to the standard
output filter in M-PLOT.
If you do not agree with the specification, you can select the files and press the right
mouse button. Choose the menu "Change device". A new submenu opens. You see all
installed output device filters. Select the desired filter and the entry in M-PLOT
changes.
31
M-PLOT: Chapter 1
Restore modifications on output device
When you changed the filter parameters in M-PRINT and you are not anymore sure,
then you can set the settings at any time back to the initial status. The specifications are
set to the selected output filter.
Select for this purpose the input file and press the left mouse button. Choose then the
command "Set to default". The yellow printer symbol switches to the standard icon.
Number of plots
The number of plots (copies) can be modified directly. You do not need to start MPRINT at any time.
Select the desired inputs formats and press the right mouse button. You can select the
number directly by the provided submenu if the number is not higher than copies. If
number is greater than four, select the command "n copies… ". A new window opens
and you can enter a value up to 999.
This command you can select also directly about the keyboard. Press for this purpose
the <Ctrl> key and then a number between 1 and 4.
Remove files from plot list
When you should have by mistake selected too many files in the list, then you can remove them very simply. The files will not be deleted on the operating system. Only the
intern linking is removed.
Select the files, that you do not need anymore and press the right mouse button. Choose
the command "Remove plots" and the files are removed.
32
Preview pictures with M-PREV
2. Preview pictures with M-PREV
The display application of M-PLOT with the short name M-PREV makes the displaying of all input files of M-PLOT possible. The command set is still limited, nevertheless
the files can be displayed very simply and fast.
Also image files with several individual images can be displayed. For every picture an
own page is created. You can look at every picture individually.
33
M-PLOT: Chapter 2
Start and Exit of M-PREV
M-PREV can be started in different kind and manner. For which kind you decide depends on the type of use and the available operating system.
In this manual we go out that the search path is set-up to the start directory of the MQUEST installation. To find out more for this purpose please contact the user manual
M-ADMIN 2001.
Start on the console
In order to start M-PREV on the console, use following syntax:
mprev ?-option, -option ...? ?file?
An option begins always with a minus sign (-).
Option
Description
-h
Lists all available options. M-PLOT is not started.
-lx
Switches the user language. The placeholder (x) is to replace with one
of the following numbers:
0 - English, 1 - French, 2 - German and 3 - Italian.
As arguments only one input file can be delivered. This can be local or provided with
absolute path. Environment variables can be used also. These must be set during the
startup and must be valid.
34
Preview pictures with M-PREV
Example of UNIX platforms
$ mprev
$ mprev -l2 $HOME/ideas/8.501000.pff
$ mprev test.pff
Example of Windows NT/2000
> mprev
> mprev -l2 %HOMEPATH%\ideas\8.501000.pff
> mprev D:\data\pff\test.pff
Start as a shortcut
M-PREV can be run also via a shortcut. This cycle of operations is applied under Windows NT/2000. If you work on a UNIX platform, you can make also a shortcut on your
desktop. Please consult for this purpose the manual of your operating system manufacturer.
Remark:
During the installation of M-PREV the shortcut icon is created under Windows
NT/2000 automatically. If that is not the case, this can be done also manually. Please
consult for this purpose the online help of Windows NT/2000.
You can do a double click on the icon and M-PREV starts. The language cannot be
changed directly. The shortcut must be edited for this purpose. You add for this purpose
the option -lx at the end of the command. The (x) corresponds in this case to the languages: 0 = English, 1 = French, 2 = German and 3 = Italian.
Exit
In order to exit M-PREV, choose "Exit" in the menu "File". M-PREV is closed and the
console released.
35
M-PLOT: Chapter 2
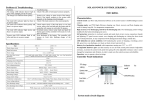
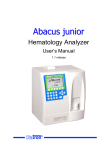
Properties of the main window
If M-PREV is started, the main window appears. This is divided as follows:
· An action bar with commands for the call of further commands. Commands, which
are acting at other places, are not performed in the action bar.
· An icon list with different commands for the graphical operation on the display. The
icons can, according to the input, be deactivated.
· Register cards in the form of individual picture sequences. If several pictures are
contained in the file, an index is constructed for every individual image.
· Graphics area of the display application. Scroll bars allow the scrolling of the picture
within the graphics area.
· Status bar for the output of information.
Illustration 2-1
36
Main window of M-PREV
Preview pictures with M-PREV
Commands in the action bar
The instruction set was reduced to the minimum. For that you find only few menu
commands in the action bar.
Menu "File"
This menu contains all commands which ones can be applied for all parts in M-PREV:
Command
Description
"Open..."
The dialog box for opening new external image files opens. This
command can also be executed directly from the keyboard with
<Ctrl><o>.
"Print..."
M-PRINT starts. This command can also be executed directly
from the keyboard with <Ctrl><p>.
"Exit"
Terminates M-PRINT. This command can also be executed directly from the keyboard with <Ctrl><x>.
37
M-PLOT: Chapter 2
Menu "Settings"
When you are not the author on the file mplot.set, or you don't have any write authorizations on this file, the command is disabled. Following instructions stand for the
selection:
Command
Description
"Weight filters..."
Colors or line types can be assigned to specific line weights.
The settings are in the file mplot.wgt stored (see also chapter 6).
"Color filters..."
The input colors can be converted into new output colors.
All settings are stored in the file mplot.map (see chapter 7).
"Style filters..."
You can generate your own printing styles and store it into
the file mplot.sty (see chapter 8).
"Device filters..."
New device filters can be arranged. Restrictions can be set to
registered users or host names. The settings are stored in the
file mplot.set (see chapter 9).
"Picture colors..."
This command turns on a new window with all available colors of the input format. The corresponding color values are
listed. These can be used for a weight filter or a color filter.
"Enhance thumbnails"
Is this control box activated, the pictograms are optimized in
the display application for raster data. This command is only
acting if raster data are available in the input format.
Menu "Help"
38
Command
Description
"Version..."
The current M-PREV version is shown to you.
Preview pictures with M-PREV
Commands in the icon bar
The icons are fix arranged. According to the input format these are activated or remain
deactivated. M-PREV shows the image file with the aid of the graphics functions of the
operating system. In order to support all graphics systems, the output is displayed
through the software.
Show individual images
With these commands you can consider the individual picture sequences. The icons are
always enabled, also then, when the image file consists only of one single image.
Icon
Available
Description
always
Switches onto the first picture.
always
The preceding picture shows.
always
Show the next picture.
always
Switches onto the last picture.
Printing image file
M-PREV can send M-PRINT the image file directly. If you have several individual images in the display application, also these are sent. As default the current picture is set.
Restriction:
At this time no detail area can be sent yet. Whichever detail area you just have zoomed
in M-PREV, always the complete image area is transferred.
Icon
Available
always
Description
Starts M-PRINT, see chapter 5 for more information's.
39
M-PLOT: Chapter 2
Zoom
The zoom can be changed in M-PREV. For this purpose different icons for the selection
are available to you:
Icon
Available
Description
always
Moves the picture if the left mouse button is moved in the
graphics area. Corresponds to the moving of the scroll bars.
vectors
Activates the zoom mode. The zoom can be created by a rectangle with the left mouse button. Then the graphics area is
updated.
vectors
Decreases the zoom by a certain factor. The command can also
be simulated when you press the right mouse button shortly
and release the right mouse button again.
Resize
If you have changed the zoom, you can set the image file with the following icons to a
specific size rapidly and simply:
Icon
Available
Description
vectors
Show the drawing in the initial size.
vectors
Fit the drawing into the graphics area.
vectors
Fit the drawing onto the width of the graphics area.
A zoom or resize function works only for pure vector graphics. Contains the input format also raster data, the zoom or resize function is disabled. It would take too much
time and memory to process the scaling. This is a issue for a common M-PLOT version.
40
Preview pictures with M-PREV
Call from M-PLOT
M-PREV can be started also directly from M-PLOT. A double click reaches for this
purpose onto a file and the display application is started. In M-PLOT it is also possible
to open several display application simultaneously in order to compare files with each
other.
Mentioned as already at the beginning, all screen operations are generated through the
software. Image files are loaded completely into main memory and are decompressed.
That requires a considerable memory requirement according to screen size and input
format.
When it should not be possible to load the whole file, please quit other running applications. An optimized memory management is considered in a coming version of MPREV.
41
M-PLOT: Chapter 2
42
M-PLOT and external applications
3. M-PLOT and external applications
M-PLOT can be started directly from Drafting and I-DEAS. The image file is created
automatically and M-PRINT then started. The image file can be converted into the chosen output format. If M-PLOT is terminated, the image file is deleted automatically and
removed from the TDM in I-DEAS.
The communication is executed with the aid of macros. The macros are developed in a
way that you can integrate your own adaptations. Only a copy of the macros must be
created for this purpose. All macros are designed that the current I-DEAS version is
considered.
M-PLOT is compatible with the newest I-DEAS version 8.
43
M-PLOT: Chapter 3
Prerequisite
So that M-PLOT can be started from Drafting or I-DEAS, the SDRC- and the MQUEST environment must be synchronized on each other. Is that not the case, the macros cannot be started.
During the installation of M-PLOT you were asked for the SDRC installation directory.
Did you ignore this query you cannot use M-PLOT in Drafting or I-DEAS. You can
subsequently update the settings.
Declare SDRC environment in M-QUEST
Login yourself as I-DEAS administrator at your system. As a rule the account
ideasadm is used. The procedure is identical for all platforms, however the file names
and the entries can deviate from each other.
Example of UNIX platforms
File: $MQUEST_INSTL/cmd.unix/mquest_varbs
Edit the installation file. The variable $MQUEST_INSTL corresponds in this case to the
M-QUEST installation path. Change the installation directory from SDRC and indicate
the path and name of the used I-DEAS parameter file.
if [ -z "$SDRC_INSTL" ]; then
SDRC_INSTL=/sdrc/ideas8
export SDRC_INSTL
fi
if [ -z "$IDEAS_PARAM" ]; then
IDEAS_PARAM=/mquest/team/ms8/master/Config/.ideas_param8
export IDEAS_PARAM
fi
44
M-PLOT and external applications
Example of Windows NT/2000
File: %MQUEST_INSTL%\cmd.win\mquest_varbs.cmd
Edit the installation file. The variable %MQUEST_INSTL% corresponds in this case to the
M-QUEST installation path. Change the installation directory from SDRC and indicate
the path and name of the used I-DEAS parameter file.
... set SDRC_INSTL=d:\sdrc\ideas8
... set IDEAS_PARAM=d:\sdrc\team8\Master\Config\ideas_param8.dat
Then you can save the file. The paths in this text are only an example. Replace the paths
with your SDRC installation.
Adapt SDRC environment
That the SDRC and M-QUEST environment can work together, the SDRC environment
must receive still a call. Otherwise, when Drafting or I-DEAS is started, M-QUEST is
not informed.
You do not have to do these operation steps manually. The administrator program MADMIN takes over the task for you. Start for this purpose M-ADMIN and choose the
button "Modify/Restore SDRC settings". Then press the button "Modify". All necessary
scripts are created or adapted.
Check the communication
You can very simply check the communication. Start for this purpose Drafting or IDEAS. In the command window now additional variables must appear. This informs
you which variables are set and to which entries these refer. If no new entries appear,
check the settings in the M-QUEST-varbs file and repeat the process.
45
M-PLOT: Chapter 3
Drafting Detailing and Master Drafting
M-PLOT can be started in both applications. The macro recognizes by means of the IDEAS parameter file which version it is. The start can occur on two different kinds:
· Directly about the built-in macro command: Menu "Option", Command " Execute
Program".
· As an icon under your icon list. To construct your own icon please consult the documentation of Drafting Detailing, and/or Master Drafting for more information's.
If you use M-PLOT a lot, we recommend that you put the M-PLOT macro directly under an icon. The user has a faster and more easily access to M-PLOT.
You find the Drafting macro at following place:
Platform
Macro including path
Windows NT/2000 %MQUEST_INSTL%\mplot\prg\mplot_draft.prg
UNIX
$MQUEST_INSTL/mplot/prg/mplot_draft.prg
You may copy the macro also to another place. At an update you must guarantee, that
you update the macro manually.
46
M-PLOT and external applications
Macro menu
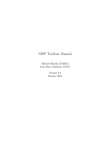
After the exporting of the macro some questions are to be answered before M-PLOT
can be started. The menu is built up in a high-powered way. According to selection
other queries are set-up.
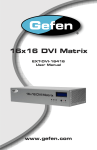
Selection of the file format
Indicate first the desired file format. Since also CGM can be created again and this format shows certain advantages, it is up to you which format you would like to work with
for. Please think of it that CGM needs a license. If you do not have any license, the
demo text appears also on a PostScript printer.
Command
Description
"SDRC Picture File"
That is the default. M-PLOT uses the SDRC picture format.
Filled areas are simulated with lines. Line weights with
parallel lines.
"CGM (binary)"
A binary CGM format is used. Filled areas are computed as
polygons. Line weights can be evaluated directly.
Illustration 3-1
File format selection
47
M-PLOT: Chapter 3
Selection of the drawing sheets
If several drawing sheets are in the current drawing you are first inquired to which sheet
you want to print. If you have only one sheet in the drawing, the query is skipped over.
Command
Description
"ROW"
All available sheets are shown in the list. The currently
active sheet is through the characters < > marked. If you
choose a sheet, which is not currently active, this is displayed in Drafting.
"ALL SHEETS"
If this line is chosen, all pages are copied into a new image file. A specific page can be addressed then explicitly
in M-PRINT. Printing of all pages is also possible.
Illustration 3-2
Selection drawing sheets
Selection of the print area
The print area determines the representation format size. According to the chosen selection Drafting trims the image file automatically.
Illustration 3-3
Print area selection
48
Command
Description
"Complete drawing"
The whole drawing is considered, independently of the
current view area.
"Graphic window"
The rectangular area of the graphics window is considered. The view factor is taken over.
"Portion by two points"
The zoom can be indicated interactively about a startup
and final point. Caution with multiple views. The main
view must then be active otherwise the selection does not
work.
M-PLOT and external applications
Print parameter
If all queries are answered, the image file will be exported with the Drafting command
"File", "Export", "Picture file". Then the application M-PRINT is started. How do you
work with M-PRINT you can look up the commands in the chapter 5.
After you quit M-PRINT, the temporary image file is deleted on the operating system.
If you want to archive the image export them manually in Drafting and start M-PLOT
as a separate application. From Drafting no image file can be printed which was not
created automatically.
Important:
The macro is started as a parallel process. Drafting is after the queries ready again for
new inputs. If you click by mistake into the Drafting window, M-PRINT disappears into the background. If M-PRINT does not start, please reduce first Drafting on icon size.
If M-PRINT is now visible, you can print the drawing. Repeated, simultaneous starting
of M-PRINT wastes unnecessary memory space.
49
M-PLOT: Chapter 3
Settings
The requests at M-PLOT can be very different. In order to take care to this subject,
some important default values were set into the M-QUEST parameter file. That makes
it to you possible, to tune M-PLOT optimally for Drafting. Through the declaration in
the M-QUEST parameter file, the specifications can be transferred also to individual
users.
The respective variables are in the parameter file documented sufficiently. Following
variable has a direct influence on the display creation and the running performances of
M-PLOT from Drafting:
Variable
Description
mplot.sdrc.drafting.filename
Defines, whether the name or the drawing number are used for the plot
file. This entry is only active if Drafting is started with the TDM.
mplot.sdrc.drafting.viewborder
Determines, whether the view borders are printed or not.
mplot.sdrc.drafting.intellfonts
If this variable is set, the line types are broken up into individual lines.
You see then the same output exactly on the output filter. If the variable is not set, the output filter creates the line types. The representation format is not identical, but more rapid.
mplot.sdrc.drafting.plotlayer
If the value is set, also the layer attributes are read.
mplot.sdrc.drafting.noweight
If this value is set, no line weights are processed within Drafting even
if the drawing contains such. The output is importantly faster and the
plot file smaller.
mplot.sdrc.drafting.nosolidfill
Filled faces are not processed.
mplot.sdrc.drafting.deviation
Determine the precision of the curves.
mplot.sdrc.drafting.layers
Defines, which layers are supposed to be considered for the printing.
50
M-PLOT and external applications
I-DEAS Master Series
Until I-DEAS MS7 all image files that were created in I-DEAS are automatically
adopted to the TDM. Often you want to generate only a snapshot and do not need the
image file then anymore. M-PLOT helps you in this case and deletes also the image file
correctly from the TDM.
With I-DEAS 8, this step is not necessary anymore. The macro recognizes automatically the version and executes the necessary steps automatically. You don't have to care
about the data organization.
Remark:
If you want to archive file pictures, please generate these manually. Then you can start
M-PLOT as a separate application and print out the pictures. If M-PLOT is started from
I-DEAS, the image file is always removed automatically.
M-PLOT is started from I-DEAS with a keyboard shortcut. Press for this purposes the
keyboard key <Ctrl><p> simultaneously. If M-PLOT should not start, check the SDRC
environment.
Another possibility to run the macro is directly from I-DEAS with "File", "Execute
Program". You find the M-PLOT macro at following place for I-DEAS:
Platform
Macro including path
Windows NT/2000 %MQUEST_INSTL%\mplot\prg\mplot_ideas.prg
UNIX
$MQUEST_INSTL/mplot/prg/mplot_ideas.prg
You may copy the macro also to another place. At an update you must guarantee, that
you update the macro.
51
M-PLOT: Chapter 3
Macro menu
According to input of <Ctrl><p> you can change still default values in order to optimize the picture creation.
Command
Description
"Picture type"
Defines which output format is used. Following selection are present: "SDRC picture type = PFF " or "CGM (binary)".
"Solution"
With this value you determine the resolution. The value must be between 0.1 and 7.5. As default 1.0 is used. How bigger the value is,
the longer the display design takes.
"Quality"
If the value is set to "plotter", a paper size can be declared. "Graphics" does not write any paper size into the image file. No scaling of
the line weight can occur.
"Paper size"
If a paper size is chosen, a size of paper can be preset so in MPRINT automatically. A scaling of the line weights is also possible.
When you have a big assembly and you choose an A4 format, the
lines were processed then more thickly. Would you choose an A0
format, the lines were processed then more thickly. The format size
is directly responsible for the pen scaling.
"Redraw"
If you have printed already a picture and want to generate still a new
snapshot, nevertheless from another perspective, then you can use
this command in order to refresh the graphics area again. The command "Plot..." can then called again.
"Plot…"
The image file is created and M-PRINT is started. Meanwhile MPRINT runs, I-DEAS is locked.
"Done"
The image file is removed from the TDM (to and with MS7) and IDEAS is released. In I-DEAS 8 and bigger, the image file does not
have to be deleted anymore from TDM.
"Backup"
"Cancel"
The macro is terminated and M-PRINT is not started.
Illustration 3-4
Macro menu in I-DEAS
52
M-PLOT and external applications
Print parameter
After the command "Plot…" was selected, the image file is created and M-PRINT
starts. How do you use M-PRINT you can look up the commands in the chapter 5.
After the termination of M-PRINT, the macro menu appears again and you can generate
further snapshots. If you work already with I-DEAS 8 or higher, the macro is terminated automatically since the TDM does not have to be clean up anymore.
Problems during the creation of the picture file
If M-PRINT starts after the picture file creation with following message:
"The file doesn't exist on the operating system..."
then the image file ideas_pic is still in the TDM adopted and does not exist anymore
on the operating system. M-PRINT cannot start because the file doesn't exist. Proceed
for this purpose into I-DEAS as follows:
3 Select the icon "Manage Items" in the icon list. A new window opens.
3 Choose the option "All Types". Search for the line "ideas_pic".
3 Select these line and delete the entry with the menu "Actions".
The TDM is clean up now. You can start M-PRINT again.
53
M-PLOT: Chapter 3
Update
The M-PLOT macros are documented and can be modified by you. Please think however, you are being responsible to update the macro files at an update of M-QUEST.
The settings are updated for the SDRC environment by the installation program provided that the environment is known in M-QUEST.
Generally, the macro functions are changed only very seldom by SDRC. It can occur,
that commands receive new shortcuts or functions new options. These commands are
ignored by the macro and the next command line is executed. That can result in not being able to start M-PLOT since no image file is created.
This problematic can occurred, when you install sub-version of SDRC. We are endeavored, to update the macros currently.
54
Printing in the background
4. Printing in the background
If you want to translate image files in the background, you can use for this purpose MPLOT batch. M-PLOT batch is identical with M-PLOT, with the difference that no user
interface appears. All device-, weight-, color- and style filters can be addressed. You
can call M-PLOT batch for every drawing or send a list with input files.
55
M-PLOT: Chapter 4
Start of M-PLOT batch
M-PLOT batch can be executed unlike other M-PLOT applications only on the console.
In this manual, we go out that the search path is set-up to the start directory of the MQUEST installation. To find out more for this purpose please contact the user manual
M-ADMIN 2001.
In order to start M-PLOT batch on the console, you use following syntax:
mplotbatch ?-option, -option ...? [file, file ...]
An option starts always with a minus sign (-) and an argument is at the end of the input
line ordered.
Option
56
Values
Description
-h
Lists all available options. M-PLOT batch is not
started.
-lx
Switches the user language. The placeholder (x) is to
replace with one of the following numbers:
0 - English, 1 - French, 2 - German and 3 - Italian.
-copy
1...999
Number print copies. Is only for print formats effective.
-sort
false true
The output sort order on a printer. Is active when the
number of copies is larger than one and the input file
has more than one pages.
-page
all current Determines, whether all pictures or only the current
one (always the first) for the process is supposed to
be considered.
-driver
index
Current device indices. The index can be determined
from the device list mplot.set.
Printing in the background
Option
Values
Description
-paper
index
Paper index of the desired paper size. The index can
be determined from the select device filter xxx.def
section [paper].
-color
index
Alike [paper], the color index is read instead.
-layout
index
Determines the style filter. If this value is not defined
it is tested, whether in the existing device filter is a
style filter defined. If no value is also at this place
available, then the standard index of the style filter is
used.
-weighttable
index
Sets the index of the desired weight filter. This is
used for the conversion of the color- and line attributes from the image file. This option can be applied
only on meta or vector files.
-colortable
index
With the index the desired color schema is selected.
This option can be applied only on meta or vector files.
As arguments at least one input file must be declared. The input files can be local or
provided with absolute paths. Environment variables can be used also. These must be
set during the startup and valid.
57
M-PLOT: Chapter 4
Example of UNIX platforms
$ mplotbatch $HOME/ideas/8.501000.pff
$ mplotbatch $HOME/ideas/*.pff /data/picture/img*.jpg
$ mplotbatch -driver tiff *.pff
Example of Windows NT/2000
> mplotbatch %HOMEPATH%\ideas\8.501000.pff
> mplotbatch %HOMEPATH%\ideas\*.pff T:\picture\img*.jpg
> mplotbatch -driver tiff D:\data\pff\*.pff
Special notes
As input files ASC and DWG files can also be used presupposed when you do not work
with I-DEAS 8 and the program draftbatch is installed on your computer.
If you like to set properties, which are not available directly as an option in M-PLOT
batch, this can be done by specific filters (weight, color, style and device).
Generate a new device filter that is used only for background printing. A specific style
filter can be linked then to this filter. With the aid of this device filter you can execute
also an external script and determine what is supposed to occur to the plot file.
58
Print pictures with M-PRINT
5. Print pictures with M-PRINT
M-PRINT is the main printing solution of all M-PLOT applications. M-PREV, MPLOT and as well as M-PLOT batch calls this application. M-PRINT was designed in a
way so that it can be integrated without problems into other applications. The appearance was chosen so that users on Windows NT/2000 and users on UNIX platforms are
satisfied.
Why a proprietary solution again? Windows NT/2000 has a powerful printing solution.
The respective hardware manufacturers develop all device drivers. On other platforms
these device drivers are not available because the manufacturers do not support them.
This circumstance scrambles us since also these operating systems have their authorization. If that would not be the case they would not be anymore at the market.
M-QUEST supports currently six different platforms. We want to do the development
only once. Therefore the print files are not created under Windows NT/2000 with the
system device drivers. That can make no sense or confuses you. But it can have the advantage that many output formatting that will not work with the system devices are possible.
Example: If you print on a HP-DesignJet 750C/PS, the plotter cuts always 20 millimeters off. The system driver does not support an additional paper rotation in PostScript
mode. M-PRINT expands automatically the PostScript print area so that no margin
arises. The additional outlay for the setting-up of a proprietary device filter can be absolutely profitable.
59
M-PLOT: Chapter 5
Start of M-PRINT
M-PRINT cannot be called directly. You need always an application. That can be MPLOT, M-PREV, Drafting or I-DEAS. These applications load the input format and
send this to M-PRINT.
When you press the button "Print" the input format is converted into the chosen output
format and sent to the output device. That can be a file, a printer or a program.
You can in the M-QUEST parameter file determine whether the window is automatically terminated or whether you must close this explicitly with the button "Exit". Latter
case has the advantage that you can send the same input format, which is already in the
memory, onto different devices.
60
Print pictures with M-PRINT
Start of M-PRINT from external applications
If you have other CAD applications in use, M-PRINT can be helpful to print also the
external formats for you. A specific command script was developed which reads a specific path and shows you a file list with all available files. After the selection of a file
M-PRINT is started. That makes a simple integration into other CAD applications possible if the input format can be read by M-PRINT.
In this manual, we go out that the search path is set-up to the start directory of the MQUEST installation. To find out more for this purpose please contact the user manual
M-ADMIN 2001.
In order to start M-PLOT batch on the console, you use following syntax:
mprint / mprintf ?-option value, -option ...? [file]
An option starts always with a minus sign (-) and an argument is at the end of the input
line ordered.
Option
Values
Description
-h
Lists all available options. M-PLOT batch is not
started.
-lx
Switches the user language. The placeholder (x) is to
replace with one of the following numbers:
0 - English, 1 - French, 2 - German and 3 - Italian.
-rf
false true
If this option is set after the printing the input file is
deleted on the operating system. This option is reasonable, when the calling macro is not able to remove a temporary print file.
-b
false true
Determine whether the file selection is supposed to
be shown. Is in the script mprintf as default set.
61
M-PLOT: Chapter 5
Option
Values
Description
-dir
directory
When the option -b is indicated, a list of the input
files can be defined optionally. If this is not indicated, the variable mquest.mprintf.dir is read in
the M-QUEST parameter file.
-ext
cgm pff tif When the option -b is indicated, the file extension
tiff jpg
can be indicated optionally for the selection of the
jpeg png
files. If this is not indicated, the variable
mquest.mprintf.ext is read in the M-QUEST parameter file.
If the option -b is called with the value "false", then an input file must be delivered as
argument. The input file can be local or provided with absolute path. Environment variable can be used also. These must be set and valid during the start.
62
Print pictures with M-PRINT
Example of UNIX platforms
$
$
$
$
mprint $HOME/ideas/8.501000.pff
mprint –b true –dir $HOME/ideas –ext pff
mprintf
mprintf –dir /data/pff –ext pff
Example of Windows NT/2000
> mprint %HOMEPATH%\ideas\8.501000.pff
> mprint –b true –dir %HOMEPATH%\ideas –ext pff
> mprintf
> mprintf –dir D:\data\pff
Special notes
The scripts mprint and mprintf distinguish only in the option -b. This is integrated already in the file mprintf.
63
M-PLOT: Chapter 5
Properties of the main window
If M-PRINT is called, the main window appears. This is divided as follows:
· "Output device:" - All settings which affect the output format directly are combined.
· "Print range:" - If several individual images are in the input file, these can be
printed in different kind and manner.
· "Copies:" - The sorting and the number of copies can be changed.
· "Style information on output format:" - The style filter determines how the input
format is supposed to appear on the output filter. A preview supports you in the fineness.
Illustration 5-1
64
Main window of M-PRINT
Print pictures with M-PRINT
Output device
This area determines how the input format is supposed to be converted. For this purpose
you can select the corresponding device filter from a device filter list. Since the demands on a TIFF-format or on a large size printer are not identical, the chosen device
filter initializes automatically the corresponding filter features.
After the properties are set, you can decide how the output is supposed to occur. You
have the choice to write it into a file or directly into the print queue. In the latter case,
that happens always with an operating system command. The command must exist on
the operating system. M-PRINT does not have any intern commands in order to initiate
the plot file.
Command
Description
Name:
List all available output filters for the logged in user. After selection
of a new device the values are initialized in M-PRINT.
Properties ...
Shows the properties of the chosen device filter.
Output:
· "Direct:" calls the indicated command script in the same line. If
the line is empty, an error message is returned. The line can be
changed with the button "Modify...".
· "File:" sends the output into a file. A valid file name must be indicated for this purpose. If you like to switch the directory or select a current file name use the button "New file..." to change the
name.
Remove:
If the control box is active, the plot file is deleted after the job is
executed. Should not be used if the output is sent into a file since the
file is deleted immediately by M-PRINT.
More info's...
The most important settings are displayed to you in an separate window.
65
M-PLOT: Chapter 5
Print range
The print range relates to the number of pages within the loaded input format. If you
have loaded an image file with several individual images, you can decide which page
frame you want to print.
Command
Description
Area:
· "All pictures": marks all available pictures in the image file.
· "Current picture": is the default if you call M-PRINT. You
see by means of the display number which picture would be
converted.
· "Range:" allows you to convert only a specific image range.
The print area can be indicated with the entries "from:" and
"to:".
All onto the same
page:
If this control box is active, all defined pictures are printed on
each other. If the command is deactivated, the pictures are printed
after each other.
Copies
Because M-PRINT can handle also documents with several pages it can be desirable the
output can be sorted if more than one copy is defined. If the device filter supports copies, also the sorting can be used.
Command
Description
Number of prints:
Indicates the number of the desired outputs.
Sorted:
If the control box is active, the output is sorted. The plot file contains then all pages in the correct sequence.
So that sort becomes active, some defaults must be fulfilled: The
print area must contain at least two pictures and the number of
copies must be larger than one.
66
Print pictures with M-PRINT
Style information on output format
The output filter converts the content of the input format into the corresponding output
language. The requests onto the formatting can occur homogeneous for all devices.
Therefore this information's are summarized into style filters. You can create these by
yourself. You find out further information on that in the chapter 8.
In order to change the default setting fast and easily, all-important settings of the style
filter were released for the user. Press the "Preview..." button and you see directly the
effects.
Command
Description
Style filter:
Select the corresponding style from the list. If you change the output
filter, the style filter can change too, provided that the output filter
has a linking onto a other style filter. The settings for the preview are
also reset.
The style filters can be deactivated, if an output filter is selected
which one does not approve any adaptation.
Preview ...
A new dialog window opens with a print preview. The properties of
the selected style filter are listed. Further options can be set individual.
67
M-PLOT: Chapter 5
Properties of an output filter
Mentioned as already at the beginning, this information's are initialized from the active
output filter. Through that the appearance changes. Not every output filter has the same
command set.
M-PRINT can support, only commands which are defined in an intern way. Therefore
all possible commands are explained at this place shortly. It is a question of the output
filter of an image file like TIFF, JPEG, and so forth, other commands appears for the
selection than an output filter for a device printer. Only the buttons and control boxes,
which have also a direct influence on the output, are displayed.
Illustration 5-2
68
Properties of an output filter
Print pictures with M-PRINT
Picture dimensions
Shows the dimensions of the input format, as the file that already is loaded in the main
memory. At a conversion into another output format this information can be helpful.
The current M-PRINT unit is also indicated.
If the input unit is millimeter, a line scaling can be done even the output filter is a pure
raster format. If the unit is in pixel, it becomes already more difficult. M-PRINT will
change the provided menu in a way so that the user can change the size in a simple way.
Print quality
The print quality determines the degree of detail of the output. The more highly the
value is, the more intern memory is needed and the output can take importantly longer.
Command
Description
Print quality:
A selection menu lists all declared solutions. The unit is always
"dots per inch", shortly dpi.
Input
The input field becomes only then active if the menu command
"Custom size" is selected. An arbitrary value can be entered now.
69
M-PLOT: Chapter 5
Paper size
This command becomes active if paper sizes are defined in the output filter.
Command
Description
Paper size:
A selection menu lists all declared format items. The default is determined from the size of the input format. In order to limit the paper
list, not all declared sizes are listed. If you want to activate the ANSI
input formats, that can be done by the variable mplot.paper.list
in the M-QUEST parameter file. Set the value to ansi and start MPRINT again.
Best
This button determines the best paper size matching. Is the input unit
in millimeter the size is compared directly with the paper sizes and
the best matching size is chosen. Is the input unit in pixel the resolution is read and the size of paper is determined. In this case also the
output resolution of must be considered with the output filter.
Example: The input format is a TIFF file with 300 dpi the output
resolution is set to 300 dpi. The picture dimensions are divided
through the resolution of 300 dpi and the scale certain. Now the initial paper dimension can be determined again.
70
Print pictures with M-PRINT
Output size
This command is very powerful. M-PRINT can change also pure raster formats in the
size. That has the consequences that according to the input unit and the output filter different information are necessary. At this place it decides itself how efficiently and
surely the output can occur.
Paper size
The output size is defined about the dimension of standard values. The resultant picture
scale is determined by means of the unit, the resolution and the desired size.
Command
Description
"Custom size"
Is the paper index "?" defined, the dimensions can be set also individually. The width and height ratio remains constant.
"Resolution"
The resolution has at this place only a subordinate importance. It is
used to set the intern resolution to the output format and setting the
additional text into a specific relationship on the output. If the output
device is in pixel, the additional text requires a factor, so that the text
height can be set into the desired relationship to the whole picture.
Size
The output size is determined about an individual dimension in pixel. The aspect ratio is
constant.
Command
Description
"Resolution"
The resolution is needed if the input device is in millimeter otherwise the menu is deactivated.
71
M-PLOT: Chapter 5
Scale
The output size is determined directly about the scale. If the input unit is in millimeter
the printing resolution is still needed for a pure raster format.
Command
Description
"Scale"
A real value. Must be larger than zero! A scale of 1.0 is the default.
"Resolution"
The resolution becomes only then active if the input format is in millimeter.
Resolution
The output size is determined only about the printing resolution. This menu becomes
only active, if the input device is in millimeters and the output device is in pixel. With
all other constellations additional information are still needed.
Command
Description
"Resolution"
It is especially well suitable for the archiving of vector drawings
which ones are stored into a raster format. As a rule these are printed
out later directly to a device. It provides that the printing resolution
is indicated directly.
Example: An A3 drawing is supposed to be archived. Create for example a TIFF file with 300 dpi. M-PRINT calculates the screen size
and writes the resolution also into the TIFF file. If this TIFF file is
sent directly at the printer now, the printer can determine the initial
format from the stored resolution and can select the correct A3 paper
tray.
Please think of it, how larger the resolution is, the more intern memory is needed. We
recommend, that a picture archiving should not be larger than 300 dpi executed.
72
Print pictures with M-PRINT
Orientation
This command rotates only the input format with respect to the output format. No paper
rotation occurs. This is task of the device filter. The paper direction is chosen always in
a way that the short edge is below.
Command
Description
Orientation:
The orientation rotates the picture around 0 or 90 degree. The symbol indicates immediately to you how the command is to understand.
Consider for this purpose also the icon. The orientation of the input
format is displayed in the icon.
Automatic
The optimal orientation is determined with respect to the chosen size
of paper.
Color output
Operate the color output of the output filter. A conversion between the input and output
format occurs automatically.
Command
Description
Output to:
According to the output filter different color modes can be selected.
If a specific output filter does not have a menu item "Color", these
devices cannot display any colors.
The pictogram indicates exactly how the colors are computed. If the
picture does not change when between monochrome and gray is
switched no dithering is done then. The output filter can execute this
step itself.
73
M-PLOT: Chapter 5
Dither image
When the output filter cannot mix any colors, this must occur with a dithering. All primary colors are used in this case and each of them is dithered. Dithering means, a color
value between 0...255 is taken and is converted into a bit value of 0/1. So that the picture receives gray levels the neighbor color values must also be considered.
Command
Means
Dither image: "No"
Description
It is used a threshold value by 127. If the color value is
greater than in 127, the color becomes white. If this is
smaller, the color becomes black. No gray levels can be
simulated.
"Adaptive"
This dithering pattern distributes the colors very beautifully. The pattern is not regular. Also monotonous faces
are distributed correctly. The dithering pattern can be
applied on ink-jet printers. In case of high resolutions
the dithering pattern tumbles down.
"Diffusion"
The dithering occurs with an error distribution according
to Floyd/Steinberg. Four neighbor pixels are changed in
this case. The pattern looks good on irregular pictures.
Monotonous faces always have an error at a corner.
"Dispersed" The additional menu "Number of gray:" can tune the
colors. If a small color process is chosen, the picture
looks finer, but only as many as colors are set in the
menu can be simulated. The dithering occurs about a
sorted pattern. In case of very high printing resolutions
the dithering pattern tumbles down.
"Clustered"
74
This dithering pattern works like "Dispersed". The colors are simulated by different point sizes. The technique
is the same one as in a daily paper. The more highly the
"Number of gray", in a larger way the point. Is ideal for
printing resolutions > 300 dpi.
Print pictures with M-PRINT
Rendering
Raster image files can be smoothed too. With a mathematical function the neighbor
points are optimized with the current color point. In particular case of decreasing or increasing such a filter can correct the output importantly. The disadvantage appears, that
additional memory is needed and the creation of the file becomes importantly longer
(around factors).
Not only color transitions can be optimized so, also the picture borders are smoothed.
That can be executed, only then if the background is known. CGM, PFF or PNG know
exactly which pixels are selected as background. At this place no border smoothing can
be done.
I-DEAS pictures with shaded templates are created always as a RGBA color template.
That allows the exempting of templates shade. You want to publish now this picture on
an Internet page, it is sometimes advantageous, if the background of the page is used
and not the background of the picture. For this purpose you must select the output filter
PNG (Portable network Graphic) and disable the background. The color smoothing
would consider the initial background at this place for the border smoothing. You
would recognize that on the Internet page immediately. Therefore M-PRINT notices
whether the background is supposed to be used. When the color borders are smoothed,
then only the color transitions are optimized and the color borders remain unchanged.
It would explode this manual if all filters and the techniques were explained. Various
specialist literatures exist on this subject. Also the Internet offers information's on this
topic. Simply try out the filters and you see immediately how the filter affects the output.
Command
Description
"Pixel replication" By increasing the new pixels are duplicated and removed when
the image is decreased. The computing is very fast, the output in
particular at decreasing very unpleasant.
All others
Simply try it out. If the colors must be dithered before the output
file can be created, you will not see the smoothness like on a pure
color image.
75
M-PLOT: Chapter 5
Color correction
In particular color devices need a correction of the colors. As a rule this devices cannot
display all available colors. M-PRINT offers you simple possibilities to change the picture. A correction affects also the pictogram. You see directly what the individual controllers cause.
76
Command
Area
Description
Gamma:
0...1...10 Is the value less than 1.0, all brighter pixels are darkened.
If the value is larger than 1.0 it is exactly the reversed
way. The calculation occurs with a mathematical curve.
With this command the picture can be brightened or darkened decently.
Hue:
0...100%
If the value is changed, the color value can be changed.
This command can be used also to dyeing the complete
picture. A value of zero lets the hue value unchanged.
Saturation:
0...100%
Determine how highly the degree of saturation of the
color is. A value larger of zero intensifies the color.
Brightness:
0...100%
With this controller you can brighten the whole picture.
Also the additive RGB colors or the subtractive CMY
colors are elucidated in this case. The colors white and
black remain in an unchanged way. A value of zero corresponds to the normal brightness of the picture.
Print pictures with M-PRINT
Compression
The device filter allows the compression of the information's. The output file is then
importantly smaller. Not all device filters have this command, although the format
would support compression. Either M-PRINT makes that automatically or a compression method is patented. An example: For the algorithm "LZW" (Lempel Ziv Welch)
royalties must be paid when it is used in M-PLOT. That is the reason why M-PRINT
does not support the compression "LZW" in the output filter TIFF.
Command
Area
Description
Loss of quality: 0...100% This command is only at JPEG activated. A value of 0
does not pack and with the value 100 the maximum picture compression occurs. But caution: The compression
of JPEG is affected with loss. How larger the compression value is the larger way the modifications are at the
output image. The default value is set directly in the filter
and is set to 50%.
Compression:
TIFF
EPS
TIFF supports different compression modes according to
the color template. M-PRINT uses only a specific selection of compression methods:
· "None" - writes the picture with no compression into
the output file. The file size becomes also correspondingly bigger through that. This TIFF files should be
able to read from all external applications.
· "Packbits" - can be applied onto all color templates.
The compression is not so good at color pictures, large
monochrome areas can be packed very well.
· "CCITT fax G3/G4" - can be applied only onto monochrome pictures. Extremely good compression.
· "CCITT RLE" - also only monochrome pictures. The
compression occurs with the "run length" operations.
77
M-PLOT: Chapter 5
Smoothing of the color palette (JPEG)
JPEG allows that the picture can be smoothed. The colors are for this purpose optimized in the picture. The appearance is more blurred, the borders on the other hand no
more so notched.
Command
Area
Description
Color palette:
0...100% This command is only at JPEG activated. A value of
zero does not change the color palette. How larger the
value is, the more blurred (smoother) the picture becomes. As default 20% is set.
Coding operation (JPEG)
JPEG can use different options for the coding of the picture information. The image
output is however unchanged from that.
Command
Description
Coding operation:
As default the control box "Progressive" is activated.
· "Optimize" - If this control box is activated, M-PRINT itself decides which compression method is applied.
· "Progressive" - If the control box is active, the picture can be
displayed as whole on the screen. In this case the block size is at
the beginning very coarse and becomes increasingly finer during
loading. But the preview program must support this technique.
78
Print pictures with M-PRINT
Version of the output format (PDF)
As a rule the output filter determines automatically, which version of the format is to
apply. At PDF the version is important. Not every preview program has the necessarily
language range implemented to display the most current PDF version. Therefore you
may determine with which PDF version you would like to work.
Command
Description
Version:
The PDF version determines the command set of the PDF format. It
is decisive which version you used. According to this version there
must be a specific Adobe PDF Reader version present, otherwise the
file cannot be displayed correctly.
· "PDF 1.0" - the first PDF format. This is as a pure text format.
Pictures are coded with RLE and ASCII85. Should work with all
preview programs.
· "PDF 1.1" - this format can already be binary. The output is
identical like PDF 1.0.
· "PDF 1.2" - the format is binary and the pictures are coded with
ZIP and ASCII85. The commands are not packed. RGBA pictures are stored line for line. Urgently necessary for Adobe reader
less version 5.0.
· "PDF 1.3" - everything is packed. The file is binary. RGBA pictures are masked. First the Adobe reader 5.0 can show this picture
technique correctly. For the output onto a PostScript printer PS
level 3 is urgently required.
79
M-PLOT: Chapter 5
Simplify
This command makes it possible that additional settings on the output filter can be set
which are for the output of interest. The defaults are in the output filter under [feature] declared.
Command
Format
Description
Simplify:
PDF
· "Add thumbnails" - is the control box active a pictogram
is created for every picture. If raster data are available in
the picture, these are optimized.
· "Optimize image" - the PDF function is activated so that
the output in the preview program is better. The display
takes through that more time.
CGM
These settings can change if another profile is selected. If
you are not sure, whether the preview program understands
these options, you should all activate then.
· "Text" - is the control box deactivated the text is written
as such into the file. Otherwise the text is broken up in
single lines.
· "Symbol" - is the control box active, a symbol (Marker) is
broken up.
· "Crosshatch" - is the control box active, a crosshatch pattern is broken up in single lines.
· "Linetype" - is the control box active, the line type (center
line, etc.) becomes broken up in single lines.
80
Print pictures with M-PRINT
Profiles (CGM)
A profile combines features from the output filter. In particular CGM requires this
command to be compatible with other viewing programs. The command set of CGM is
very powerful. So that you do not have to have all settings in mind, you can summarize
these into a profile. If the CGM output filter is activated, already common profiles are
arranged.
Command
Description
Profiles:
· "ANSI 1.0" - supports the full CGM 1.0 standard. Polygons, rectangles, circles, arcs are written so forth as commands. The preview
program must be able to interpret these commands.
· "SDRC I-DEAS" - creates a CGM file, which is fully compatible
with I-DEAS. Functions, which are not supported in I-DEAS, are
reduced to line functions. Pictures are converted explicitly into the
integer format.
· "SDRC Drafting" - is identical as for I-DEAS. The dimensions are
adapted in a way, that Drafting can correctly display the drawing.
· "SDRC Master Drafting" - identical as for SDRC Drafting. The
CGM file is optimized for the new CGM interpreter.
· "CorelDRAW" - the CGM file is optimized especially for CorelDRAW. The picture formatting is adapted in a way that raster data
can be displayed also in this application.
81
M-PLOT: Chapter 5
File type (CGM)
CGM supports different kinds of file types. But not all CGM interpreters can read all
file types. It is decisive that the correct type is applied.
Command
Description
File type:
The default can change if another profile is selected.
· "Binary format" - is the default. The CGM file is created in binary
format. Pictures and commands are packed.
· "ASCII character" - is a very special format. The information's are
stored in the CALS standard. Is not distributed very much.
· "Clear text format" - a CGM file that can be loaded in every text
program. Ideal also for a look up and check.
82
Print pictures with M-PRINT
Paper bin
This command is only then effective if the output filter has different paper bins. Also a
manual entry is regarded as a bin.
Command
Description
Paper bin:
The menu lists all available paper trays of the output filter. From the
output filter the default is set. If a bin is missing, this must be inserted
in the output filter.
Output bin
This is exactly the opposite of paper bin. The command determines the output bin at the
printer. Some printers offers the possibility, to sort the output or that the document is
with the writing above.
Command
Description
Output bin:
The menu lists all available output bins of the output filter. From the
output filter the default is set. If a output bin is missing, this must be
inserted in the output filter.
Features
Many output filters have still special features. These cannot be explained at this place,
because that would explode the manual. In the output filter the command [option] is
evaluated for this reason. All declared options are performed at the lower end of the
menu. The default of the respective feature is set also in the output filter.
If a generic output filter is used, no features are listed. As a rule these are in general
known dependently of the respective printer's.
83
M-PLOT: Chapter 5
Preview
The preview was developed, that the user gets an idea of that, what the chosen style filter causes. That not for every combination of possible settings style filters has to be created, the most important settings were summarized and setup for the user. The options
are preset through the style filter. The current style is displayed in the window title.
· The preview pictogram shows how the appearance looks on the output filter.
· "Options:" - with information of the input format. These are preset through the style
filter.
· "State:" - of the input format. Useful information helps to execute the selection even
more effectively.
Illustration 5-3
84
Print preview of M-PRINT
Print pictures with M-PRINT
Preview pictogram
In a graphics window the content is displayed just the same as the output will occur.
The properties of the output filter and the style are considered. Also the physical
boundaries of printers and plotters are considered. If a paper rotation is in the output filter defined this is displayed too.
If you change options or you select another style filter the display will be updated. Also
the assigning of new output colors is displayed directly. The weight filter is also considered. On the display the line weight cannot be displayed 1:1, therefore the impression can arise that nothing changes.
Comment:
The orientation of the preview dependents directly on the selected output filters. If no
paper rotation is indicated in the output filter, the display is always in the portrait format. Exceptions are output filters that don't support paper sizes.
Enhance rendering
If raster displays are available in the input format, these are displayed if the output filter
provides this possibility. In the preview application the pictures are trimmed on the corresponding size. That can result in the consequence, that you cannot recognize the content anymore. Activate for this purpose the control box "Enhance rendering". The pictures are recalculated and smoothed. The output is now importantly better, but requires
a longer CPU time.
Options
The options change directly the representation format of the graphics. When you select
a control box you see the result in the display immediately. The format of the input file
stands also in the title of this frame.
Some options are only active if the input file has the necessary information. Has the
style filter this option enabled or disabled, this value is stored in an intern way. The user
simply cannot select this option.
85
M-PLOT: Chapter 5
Command
Description
Use background information for output.
This option becomes active, when the input format stores
the background explicitly. Currently these are the input filters: CGM, PFF and PNG. With all other input formats the
control box is deactivated.
Dither solid fill polygon
(only B/W mode).
If the input format supports filled polygons (rectangular,
circles, cake diagram or polygons), an additional query
must occur during the output in a monochrome-format. If
the control box is activated the filling is dithered. Otherwise the filling is put in black color.
Why this query? As a rule you want filled arrows in full
black and not dithered. In I-DEAS a polygon is supposed to
be displayed dithered.
86
Draw paper sizes as a
thin box on the paper.
This option draws the paper dimension according to a fine
pen (0.2mm) and the line type "phantom". That makes it
for you possible that you can trim the format, if the paper
medium is bigger than the chosen paper size. If the paper
medium is of the same size as the output format, or if
hardware margins are defined, this option is ignored.
Put additional text on
output format.
If the control box is activated, an additional text can be positioned below to the left on the output format. The text can
be entered individually. Use for this purpose the button
at the end of the line. The text can be preset also in the style
filter or in the M-QUEST parameter file.
Print pictures with M-PRINT
Command
Description
Set picture size on output:
This area defines the output size of the content on the output format:
· "Fit in: (all entities visible)" - calculates always the optimal scale so that the input format has space on the output format. Also the style filter is considered for this.
The printer margins are ignored.
· "Scale:" - Define or select the desired picture scale. In
the display application the result is immediately visible.
If nothing is visible, that can have been enlarged either
into a white area or the scale is so small that no display
occurs.
Scale thickness:
During the output it can be useful that the thickness of the
line weight can be controlled. Four possibilities are available:
· "Constant" - the line weights are not changed independent of the output scale.
· "Proportional" - the line weights are changed dependent
on the output scale.
· "When bigger 1:1" - the line weights are enlarged only
then if the output scale is bigger than one.
· "When smaller 1:1" - the line weights are justified only
then if the output scale is smaller than one.
87
M-PLOT: Chapter 5
Command
Description
Interprets:
Three options for the selection stand to you:
· "Thickness of output" evaluates the thickness information directly from the input file.
· "Color = Line thickness" searches from the chosen
weight filter the allocation for color and adds the thickness to the element.
· "Style = Line thickness " searches from the chosen
weight filter the allocation line type and adds the thickness to the element.
Weight filter:
Determine which weight filter is supposed to be applied.
The definition are interpreted directly from the menu "Interprets:".
Color filter:
Determine which color filter is supposed to be applied onto
the input format. The command has an influence only onto
vector elements.
State
In this area you find useful information on the used input format. The values change if
you start M-PRINT with another input format. For the duration of the M-PRINT session these information are constant.
88
Print pictures with M-PRINT
Special feature
If you mainly use M-PRINT from Drafting or I-DEAS, you can fit the color template of
the windows to the SDRC application. Change for this purpose the variable
mquest.color in the M-QUEST custom parameter file. After a further startup of MPRINT, the windows appear also in the same color as the SDRC application.
If you do not have any access on the file, login as yourself as the M-PLOT administrator.
89
M-PLOT: Chapter 6
6. The use of weight filters
Attributes are features which ones can be evaluated. If you want to print a drawing, for
example, the color of the elements can be assigned to a certain line thickness or a certain plotter pen. Another possibility consists in evaluating the element information "line
type". All solid lines are supposed to become thicker than for example a centerline.
M-PLOT was developed exactly for this working method. The working method can be
facilitated if you assign a specific screen color for every line weight. M-PLOT assigns a
pen or line thickness to every color and sends this information directly onto the output
filter.
If you use the color information however for the representation format of the drawing
(for example assemblies) then the evaluation can occur also about the line style. If the
input format is a CGM file, the line weight can be read also directly from the file.
90
The use of weight filters
Call of the dialog box "Weight filters"
The dialog box "Weight filters" can be called from different applications. Either, you
call the program M-ADMIN , M-PLOT or M-PRINT.
From M-ADMIN
Start M-ADMIN on the console or through a double click onto the shortcut. Choose
then the button "Adapt M-PLOT to your environment". A new window opens. Choose
now the button "Weight filters…".
From M-PLOT or M-PREV
Start the application on the console or through a double click onto the shortcut. Choose
then the menu command "Settings" in the menu bar. Choose next the menu item
"Weight filters...".
If the menu command "Settings" is deactivated, you do not have then any rights to
change these settings. Login yourself as the M-QUEST administrator at the system or
ask your system administrator.
91
M-PLOT: Chapter 6
Properties of the main view
The window was built up so that you see all important features at a glance. In the list
you find all already available entries. An entry is a record of settings. In our case this
are color or line evaluations. It can be well possible, that several different allocations
have to be evaluated. During the basic installation you find two entries:
· "ISO standard"
· "ANSI standard"
Illustration 6-1
Weight filters - Main view
The number of the entries and the description can be changed at any time. During the
installation you receive a default which you can accept, change or delete. Also new entries may be created.
92
The use of weight filters
Create, change or delete entry in list
The procedure for the declaration of the entries requires only a few commands. The different language fields are in this case also considered. You will see this procedure on
many further M-PLOT dialog boxes.
Command
Description
New
Enter an unambiguous index in the input field "Unique index:". An index is used in an intern way to identifying the entry. All characters are allowed, except the point, the colon and
the blank. Rename now the entry in the desired languages. If
you do not want all languages, deactivate the language control
box. This setting is valid for all entries. So that the new entry
is transferred into the list, press the button "New". If you have
not generated any new index before, the existing index is increased around the value one. This can be renamed then at any
time.
Apply
If you select the entries in the list, the respective field are reinitialized automatically. If you want to change a value, that is
valid also for the index, you must press the button "Apply" after the modification. If you change onto another list entry first,
the modification is ignored.
Remove
Deletes an entry from the list. All further options are deleted
also. You can cancel the operation when you exit the window
with "Cancel". A cancel of the window sets all settings to the
state before the call was done.
Copy
This button makes it possible, to copy the complete selected
entry. All options are also copied. The index is automatically
increased. You can change the index at any time, with the button "Apply".
93
M-PLOT: Chapter 6
94
Command
Description
Default index:
An entry in the list must be declared as default so that MPLOT can select a filter automatically. The default is selected
with a hook. Through a double click onto the line within the
list the selected line is set again as default.
Sort order:
With the two arrow keys you can determine the sequence in
the selection. The M-PLOT user sees exactly this sequence.
Properties...
This button turns on a new window with all properties of the
selected entry. The entries in this window are explained then
more exactly.
Palette...
This button turns on a new window. At this place the standard
palette can be created for all entries. This is helpful, that for
every entry in the list the same color map does not have to be
created repeatedly. All entries and commands are explained
then more specific.
The use of weight filters
Define standard pallet for weight filters
M-PLOT distinguishes two kinds of palettes: A color palette and a line palette. What is
a palette? A palette is used to comparing information from the image file with the defaults. If an entry matches, an evaluation can occur. Therefore it must be indicated in
M-PLOT to which criteria is according to be evaluated.
We thought long about how we want to treat this information. As a rule you have always the same requests. You want to subordinate the drawings also to a company standard. From this basis M-PLOT has a central (or global) palette. At this place you declare your company norm. If an entry should deviate from the norm, the palette must be
declared then also there again.
95
M-PLOT: Chapter 6
Notebook: Color table
The color table evaluates the colors from the image file. All colors, which are declared
at this place, appear in the further menus and can be assigned to a line weight. A pen allocation, to know it here as them in M-PLOT 6, is superfluous. In M-PLOT 2001 a
simpler idea is pursued: You determine a color name and the related color value. A
color name may occur repeatedly. That makes sense, because under circumstances the
color "Golden orange" is not defined everywhere alike.
Illustration 6-2
Weight filters - Palette,
notebook "Color table"
It is up to you how many colors you define. It is not necessary that you remove all not
needed colors at this place. You will see, that during the allocation, you be able to select
explicitly colors. This menu determines only how many colors stand for the menu
selection.
96
The use of weight filters
Example:
In older I-DEAS versions the color "Golden orange" was defined as follows:
Application
RGB real value
RGB decimal
Drafting
1.00000 0.66000 0.00000
255 168 0
I-DEAS
1.00000 0.66666 0.00000
255 170 0
The misalignment through the round off is for M-PLOT decisive. Would only considered the color value for I-DEAS, the color would never be evaluated in Drafting. Therefore you can determine the color itself. Also the color name is not equate to the color
name of SDRC.
The RGB color value is entered as hexadecimal value in the format RRGGBB. When
you don't know this notation, M-PLOT can help you. Press the button "Mix color…"
and you can simply mix the color.
Illustration 6-3
Weight filters - Palette, color selection
Please think of it that these colors corresponds with the ones in the image file. As a rule
you can take over the standard values. These are already optimized for Drafting and IDEAS.
97
M-PLOT: Chapter 6
Notebook: Line table
The line table is used for determining the line types again. Not every country has the
same norm. Therefore we let it up to you to declare the line types. Unlike the color palette you cannot appoint the line types yourself. M-PLOT must know what a center line
is. Only the appearance is variable.
Illustration 6-4
Weight filters - Palette,
notebook "Line table"
The values correspond to the line segments. Define so many segments until the pattern
can be repeated again. The startup begins always with a visible segment. The unit belongs on the pattern and not onto the picture format. M-PLOT converts the unit self
continuously.
98
The use of weight filters
Example:
"dash dot" = The character string would look as follows:
4 units
pen down
0.2 units
pen down
1 unit
pen up
Illustration 6-5
Weight filters - Line definition
The defaults correspond approximately to the ISO values. If these are not valid for you,
you may modify these values. Have you mistyped or when you lost, then you can use
the button "Default". All entries are deleted and initialized with the original values.
99
M-PLOT: Chapter 6
Properties of the weight filter
To the individual weight filters the properties can be changed. In this case properties are
the evaluation of the color and/or line types. Every weight filter has its own settings.
The standard palette serves as the global input format settings . If all entries of the standard palette were removed, the palettes must be declared locally. Otherwise the weight
filter cannot be used.
Notebook: Color table
This color table replaces the global color table for this weight filter. If you activate the
control box "Create a new color table", you must define at least one color. If you
should not know the colors, you simply press the button "Default". M-PLOT creates
then all primary colors of SDRC.
Caution:
Are already made allocations under the notebook "Color", a manipulation of the color
palette can deleting a
defined entry. Check
therefore always the
color allocation.
Illustration 6-6
100
Weight filter - Notebook "Color table"
The use of weight filters
Notebook: Line table
The use of a line table is like the color table. During the standard installation of MPLOT the basic palette is set on ISO. That means, that the line types are not correct for
ANSI. Therefore the line table is activated in the list entry "ANSI standard". The Standard palette is ignored and only these values are accepted.
Illustration 6-7
Weight filter - Notebook "Line table"
If you deactivate the control box "Define a new line style table", the global defaults are
then automatically valid from the standard palette. If this palette is also empty, and/or
not set, all line allocations are then deleted. The same is also valid for the removing of a
line type from the list. All relationships to this line type are deleted. That guarantees
that M-PLOT does not do any undefined allocations.
101
M-PLOT: Chapter 6
Notebook: Colors
This notebook determines, which color is assigned onto which line width. Every color
can appear only once and has accordingly also only one line width. If a color is available in the list, this is removed from the color selection. That facilitates you the setting.
The number of available colors dependents on the color table.
Illustration 6-8
Weight filter - Notebook "Color"
If you have a pen plotter, the pen number is sent then to the plotter. The order is not decisive. The pen number corresponds to the space in the roundabout. On all other printers the line thickness is sent. Therefore these values can be repeatedly identical. Only
the color is unambiguous. The units refer only to the line thickness and not to the output
format. The scaling occurs automatically in M-PLOT.
102
The use of weight filters
Notebook: Lines
At this place you indicate the evaluation of the line types. The principle is identical as
under the notebook "Color".
Illustration 6-9
Weight filter - Notebook "Line"
Reference:
Even if you print only about a weight filter, you can set the line types. The decision according to which criteria the image file is supposed to be evaluated is defined in the
style filter. Particularly pictures from I-DEAS are to be evaluated more efficiently with
the help of the line types. The colors are mostly used in a 3D system for the identification of the design steps.
103
M-PLOT: Chapter 6
Further information
In the frame title appears under the column "Definition:" the name of the loaded weight
filter file. This information is helpful so that you can check which file is just processed.
During saving of the file, M-PLOT creates automatically a backup file. You can restore
the last state at any time.
The modifications may be done also directly in the ASCII file. Every option is shortly
explained. Please note that the syntax is checked only relatively. If you understand the
architecture, greater modifications can be made elegantly. At a further save of the file
additional comments will be ignored. Also the representation format is created independently.
M-PLOT uses this table at every startup. From that at least one valid entry must be defined. M-PLOT expects that the file exists on the operating system. If the file
mplot.wgt should become corrupt, you find a correct input format in the original directory mplot.
104
The use of weight filters
105
M-PLOT: Chapter 7
7. The use of color filters
This command was implemented upon request of a lot of users. Until now the colors
could be changed on the output filter only as a whole when another color template was
selected. Today, very often efficient color printings devices are available in the office.
What does speak against it therefore not to print out a drawing also in color?
It suits on the hand that a color like yellow is not ideal very much. It would be better if
this color could be converted into an other, darker color. Or specific, important information should only be printed colored and the rest of the drawing in black.
With a color filter this request can be corresponded. Importantly is to be understood that
the line weight, as described in chapter 6, is determined first. After this is done the color
is linked. That makes it possible, not to maintain the tables twice and it is also more
logical.
Comment.
In the old M-PLOT version 6 this cycle of operations could also be simulated with a
trick. However the line weight was determined first on the assigned color.
106
The use of color filters
Call of the dialog box "Color filters"
The dialog box "Color filters" can be called from different applications. Either, you
call the program M-ADMIN , M-PLOT or M-PRINT.
From M-ADMIN
Start M-ADMIN on the console or through a double click onto the shortcut. Choose
then the button "Adapt M-PLOT to your environment". A new window opens. Choose
now the button "Color filters…".
From M-PLOT or M-PREV
Start the application on the console or through a double click onto the shortcut. Choose
then the menu command "Settings" in the menu bar. Choose next the menu item "Color
filters...".
If the menu command "Settings" is deactivated, you do not have then any rights to
change these settings. Login yourself as the M-QUEST administrator at the system or
ask your system administrator.
107
M-PLOT: Chapter 7
Properties of the main view
The window was built up so that you see all-important features at a glance. In the list
you find all already available entries. An entry is a record of settings. During the installation four entries are created:
· "No assignment" - this entry is the default. It is no color changes executed. All input
colors are sent directly to the output format.
· "White to Black" - only the white color is converted into the black color. All other
colors are sent directly to the output format.
· "Black to White" - is exactly the reverse one described as above. For logical reasons
are selected, when the background is recognized.
· "Example" - example for linking all not defined colors onto a new color.
Illustration 7-1
Color filters - Main view
If you want to consider the settings more exactly then select the desired line in the list
and press the button "Properties...".
108
The use of color filters
Create, change or delete entry in list
The procedure for the declaration of the entries requires only a few commands. The different language fields are in this case also considered. You will see this procedure on
many further M-PLOT dialog boxes.
Command
Description
New
Enter an unambiguous index in the input field "Unique index:". An index is used in an intern way to identifying the entry. All characters are allowed, except the point, the colon and
the blank. Rename now the entry in the desired languages. If
you do not want all languages, deactivate the language control
box. This setting is valid for all entries. So that the new entry
is transferred into the list, press the button "New". If you have
not generated any new index before, the existing index is increased around the value one. This can be renamed then at any
time.
Apply
If you select the entries in the list, the respective field are reinitialized automatically. If you want to change a value, that is
valid also for the index, you must press the button "Apply" after the modification. If you change onto another list entry first,
the modification is ignored.
Remove
Deletes an entry from the list. All further options are deleted
also. You can cancel the operation when you exit the window
with "Cancel". A cancel of the window sets all settings to the
state before the call was done.
Copy
This button makes it possible, to copy the complete selected
entry. All options are also copied. The index is automatically
increased. You can change the index at any time, with the button "Apply".
109
M-PLOT: Chapter 7
110
Command
Description
Default index:
An entry in the list must be declared as default so that MPLOT can select a filter automatically. The default is selected
with a hook. Through a double click onto the line within the
list the selected line is set again as default.
Sort order:
With the two arrow keys you can determine the sequence in
the selection. The M-PLOT user sees exactly this sequence.
Properties...
This button turns on a new window with all properties of the
selected entry. The entries in this window are explained then
more exactly.
Palette...
This button turns on a new window. At this place the standard
palette can be created for all entries. This is helpful, that for
every entry in the list the same color map does not have to be
created repeatedly. All entries and commands are explained
then more specific.
The use of color filters
Properties of the color filter
To the individual entries the properties can be changed. In this case properties are the
allocation of the colors. Every entry has its own settings.
Notebook: Color table
This color table is not the same one as under chapter 6 described. This takes all colors
that are supposed to be available for the evaluation of the colors.
If another menu choice is selected, the same color table is displayed. There is only a
single color table for all color assignments. We could have integrated these directly into
the main window, but you would have to switch then always back and forth between
the windows.
If you remove a color from the table, which stands in a relation, the relation is removed.
Consider it well if you remove colors.
Illustration 7-2
Color filter - Notebook "Color table"
111
M-PLOT: Chapter 7
If you want to generate new output colors that are not available as input color, then insert these also into the color table.
The RGB color value is entered as hexadecimal value in the format RRGGBB. When
you are not familiar with this notation, M-PLOT can help you. Press the button "Mix
color…" and you can simply mix the color.
Illustration 7-3
Color filter - Color selection
Remark:
All colors defined in the color table appear for the allocation (see next notebook). From
this basis also specific output colors must be stored in the palette. Otherwise you cannot
access these colors.
If you must delete a color from the palette, the relation in the selected entry is updated
like this. During the exit of the main dialog window all entries are checked automatically and brought onto the newest state.
112
The use of color filters
Notebook: Color assignment
In this notebook you can determine the assignment. How many colors you want to
evaluate, dependents only from the number of colors defined in the color table.
Illustration 7-4
Color filter - Notebook "Color assignment"
The procedure is as follows: Choose first the original color (input color) and then the
output color. Press then the button "New" and the line appears in the window.
You will nate that an input color can be evaluated only once. All already used input
colors are disabled. The output colors can be repeatedly in use.
If you like to evaluate all not indicated input colors, use the color "*" for that. In our
example the red color remains unchanged and all other input colors are linked to the
green output color.
113
M-PLOT: Chapter 7
Further information
In the frame title appears under the column "Definition:" the name of the loaded weight
filter file. This information is helpful so that you can check which file is just processed.
During saving of the file, M-PLOT creates automatically a backup file. You can restore
the last state at any time.
The modifications may be done also directly in the ASCII file. Every option is shortly
explained. Please note that the syntax is checked only relatively. If you understand the
architecture, greater modifications can be made elegantly. At a further save of the file
additional comments will be ignored. Also the representation format is created independently.
M-PLOT uses this table at every startup. From that at least one valid entry must be defined. M-PLOT expects that the file exists on the operating system. If the file
mplot.map should become corrupt, you find a correct input format in the original directory mplot.
114
The use of color filters
115
M-PLOT: Chapter 8
8. The use of style filters
A style filter determines the appearance on the output filter. This includes the fitting of
the graphics, the margins and a lot of things more. The orientation and the placement on
the paper are not determined in the style filter. That is task of the device filter. First this
cycle of operations makes it possible a universal device filter can be used.
Remark:
In M-PLOT 6 the style filter was connected at the respective device format. If you want
to save several styles, so every device filter and printing style had to be re-designed.
The device filter thus became directly dependent on the customer.
M-PLOT 2001 treads another way. You define as many styles as you need. These are
automatically valid then for all device filters. For specific device filters the style filter
can be assigned directly.
116
The use of style filters
Call of the dialog box "Style filters"
The dialog box "Style filters" can be called from different applications. Either, you
call the program M-ADMIN , M-PLOT or M-PRINT.
From M-ADMIN
Start M-ADMIN on the console or through a double click onto the shortcut. Choose
then the button "Adapt M-PLOT to your environment". A new window opens. Choose
now the button "Style filters…".
From M-PLOT or M-PREV
Start the application on the console or through a double click onto the shortcut. Choose
then the menu command "Settings" in the menu bar. Choose next the menu item "Style
filters...".
If the menu command "Settings" is deactivated, you do not have then any rights to
change these settings. Login yourself as the M-QUEST administrator at the system or
ask your system administrator.
117
M-PLOT: Chapter 8
Properties of the main view
The window was built up so that you see all-important properties at a glance. In the list
you find all already available entries. An entry is a record of settings. During the installation two entries are created:
· "Scale to user border" - the graphic is fitted onto the sheet centrally, no matter what
the size of the output format is. A margin of 10 mm is created always around the
size of paper. That sets up surely that big input formats are completely visible on a
smaller output format presupposed the hardware margins of the output filter are
smaller or equal 10 mm.
· "Scale to sheet size" - corresponds to the requests as under "Scale to user border"
with the difference, that no margin are considered. Nevertheless the hardware margins are however valid.
Illustration 8-1
Style filters - Main view
If you want to consider the settings more exactly, then select the desired line in the list
and press the button "Properties...".
118
The use of style filters
Create, change or delete entry in list
The procedure for the declaration of the entries requires only a few commands. The different language fields are in this case also considered. You will see this procedure on
many further M-PLOT dialog boxes.
Command
Description
New
Enter an unambiguous index in the input field "Unique index:". An index is used in an intern way to identifying the entry. All characters are allowed, except the point, the colon and
the blank. Rename now the entry in the desired languages. If
you do not want all languages, deactivate the language control
box. This setting is valid for all entries. So that the new entry
is transferred into the list, press the button "New". If you have
not generated any new index before, the existing index is increased around the value one. This can be renamed then at any
time.
Apply
If you select the entries in the list, the respective field are reinitialized automatically. If you want to change a value, that is
valid also for the index, you must press the button "Apply" after the modification. If you change onto another list entry first,
the modification is ignored.
Remove
Deletes an entry from the list. All further options are deleted
also. You can cancel the operation when you exit the window
with "Cancel". A cancel of the window sets all settings to the
state before the call was done.
Copy
This button makes it possible, to copy the complete selected
entry. All options are also copied. The index is automatically
increased. You can change the index at any time, with the button "Apply".
119
M-PLOT: Chapter 8
120
Command
Description
Default index:
An entry in the list must be declared as default so that MPLOT can select a filter automatically. The default is selected
with a hook. Through a double click onto the line within the
list the selected line is set again as default.
Sort order:
With the two arrow keys you can determine the sequence in
the selection. The M-PLOT user sees exactly this sequence.
Properties...
This button turns on a new window with all properties of the
selected entry. The entries in this window are explained then
more exactly.
Palette...
This button turns on a new window. At this place the standard
palette can be created for all entries. This is helpful, that for
every entry in the list the same color map does not have to be
created repeatedly. All entries and commands are explained
then more specific.
The use of style filters
Properties of the style filter
For every style you must set still the default values. Before this task is not executed the
style filter cannot be used. Exactly these settings will appear in the print preview of MPRINT. In the title of the window you see which style you just process.
Illustration 8-2
Style filter - Properties
121
M-PLOT: Chapter 8
Border dimensions
The margin dimensions determine the margins with reference to the paper margin of the
selected device filter. The values must be entered in the defined unit. The unit refer only
to the current style filter and not to the input format.
Command
Description
Unit:
Choose the unit for the margins. The input can occur in millimeter or inch.
Border:
The margins are dependent on the orientation of the input format.
The description is valid for a portrait format. With a landscape
format the description is rotated around 90 degree clockwise
(European consideration or first angle).
Illustration 8-3 Style filter - Margin settings
When your printer has a not a printable area and you define the
values in a smaller way than these boundaries, then the difference
is not printed.
122
The use of style filters
Command
Description
Picture origin:
With the picture origin you determine where the graphics are
supposed to be placed. For this purpose nine different origins
stands for you to select. The orientation is directly dependent on
the sheet and graphics orientation.
Illustration 8-4 Style filter - Picture origins
123
M-PLOT: Chapter 8
External settings
In this section you can link the different external defaults onto the current style filter.
That makes it for you possible, that with a selection of a specific style filter all necessary external filters are also reset. If the control box is not selected, the default value of
the respective filter is used.
Command
Description
Scale thickness:
During the output it can be useful that the thickness of the line
weight can be controlled. Four possibilities are available:
· "Constant" - the line weights are not changed independent of
the output scale.
· "Proportional" - the line weights are changed dependent on
the output scale.
· "When bigger 1:1" - the line weights are enlarged only then
if the output scale is bigger than one.
· "When smaller 1:1" - the line weights are justified only then
if the output scale is smaller than one.
Interprets:
Three options for the selection stand to you:
· "Thickness of output" evaluates the thickness information directly from the input file.
· "Color = Line thickness" searches from the chosen weight
filter the allocation for color and adds the thickness to the
element.
· "Style = Line thickness " searches from the chosen weight
filter the allocation line type and adds the thickness to the
element.
124
The use of style filters
Command
Description
Weight filter:
Determine which weight filter is supposed to be applied. The
definition is interpreted directly from the menu "Interprets:".
Color filter:
Determine which color filter is supposed to be applied onto the
input format. The command has an influence only onto vector
elements.
Important:
The linking of external filters with the current style is efficient, but can contain also
some risks in it. A thickness or color filter can also be linked directly to a device filter.
If the value does not change, it can be that at a preceding place the value was already
set. The priority of setting filters is as follows:
1.
2.
3.
4.
Input arguments of M-PLOT batch
Device filter (mplot.set)
Style filter (mplot.sty)
Default value of the individual filters (mplot.wgt, mplot.map, mplot.sty)
We recommend following procedure: At a device filter a link to an external filter is
only then created, if the line weights deviate on this devices or the hardware margins
require an own style filter. When a different device is in M-PRINT selected the style
filter is changed only if this is in fact necessary. In the style filter the external defaults
can be then linked individually. That facilitates the location of links much more easily.
Alike which technique you decide for, M-PLOT allows the individual configuring of
default values.
125
M-PLOT: Chapter 8
Default settings
These settings can also in M-PRINT with the button "Preview..." changed. It is reasonable to adapt the style filter so that the user of M-PRINT should not make any modifications in normal case. That increases the performance and we come closer to the "one
button plot".
Command
Description
Use background
information for output.
This option becomes active, when the input format stores
the background explicitly. Currently these are the input filters: CGM, PFF and PNG. With all other input formats the
control box is deactivated.
Dither solid fill polygon
(only B/W mode).
If the input format supports filled polygons (rectangular,
circles, cake diagram or polygons), an additional query
must occur during the output in a monochrome-format. If
the control box is activated the filling is dithered. Otherwise the filling is put in the black color.
Why this query? As a rule you want filled arrows in full
black and not dithered. In I-DEAS a polygon is supposed to
be displayed dithered.
126
Draw paper sizes as a
thin box on the paper.
This option draws the paper dimension according to a fine
pen (0.2mm) and the line type "phantom". That makes it
for you possible that you can trim the format, if the paper
medium is bigger than the chosen paper size. If the paper
medium is of the same size as the output format, or if
hardware margins are defined, this option is ignored.
Put additional text on
output format.
If the control box is activated, an additional text can be positioned below to the left on the output format. The text can
be entered individually. Use for this purpose the button
at the end of the line. The text can be preset also in the style
filter or in the M-QUEST parameter file.
The use of style filters
Command
Description
Set picture size on output:
This area defines the output size of the content on the output format:
· "Fit in: (all entities visible)" - calculates always the optimal scale so that the input format has space on the output format. Also the style filter is considered for this.
The printer margins are ignored.
· "Scale:" - Define or select the desired picture scale. In
the display application the result is immediately visible.
If nothing is visible, that can have been enlarged either
into a white area or the scale is so small that no display
occurs.
127
M-PLOT: Chapter 8
Further information
In the frame title appears under the column "Definition:" the name of the loaded weight
filter file. This information is helpful so that you can check which file is just processed.
During saving of the file, M-PLOT creates automatically a backup file. You can restore
the last state at any time.
The modifications may be done also directly in the ASCII file. Every option is shortly
explained. Please note that the syntax is checked only relatively. If you understand the
architecture, greater modifications can be made elegantly. At a further save of the file
additional comments will be ignored. Also the representation format is created independently.
M-PLOT uses this table at every startup. From that at least one valid entry must be defined. M-PLOT expects that the file exists on the operating system. If the file
mplot.sty should become corrupt, you find a correct input format in the original directory mplot.
128
The use of style filters
129
M-PLOT: Chapter 9
9. Setting-up of device filters
All used device filters are registered in M-PLOT once. A device filter can be a printer,
plotter or an interpreter for a picture file. The input format is sent through an intern interpreter and translated into the respective "language". Then the plot file can be stored
on the operating system or sent directly to an printer queue.
The sending to a output filter occurs always via a existing queue on the operating system. M-PLOT does not arrange any printers on the operating system. That likes to appear complicated onto the first look, but has the advantage that you can use every arbitrary program to send the job onto the printer. Even your own scripts can be called this
way.
The interpreter operates as a "filter". A filter is a pure ASCII file with the file extension
"*.def" in M-PLOT. Unlike M-PLOT 6 no further settings have to be done on this
file. If you understand the setup of the file, you can do arbitrary optimization in the filter file. But in normal case that is not necessary.
Remark:
All filter files (at this time approx. 700 pieces) are available in the languages of English,
French, German and Italian. You can get the most actual filters also directly from our
home page.
130
Setting-up of device filters
Call of the dialog box "Device filters"
The dialog box "Device filters" can be called from different applications. Either, you
call the program M-ADMIN, M-PLOT or M-PRINT.
From M-ADMIN
Start M-ADMIN on the console or through a double click onto the shortcut. Choose
then the button "Adapt M-PLOT to your environment". A new window opens. Choose
now the button "Device filters…".
From M-PLOT or M-PREV
Start the application on the console or through a double click onto the shortcut. Choose
then the menu command "Settings" in the menu bar. Choose next the menu item "Device filters...".
If the menu command "Settings" is deactivated, you do not have then any rights to
change these settings. Login yourself as the M-QUEST administrator at the system or
ask your system administrator.
131
M-PLOT: Chapter 9
Properties of the main view
The window was built up so that you see all-important features at a glance. In the list
you find all already available entries. An entry is a record of settings. During the installation different output filters are arranged. With these output filters you can work already
The window offers to you as usual a button with the properties of the selected output
filter. Further more you can limit the list either for the registered user or workstation.
Illustration 9-1
Device filters - Main view
If you want to consider the settings more exactly, then select the desired line in the list
and press the button "Properties...".
132
Setting-up of device filters
Create, change or delete entry in list
The procedure for the declaration of the entries requires only a few commands. The different language fields are in this case also considered. You will see this procedure on
many further M-PLOT dialog boxes.
Command
Description
Apply
If you select the entries in the list, the respective field are reinitialized automatically. If you want to change a value, that is
valid also for the index, you must press the button "Apply" after the modification. If you change onto another list entry first,
the modification is ignored.
Remove
Deletes an entry from the list. All further options are deleted
also. You can cancel the operation when you exit the window
with "Cancel". A cancel of the window sets all settings to the
state before the call was done.
Copy
This button makes it possible, to copy the complete selected
entry. All options are also copied. The index is automatically
increased. You can change the index at any time, with the button "Apply".
Default index:
An entry in the list must be declared as default so that MPLOT can select a filter automatically. The default is selected
with a hook. Through a double click onto the line within the
list the selected line is set again as default.
133
M-PLOT: Chapter 9
Command
Description
Sort order:
With the two arrow keys you can determine the sequence in
the selection. In this list the arrow keys have a special importance:
A selected entry shifts a position with every click after
above. A hierarchical architecture is skipped over on the
same level. If the entry is a submenu, the complete architecture of this menu is shiftd then. A separator line is
treated as a printer entry.
The selected entry is shiftd around a position after below.
If the next line is a submenu, it is changed into this architecture. If the submenu is not available yet, the architecture is generated. If the selected entry is the last line
within the architecture, the entry is placed a level more
highly but at the same position.
134
Properties...
This button turns on a new window with all properties of the
selected entry. The entries in this window are explained then
more exactly.
Restrictions...
This button turns on a new window for the limiting of the
number of device filters. The restriction can be set either to
the user or the workstation.
New device ...
This button turns on a new window for the selection of a new
output filter from the device library. The existing index is
used. If this is not unambiguous, an additional identification is
added.
New submenu
Construct a new submenu. The text is accepted from the language entries. The hierarchy becomes first active if an entry is
shiftd about the menu choice from above.
Add separator
Generate a separator line in the menu. This divides the menu
in optically areas.
Setting-up of device filters
Choose a new output filter
With this button you create a new output filter in M-PRINT. Two different ways are
available to you for this purpose: You retrieve an output filter directly from the library
or from the operating system. When you retrieved a filter directly from our home page
first case provides a technique to integrate the drive into M-PRINT.
During the installation all known filters are copied into a specific subdirectory. That
makes it possible for you, to install new filters fast and simply. Currently new filters are
developed and directly released on our home page. You can save then the filter locally
and install the filter in M-PRINT.
Illustration 9-2
Device filter - New device filter
from library
The list contains more than 700 different filters. During the first opening, all filters
must be opened shortly in order to determine the necessary information. That takes at
least a certain time. Please do not become impatient therefore.
135
M-PLOT: Chapter 9
Then all filters are listed after manufacturer. Unfortunately we cannot create all filters
available on the market. But the most customary filters should be available. If your
printer should not be available, you can use a generic filter instate. This filter makes the
most important properties available. Initial sequences will not be sent.
Remark:
The output device must be able to interpret the emulation automatically. Otherwise the
devices must be set in a way that the printer language is understood.
After you selected a filter, this is copied from the library into the subdirectory custom/mplot2k1/model. You can then modify the filter without changing your original
filter. During the loading of a filter, which is not in the library a link is generated directly onto this file. Therefore, caution while changing.
After the confirming of the button "OK" the information are transmitted into the main
window.
136
Setting-up of device filters
File filter (translator)
Filters that always create a file are in the library list "translator" combined. These filters
are optimized, so that the output file is created just the same as the input format is. Scaling, orientation and so on are ignored.
Following file filters are available:
File filter
Description
Adobe EPS
PostScript file with included TIFF image. This file cannot be printed
out directly. The output must occur always about an application.
Adobe PS
PostScript file without formatting.
Adobe PDF
PDF file for preview programs like Adobe Reader.
HP-GL
HP-GL file without formatting.
HP-GL/2
HP-GL/2 file without formatting.
TIFF
TIFF image file.
JPEG
JPEG image file.
PNG
PNG image file.
SDRC
SDRC formatted image file.
CGM
CGM image file.
137
M-PLOT: Chapter 9
Emulation
An emulation is nothing else than the "language" of the filter. M-PLOT was expanded
with new emulations. The praxis showed us that the least users know the differences between the emulations. In M-PLOT it is decisive that you use the correct emulation.
Therefore we want to explain all emulations shortly.
Remark:
The author does not know all formats into the last detail. Comments are personal experiences with the respective emulation. It can be good that you had other experiences.
HP-GL (Graphic Language)
This emulation was developed primarily for pen plotters. Lines, circles are sent so forth
as vectors to the output filter. The device must be able to construct a line about the
startup and final point. A pen plotter can do this task since this moves the physical pen.
Also polygons can be filled. This task is just the same as if you fill a polygon with a
pen. If another line weight is supposed to be drawn, the pen is changed or an offset
along the existing line is drawn with the same pen. Pictures (raster data) cannot be displayed. With a trick pictures can be emulated when every pixel element is drawn with a
filled rectangular. That takes a long time and requires a gigantic data set.
138
Vectors
Raster data
Is a M-PLOT license needed?
yes
no
no
Setting-up of device filters
HP-GL/2 (Graphic Language Extended)
The number /2 stands for extension. The emulation was expanded with new commands.
Line weights can be determined directly about a real value. Also colors can be addressed directly. This emulation is regarded today as standard on large size printer.
Dithering of surfaces is supported. Pure pixel information's are not supported.
Vectors
Raster data
Is a M-PLOT license needed?
yes
no
no
HP-RTL (Raster Transfer Language)
This emulation is the logically further development of HP-GL/2. Also raster data can be
computed again. All vectors are sent in the format HP-GL/2 and all raster data in the
format HP-PCL. If no vectors are available, the picture can be printed immediately, that
is as soon as the first scan line received the output device. That makes it possible to
process gigantic pictures with a very small printer memory. If only a single line follows
the picture, the complete picture must be loaded first into the printer main memory in
order to construct the line. M-PLOT supports both processes: TIFF pictures are processed on principle according to the first means. I-DEAS pictures are checked whether
vectors are contained or not. If that is the case, the output device must be able to load
the complete picture. Also oversize plots are supported. This filter was developed especially for " HP DesignJet" plotters.
Vectors
Raster data
Is a M-PLOT license needed?
yes
yes
yes
139
M-PLOT: Chapter 9
HP-PCL (Printer Command Language)
PCL was developed for the laser printers. This emulation offers a gigantic language
range. All information's are computed internally in printer points. The printer resolution
plays an important roll in this case. Different levels still are distinguished between:
PCL3 is the first step. All information must be computed by the software like color,
dithering, etc.. PCL5 has already an expanded command set. M-PLOT supports both
levels. Vectors are converted first into a image file and joined with the picture information. To the output filter a pure image raster file is always sent.
Vectors
Raster data
Is a M-PLOT license needed?
yes
yes
yes
HP-PCL/GL2
That is not an official emulation. This is used to initializing PCL5 printers with the PCL
emulation and sends the graphics as a pure HP-GL/2 emulation on the laser printer by
M-PLOT. Through that, the formatting is correct on the paper and no license has to be
ordered in M-PLOT.
140
Vectors
Raster data
Is a M-PLOT license needed?
yes
no
no
Setting-up of device filters
Epson ESC/P2
This language is used for EPSON printers. The language accepts only raster information. All vectors must be first converted into pixels. The colors are created only through
dithering of the different color planes. Every printer's ink (CMYK) is sent for itself.
The enhancement P2 can be applied only on "EPSON Stylus" printers. The languages
ESC and ESC/P are not yet supported by M-PLOT.
Vectors
Raster data
Is a M-PLOT license needed?
yes
yes
yes
Adobe PS (PostScript)
That is with distance the most familiar printer language. This is applied in the professional DTP area. In order to work off the enormous functional scope, the output filters
have own hardware interpreters. So that PostScript may be used, a license must be acquired. That is also the fact, why PostScript printers are expensive, especially as an own
computer and royalties are included in the purchase of the devices. M-PLOT supports
the PS levels 1 and 2. According to the output color model the best PS level is chosen.
PostScript Printer with level 3 can be also used because they support also level one and
two.
Vectors
Raster data
Is a M-PLOT license needed?
yes
yes
no
141
M-PLOT: Chapter 9
Adobe EPS (Encapsulated PostScript)
This emulation was developed especially for DTP (desktop publishing). During the setting of the graphic within the document the content is supposed to be displayed in
coarse manner. The content is supposed to be sent with the maximum quality on the
output filter. Following technique is applied for this purpose: The image is a pure TIFF
file and for the output a PostScript file is used. Both files are combined into an EPS file.
You see that an EPS file cannot be sent to an output device directly. This must be integrated in a document before it can be printed.
Vectors
Raster data
Is a M-PLOT license needed?
yes
yes
yes
Adobe PDF (Portable Document Format)
This file format is ideal for the archiving of drawings and pictures. The company Adobe
offers a preview program free of all charges (Adobe Reader). Vectors are stored as
such. The printing about the preview program is no problem and can occur in the
maximum quality. M-PLOT can create the PDF file directly. The properties of the input
format are exhausted in this case optimally.
Caution is offered with the chosen PDF version. The more highly the PDF version, the
more commands are internally supported. Not all preview programs support the full
command set.
142
Vectors
Raster data
Is a M-PLOT license needed?
yes
yes
yes
Setting-up of device filters
TIFF (Tagged Image File Format)
This raster format is today a standard. Many applications can read this format and reprocess this format. TIFF supports many different compressing procedures in order to
reduce the file size. The respective compression format is dependent directly on the
color depth of the TIFF file. The compression method "LZW" is not supported from legal grounds in M-PLOT.
Vectors
Raster data
Is a M-PLOT license needed?
yes
yes
yes
JPEG (Join Photographic Experts Group)
This file format is established in the Internet. The great advantage of JPEG is in the
possibility to pack the picture information very well. Also the replacement with other
graphics applications is guaranteed. Pure monochrome pictures must be stored in the
color mode 8bit. JPEG does not have any explicit 1bit mode. In this case TIFF is the
better choice.
Vectors
Raster data
Is a M-PLOT license needed?
yes
yes
yes
PNG (Portable Network Graphics)
Also this format is used more and more on the Internet. It replaces the distributed GIF
format. A specialty of PNG is the possibility to mask out the background of a picture
explicitly. That makes the placing of graphics with transparency possible. M-PLOT
supports this technology.
Vectors
Raster data
Is a M-PLOT license needed?
yes
yes
yes
143
M-PLOT: Chapter 9
PFF (Picture Formated File)
This is an exotic file format. The company SDRC uses this format for the data exchange, the archiving and for printing. M-PLOT can read and write this format. That
guarantees that an existing archive keeps on being able to be continued even if this format is not supported anymore by SDRC.
PFF does not support any compressing procedures. Therefore caution is offered, when
big image files are converted into this format. The file size can get extreme dimensions.
Vectors
Raster data
Is a M-PLOT license needed?
yes
yes
no
CGM (Computer Graphics Metafile)
CGM is a high-complex file format. Vector and raster dates can be stored together. Also several documents can be in the same file stored. The functional scope increased
continuously. In the meantime data's can be exchanged with this file format from the
most different applications.
M-PLOT supports currently only the version 1.0 of CGM. Patterns and fonts are not
supported yet. All other elements are read and converted correspondingly. Even complex CGM files of CorelDRAW can be read.
144
Vectors
Raster data
Is a M-PLOT license needed?
yes
yes
(only for writing, reading is free)
Setting-up of device filters
Properties of the device filter
After you installed a filter in M-PLOT, you can subsequently change the properties of
this filter. If you have arranged a printer, M-PLOT does not know where the plot file is
supposed to be sent yet. Or you want to guarantee that during the selection of the device
filter the correct style filter is selected automatically. You can assign all these features
at any time.
Illustration 9-3
Device filter - Properties of the selected device filter
Modifications on current device
This section shows the physical position of the filter file to you. You can reload also at
any time another filter. In this case the properties are not modified only the filter file
copied again.
145
M-PLOT: Chapter 9
Command Description
File:
File name of the current output filter.
The dialog box turns on for the interactive selection of a new device filter.
This can be selected directly on the operating system.
The dialog box "Choose of a new device filter" turns on. That allows
you to load a new filter from the filter library. The existing filter is not deleted in this case. If you execute these steps repeatedly and you do not use
the filter, the filters are in the subdirectory custom/mplot2K1/model
stored but not in use.
The dialog box turns on for the tuning of the defaults of the current filter.
Only listing values can be set. All other defaults must be set directly in
the device filter.
External settings
The idea of this section is that you can explicitly assign a style filter and/or a weight filter to an output filter. Alike what the preceding setting was as soon as the user selects
this output filter the settings are changed.
146
Command
Description
Style filter
(mplot.sty)
If the control box is activated, a certain style filter can be assigned.
This is always set when the user selects this output filter in MPRINT.
Weight filter
(mplot.wgt)
If the control box is activated, a certain weight filter can be assigned.
This is always set when the user selects this output filter in MPRINT.
Color filter
(mplot.map)
If the control box is activated, a certain color filter can be assigned.
This is always set when the user selects this output filter in MPRINT.
Setting-up of device filters
Print commands
This section is the heart of M-PLOT. First when this option is enabled and defined, you
can send a plot file to the printer. The manipulation was dramatically optimized in
comparison with M-PLOT 6. Still some information must be entered "by hand".
You see two control boxes, one for the UNIX platforms and one for the platform Windows NT/2000. Again, the file mplot.set can handle both platforms. The commands
for sending the plot file are completely different. From this basis the section was divided into two areas. If you do not print in a heterogeneous environment, you only activate the control box for your used platform.
Remark:
This step is only then necessary if you want to send the plot file to an output device.
These options are deactivated if you print into a file.
Command Description
The menu shows different, predefined print commands to you. Select the
desired one. The entry is not activated before the button is pressed. The
complete line is reinitialized.
After pressing the button a simple text editor is opened. The complete
command is performed. You can process the command line now, after the
requests of your print program. All commands of M-PLOT must be still
checked.
147
M-PLOT: Chapter 9
Change print command
After you pushed the icon
a simple text editor opens. This allows you, to change the
current command and/or to create a complete new command with the M-PLOT variables.
Illustration 9-4
Device filter - Change print command for device filter
The entries, which still have to be modified, are marked with the characters "<...>".
Replace the character with the necessary information's. An example of a Windows
NT/2000 computer:
Default:
sdrcNTlp -d {\\<host>\<printer>} -r -t $PIC_FILE $PLT_FILE
After the modification:
sdrcNTlp -d {\\wsmm\pr4} -r -t $PIC_FILE $PLT_FILE
So that you can check the connection and the print command, M-PLOT can send a test
page to the output filter. An already formatted drawing is sent for this purpose to the
print command. You will get a message how the test has performed.
148
Setting-up of device filters
Restrictions
M-PLOT offers the possibility to you to limit the device list either for the user or the
workstation. That gives you the safety that the user can select only output filters, which
are certain for this user or workstation.
Illustration 9-5
Device filters - Activating restriction of the device list
149
M-PLOT: Chapter 9
Set new criteria
If you have not set any restrictions yet, the complete window is deactivated. In this case
all users have full access. Determine first according to which criterion you want to do
the restrictions.
Command
Description
"Allow access to all
devices"
That is the default, all users or workstations have access onto
the complete device list. This setting is reasonable, if you have
installed only a few devices and these are present on all computer.
"Only for registered
workstations"
By means of the name of the workstation the restriction is executed. Reasonably on UNIX platforms, since on these platforms the printer queues must be available.
"Only for registered
users"
By means of the user name the restriction is set. The procedure
is identical as for a registered workstation .
Unknown host/user
Now we must consider also the case when a user is logged in, which is not performed in
the list. The same one is also valid for a workstation.
150
Command
Description
"Allow access to all
defined devices"
If a user or a workstation is unknown, all devices are released.
That is a good possibility to make all printers to you available
as an administrator.
"Deny access for
M-PLOT"
All users or workstations must be known. All unknown names
are refused. M-PLOT cannot be started.
Setting-up of device filters
Selection according to registered host/user
Independently of the set of the criterions the procedure is always the same one. You can
change at any time the criterion. The settings are saved in the file mplot.set even if
you deactivate the restrictions. First if you delete the users or the workstation from the
list, these are also removed in a permanent way.
The procedure for the placing of a new workstation or user is as follows:
3 If no name is performed in the list until now, you must first declare a valid name in
the entry field. Press then the button "New".
An output filter is moved automatically into the new, limited device list. At least one
device must be selected since otherwise the restriction does not do any sense.
3 Move now as many as desired devices from the table "Available devices:" with the
arrow key . The number of available devices depends from the number installed
device filter.
3 You can modify also the list of the "Released devices:" when you change the default
value or determine the sequence again in M-PLOT.
3 If you agree, you must press the button "Apply". If you enter a new name first the
modifications are ignored.
3 Repeat these steps until you have done all needed restrictions.
3 Quit the window with "OK" in order to take over the settings. The button "Cancel"
ignores the modifications.
151
M-PLOT: Chapter 9
The window could have following content:
Illustration 9-6
Device filters - Example of restriction on a workstation
Remark:
If you add subsequently new output filters in M-PLOT, you must release the new devices per users or workstations.
152
Setting-up of device filters
Further information
In the frame title appears under the column "Definition:" the name of the loaded weight
filter file. This information is helpful so that you can check which file is just processed.
During saving of the file, M-PLOT creates automatically a backup file. You can restore
the last state at any time.
The modifications may be done also directly in the ASCII file. Every option is shortly
explained. Please note that the syntax is checked only relatively. If you understand the
architecture, greater modifications can be made elegantly. At a further save of the file
additional comments will be ignored. Also the representation format is created independently.
M-PLOT uses this table at every startup. From that at least one valid entry must be defined. M-PLOT expects that the file exists on the operating system. If the file
mplot.set should become corrupt, you find a correct input format in the original directory mplot.
153
M-PLOT: Appendix A
A. M-PLOT installation
M-PLOT is seamlessly integrated into the M-QUEST environment. In this chapter the
peculiarities of M-PLOT and the directory structure are explained. You can look up the
general setup of the M-QUEST architecture in the manual M-ADMIN 2001.
You can adapt M-PLOT. If you install a new output filter, you deviate already from the
standard installation. M-PLOT was configured during the installation in a way, that all
your settings are stored automatically into the custom directory. That gives you the safety that at a re-installation or at an update your settings are not lost.
154
M-PLOT installation
The directory structure of M-PLOT
If you install M-PLOT, the directory mplot is created. This contains all files, which are
necessary for the execution. Also all until then known device drivers are installed. The
files, which are changed by you, are in the custom directory stored. This directory is
only created if M-PLOT was not installed before.
1 mquest2001
/ mquest2k1_win.ini
/ mquest2k1_unix.ini
1 cmd.win
/ M-PLOT.LNK
/ mplot.cmd
/ mplot.ico
/ M-PREV.LNK
/ mprev.cmd
/ mprev.ico
/ mplotbatch.cmd
1 cmd.unix
/ mplot
/ mprev
/ mplotbatch
1 custom
/ custom2k1_win.ini
/ custom2k1_unix.ini
1 mplot2k1
1 analysis
/ custom.set
/ custome.gif
1 model
/ pdf.def
/ tiff.def
...
/ mplot.set
/ mplot.sty
/ mplot.wgt
/ mplot.map
Illustration A-1
All settings for M-PLOT are initialized
at this place.
M-PLOT as a stand alone application.
M-PLOT Preview.
M-PLOT Batch.
M-PLOT as a stand alone application.
M-PLOT Preview.
M-PLOT Batch.
During first installation, the most
important settings are created.
Files for the additional analysis
application.
Place of the installed device filter
files from M-PLOT..
All
All
All
All
available
available
available
available
device filters.
style filters.
weight filters.
color filters.
M-PLOT directory tree, part 1
155
M-PLOT: Appendix A
1 mplot
1 model
1 driver
/ pdf.def
/ tiff.def
1 prg
/ mplot_draft.prg
/ mplot_ideas.prg
/ mplot_quick.prg
1 src
/ mplot.l0.ini
/ mplot.l1.ini
/ mplot.l2.ini
/ mplot.l3.ini
/ mplot.l4.ini
/ mplot.mqx
/ mplotbatch.mqs
/ mprint.mqx
/ mprev.mqx
/ mreplay.mqs
/ mplot.set
/ mplot.sty
/ mplot.wgt
/ mplot.map
1 tools
Device filter library.
Drafting Detailing macro.
I-DEAS Master Series macro.
I-DEAS “one button plot” macro.
Language file: English.
Language file: French.
Language file: German.
Language file: Italian
Language file: Spanish.
M-PLOT program.
M-PLOT Batch program.
M-PLOT Print program.
M-PLOT Preview program.
M-PLOT Replay program.
Original files.
Bold = modification can be done on this files.
Illustration A-2
M-PLOT directory tree, part 2
cmd.win and cmd.unix directory
According to the used platform the different start scripts are created. Do not modify
these manually. If the M-QUEST environment is created in M-ADMIN, all startup
scripts are created or rebuild.
156
M-PLOT installation
mplot directory
This directory contains all necessary files for the execution of M-PLOT. Please do not
change any files in this directory. The modification does not become effective. All relevant files for the modifying appear in the directory custom.
The macros for Drafting and I-DEAS are in the subdirectory prg stored. When you
don't work with M-BASE, you can copy the macros onto a different place and you can
modify the macros. If you want to use the macros, the SDRC environment must be in
M-QUEST known and set. If that is not the case, the macros cannot be started.
custom directory
The custom directory is a component of the M-QUEST environment. The default of the
position is direct below the M-QUEST installation directory. You can subsequently
change the position with the M-QUEST-varbs file. If M-PLOT is installed the directory
mplot2k1 is checked of existence. If this does not exist, the relevant files are copied
into this directory by M-PLOT. The environment in the parameter file is set onto this
directory. If this already exists, nothing is done there.
Important:
All settings are stored in the subdirectory mplot2k1. The device drivers are copied automatically into this directory from the library.
157
M-PLOT: Appendix A
M-PLOT parameter
M-PLOT has a large number of parameters. All parameters are defined in the MQUEST parameter file. Modifications at the defaults are brought in the custom parameter file. If a parameter, which you would like to change, is missing you can copy the parameter line from the M-QUEST parameter file into the custom parameter file.
Some parameters demand a directory or a file name. Since these parameters can be set
at different places, the name of the parameter file is brought in the column "Value".
This file is read at a standard installation at last.
Short survey of the possible parameters:
Variable
Values
Description
mplot.dir.model
custom2k1_param
Determines the position of the installed MPLOT device filters.
mplot.dir.library
mquest2k1_param
Points onto the directory of the filter library.
mplot.file.device
custom2k1_param
Defines the file with all installed output filters.
mplot.file.style
custom2k1_param
Defines the file with all style filters.
mplot.file.weight
custom2k1_param
Defines the file with all weight filters.
mplot.file.colormap
custom2k1_param
Defines the file with all color filters.
mplot.file.prg.ideas
mquest2k1_param
Points onto the I-DEAS macro. If you rename
the macro, or copy the macro onto another
place, you must adapt this parameter. Drafting
does not need this parameter. The position is directly indicated in the icon file drafting.icn
or masterdrafting.icn.
158
M-PLOT installation
Variable
Values
Description
mplot.exit
true false
If true, M-PRINT is exited after printing otherwise the user must quit M-PRINT explicitly.
mplot.rmoutputfile
true false
If true, the user can select the control box "Remove output file" otherwise the command is disabled.
mplot.outputcommand
true false
If true, the user can select the button "Modify..."
in M-PRINT and can change the print command.
mplot.paper.list
iso ansi ""
Determine the paper rubric for the paper selection in the device driver. If the value is empty,
all available format items are used (ISO and
ANSI).
mplot.penwidth
0.3 [mm]
Default pen width for M-PLOT. This is used,
when you choose the menu "Thickness from input" and no weight is defined in the input file.
mplot.stamp
text
Default text for the additional label of the output
format. This text can be set also in the style filter.
mplot.sdrc.mappeng
automatic
manual
If the value is set to "automatic" it is determined by means of the input format whether it is
a question of a Drafting- or I-DEAS drawing. A
Drafting drawing is set to "Color = Line thickness" and the I-DEAS drawing with "Style =
Line thickness". "manual" excludes the settings
and uses the defaults from the style filter.
159
M-PLOT: Appendix A
Variable
Values
Description
mplot.sdrc.drafting.filename
item_name
item_number
Defines, whether the name or the drawing number are used for the plot file as a file name. This
entry is only active if Drafting is started with the
TDM.
mplot.sdrc.drafting.viewborder
true false
Determines, whether the view borders are printed or not.
mplot.sdrc.drafting.intellfonts
true false
If this variable is set the line types are processed
as individual lines. You see then exactly the
same output on the output filter. Is the variable
not set the output filter creates the line type. The
representation format is not identical, but faster.
mplot.sdrc.drafting.plotlayer
true false
If the value is set the layer attributes are also
read.
mplot.sdrc.drafting.noweight
true false
Line weights are not processed within Drafting
even if the drawing contains such. The output is
importantly faster and the plot file smaller.
mplot.sdrc.drafting.nosolidfill
true false
Filled areas are not filled.
mplot.sdrc.drafting.deviation
0.0254
Determines the precision, which the curve sequences are processed.
mplot.sdrc.drafting.layers
"1-256"
Defines, which layers for the printing are supposed to be considered.
160
M-PLOT installation
Variable
Values
Description
mplot.asc.process
mplot.dwg.process
mquest2k1_param
Command to start the application in order to
process ASC or DWG drawings.
mplot.asc.preview
mplot.dwg.preview
custom2k1_param
Application for displaying of ASC or DWG
drawings. If the value is not set the drawing is
converted first into a PFF file with the defined
applications "mplot.asc.process" or
"mplot.dwg.process".
mplot.pff.preview
custom2k1_param
Determine the application for the displaying of
PFF files. If the value is not set, M-PREV is
started.
mplot.cgm.preview
custom2k1_param
Determine the application for the displaying of
CGM files. If the value is not set, M-PREV is
started.
mplot.tiff.preview
custom2k1_param
Determine the application for the displaying of
TIFF files. If the value is not set, M-PREV is
started.
mplot.jpeg.preview
custom2k1_param
Determine the application for the displaying of
JPEG files. If the value is not set, M-PREV is
started.
mplot.png.preview
custom2k1_param
Determine the application for the displaying of
PNG files. If the value is not set, M-PREV is
started.
If a value is not set correctly, please check the entry also in the custom or user parameter file. If you still have questions to the setup of the parameter file, you can consult the
user manual M-ADMIN 2001.
161
M-PLOT: Appendix B
B. Examples
The manual is built in a way that all menus and commands are explained. This can look
sometimes very abstractly since the relation is missing. A simple example can explain a
lot of things at the same time. From this point of view we want to show example from
the field.
So that we don't have to begin always by Adam and Eva, this chapter is built in a way
that preview examples are recognized. The user prompting is fully explained at the beginning and with the time less and less. That allows us to show you more possible examples and facilitates also the overview is much better.
Should you lose therefore once the red line, go back again to an example you feel secure. No fear, M-PLOT uses always the same provided menus. If you have understood
the system once, you can derive all other commands.
162
Examples
Example 1
What you learn in this example
If you test this example, you understand the idea of a weight filter, you can create an
individual color table and assign specific line weights and plotter pens to new colors.
Starting position
We closely collaborate with another company. This company can have the same CAD
system like we have. Is that not the case, the drawings can also be exchanged about an
external file format, like for example CGM.
What can the customer do for us?
We know that this company provides 2D drawings with color identification. A line
weight can be assigned to every color. If 3D templates are exchanged, the color of the
lines cannot be evaluated since this information is needed for the displaying of the assemblies. In this case the application writes line weights into the file. The information
of the line types is also saved.
How do we want to proceed?
We have a modern ink-jet plotter and an older pen plotter. Both devices must print out
the information correctly. We evaluate for this purpose the information's as follows:
163
M-PLOT: Appendix B
Name of the customer: "Mold-Tool Corporation"
164
Evaluate colors:
Evaluate line types:
Color
Line weight
Line type
Line weight
Green
0.25 mm
Solid lines
0.50 mm
Light blue
0.25 mm
Center lines
0.35 mm
Gray 50 %
0.35 mm
Invisible lines
0.25 mm
Red
0.35 mm
All other line types
0.25 mm
Yellow
0.50 mm
Blue
0.70 mm
Pen carousel of the plotter:
Remark:
Pen no.
Line weight
Pen 1
0.25 mm
Pen 2
0.50 mm
Pen 3
empty
The color can be operated at a pen
plotter only about a roundabout with
colored pens. The thickness of the
lines on the other hand with the pen
width. The allocation of the roundabout must be known in M-PLOT.
Pen 4
empty
Pen 5
0.70 mm
Pen 6
empty
Pen 7
0.35 mm
Pen 8
empty
The pens do not have to be arranged
in turn. M-PLOT notices the space
and the pertinent thickness. The
thickness is necessary so that the optimal pen can be determined also at
pure monochrome output. The smallest misalignment is then computed.
Examples
Create a new weight filter
First we arrange the entry in the list. We will use only the languages German and English in our example.
3 Start M-ADMIN on the console or through a double click onto the shortcut. You
choose then "Adapt M-PLOT to your environment". A new window opens. Choose
now the button "Weight filters…".
3 Press the button "New".
3 Change the index in pmc.
3 Change the text fields "English:" and "German:". Enter the description "Mold-Tool
Corporation".
3 Deactivate the control boxes "French: ", "Italian:" and "Spanish:".
3 Press the button "Apply".
Tip:
If you would change
now onto another list
entry, then the entries
are read again and reinitialized. If you select
an entry before you
pressed the button
"Apply", the modification is ignored. Change
again onto our newly
defined entry "MoldTool Corporation".
Illustration B-1
Example 1 - Create a new weight filter
165
M-PLOT: Appendix B
Create new color table for customer
Now we must make a decision. We have two possibilities to evaluate the colors from
the drawing:
1) We use the standard palette and add the new color "Gray 50%". The advantage is we
don't have to define all values again. Only the new color must be added. The disadvantage is that we do not know anymore, which colors are in the individual tables in
use. We would have to check all entries manually.
2) We create a new color map for our customer. The advantage would be, we know exactly which colors are valid for this entry. If we delete the entry, also all corresponding values are away. The disadvantage is, we must declare more.
In this example we choose the second variant. The working method is identically only
that we do the modifications at another place as for variant one.
3 Press the button "Properties…". The window "Weight filter" opens.
3 Activate the control box "Create a new color table".
3 Press the button "Default". The 16 primary colors by SDRC are created. An information message appears that points out that all existing entries are being deleted in
the list. You can confirm the message with "Yes" because the list is empty.
As an example we will do now a step, which is not necessary. We delete all colors,
which we don't need. Unnecessarily because all not required colors are being
masked out automatically by M-PLOT.
3 Select now a color, which is not used by us.
3 Press the button "Remove". The color is deleted.
3 Repeat these steps until all colors are deleted which we don't need.
166
Examples
At the end the list should contain following colors:
Illustration B-2
Example 1 - Create a new color table
As default we know, that we must draw up still the color "Gray 50%". We proceed for
this purpose the same way like we created the list entry "Mold-Tool Corporation".
167
M-PLOT: Appendix B
3 Enter the value "gray50%" under "Color name:". This is internally also an index.
Before you can create the entry now, the color value must be still unambiguous. In
this window the color name may appear repeatedly, the color value however only
once. When you know the RGB color value for "Gray 50%", you can enter this directly and push then the button "New". Or you can compute the values by M-PLOT.
3 Press the button "Mix color…" .The window for mixing of a color opens.
Since it is a question of a gray shade (R = G = B), we can use the option "Grayscale". 50% of 255 correspond to a value of approx. 127.
3 Choose the radio button "Grayscale". Shift one of the three small arrows to the
value of 127.
Illustration B-3
Example 1 - Mix a new color
3 You see in the entry field "Enter" the converted hexadecimal value. If the input is
right, confirm the window with "OK". The color value is transmitted.
3 Press the button "New" so that our new values are transmitted also in the list.
168
Examples
Our color value is unambiguous and it is now possible to incorporate the entry into the
list.
Illustration B-4
Example 1 - Updated color table with new
mixed color
169
M-PLOT: Appendix B
Check line table
We set already the ISO line table under standard palette. Our customer works also with
ISO line types. Our settings are based also on the ISO norm. Therefore we need not explicitly to declare new line types.
3 Choose the index "Line table".
3 Is the control box "Create a new line table" then you have copied an existing list entry. Deactivate it.
Illustration B-5
170
Example 1 - Use standard line table
Examples
Assign a specific color to a line weight
Now we are so far, to assign the colors to one of a determine line weight.
3 Choose the notebook "Color".
The list is still empty since no colors were assigned. When you now select the menu
"Color:" you will see all our colors that we defined under the notebook "Color table". We assign now a line weight and a plotter pen to every color. Do you remember this? We have still a pen plotter, which we want to support too.
3 Set the pen to our table for the plotter.
3 Assign the color.
3 Define the line weight.
3 Press the button "New".
The list is updated. You see the plotter pen in the first column, in the second column
the color name, in the third column the corresponding line weight on the output filter
and in the fourth column the unit.
Repeat the steps until you have assigned all colors. If a mistake should happen, you can
change the wrong value at any time and modify the wrong value with the button "Apply".
171
M-PLOT: Appendix B
At the end the window should have following content:
Comment:
The pen number is
used only for pen plotters (HP-GL). All other
output filters uses the
numerical value of the
line weight.
Illustration B-6
Example 1 - Assign colors to a line weight
The sequence is not important. A sort of the list causes that the pens are sorted again.
You will maybe recognize that every color may occur in the list only once. The menu
"Color:" becomes increasingly smaller (already used colors are disabled).
172
Examples
Assign line type to a specific line weight
As last one we assign a line weight, and/or pen to every line type.
3 Choose the notebook "Line".
3 Proceed now the same way like we assigned the colors to a line weight and a plotter
pen.
Illustration B-7
Example 1 - Assign line type to a line weight
If all entries are created, the notebooks of "Color table", "Colors" and "Lines" received
now new values. They can check simply when you select the corresponding notebook.
3 Exit you the window with "OK" and you return to the main window.
173
M-PLOT: Appendix B
Save new weight filter
The settings are stored in the file mplot.wgt. So that you have always the possibility to
restore modifications, the file is updated only then if the button "OK" is pressed. The
button "Cancel" ignores all modifications.
3 Press the button "OK". The file is updated and the preceding settings transferred into
the backup file mplot.wgt.bak.
A further opening of the window "Color filter" must list now our new entry " MoldTool Corporation ". The properties of our before defined entry are visible, when you
press the button "Properties…".
If you would delete now the entry "Mold-Tool Corporation", also our settings would
disappear. The color table will not be updated. This table is valid for all entries. Please
be careful when you delete colors in this table.
174
Examples
How can I access this weight filter?
As soon as the weight filters are stored, these are available in M-PRINT. If you have selected the weight filter as default, this is selected automatically provided that the standard device filter did not link a different weight filter. More information for this purpose you will see in a following example.
Illustration B-8
Example 1 - Selection of the new weight filter in M-PRINT
175
M-PLOT: Appendix B
Practices
Cordial congratulation you tested the example and you now became an idea of the
many possibilities of M-PLOT. Now you can solve also requests from the field. How as
often, the requests are not the same ones like in this sample examples.
We offer you at this place some examples from the practice. So that you do not have to
invent the gear again, we provide you also the solution. This is however very abstract.
We go out, that you worked out this example.
Different pen assignment on pen plotter
The pen plotter has a color roundabout and a roundabout with black pens. The order of
the pen numbers is different so that also other application has access onto the same plotter.
Resolution:
If the pen spaces are different, that cannot be directly implemented with a weight filter.
The color green for example, can notice only one pen space. The existing weight filter
must be copied and modified:
3 Copy the existing weight filter.
3 Rename it that it is clear that this is for another certain roundabout.
3 You change the pen assignment in the new filter, so that this agrees with the other
roundabout .
M-PLOT does not change the weight filters automatically when a different color mode
is chosen. That is task of the user. The weight filters can be linked directly at the device
filter or the style filters. Is that unreasonable for the user, the device filter can also be
copied and the respective weight filters to be linked on this new device.
176
Examples
Line weights are constantly too thick on a printer
On a specific printer the line weights are drawn too thickly. On other devices the output
is correct.
Resolution:
This can be achieved also with a new weight filter. If the line weights are proportionally
too thick there is a more effective way available:
3 Edit the device filter file in a text editor. If only a long line is visible, then open the
filter in a word processing program. The line feed is missing.
3 Next, set the new adjustment value -weightcorr in the section [feature]. The
value is a factor.
Example: The line weight 0.5mm appears on the output filter with a thickness of
0.65mm. The adjustment value would be in this case x = 0.65 / 0.5 = 0.769.
3 Save the device filter file.
3 Check the output on the printer.
Comment:
If the adjustment value is not visible in the device filter file, you have still an older MPLOT device filter in use. Replace this filter from the device filter library or from the
Internet (www.m-quest.ch/download).
If the result is not satisfactory, the correction is then not proportional. Every thickness
must be patched with another value. You will find more information's for this purpose
in the next examples. Set the adjustment value again to the value 1.0 in the filter.
177
M-PLOT: Appendix B
Line weights are not correct on a printer
The line weights are wrong only on a specific printer. A constant correction factor does
not solve the problem. In particularly, thin lines are too thick.
Resolution:
Must have a color several different line weights, this is not possible with a single
weight filter. The existing weight filter must be copied and modified:
3 Copy the weight filter, which is supposed to be considered.
3 Rename this in a way it is clear that this is supposed to be valid for this specific printer.
3 Change the line weights in the new filter it agrees with the specific printer .
3 Do not expect this selection of the user. Link this weight filter directly with this specific printer.
If you create that link with the printer, the user does not need to do yourself any
thoughts. If this printer is selected in M-PRINT, the correct weight filter is set automatically.
178
Examples
A specific color can not be evaluated
That can happen if you want to assign a special color. The problem is in the evaluation
of the color value. This must be in an one hundred percent way identical in M-PLOT,
otherwise the color value cannot be found.
Resolution:
You must determine the exact RGB color value. If this is known, either the standard
palette or the corresponding color table of the weight filter must be updated. That
means, the color must be known additional. Then the color can be assigned to a line
weight.
3 Start M-PREV and load the file, which contains the combination color.
3 Choose the menu "Settings" and then the menu command "Picture colors…".
3 Search for the RGB color value from the list, which corresponds to the special color.
3 Change the color composition of this combination color. Or when still not available,
insert the color.
Several same colors name with a different color composition can be created.
3 Check the assignment of the line weight.
3 Check the output.
This topic is not very simple. If the output is not right yet, that does not mean that MPLOT works wrong. Much rather it was forgotten to store the settings, the color value
was not created in the list, the color was not assigned to a line weight and a lot of things
more.
It facilitates the debugging, when you realize exactly where you must execute the modification. If that is not very clear to you yet, please consult the example again.
179
M-PLOT: Appendix B
Example 2
What you learn in this example
If you test this example, you understand the idea of a color filter you can create an individual color filter and assign the existing colors to another color.
Starting position
The cooling drill holes are supposed to be emphasized on the drawing clearly. We want
to print the drawing on a color printer. Only the cooling drill holes are supposed to appear for this purpose in blue color. The rest is supposed to be in the black. The line
weights does not change!
What can the customer do for us?
The customer can generate the cooling drill holes in specific colors. These should not
appear in any other components.
How do we want to proceed?
We have a modern ink-jet plotter and this device is able to mix every arbitrary color.
We know the colors that the cooling drill holes are used for. Further more we decide
that only the cooling drill holes are colored. The rest remains in black:
180
Cooling drill holes color
Color on printer
Yellow
Water-blue
Grey blue
Water-blue
All other ones
Black
Examples
Create a new color filter
First we create the entry in the list. We will use only the languages German and English
in our example.
3 Start M-ADMIN on the console or through a double click onto the shortcut. You
choose then "Adapt M-PLOT to your environment". A new window opens. Choose
now the button "Color filters…".
3 Press the button "New".
3 Change the index in plastic.
3 Change the text fields "English:" and "German:". Enter the description "Mold
Color".
3 Deactivate the control boxes "French: ", "Italian:" and "Spanish:".
3 Press the button "Apply".
Illustration B-9
Example 2 - Create a new color filter
181
M-PLOT: Appendix B
Extend colors for customer
The color filter has an own color map. This does not have to do anything with the one
for the assigning of the line weights. Under the requests we stated that our customer
uses the color gray-blue for the cooling drill holes. The output occurs in water-blue. We
must integrate therefore two colors. The gray-blue color must correspond exactly to the
one in the drawing. We may optimize the second at any time.
3 Select the newly defined "Mold Color" list entry.
3 Press the button "Properties…". The window "Color filter" opens.
3 Enter the new color name "water_blau" in the entry filed "Color name:".
Illustration B-10
Example 2 - Define a new output color
3 Since we want to mix the color, press the button "Mix color…". The dialog box for
creating of a new color opens.
3 Mix the color until you have the RGB value 31-54-255. That corresponds to a
hexadecimal value of 1F36FF.
182
Examples
Illustration B-11
Example 2 - Mix color "water-blue"
3 When you have justified the color press the button "OK". The color value is transferred.
3 Now press the button "New" and the color is created in the list.
3 The same we do now with the color "gray-blue". This has a RGB color value of 050-255.
Illustration B-12
Example 2 - Expanded color list
183
M-PLOT: Appendix B
Assign new colors
We defined the new colors. We can create now the entry for the assignment.
3 Choose the notebook "Color assignment".
3 Choose as input color (Input color:) "yellow" and as output color (Output color:)
"water_blue".
3 Press then the button "New" and the entry is transferred into the list.
3 We must still do the same one with the second color. Choose "gray_blue" as input
color and as output color again "water_blue".
3 So that now all remaining colors become black, we use the value "*" as input color.
We choose as output color "black".
Illustration B-13
Example 2 - Assign output colors
If all not defined colors are supposed to remain unchanged, then remove the last entry
(*). All colors were sent then unchanged. This technique is reasonable if you like to link
certain colors.
3 Exit the window with "OK" and you switch back into the main window.
184
Examples
Save new color filter
The settings are stored in the file mplot.map. So that you have always the possibility to
restore modifications, the file is updated only then if the button "OK" is pressed. The
button "Cancel" ignores all modifications.
3 Press the button "OK". The file is updated and the preceding settings transferred into
the backup file mplot.map.bak.
A further opening of the window "Color filter" must list now our new entry "Mold
Color". The properties of our before defined entry are visible when you press the button
"Properties…".
If you would delete now the entry "Mold Color", also our settings would disappear. The
color table will not be updated. This table is valid for all entries. Please be careful when
you delete colors in this table.
185
M-PLOT: Appendix B
How can I access this color filter?
As soon as the color filters are saved, these are available in M-PRINT. When you
marked this filter as default the color filter is automatically selected provided that the
standard device filter did not link any own color filter. See more information's for this
purpose in the next example.
Illustration B-14
186
Example 2 - Selection of the new color filter in M-PRINT
Examples
Practices
Cordial congratulation you tested the example and you now became an idea of the
many possibilities of M-PLOT. Now you can solve also requests from the field. How as
often, the requests are not the same ones like in this sample examples.
Make modifications on drawing visible
With trick modifications can be made visible very fast on a drawing. A specific cycle of
operations is for this purpose needed.
In Drafting the properties of the system layers are exploited. Create for this purpose a
new layer with the name "modification". The colors of this layer are chosen that it does
not appear anywhere else in the drawing. We take the color "redlining" as an example.
All new elements are drawn onto this layer. During the output exactly this color can be
assigned again. Does a new modification occur, the existing elements must be moved
first onto the other layers before the new elements can be created. That shows you in
Drafting at a glance which elements belongs to the last modifications.
Resolution:
The new input color "redlining" is linked onto the red color. All other colors in the
drawing are linked to green. That shows the manufacturing immediately which elements changed. The line weights remain unchanged from that.
3 Create a new color filter with the name "modification"
3 Add the new color "redlining" or your special color.
3 Assign the output colors so that "redlining" becomes "red" and all other colors
"*" become now "green".
The user can simply select this color filter in M-PRINT for this specific output and the
drawing is printed dichroically. This cycle of operations can be automated with Drafting macros very well.
187
M-PLOT: Appendix B
Archive external file formats
If you want to integrate external formats of other customers into your archive, the attributes with those of your drawing must agree. If that is not the case, the drawing will
be printed at the next call possibly wrong since the user did not recognize that this
drawing does not come from your company.
We know that no modifications at the line weights are executed with a color filter. Nevertheless how we get this information now into this drawing?
Resolution:
We link the colors of our input format in a way that this agrees with those of our colors.
So that also the line weights are correct we must create also a correct weight filter. Then
we convert the drawing into a new drawing with the aid of both filters.
3 Create a weight filter with the name of the customer and configure these so that the
line weights are set correctly. A output onto the printer must occur then correctly
3 Create a new color filter with the name of the customer. Route the input colors in a
way so that these agree with those of your work environment .
M-PRINT reads the input color and assigns the corresponding line weight to the element by means of the weight filter. Then the input color is routed so that this agrees
with our environment . At the end everything is written into a new output file. With the
next call it is a drawing as if we had created these. Brilliant, or not?
The same one works too if the input file has already the correct line weights. Then the
generation of the weight filter is dropped.
188
Examples
Example 3
What you learn in this example
If you test this example, you understand the idea of a style filter and you can generate
an individual style.
Starting position
M-PLOT offers a tool program for labeling of documents. The setting-up of the program is explained in the next example. So that the text and the pictures have space sufficiently, the drawing must be placed into a specific area of the paper. That is supposed
to be the task of the style filter.
10
35
20
QUEST
SOFTWARE
AG
Title
text row 1
text row 2
We need a binding edge of 20 mm. So that
our logo and the text have space, the picture
is supposed to be placed from 35 mm above.
The margins to the left and below are per 10
mm wide.
10
Copyright
The picture is supposed to be fitted in
always. The anchor point is above in the
middle see yellow point.
Illustration B-15
Example 3 - Style filter for FEM
189
M-PLOT: Appendix B
Create a new style filter for FEM
First we arrange the entry in the list. We will use only the languages German and English in our example.
3 Start M-ADMIN on the console or through a double click onto the shortcut. You
choose then "Adapt M-PLOT to your environment". A new window opens. Choose
now the button "Style filters…".
3 Press the button "New".
3 Change the index in fem.
3 Change the text fields "English:" and "German:". Enter the description "FEM
printout".
3 Deactivate the control boxes "French: ", "Italian:" and "Spanish:".
3 Press the button "Apply".
Illustration B-16
190
Example 3 - Create new style filter
Examples
Modify properties
According to our known input values we must still modify the margins and other options.
3 Press the button "Properties…". A new window opens.
3 Modify the defaults in accordance with the illustration.
3 Close the window with "OK" so that our settings are taken over.
Since it is a question mainly of I-DEAS
picture, the evaluation was set "Style =
Line thickness". That allows it, that invisible edges and centerlines are displayed
more thinly. Besides it still was indicated
that the print datum is supposed to appear
on the output.
You can set the settings of course in a way
as you consider it is correct. It is supposed
to be objective that the user does not have
to do any thoughts about the settings.
Illustration B-17
Example 3 - Settings for
FEM style filter
191
M-PLOT: Appendix B
Save new style filter
The settings are stored in the file mplot.sty. So that you have always the possibility to
restore modifications, the file is updated only then if the button "OK" is pressed. The
button "Cancel" ignores all modifications.
3 Press the button "OK". The file is updated and the preceding settings transferred into
the backup file mplot.sty.bak.
A further opening of the window "Style filter" must list now our new entry "FEM
printout". The properties of our before defined entry are visible, when you press the
button "Properties…".
If you would delete now the entry "FEM printout", also our settings would disappear.
192
Examples
How can I access these style filters?
As soon as the style filters are saved, these are available in M-PRINT. When you
marked this filter as default the style filter is automatically selected provided that the
standard device filter did not link any own color filter. See more information's for this
purpose in the next example.
Illustration B-18
Example 3 - Selection of the new style filter in M-PRINT
When you select the style filter and press then the button "Preview…", these settings are
set exactly in the preview . The additional information's like help texts, logo, etc. are
not displayed since these are copied directly into the output file.
193
M-PLOT: Appendix B
Example 4
What you learn in this example
If you test this example, you can arrange new device filters, you understand the interface to the print program you can replace an existing device filter and a lot of things
more.
Starting position
We have various output filters. Some of them are the same but stands at different locations. We will arrange a PDF archive and we create for the FEM department the link to
the M-PLOT tool program for the documentation of FEM pictures. The users are supposed to have also access on the standard filters of M-PLOT.
We know following parameters:
Device designation
194
Place
Description in M-PRINT
HP-DesignJet 750C (36 Rolls) Design department
"Color plotter"
HP-Color LaserJet 4500
Design department
"Color printer"
HP-LaserJet 5SiMX
Operations department
"Laser printer"
CGM file for CorelDRAW
All of them
"CorelDRAW file"
FEM-dump on PS-printer
Design department
"FEM documentation"
Filing PDF for PDM
File
Not visible
Examples
Organize device list
If you have already installed M-PLOT a device list of all available output filter files exists. This is supposed to be only an example. In our case we want to reorganize this list.
3 Start M-ADMIN on the console or through a double click onto the shortcut. You
choose then "Adapt M-PLOT to your environment". A new window opens. Choose
now the button "Device filters…". The list with all already available device filters
appears.
Illustration B-19 Example 4 - Current
device filters
We want to organize these again. The submenu "Translator" is supposed to remain, the
filters of "CGM file" and "SDRC file" are supposed to be on the same level as the other
filters. We do not need the "Printer Formats" anymore. The two redundant filters
"test1" and "test2" can also disappear. Then we create two new submenus for our
new printers.
195
M-PLOT: Appendix B
Shift filters CGM and SDRC
3 Select the line "SDRC file".
3 Shift the line with the arrow keys
and
rator line of the submenu "Translator".
until the entry appears above the sepa-
3 Repeat the same one also for the entry "CGM file". The output should look like this
then:
You noted perhaps that when the entry is the
last element of a submenu and the line is
moved a row down this entry is set a level
higher equal to the previous submenu level.
Would you shift the entry "CGM file" again
a line after above this remains on the same
level and appears therefore above the submenu "Printer format". Is the same entry
shifted a row down again the submenu is
considered and therefore the entry is integrated into the substructure.
Deleting of the submenu "Raster/Image Formats"
3 Select this line and press the button "Remove".
The area updates itself the submenu is
removed. That worked without problems
since the submenu was empty.
196
Examples
Deleting of the submenu "Printer Formats"
Please think of you remove first the entries below the submenu. First after that the
menu can be removed.
3 Select the line "HP-GL" and press the button "Remove".
M-PLOT stated that this filter is not required by any other entries in the device list.
Therefore the device file can be deleted also from the directory model.
3 Press the button "yes" to confirm the deleting action. We do not want to keep any
superfluous filters in our directory. If we should need this filter again, we can retrieve it also from the library.
3 Repeat these steps until the whole submenu is away.
3 In this case we can remove also the two test entries "test1" and "test2". Those
ones are only duplicates.
You will recognize that you now not were inquired. That comes of both entries being still used in the list. The PDF file is still set in the submenu "Translator". The
name does not play any roll here the filter name is checked.
197
M-PLOT: Appendix B
Add a new submenus
Defined as in our list, we have two departments. Why these do not declare as submenus? Of course all these could stand also under each other, as a practice we want to
build up this architecture.
3 Select the line "PDF file" and press then the button "New submenu".
The submenu is inserted direct below on the same level. The default text of the
menu is transmitted. You can only subsequently change the text when you change
the text and press the button "Apply".
3 Shift the new entry onto the end of the list, therefore according to the separator line.
3 Repeat the step for our second submenu.
3 Rename the two submenus so that they correspond to the graphics.
If a mistake should happen to you, you can delete the submenu at any time again.
Please think of it, the text is taken over first if you press the button "Apply".
3 Shift the entries until you receive the same architecture.
That you get exactly the same output like in
the graphic you must shift the separator line.
If this is at the end of the list, the level
cannot be shifted. You must shift first the
separator line above the submenu. Then
select the submenu and shift these about the
separator line. As a result the separator line
is on the same level as the submenu,
however below.
Illustration B-20
198
Example 4 - Reordered
device list
Examples
Install color plotter for design department
We arranged the architecture. Our printer is now still missing. This section shows all
single steps, which are necessary in order to arrange a printer in M-PLOT. Read
through this section carefully. In the following examples not every point is explained
anymore.
Illustration B-21
Example 4 - Install color plotter for design dep.
3 Select the line "Design department".
If you have another architecture, that does not do anything in this case. Select the
line, where the output filter is supposed to appear below.
199
M-PLOT: Appendix B
3 Press the button "New device…." The window with all available library filters appears.
3 Search for the printer manufacturer "hp" in the list and do a double click onto the
line. The folder "hp" opens and you see all HP devices with the device designation.
3 Look for the entry "HP-DesignJet 750C 36" (HP-RTL)".
Illustration B-22
Example 4 - Select plotter from device library
Our plotter with a 36" roll occurs in three variants. The plotter can be selected in MPLOT with HL-GL/2, PostScript and HP-RTL. The secondary code [LICENSE] indicates that this filter requires a license. The filter is fully functional also without license. It appears besides the text "DEMO" on the output. On the other hand it is also
understandable, that this filter can more as the pure HP-GL/2 driver.
3 Execute a double click onto this line. The window closes and the description is
transmitted into our main window.
The filter was copied now automatically into the directory model from the library.
Therefore the inquiry mask also appears during the deleting of the filter from the architecture.
200
Examples
3 Deactivate the control boxes "French: ", "Italian:" and "Spanish: ". We want to use
only the languages of German and English.
3 Rename the language entries "German:" and "English:" with our description for the
printer "Color plotter".
If you start M-PLOT in another language as German or English, the printer is not
displayed in M-PRINT since the name is empty.
3 Rename the indicator in dj.
3 Press the button "Apply".
The window should have following content now:
Illustration B-23
Example 4 - Integrated color plotter into device list
201
M-PLOT: Appendix B
Now we must tell M-PLOT which operating system printer can select this plotter.
3 Press the button "Properties…". The window with the device filter properties opens.
Our plotter has a coil. We can assign a specific style filter to the device filter. It is
reasonably that this always uses the style "Scale to sheet size". That guarantees that
the user uses always the correct style.
3 Activate the control box "Style filter" and you choose the line "Scale to sheet size"
from the menu.
The default of the weight filter is "ISO standard". Therefore we do not need to activate the control box at this place. But you may generate this shortcut of course.
Illustration B-24
202
Example 4 - Properties of the color plotter
Examples
Now it becomes a little bit more difficult. We must build up the communication. In our
example we work on a Windows NT/2000 workstation. We need the server name and
the released printer name. You can read out the information directly. Choose for this
purpose the following commands in the environment Windows NT/2000:
Remark:
Please note, we don't
have Windows
NT/2000 in the English
version. Maybe some
commands are not exactly the same. But we
are sure, you will figure out what we mean.
3 Press "Start" onto the button in the line at the lower edge of the screen.
3 Go onto "Settings" and select the menu choice "Printer".
3 A window opens. Select the printer and press the right mouse button. Select "Properties".
3 A further window opens. Press the button "Test page".
3 Get the test page from the printer. We need two information's from this page.
3 Exit the printer windows.
If you consider the output more exactly, you will recognize that some useful information are onto this sheet. We need following lines for setting-up M-PLOT:
Line
Example
Description
Workstation name
wsmm
The name of the workstation, which takes over
the printing service of the output filter.
Released printer name
pr2
The printer name as it can be addressed.
We go back again onto our window "Device filter". We must do still some settings:
3 Activate the control box "Windows NT/2000:". The menu is enabled.
3 Choose the menu command "SDRC Print Utility" and press than the button
command line is transferred in the upper row.
. The
203
M-PLOT: Appendix B
. A new window opens. Change the command line with the val3 Press the button
ues from our test page from Windows NT/2000. This could look as follows:
Illustration B-25
Example 4 - Enter print command
3 Press the button "Test page". If the message occurs, that the command could be executed successfully, then the syntax of the print command is correct.
That doesn't mean that the connection to the output filter works. If the test page is
not printed, the error is not in M-PLOT. Please check the connection and whether
the output device is turned on.
204
Examples
3 Press the button "OK". The content of the window is transmitted into the command
line.
Illustration B-26
Example 4 - Set print command for color plotters
You can do still more settings. For example the connection can be indicated besides on
a UNIX platform. If M-PRINT is started on a UNIX workstation, this entry is evaluated.
Also additional links onto other filters can be generated. That makes sure, that if this
printer is selected, these filters are prepared explicitly. All options, which were set by
the user, are reinitialized.
If you do not completely understand this working method yet, we recommend not generating any links. Otherwise you do not know anymore why an option is always backspaced onto a default values.
For working in the background, we recommend to set all settings about this links. The
call becomes shorter and you can check at any time all settings.
205
M-PLOT: Appendix B
Check default values of the device filter
We want to check still the default values of our color plotter. We would like, that the
plotter always is in the color mode. If a monochrome drawing is supposed to be printed,
the user is supposed to do this setting interactively.
in the frame "Modifications on current device:". A new window
3 Press the button
opens. The representation format depends on the available settings of the output filter.
Illustration B-27
Example 4 - Defaults of color plotter
3 Change the menu "Display:" to the value "Color". The device driver is newly created when you hit the button "OK".
Replace or update device drivers from library
When you retrieved the wrong device driver by mistake from the library, but meanwhile all settings are set already this can be exchanged simply. We want to retrieve the
PostScript-filter of our plotter as an example.
3 Press the button
in the frame "Modifications on current device:". It opens the
window with all library filters.
3 Choose the filter "HP-DesignJet 750C 36" - (PS2)" by a double click on the line.
The filter is copied now also into the directory model and the field "File:" updated.
The default values can be now different although it is a question of the same output filter.
206
Examples
Replace or update device drivers manually
We would like to use our old filter again. This appears still in the directory model provided that this was not deleted. With this technique you can install also a filter which
was retrieved directly from the Internet. Copy the driver into the driver directory custom/mplot2k1/model and proceed as follows:
in the frame "Modifications on current device:". It opens the
3 Press the button
window for the selection of a file.
3 Select the filter "hp-designjet-750c-36-rtl.def" with a double click. The filter
appears now in the filed "File:".
When you have loaded the filter from another place, then the absolute path appears before the filter file.
Important:
Please do not load the filter manually from the filter library directory. Use always the
for this task. If you have new filters, you can store these also into the library
button
directory. At an updating of the software only existing filters are replaced. Also new
subdirectories may be created. M-PRINT reads the complete directory architecture each
time you push the button .
3 All settings at our color plotter are executed. We can exit the window. Press the button "OK" so that the settings are stored internally.
207
M-PLOT: Appendix B
Save modified device filters
The settings are stored in the file mplot.set. So that you have always the possibility to
restore modifications, the file is updated only then if the button "OK" is pressed. The
button "Cancel" ignores all modifications.
3 Press the button "OK". The file is updated and the preceding settings transferred into
the backup file mplot.set.bak.
A further opening of the window "Device filters" must list now our newly create device structure and the color plotter.
Install color printer for design department
We installed already a plotter. The installing of the color printer does not distinguish
from the color plotter. If the following execution is too abstract to you, please test first
the example "Install color plotter for design department".
3 Select the entry "Color plotter" and press the button "New device…".
3 Select the printer "HP-Color LaserJet 4500 (PS-2)" from the library.
3 Change the index to clj and the name to "Color printer". Press then the button
"Apply".
The printer is brought now below our submenu "Design department". You can shift
the sequence with the arrow keys.
3 Press now the button "Properties…" and set the communication with the corresponding printing queue on your workstation.
208
Examples
Install laser printer for operations and design department
The setting-up is identical as in the two previous examples. We want to show a simple
trick at this place. The printer stands presumably in the operations department, but we
want to create this device twice in the list. This printer is supposed to be our default
printer and stands accordingly also at the first level of the device menu.
3 Select the submenu "Operations department" and install the printer "HP-LaserJet
5SiMX" direct below the submenu. Use the index lj and the name "Laser
printer".
3 Press now the button "Properties…" and set the communication with the corresponding printing queue on your workstation.
Our device list looks now as follows:
We want to arrange now this printer also according to the last separator line. It is exactly the same printer. It is supposed to be alike, whether the user selects this in the
submenu "Operations department" or directly on the first level.
209
M-PLOT: Appendix B
We can achieve this if we copy this printer. M-PRINT puts on automatically a copy.
Only the index is set unambiguous. All other settings are identical.
3 Select the entry "Laser printer" and press the button "Copy". The copy is created directly below the existing printer.
3 You may change now the index or also the name. This step is not necessary.
3 Shift the new printer onto the end of our printer architecture.
3 Do a double click onto the printer and this is selected with a hook as default printers.
That was it already. If the user likes to print from I-DEAS or Drafting, this printer is taken automatically as default. If you want to check how this printer architecture looks in
M-PRINT, you can quit the window with the button "OK" and start M-PRINT from IDEAS, Drafting, M-PREV or M-PLOT.
Comment:
M-PRINT is the actual printer program. The macro for I-DEAS or Drafting calls this
application, M-PLOT and M-PREV too.
210
Examples
Install FEM document program
M-PLOT offers a small, but very useful tool. This can label documents on a PostScriptprinter. Pictures and texts can be added. Some FEM users use these working methods to
document their FEM sheets.
The setup of the header file is not explained especially. If you want to use this program,
we go out, that the documentation in the setting file is sufficed. The header file is in the
subdirectory custom/mplot2k1/analysis. The file is configured in a way, that it is
compatible with our style filter "FEM printout". M-PLOT is also prepared already. The
command syntax is already integrated. This example can help you to select your own
programs.
As already at the beginning mentions, the program needs a PostScript compatible device filter. HP-GL/2 or PCL does not work.
3 Select the line "Color printer" and create a copy of the line with the button "Copy".
3 Change the index to fem and appoint the label in "FEM documentation".
3 Insert a new menu separator above the entry. That allows a better overview in the
M-PRINT print menu.
Illustration B-28
Example 4 - Create FEM documentation
211
M-PLOT: Appendix B
3 Press the button "Properties…". The window with the properties of the copied printer opens.
3 Activate the control box "Style filter:" and select our style filter "FEM printout". We
have created this filter in Example 3.
The print command is set still as if the output goes directly to our printer. But we must
still do the required inputs before the print file is sent to the printer. Exactly here we insert the call of our program.
3 Choose the line "Analysis (PostScript)" in the menu "Windows NT/2000:". Press
so that the line is transferred.
then the button
in order to edit the line. A new window with a very long
3 Press onto the button
command line appears. Every one of these characters has an importance. Please do
not delete any from that string.
3 Change now the address of the print queue as is valid for this devices. In our case
that is the address: \\wsmm\pr1.
Illustration B-29
212
Example 4 - Print command for FEM program
Examples
3 Press the button "Test page" and the program is executed. The query with the additional texts occurs:
Illustration B-30
Example 4 - Inquiry mask of FEM program
3 Press the button "OK" and the documentation is created and sent to the printer. If the
command line is functional the information window appears and tells you that the
command could be executed without errors.
3 Press the button "OK" and the modifications are stored in the properties mask.
3 Press the button "OK" and the property sheet again is terminated.
The menu can be combined individually and also the defaults can be determined individually. Unfortunately the pictures must be still in the GIF-format. These are processed directly by Tcl/Tk. If the program should find his customers, we will transcribe
the routines so that also TIFF, PNG and JPEG-pictures can be read directly.
Inform us of your comment. About creative proposals for resolution we are always
thankful.
213
M-PLOT: Appendix B
PDF archive for PDM system
This example shows you how you can create a PDF file from a document and store these at a specific place. The place can vary and is directly dependent on the name of the
document. That works only if after the conversion an external program is called which
evaluates the information of M-PRINT and reprocesses the information. In this example
we want to do that with an external shell script. If you understand this cycle of
operations, the whole world stands open to you.
This process is supposed to run always in the background. It is in fact not necessary that
the user find this printer in the selection mask. We can achieve that in letting the label
of the printer empty. The index is needed so that we can address the printer directly in
M-PLOT batch.
Example of a script file for Windows NT/2000
We want to operate the position of the image file on the operating system. As default
the image file is copied always into the start directory. We have a PDM system and this
is supposed to manage the PDF file. We need a script file to do this task for us.
This file could look as follows:
@echo off
setlocal
rem # --------------------------------------------------------------rem # pdf2pdm.cmd rem # This script moves a generated PDF file from M-PLOT to a
rem # specific location for the PDM system. The PDM system checks
rem # this folder for new files.
rem # --------------------------------------------------------------set PDM_DIR=D:\pdm\incoming
copy %1 %PDM_DIR%
del %1
endlocal
@echo on
214
Examples
We save this script file at %MQUEST_CUSTOM_INSTL%\mplot2k1\batch.cmd that we can
call it directly at any time. Now we must inform M-PRINT in a best known way what is
to be done according to the call. We do not call for this purpose the printer queue instat
an "External command".
3 Select the line "PDF file" or load the filter from the library. Copy this device filter
with the button "Copy".
3 Change the index in pdf_batch and delete the label. But do not deactivate the control boxes of the languages! All filters would then not be visible anymore.
Illustration B-31
Example 4 - Install PDF filter
for PDM system
3 Turn on the properties of the filter with the button "Properties…".
3 Activate the control box "Windows NT/2000: and choose in the menu the entry "External command".
3 Move the value with the button
.
3 Open the editor with the button
.
215
M-PLOT: Appendix B
3 Change the command line that our script file is called.
Illustration B-32
Example 4 - Command line for external script file
The call "cmd.exe /c" must be indicated otherwise the script file cannot be started.
The command path must stand between the brackets "{}" at least a backslash "\" is
present in the text. If you don't do that, an unintentional character replacement is done
in M-PRINT.
3 Press the button "Test page". Occurs the message that the command could be executed the syntax of the command is correct.
3 Press the button "OK". The content of the window is transmitted into the command
line.
3 Deactivate the control box "Remove plot file after plot command is executed".
That is urgently necessary since otherwise M-PRINT deletes the file. If you look at
our script exactly, you will imagine that the script deletes the file already. This technique is necessary that the script can finish the task and not M-PRINT.
3 Exit the window with "OK".
216
Examples
CGM file for CorelDRAW
Why this example? If you want to exchange dates with a specific program, the filter
must be sometimes optimized. That guarantees that the user cannot do any wrong settings, the output occurs then always correctly.
During the standard installation a CGM filter is installed. We want to use this and to
optimize the filter optimally for the application CorelDRAW.
3 Select the line "CGM file" in the list window and create a copy with the button
"Copy".
3 Change the index in corel and rename the label of the line in "CorelDRAW file".
3 Shift the entry onto the lower end of the list. The selection is then visible on the first
level.
Illustration B-33
Example 4 - Install CGM filter
for CorelDRAW
217
M-PLOT: Appendix B
As from the preceding examples we know that this new entry points onto the current
CGM filter. A modification would change both entries. Therefore we must create first a
copy of the filter. This filter must be joined then with our new entry.
3 Create a copy of the CGM filter custom/mplot2k1/model/cgm.def and rename
this in corel.def.
3 Turn on the device properties of our new entry and load the new filter with the but.
ton
3 Close the window with the button "OK".
We cannot do more interactively. We may process the filter manually in a standard text
editor.
3 Open the new filter file to corel.def for editing. If you see only a long line, the line
feed is not displayed then correctly. Open the file in "Word" or with "Wordpad".
Adapt the CorelDRAW filter
We want to modify the filter so that the user cannot do any wrong settings. We want:
· Only a section for the CGM generation.
· Only colored output.
· Only the printing resolution of 300 dpi.
218
Examples
Following sections must be modified:
! ----------------------------------------------------------------! Feature parameter -! ----------------------------------------------------------------[feature]
* -imagesize
scale
* -imagepage
a4
* -imagescale 1.0
* -imagewidth 500
* -imageheight 0
* -prof
coreldraw
* -profparam
{{-prof
coreldraw
*
-proflabel
"CorelDRAW"
*
-profmode
corel
*
-profencode
binary
*
-profarc
disabled
*
-profellipse disabled
*
-profrectangle disabled
*
-proftext
enabled
*
-profmarker
enabled
*
-proffont
enabled
*
-profhatch
enabled
*
}}
There is only one selection. This is set directly to coreldraw.
219
M-PLOT: Appendix B
! ----------------------------------------------------------------! Color -! ----------------------------------------------------------------[color]
* -color
color
[color.color]
* -label.l2
* -label.l1
* -label.l0
* -label.l3
* -mode
* -gamma
* -hue
* -saturation
* -brightness
Farbe
Couleur
Color
Color
color
1
0
0
0
All other color settings are removed. The index is set to color, provided if not set already.
! ----------------------------------------------------------------! Resolution -! ----------------------------------------------------------------[resolution]
* - resolution 300
[resolution.300]
* -label.l2
{300
* -label.l1
{300
* -label.l0
{300
* -label.l3
{300
* -value
300
* -colormode
all
dpi}
dpi}
dpi}
dpi}
Also all resolutions are removed. The default must be set again on 300.
3 After you executed the modifications, you can save the file. You can look at any
time at the modification in M-PRINT.
220
Examples
3 Load a drawing into M-PLOT or M-PREV. Choose the button "Printing…".
3 Choose the entry "CorelDRAW file" and press then the button "Properties…".
3 The menu may offer you now only the selection that we put in the filter.
You see, with few modifications you can hold the user of executing wrong inputs. You
can determine yourself whether you want to optimize a filter or you work with the defaults.
221
M-PLOT: Appendix B
Comments
The M-PLOT filters are not perfect. A filter of a printer manufacturer is increasingly
better. M-PLOT can offer an alternative to you in order to work with the very same
print program in heterogeneous platform environments. The administration occurs on a
workstation, whichever platform it is.
The most different mechanisms allow the optimal configuration of M-PLOT with respect to the application. Not the easiest way for the administrator or the application is
searched, instead the user is supposed to be unburdened.
M-PLOT has the philosophy, that a printer language, independently of the manufacturer
of the devices, must be available only once. The functions are reduced internally to a
minimum so that all understand the same dialect.
Please forgive us if we provide the new filters with a license. That guarantees that we
can advance M-PLOT. We have still many ideas, which we want to integrate. Together
we can reach this objective.
If you have ideas or suggestions for improvement, you can inform us of these with
pleasure. Please think of it that we give customer the advantage, which uses M-PLOT
with a license.
222
Examples
223
003.2001.02-e