1
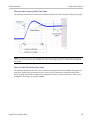
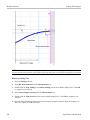
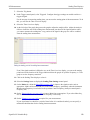
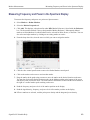
Managing Data, Settings, and Pictures
Saving and Recalling Data, Settings, and Pictures
corrections are applied to the IQ data to produce a corrected data set. The span and center frequency
information present in the .iqt file are used to set the SignalVu-PC span and center frequency. However, no
information about analysis length, offset or type is preserved in the .iqt file.
Opening .mat files saved by RSA5000/6000/SPECMON series and third party waveforms. To open a .mat
file from these instruments:
1.
Select File > Preset (Main).
2. Select File> Recall and select Acq Data with Setup (MAT) (*.mat) in the Open dialog. Select
the desired file and click OK to open the file
3. Save the file by selecting File > Save As and set the file type to Acq data with setup (TIQ) (*.tiq)
and click OK. Saving the file in .tiq format preserves all of the settings in the analyzer and associates
them with the data set.
4. Recall the saved .tiq file and add measurements and change settings.
If you choose to save the file in .mat format, SignalVu-PC automatically adds all of the SignalVu-PC
settings needed for your analysis into the stored .mat file.
Opening files saved with oscilloscopes. Oscilloscopes acquire and store data in an amplitude vs. time
format that must be converted by SignalVu-PC into an IQ format for further processing. Sample-rate and
amplitude information is available in these files, but no other information is available to SignalVu-PC.
To open files stored in either .ISF or .WFM format saved by Tektronix oscilloscopes, use the following
procedure:
1. Preset SignalVu-PC. This resets the analysis so that only the spectrum analyzer display is present, with
a center frequency of 250 MHz and a span of 200 MHz.
2. Set the Span of SignalVu-PC to 0.2 × Sample Rate of the acquisition.
How to determine the maximum available span for your .ISF or .WFM file: The maximum span is
calculated to be 0.4 × Sample Rate. For example, a waveform sampled at 1 GSample/second will have
a maximum span of 0.4 × (109) = 400 MHz. This represents the Nyquist bandwidth of the sampling
system plus an allowance for filter bandwidth. Note that this span may exceed the bandwidth of the
oscilloscope used, and results at frequencies higher than the oscilloscope bandwidth will be attenuated.
When processing the waveform, SignalVu-PC automatically sets the bandwidth to twice the entered
span to allow for increasing the span in later analysis. Set the span of the spectrum analyzer to ½ the
calculated maximum span. In the case of the example of above, this is ½ × 400 MHz, or 200 MHz.
3. Set the center frequency to ½ of the span. This puts the analysis frequency within the first Nyquist
zone to prevent aliasing of the signal.
4. Open the .ISF or .WFM file with the settings above.
5. Set the span to the calculated maximum (in the example above, 0.4 × Sample Rate = 400 MHz) and
reanalyze.
6. Save the results as a .TIQ file. This preserves all of the settings in the analyzer and associates them
with the data set.
SignalVu-PC Printable Help
409