1
0.430
0.420
RD (h/e²)
0.410
0.400
0.390
0.380
0.370
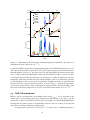
775 nm point contact.
iac=.855nA
0.360
Each trace is a different B field
Traces Not Offset
-12
-8
-4
0
idc (nA)
4
8
12
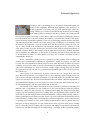
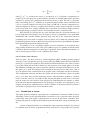
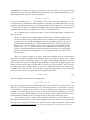
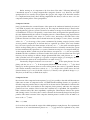
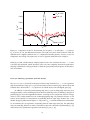
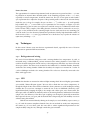
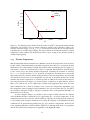
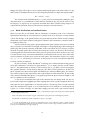
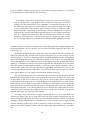
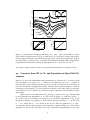
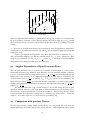
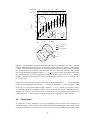
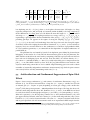
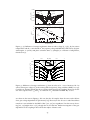
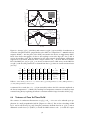
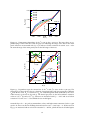
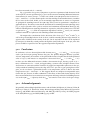
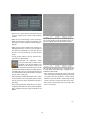
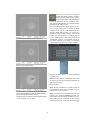
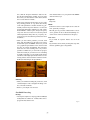
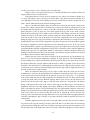
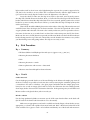
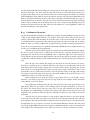
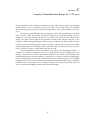
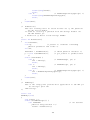
Figure 2.3: A series of Idc curves from the 0.8 µm qpc, each taken at a different magnetic field. The
The thick red curve that approaches R = 0.375 h/e2 at high current is the ν = 21/3 characteristic,
which has a dip instead of a peak. The thick black curve that approaches R = 0.4 h/e2 is the 5/2
characteristic, which shows a peak. At this qpc gate voltage, it was not possible to measure the
ν = 21/3 characteristic, because the required magnetic field would take the bulk filling fraction
away from ν = 3.
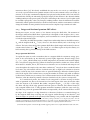
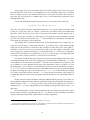
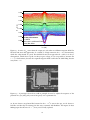
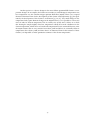
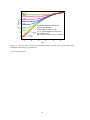
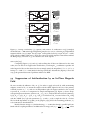
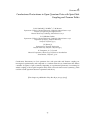
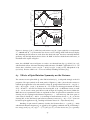
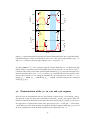
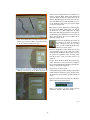
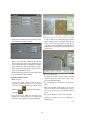
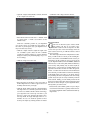
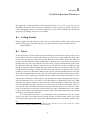
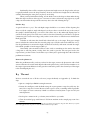
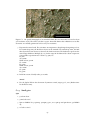
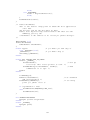
Figure 2.4: A prototype device that could in principle be used to adjust the steepness of the
potential in a qpc (using only some of the gates) or in a quantum dot.
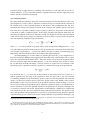
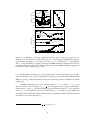
we do not observe any plateau-like features for the ν = 22/3 state in the qpc, we do observe a
hole-like zero-bias dip in resistance for this state, consistent with Roddaro. The impact of these
findings upon the theories of ν = 5/2 has yet to be fully explored.
16