1
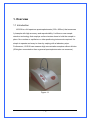
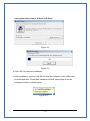
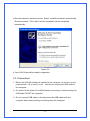
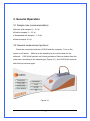
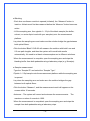
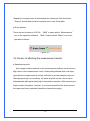
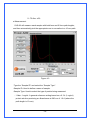
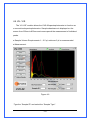
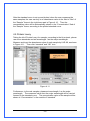
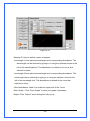
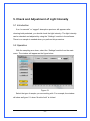
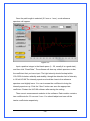
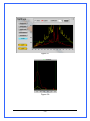
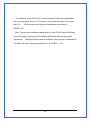
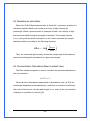
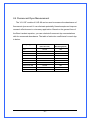
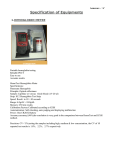
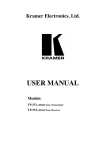
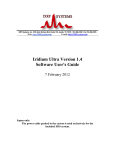
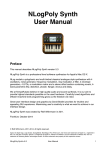
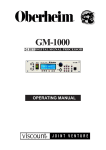
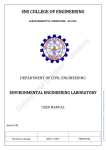
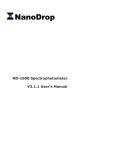
UVS-99 UVISDrop Micro-volume UV/Vis Spectrophotometer USER MANUAL SOFTWARE VERSION: UVS-99 V1.1 Contents 1. Overview ..................................................................................1 1.1 Introduction .......................................................................................... 1 1.2 Operation............................................................................................. 2 1.3 Applications ......................................................................................... 2 2. Installation ................................................................................3 2.1 Computer requirements ....................................................................... 3 2.2 Software installation ............................................................................ 3 2.3. Precautions ........................................................................................ 5 3. General Operation ....................................................................7 3.1 Sample size (recommendation): .......................................................... 7 3.2 General measurement protocol ........................................................... 7 3.3 Factors of affecting the measurement results ...................................... 9 4. Measurement..........................................................................11 4.1 Nucleic Acids ..................................................................................... 11 4.2 Protein A280...................................................................................... 13 4.3 Cell Cultures ...................................................................................... 17 4.4 UV- VIS ............................................................................................. 19 4.5 Protein Lowry .................................................................................... 23 4.6 Protein Bradford ................................................................................ 25 5. Check and Adjustment of Light Intensity .................................27 5.1 Introduction ........................................................................................ 27 5.2 Operation........................................................................................... 27 5.3 Light intensity check .......................................................................... 29 5.4 Light intensity adjustment .................................................................. 30 5.5 Special application ............................................................................ 31 5.6 Set up of the Calibration Parameters ................................................ 34 Definition: .............................................................................................. 34 6. Troubleshooting ......................................................................37 6.1 Unable to find USB device ................................................................. 37 6.2 Sample accuracy and reproducibility ................................................. 38 6.3 Unusual spectrum ............................................................................. 39 7. Maintenance and Warranty .....................................................40 7.1 Cleaning ............................................................................................ 40 7.2 Parts that require replacements ........................................................ 40 7.3 Calibration of wavelength .................................................................. 40 7.4 Solvent Compatibility ......................................................................... 41 7.5 Decontamination of Measurement & Optical Surfaces ...................... 41 8. Appendices .............................................................................45 8.1 Instrument specifications ................................................................... 45 8.2 Absorbance calculation ..................................................................... 46 8.3 Concentration Calculation (Beer-Lambert Law) ................................. 46 8.4 Fluorescent Dyes Measurement ........................................................ 47 1. Overview 1.1 Introduction UVS-99 is a full-spectrum spectrophotometer (200~ 850nm) that measures 1μl sample with high accuracy and reproducibility. It utilizes a new sample retention technology that employs surface tension alone to hold the sample in place. No cuvettes or capillaries or other positioning instruments required. It’s simple to operate and easy to clean by swiping with a laboratory wipe. Furthermore, UVS-99 can measure high concentration samples without dilution (50×higher concentration than a general spectrophotometer can measure). Figure 1.1 -1- 1.2 Operation Simply pipette 1~ 2.5 μl sample onto the measurement pedestal, and then lay down the sampling arm to contact with the liquid sample. The liquid sample will bridge the gap between both optical fibers. The gap is controlled to both 1mm and 0.2 mm paths. UVS-99 can automatically complete the whole measurement process within 10 seconds. A pulsed xenon flash lamp provides the light source and a spectrometer utilizing a linear CCD array used to analyze the light after passing through the sample. The instrument is controlled by special software installed in a computer. Open Drip Figure 1.2 1.3 Applications ● Undiluted nucleic acid (2~ 3700 ng/μl) ● Purified protein A280 (≤100 mg/ml) ● Lowry & Bradford ● Cell density ● General UV/VIS spectrophotometry -2- Measurement 2. Installation 2.1 Computer requirements ● Operation system: Windows7 & above ●Office Excel 2007, 2010 & above ● USB port ● Screen 2.2 Software installation The UVS-99 software must be installed onto the computer before the USB cable is connected. The UVS-99 software is in the CD-rom provided. pay attention here. Please Please use “Administrator” ID to log in the Microsoft operation system. The installation procedures are detailed as follow: ● Insert the UVS-99 CD-rom into the CDROM unit. Copy and save the Double click the “setup” software on the CD-rom provided to the computer. program and click “OK” to continue the installation. Figure 2.1 ● Change directory. Please pay attention here. Because of the security control of Microsoft operation system, please install the software to -3- non-system drive, that is, D Drive or E Drive. Figure 2.2 Figure 2.3 ● Click “OK” to finish the installation. ● After installation, connect UVS-99 unit with the computer by the USB cable provided and then “Found New Hardware Wizard” should pop up on the computer screen as shown below. Figure 2.4 -4- ● Run the wizard to search the driver. Select “Install the software automatically (Recommended)”. Click “Next” and the installation will be completed automatically. Figure 2.5 ● Your UVS-99 should be ready for operation. 2.3. Precautions 1. Before the UVS-99 software is installed in the computer, do not turn on the power switch (1 is on and 0 is off). And do not connect the USB cable to the computer. 2. Do switch off the power (0 is off)first before connecting or disconnecting the USB cable TO/OFF the computer. 3. Do not connect USB cable or do disconnect the USB cable to/off the computer either when booting or shutting down the computer. -5- 4. Do turn off the power and disconnect the USB cable off the computer when UVS-99 is not going to be used. 5. Do turn off the power and disconnect the USB cable off the computer before installing any kind of software in the computer. 6. The violation of all of the above precautions are deemed as misuse and not entitled to warranty. 7. The interval between each measurement must be more than 10~15 seconds. 8. If the sampling arm does not bounce back, please switch off the power button immediately and re-start the software. -6- 3. General Operation 3.1 Sample size (recommendation): ●Nucleic acid samples: 1~ 2.5 μl ●Protein samples: 1~ 2.5 μl ● Suspended cell samples: 1~ 2.5μl ●Other samples: 2.5 μl 3.2 General measurement protocol Check the connection between UVS-99 and the computer. Turn on the power on/off switch. software. Make sure the sampling arm is closed and run the UVS-99 will perform self-check procedure. Select a module from the main menu according to the sample type (Figure 3.1), and UVS-99 will perform self-check procedure again. Figure 3.1 -7- ● Blanking · Each time a software module is opened (initiated), the “Measure” button is inactive. A blank must first be measured before the “Measure” button becomes active. · Lift the sampling arm, then pipette 1~ 2.5μl of the blank sample (the buffer, solvent, or carrier liquid used with your samples) onto the measurement platform. ·Lay down the sampling arm and make sure the solution bridge the gap between both optical fibers. ·Click the button“Blank”.UVS-99 will measure the solution with both1 mm and 0.2 mm path lengths, and then the system will record both results automatically. No need to re-blank unless samples are in different solutions. ·When the measurement is complete, open the sampling arm and wipe the blanking buffer from both pedestals using a laboratory wipe (e.g. Kimwipe). ● Sample measurement ·Type the “Sample ID” and select the “Sample Type”. ·Pipette 1~ 2.5μl sample onto the measurement platform while the sampling arm is opened. ·Lay down the sampling arm and make sure the solution bridges the gap between both optical fibers. ·Click the button “Measure”, and the measurement result will appear on the screen within 10 seconds. ·Autosave:The system will record and autosave the measurements. The maximum number of records is 1000. ·When the measurement is completed, open the sampling arm and wipe the sample from both pedestals using a laboratory wipe. -8- ·Repeat the measurement till all samples are measured. Click the button “Report” and all data would be exported into a new Excel table. ● Quick buttons There are two buttons on UVS-99. icon in the operation software. “MEA” is same as the “Measurement” “BLA” is same as the “Blank” icon in the operation software. Figure. 3.2 3.3 Factors of affecting the measurement results ● Samples carryover Any sample residue retained on the measurement platform would cause a slight error in the measurement result. Clean both pedestals with a lab wipe right after the measurement is usually sufficient to prevent sample carryover. Although generally not necessary, 2μl water aliquots can be used to clean bothpedestals after particularly high concentration samples. After measuring a large number of samples, however, it is recommended that the areas around the upper and lower pedestals should be cleaned thoroughly. -9- ● Samples homogeneity Samples in un-homogeneous solution, particularly when using small volumes, would cause significant deviation in data generated by using all measurement technologies including spectrophotometer. ● Effect of evaporation Evaporation of the sample during the measurement would account for 1-2% increase in sample concentration. Highly volatile solvents, such as hexane, would likely evaporate before the completion of measurement. Less volatile solvents such as DMSO can be used successfully. - 10 - 4. Measurement 4.1 Nucleic Acids ● Sample Volume Requirements: 1~ 2.5μl; 1.5 μl is recommended ● Range: 0.1~ 75Abs. ● Reproducibility: 0.1~ 5 Abs. ±0.1 5~ 75 Abs. ±2% ● Measurements: UVS-99 will measure each sample with both1 mm and 0.2 mm path lengths, and then automatically pick the appropriate one to normalize to a 10 mm path. Figure 4.1 ·Type the “Sample ID” and select the “Sample Type”. · Sample ID: Used to define the name of the sample. - 11 - · Sample Type: Used to select the type of nucleic acid being measured, including dsDNA, ssDNA, RNA and other. · nm/ Abs: User-selected wavelength and corresponding absorbance. The wavelength can be selected by typing in or using the up/down arrows to the left of the wavelength box. Note: The user-selected wavelength and absorbance are not utilized in any calculations. · A260: Absorbance of the sample at 260 nm represented as if measured with a conventional 10 mm path. Note: This is 10X the absorbance actually measured using the 1 mm path length and 50X the absorbance actually measured using the 0.2 mm path length. · A280: Sample absorbance at 280 nm represented as if measured with a conventional 10 mm path. Note: This is 10X the absorbance actually measured using the 1 mm path length and 50X the absorbance actually measured using the 0.2 mm path length. · 260/280: Ratio of sample absorbance at 260 and 280 nm. The ratio of absorbance at 260 and 280 nm is used to assess the purity of DNA and RNA. A ratio of ~1.8 is generally accepted as “pure” for DNA; a ratio of ~2.0 is generally accepted as “pure” for RNA. If the ratio is appreciably lower in either case, it may indicate the presence of protein, phenol or other contaminants that absorb strongly at or near 280 nm. · 260/230: Ratio of sample absorbance at 260 and 230 nm. This is a secondary measure of nucleic acid purity. The 260/230 values for “pure” nucleic acid are often higher than the respective 260/280 values. They are commonly in the range of 1.8~ 2.2. If the ratio is appreciably lower, this may indicate the presence of co-purified contaminants. ·Concentration: ng/μl - dsDNA concentration= 260 nm Abs × 50 - 12 - - ssDNA concentration= 260 nm Abs × 33 - RNA concentration= 260 nm Abs × 40 - Other concentration= 260 nm Abs × Constant ·Autosave:The system will record and autosave the measurements. The maximum number of records is 1000. ·Save Graph:Click “Save Graph” to save your graph if necessary. ·Report: Click “Report”. All results have been recorded will be exported to an Excel file. Absorbance data shown in files are represented as displayed on the software screen. Figure 4.2 4.2 Protein A280 ● Sample Volume Requirements: 1~ 2.5 μl, a minimum of 2μl is recommended. ● Range: 0.1~ 75 Abs. ● Reproducibility: 0.1~ 5 Abs ±0.1 - 13 - 5~ 75 Abs. ±2% ● Measurement: UVS-99 will measure each sample with both1mm and 0.2mm path lengths, and then automatically pick the appropriate one to normalize to a 10 mm path. Figure 4.3 ·Type the “Sample ID” and select the “Sample Type”. ·Sample ID: Used to define a name of sample. ·Sample Type: Used to select the type of protein being measured. - 1 Abs= 1 mg/ml: A general reference setting based on a 0.1% (1 mg/ml) protein solution producing an Absorbance at 280 nm of 1.0 A (where the path length is 10 mm). - 14 - - BSA: Bovine Serum Albumin reference. Unknown (sample) protein concentrations are calculated using the mass extinction coefficient of 6.7 at 280 nm for a 1% (10 mg/ml) BSA solution. - IgG: IgG reference. Unknown (sample) protein concentrations are calculated using the mass extinction coefficient of 13.7 at 280 nm for a 1% (10 mg/ml) IgG solution. - Lysozyme: Lysozyme reference. Unknown (sample) protein concentrations are calculated using the mass extinction coefficient of 26.4 at 280 nm for a 1% (10 mg/ml) Lysozyme solution. - Other: User-entered mass extinction coefficient (L gm-1cm-1) for a 1% (10 mg/ml) solution of the respective reference protein. · nm/ Abs: User-selected wavelength and corresponding absorbance. The wavelength can be selected by typing in or using the up/down arrows to the left of the wavelength box. Note: The user-selected wavelength and absorbance are not utilized in any calculations. ·A280: Sample absorbance at 280 nm represented as if measured with a conventional 10 mm path. · A260: Sample absorbance at 260 nm represented as if measured with a conventional 10 mm path. ·A260/280:Ratio of sample absorbance at 260 and 280 nm ·Concentration: mg/ml - Concentration (1Abs= 1 mg/ml) = A280× 10 - Concentration (BSA) = A280× 10/ 6.7 - Concentration (IgG) = A280× 10/ 13.7 - Concentration (Lysozyme) = A280× 10/ 26.4 - 15 - ·Autosave:The system will record and autosave the measurements. The maximum number of records is 1000. ·Save Graph:Click “Save Graph” to save your graph if necessary. ·Report:Click “Report” and all results have been recorded will be exported to an Excel file. Absorbance data shown in files are represented as displayed on the software screen. Figure 4.4 - 16 - 4.3 Cell Cultures The “Cell Cultures” module displays the sample spectrum from 200nm to 850nm.Two cursors can be set to the wavelengths of interest. ● Sample Volume Requirements: 1~ 2.5 μl; minimum 2 μl is recommended ● Measurement: UVS-99 will measure each sample with both1 mm and 0.2 mm path lengths, and then automatically pick the appropriate one to normalize to a 1 mm path. Figure 4.5 ·Type the “Sample ID”. ·Sample ID: Used to define a name of sample. - 17 - · λ1/ Abs: User-selected wavelength and corresponding absorbance. The wavelength can be selected by typing in or using the up/down arrows to the left of the wavelength box. · λ2/ Abs: User-selected wavelength and corresponding absorbance. The wavelength can be selected by typing in or using the up/down arrows to the left of the wavelength box. ·Max Absorbance: Used to re-scale the upper limit of the Y-axis. ·Autosave:The system will record and autosave the measurements. The maximum number of records is 1000. ·Save Graph:Click “Save Graph” to save your graph if necessary. · Report: Click “Report” and all results have been recorded will be exported to an Excel file. Absorbance data shown in files are represented as displayed on the software screen. - 18 - 4.4 UV- VIS The “UV-VIS” module allows the UVS-99 spectrophotometer to function as a conventional spectrophotometer. Sample absorbance is displayed on the screen from 200nm to 850nm and cursors permit the measurement of individual peaks. ● Sample Volume Requirements: 1~ 2.5 μl; minimum 2 μl is recommended. ● Measurement: Figure 4.6 ·Type the “Sample ID” and select the “Sample Type”. - 19 - ·Sample ID: Used to define a name of sample. · 1mm curve: Show the curve of absorbencies measured by 1 mm path · 0.2mm curve: Show the curve of absorbencies measured by 0.2 mm path · λ1/ Abs: User-selected wavelength and corresponding absorbance. The wavelength can be selected by typing in or using the up/down arrows to the left of the wavelength box. The absorbance is related to the curve that selected to show. · λ2/ Abs: User-selected wavelength and corresponding absorbance. The wavelength can be selected by typing in or using the up/down arrows to the left of the wavelength box. The absorbance is related to the curve that selected to show. Note: If both curves are shown, the absorbance and the curve showed on the screen are related to 1 mm path. · Max Absorbance: Used to re-scale the upper limit of the Y-axis. ·Autosave:The system will record and autosave the measurements. The maximum number of records is 1000. ·Save Graph:Click “Save Graph” to save your graph if necessary. ·Report: Click “Report” and a dialog box will pop up (Figure 4.6).Press “Yes”, and the full spectrum between λ1 and λ2 will be exported to an Excel file with 1 nm increment. When “No” button is pressed, only the absorbencies of λ1 and λ2 will be exported to an Excel file. Calculation of Sample Concentration: There is one function in the UV-VIS module which can allow the user to calculate other samples’ concentration value with the same sample type by setting up and plotting the concentration curve of the known samples. As shown by Figure 4.7, click the upper left icon, “standard”,then Figure 4.8is seen. - 20 - Figure4.7 Figure 4.8 In the left-hand side of Figure 4.8, there are seven rows for the users to key in different absorbance and concentration values which simultaneously correspond to the X-Y axis diagram in the left-hand side. After the absorbance and concentration value are keyed in, click the icon of “OK”,the Figure 4.9 is seen. - 21 - Figure 4.9 The user can proportionately dilute their samples of known concentration and then measure their individual absorbance. The maximum rows for the user to key in is seven. After the user finishes keying in the measured concentration and absorbance ,click “OK”, the Figure 4.10 is seen. Figure 4.10 - 22 - After the standard curve is set up and plotted, when the user measures the same samples, the user can key in an absorbance value in the field of “Abs” of the “Sample” frame in the right lower part in Figure 4.10. Then the concentration value will be automatically shown in the “Concentration” filed of the “Sample” frame, according to the plotted standard curve. 4.5 Protein Lowry Taking the kit of Protein Lowry for example, according to the kit protocol, please use seven standards and set wavelength 1 as the major wavelength. Measure and input the absorbance value of each sample by UVS-99, as shown in Figure 4.11. Then click “standard” and “OK” icon. Figure 4.11 Furthermore, to the real samples, please set wavelength 1 as the major wavelength. The measured value from the major wavelength will be carried forward to the standard curve. The concentration value of the sample will be shown in “Concentration” in the module of “standard” - 23 - Figure 4.12 ·Sample ID: Used to define a name of sample. · wavelength 1:User-selected wavelength and corresponding absorbance. The wavelength can be selected by typing in or using the up/down arrows to the left of the wavelength box. The absorbance is related to the curve that selected to show. · wavelength 2:User-selected wavelength and corresponding absorbance. The wavelength can be selected by typing in or using the up/down arrows to the left of the wavelength box. The absorbance is related to the curve that selected to show. · Max Absorbance: Used to re-scale the upper limit of the Y-axis. ·Save Graph:Click “Save Graph” to save your graph if necessary. ·Report: Click “Report” and a dialog box will pop up. - 24 - 4.6 Protein Bradford The wavelength range for Bradford is between 575nm and 750nm. 575nm is the major wavelength. The default wavelength in the software is 595nm and 725nm. The user can select his own wavelength. ● Sample Volume Requirements: 1~ 2.5 μl; minimum 2 μl is recommended. ● Measurement: Taking the kit of Protein Bradford for example, according to the kit protocol, please use seven standards and set wavelength 1 as the major wavelength. Measure and input the absorbance value of each sample by UVS-99, as shown in Figure 4.13. Then click “standard” and “OK” icon. Figure 4.13 Furthermore, to the real samples, please set wavelength 1 as the major wavelength. The measured value from the major wavelength will be carried forward to the standard curve. The concentration value of the sample will be shown in “Concentration” in the module of “standard” - 25 - Figure 4.14 Sample ID: Used to define a name of sample. · wavelength 1:User-selected wavelength and corresponding absorbance. The wavelength can be selected by typing in or using the up/down arrows to the left of the wavelength box. The absorbance is related to the curve that selected to show. · wavelength 2:User-selected wavelength and corresponding absorbance. The wavelength can be selected by typing in or using the up/down arrows to the left of the wavelength box. The absorbance is related to the curve that selected to show. · Max Absorbance: Used to re-scale the upper limit of the Y-axis. ·Save Graph:Click “Save Graph” to save your graph if necessary. ·Report: Click “Report” and a dialog box will pop up. - 26 - 5. Check and Adjustment of Light Intensity 5.1 Introduction If an “un-smooth” or “ragged” absorption spectrum still appears after cleaning both pedestals, you should check the light intensity. The light intensity can be checked and adjusted by using the “Settings” module in the software. There is no sample is needed when you perform this procedure. 5.2 Operation With the sampling arm down, select the “Settings”module from the main menu. The window will appear as the figure below. Figure 5.1 Select the type of sample you are working with. For example, the window will show as figure 5.1 when “Nucleic Acid” is clicked. - 27 - Once the path length is selected (0.2 mm or 1 mm), a red reference spectrum will appear. Figure 5.2 Input a positive integer in the blank space (1~ 20, usually 4 is a good start), and then click “Read Data”. The software will draw up a black spectrum under the coefficient that you have input. The light intensity should be kept within 100~3500 for better reliability and stability, though the detection limit of intensity is 10 forUVS-99.The intensity spectrum should be close to the reference spectrum and slightly lower. You can increase the coefficient to bring the intensity spectrum up. Click the “Save” button can save the appropriate coefficient. Restart the UVS-99 software after saving the setting. There are six measurement modules in the software. Each module contains two coefficients for 0.2 mm and 1 mm. You should adjust and save all the twelve coefficients respectively. - 28 - 5.3 Light intensity check The reproducibility of light intensity can be checked according to the spectra. Please click the “Read Date” button continuously under the same coefficient to get severalspectra. If all intensity spectra nearly coincide, it indicates that the instrument works well with high reproducibility. Figure 5.3shows 10 spectra(black) under the same coefficient, and all intensity spectracoincide well. Figure5.3 If the spectracannot coincide well (Figure5.4), there are some problems in the photo source or optical fibers. You can scour both pedestals with de-ionized water to solve this problem. If the spectra cannot coincide well after cleaning, please contact your local distributor. - 29 - Figure5.4 5.4 Light intensity adjustment The coefficient should be adjusted to get a continuous smooth intensity spectrum, and keep the light intensity within 100~ 3500. It is also important to keep the intensity spectrum close to the reference spectrum, which indicates the light source works well. Figure 5.7 shows 7 intensity spectra with the coefficient from 1 to 7.Set the coefficient at 4 is more appropriate in this case, since the spectrum is close to the reference spectrum and slightly lower. - 30 - 7 6 5 4 3 2 1 Figure 5.5 It will lead to a jagged absorption spectrum if the light intensity is too high to get a continuous smooth curve. On the contrary, low light intensity will affect the absorbance measurement with high concentration samples. 5.5 Special application A special measurement can be done by adjusting the coefficient of light intensity. Here is an example of UV-VIS measurement. Both reference spectrum and intensityspectrum (coefficient= 1) of “UV-VIS” module are shown below (Figure 5.6). - 31 - Figure 5.6 From figure5.6, it seems the coefficient should no more than 1, or the intensity will be too high to get a continuous curve at 470~550nm.However, the sample, K2Cr2O7, has an absorbance at 350nm, and low light intensity (<1000) there will limit the detection range of high concentration samples. It’s necessary to adjust the coefficient to increase the light intensity at 350 nm. When the coefficient is adjusted to 4, the light intensity increases (Figure 5.7) and the absorption spectrum is smoother at 350 nm (Figure 5.8). Note: Increase the coefficient may lead to saturation of intensity and affect the absorbance measurement at some wavelengths. In this case, the intensity is saturated (Figure 5.7) and it leads to a jagged absorbance curve (Figure 5.8) at430~ 550nm. - 32 - Figure 5.7 Figure 5.8 - 33 - 5.6 Set up of the Calibration Parameters Please open the CPSetting.exe in the UVS-99 installation directory. It can be used to modify and edit the absorbance calibration parameters and thus obtain more accurate measurement values. Definition: The Beer-Lambert equation is used to correlate the calculated absorbance with concentration: A=E*b*c Where A is the absorbance represented in absorbance units (A), E is the wavelength-dependent molar absorptivity coefficient (or extinction coefficient) with units of liter/mol-cm, b is the path length in cm, and c is the concentration of sample in moles/liter or molarity (M). To edit the calibration parameter of UVS-99, K, is equivalent to editing the value, b, in the above formula so as to get more accurate A value. - 34 - K1 is the calibration parameter of low absorbance value (smaller than or equal to 10Abs(10mm)). It is recommended to use 4~8Abs(10mm) standard sample or so for calibration, e.g., double strand DNA 250ng/ul. K2 is the calibration parameter of high absorbance value (bigger than 10Abs (10mm)). It is recommended to use 20~40Abs (10mm) standard sample or so for calibration, e.g., double strand DNA 1000ng/ul). When you click “load” icon, you can find the original parameter for this UVS-99. - 35 - For example, when UVS-99 is used to measure certain standard sample and the real sample value is 100, however, the measured value is 80, lower than 100. Then the user can change the calibration parameter to 100/80=1.25. Note:Because the calibration parameters of each UVS-99 are all different, please do take into account the original K parameter before editing the K parameter. Taking the above case for example, if the original K parameter is 0.9, then the new K parameter should be 0.9*100/80 = 1.125. - 36 - 6. Troubleshooting 6.1 Unable to find USB device Figure 6.1 This error might appear upon software startup and usually indicates that the USB cable is not properly connected or the software is not installed properly. Please follow the following steps to double check. ●Check the USB cable, and ensure that it is plugged into both the computer and the UVS-99. ● Check the power adaptor. Please check if the light on the adaptor is on. ● Check if the connection of the computer’s COM option (UVS-99) under the “system property/hardware/device manager” is normal or not. ● Pull out the USB cable from the computer’s USB port and re-plug in. ● Install UVS-99 in another computer to rule out a faulty USB hub/port on the original computer and then run the software. If same thing happens, please contact your local distributors. 6.2 Optics System Checking If the pop-up message “Optic signal error” appears when the UVS-99 is self checking, the error could be due to the following reasons: - 37 - ● The life time of the Xenon flash lamp has been exhausted. ● The fiber is broken. ● The sample arm is open. It must be closed. ● The position of source fiber and receiving fiber is not aligned. Please contact your local distributors. 6.2 Sample accuracy and reproducibility If the results are seemingly inaccurate or not reproducible, the reasons could be sample or aliquot non-homogeneity, or liquid column breakage. It may be helpful to try the following to ensure representative results: ● Make sure the sampling surfaces are clean before starting the software module. A dirty sample pedestal can cause erroneous absorbance (even negative values) and signal saturation. It is always a good practice to clean the surfaces with de-ionized water to remove any residue. ● The liquid column breakage can cause an abnormity result. The sufficient samples (1~2.5ul) can insure the liquid column is intact. Generally, the surface tension of protein solution is lower than other solution, so the liquid column cannot form easily. To troubleshoot, pipette some de-ionized water onto the bottom pedestal, and lower the upper pedestal into the solution and let it sit for approximately 2 to 3 minutes. Wipe with a clean lab wipe to dry both pedestals. Fold a clean dry lab wipe over several times to increase its thickness. Press the lab wipe firmly down on the lower pedestal and “rub" the pedestal with a folded lab wipe very aggressively at least 15- 20 times. - 38 - ● Heat DNA samples to 55°C and vortex before measurement. Due to the small volumes required by the UVS-99, it is extremely important to ensure that the sample being measured is homogeneous. Field experience has shown that samples containing large molecules such as genomic or lambda DNA are particularly susceptible to this phenomenon. Note: Larger volumes used by cuvette-based spectrophotometers will minimize or mask the effect of sample non-homogeneity. ● Confirm that reference (blank) solution and solvent are the same material. Buffers often absorb in the UV range. Therefore, it is critical to blank the instrument with exactly the same material that the sample is suspended in. ● Confirm that your sample is not too dilute. Measuring samples at or near the detection limit will result in measurements that can vary in a significant amount. Refer to the applicable measurement range of the application module that you are using. 6.3 Unusual spectrum A sample that exhibits jagged absorption spectrum, but a normal shape, may be the result of detector saturation. This can be due to a dirty sample pedestal upon startup. Try cleaning both sample pedestals thoroughly, and restarting the software. A spectrum that is very “un-smooth” or “ragged” can also be caused by insufficient light intensity reaching the spectrometer. If you suspects that this is occurring, please refer to Section 5. Check and Adjustment of Light Intensity and adjust the intensity coefficient. - 39 - 7. Maintenance and Warranty 7.1 Cleaning To prevent sample carry over, the most important thing is to keep the sampling arm and measurement pedestal clean. Upon completing each sample measurement, wipe the sample from both the sampling arm and measurement pedestal simply using an ordinary dry laboratory wipe. A final cleaning of both pedestals with de-ionized water is also recommended after the user’s last measurement. 7.2 Parts that require replacements In general, the only part that should periodically require replacement is the flash lamp. The flash lamp theoretically can last a minimum of 300K measures. There is no way to test the flash lamp to confirm its remaining life. When the flash lamp fails, the light output will become very erratic or stop altogether.Please contact your local distributor if this happens. 7.3 Calibration of wavelength The wavelength is auto-calibrated based on known peaks in the xenon lamp spectra each time the software is started. No calibration is required under normal use; please contact your local distributor if needed. - 40 - 7.4 Solvent Compatibility The UVS-99 is compatible with most solvents typically used within sample solution in life science laboratories. However, all forms of Hydrofluoric Acid (HF) are incompatible, as the fluoride ion will dissolve the quartz fiber optic cable. 7.5 Decontamination of Measurement & Optical Surfaces If decontamination is necessary, a sanitizing solution, such as a 5.25% solution of sodium hypochlorite (freshly prepared bleach), can be used to ensure that no biologically active material is present on the measurement pedestals. The metal sample pedestals are made from stainless steel and are resistant to most common laboratory solvents. 7.6 Warranty Terms Products are supplied for research use only. The Manufacturer warrants the Products are free from defects in material and manufacture and conform to the specifications at the time of shipment. Subject to verification by The Manufacturer, if any Product fails to conform to the specifications or any defect in material or manufacture appears: 1) for Products which are scientific instruments within 13 months from the date of shipment; and 2) for related Consumable Products, modules and parts within 30 days from the date of shipment, The Manufacturer’s entire liability and Customer’s exclusive remedy shall be, at The Manufacturer’s sole discretion, the repair or replacement of the defective Products. - 41 - 7.7 Limitations to Warranty Unless a separate service plan is purchased, all regularly scheduled maintenance and repairs during the Warranty term shall be the responsibility of Customer. This warranty does not cover any damage to Products due to misuse, improper site selection, and maintenance or operation by Customer or any others which is contrary to recommended instructions and design parameters for the Products. This warranty does not cover damage or defects resulting from repair or relocation of the Products by anyone other than an Avans representative. After the initial installation of the Products any post installation realignment, readjustment, re-cleaning, or recalibration, unless due to defects in material or workmanship, are the responsibility of Customer. Certain items which are refurbished or otherwise reconditioned are also excluded from the terms of this warranty. This warranty does not cover any damage due to accidents, vandalism, fire, flood, other environmental factors or any other Force Majeure. If you have questions regarding warranty coverage, please contact your local supplier. The warranty further excludes items supplied by third party manufacturers, such as computers and related software. Customer is responsible for any modifications to the computers or software including, but not limited to: interfacing or networking; unauthorized hardware modifications; repartitioning or reformatting of the hard drive; installation or modification of additional or new hardware; and installation or reinstallation of new or existing computer operating systems or service packs. THIS WARRANTY IS MADE IN LIEU OF ALL OTHER WARRANTIES, EXPRESS OR IMPLIED, INCLUDING BUT NOT LIMITED TO THE IMPLIED WARRANTY OF MERCHANTABILITY OR FITNESS FOR A PARTICULAR - 42 - PURPOSE; ANY IMPLIED WARRANTY ARISING OUT OF A COURSE OF DEALING OR OF PERFORMANCE, CUSTOM OR USAGE OF TRADE; OR ANY IMPLIED WARRANTY AGAINST PATENT INFRINGEMENT. UNDER NO CIRCUMSTANCES SHALL THE MANUFACTURER BE LIABLE FOR DAMAGES OF ANY KIND, INCLUDING WITHOUT LIMITATION, DIRECT, INDIRECT, INCIDENTAL, SPECIAL OR CONSEQUENTIAL DAMAGES (INCLUDING, BUT NOT LIMITED TO, LOSS OF PROFITS, REVENUE OR BUSINESS) RESULTING FROM OR IN ANY WAY RELATED TO THE PRODUCTS. These limitations apply regardless of whether such damages are sought based on breach of contract, negligence, strict liability in tort, or any other legal theory. The liability of The Manufacturer relating to any order by Customer shall in no event exceed the total amount of the payments received by The Manufacturer relating to such order. By placing their order, Customers represent and warrant that they and their employees and agents shall comply with all applicable laws, ordinances, regulations and codes in handling, storage and use of Products and shall indemnify and hold harmless The Manufacturer from any claims, rights or causes of action related thereto, or to Customer’s failure act in accord with these terms and warranties. While information and data presented are accurate and reliable to the best of The Manufacturer’s information and belief, The Manufacturer does not guarantee the accuracy of any information and data, nor do we represent that - 43 - reliance upon such information and data will ensure compliance with any applicable laws and regulations. The Manufacturer reserves the right to alter these terms and conditions at any time and without notice to Customer. Any variance of these terms is not valid unless it is in writing and signed by an officer or other authorized representative of The Manufacturer. The warranty is void if The Product has been abused or misused or if repairs have been attempted by unauthorised persons. - 44 - 8. Appendices 8.1 Instrument specifications Standard path length Short path length (for high concentration sample) 1 mm 0.2 mm Sample volume 0.5~ 2.5 ul Light source Xenon flash lamp Detector 3648-element linear silicon CCD array detector Wavelength range 200~ 850 nm Wavelength accuracy 1 nm Wavelength resolution 3 nm (FWHM at Hg 546 nm) ≤ 1.8 nm (FWHM at Hg 253.7 nm) Absorbance precision 0.002 (1 mm path) Absorbance accuracy 2% (at 0.76 absorbance at 257 nm) Measurement accuracy 0.1~ 5 Abs. ±0.1 5~ 75 Abs. ±2% Measurement cycle time < 5 seconds Size W20* D15* H12 cm Sample pedestal material Stainless steel Optical fiber cable material Quartz Voltage 12 VDC Power 6W Detection range of dsDNA 2~ 3500 ng/ ul Detects protein up to 100 mg/ ml Weight 1.4 kg - 45 - 8.2 Absorbance calculation When the UVS-99 Spectrophotometer is “blanked”, a spectrum is taken of a reference material (blank) and stored as an array of light intensity by wavelength. When a measurement of a sample is taken, the intensity of light that has transmitted through the sample is recorded. The sample intensity (Isample) along with the blank intensity(Iblank) are used to calculate the sample absorbance(Abs) according to the following equation: Isample Ab s log I blank Thus, the measured light intensity of both the sample and of the blank are required calculating the absorbance at a given wavelength. 8.3 Concentration Calculation (Beer-Lambert Law) The Beer-Lambert equation is used to correlate the calculated absorbance with concentration: A=E*b*c Where A is the absorbance represented in absorbance units (A), E is the wavelength-dependent molar absorptivity coefficient (or extinction coefficient) with units of liter/mol-cm, b is the path length in cm, and c is the concentration of sample in moles/liter or molarity (M). - 46 - 8.4 Fluorescent Dyes Measurement The “UV-VIS” module of UVS-99 can be used to measure the absorbance of fluorescent dyes as well. It can eliminate potentially flawed sample and improve research effectiveness in microarray application. Based on the general form of the Beer-Lambert equation, you can calculate fluorescent dye concentrations with the measured absorbance. The table of extinction coefficients for each dye is below: Dye Type Extinction Coefficient Measurement (liter/ mol-cm) Wavelength(nm) Cy3 150000 550 Cy5 250000 650 Alexa Fluor 488 71000 495 Alexa Fluor 546 104000 556 Alexa Fluor 555 150000 555 Alexa Fluor 594 73000 590 Alexa Fluor 647 239000 650 Alexa Fluor 660 132000 663 Cy3.5 150000 581 Cy5.5 250000 675 - 47 - Avans Biotechnology Corp. (www.avansbio.com)