1
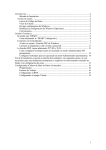
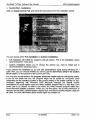
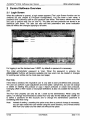
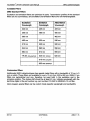
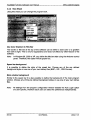
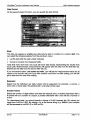
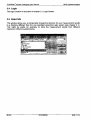
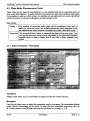
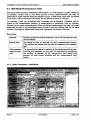
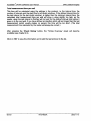
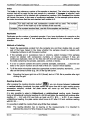
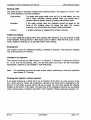
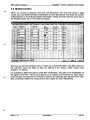
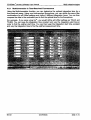
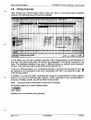
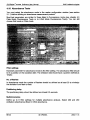
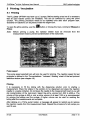
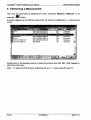
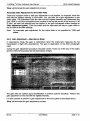
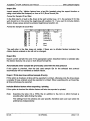
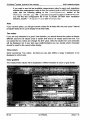
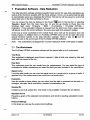
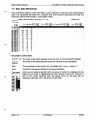
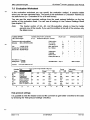
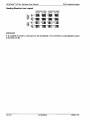
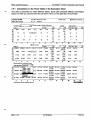
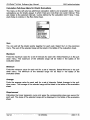
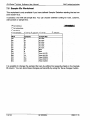
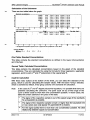
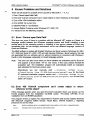
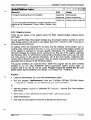
BMG Labtechnologies
FLUOstar*OPTIMA
Software User Manual
7.3 Raw Data Worksheet
This worksheet displays all the raw data for each interval or cycle from the measurement.
Each row represents the data from a specific well. Each column represents the data at a
particular interval (well mode) or cycle (plate mode).
Test Name GROUP A STANDARD
$
ID 1: Rhodamin
ID 2:
2001*09*12 11:42:17
ID 3:
Order by rows
O Order by columns
Calc. Range Start 11
Veil
Cont.
A01
A01
A01
AOt
A02
A02
A02
A02
A03
A03
A03
A03
A04
A04
AM
A04
A05
A05
A05
A05
SA1
SA1
SA1
SA1
SA2
SA2
SA2
SA2
SA3
SA3
SA3
SA3
SA4
SA4
SA4
SA4
SA5
SA5
SA5
SA5
143
5666?
1
Stopi
Calc. Range Start 2
Stop 2
286
0
0
57495
57194
249
24S
247
1565
62
1516
1564
59
5S
19777
19642
19119
136
134
137
894
902
910
42
42
44
8902
8630
S453
69
72
68
532
564
559
35
42
37
4762
34
354
36
4514
4431
32
34
29+7
2S45
2723
40
43
376
351
21
23
24
253
290
287
37
35
31
Description of the chart:
; Order by rows • The order of the wells appears sorted by rows on the microplate (default).
Order by
The order of the wells appears sorted by columns on the microplate.
columns
! Well
The coordinates of the well in the microplate (A01 = row A, column 1)
! Cont.
Content of the well as labeled in the layout definition.
Here you can select a specific well or a group of wells to be displayed in the
Signal Curve sheet by highlighting the well name(s) in the Cont. Column. If
you do not select anything here the signal curve for all wells will be
displayed, although with a maximum of 253 wells.
Veil Cont.
A01
A02
B03
B04
BOS
BOG
B07
BOS
BOS
BIO
B11
SI
S2
' ^H
• ^1
i ^fl
i ^•1
i ^H
S10
"
S11
2002-11-15
0413F0003A
97/123


![[v0.3.5.63 Blue Release] (4.17MB PDF)](http://vs1.manualzilla.com/store/data/005758602_1-69f3b29a9a050ef0b6d8d37fccf12e09-150x150.png)