1
BMG Labtechnoiogies
FLUOstar*
OPTIMA
Software User Manual
Version 1.20-0
FLUOstar1'OPTIMA
BMG Labtechnologies
Software User Manual
This manual was designed to guide FLUOstar / POLARstar OPTIMA users through the
software features.
Although these instructions were carefully written and checked, we cannot accept
responsibility for problems encountered when using this manual. Suggestions for
improving this manual will be gratefully accepted.
BMG Labtechnologies reserves the right to change or update this manual at any time. The
Revision-Number is stated at the bottom of every page.
BMG Labtechnologies GmbH
Hanns-Martin-Schleyer Str. 10
77656 Offenburg
Germany
Phone: +49 781 96968-0
Fax: +49 781 96968-67
[email protected]
BMG Labtechnologies Ltd.
PO Box 73
Aylesbury, HP 20 2 QJ
United Kingdom
Phone: +44 1296 33 66 50
Fax:
+44 1296 33 66 51
[email protected]
BMG Labtechnologies, Inc.
2415 Presidential Dr., Bldg. 204, #118
Durham, NC 27703
USA
Phone: +1 919 806 1735
Fax:
+1919 806 8526
[email protected]
BMG Labtechnologies S.A.R.L.
7, Rue Roland Martin
94500 Champigny s/ Marne
France
BMG Labtechnologies Pty. Ltd.
P.O. Box 469
Mount Eliza, Victoria 3930
Australia
Phone: +61 3 5973 4744
Fax:
+613 5973 4711
[email protected]
Phone: +33 1 48 86 20 20
Fax: +33 1 48 86 47 07
[email protected]
Copyright © 2001-2002 BMG Labtechnologies. All rights reserved. All BMG Labtechnologies brand and product names are trademarks
of BMG Labtechnologies. Other brand and product names are trademarks or registered trademarks of their respective holders.
2/123
0413F0003A
2002-11-15
FL UOstar OPTIMA Software User Manual
BMG Labtechnologies
TABLE OF CONTENTS
1
SYSTEM REQUIREMENTS
5
1.2
A VERSION OF F L U O S T A R OPTIMA SOFTWARE IS ALREADY INSTALLED
5
1.3
1.3.1
SOFTWARE INSTALLATION
EXCEL INSTALLATION
FLUOSTAR OPTIMA SOFTWARE INSTALLATION
UNINSTALLING THE F L U O S T A R OPTIMA SOFTWARE
6
6
2
2.1
2.1.1
2.2
2.3
3
3.1
3.1.1
3.1.2
3.1.3
3.1.4
3.1.5
3.2
3.3
3.3.1
3.3.2
3.3.3
3.3.4
3.4
3.5
4
w
5
1.1
1.3.2
1.4
w
INSTALLATION
4.1
4.2
4.3
4.3.1
4.3.2
4.3.3
4.4
4.4.1
4.4.2
4.5
4.5.1
4.6
4.7
4.7.1
4.7.2
4.8
4.8.1
4.9
4.10
4.11
4.12
CONTROL SOFTWARE OVERVIEW
12
LOGIN SCREEN
USER DIRECTORIES
MAIN SCREEN
ICONS AND MENU COMMANDS
12
13
14
15
SETUP
17
INSTRUMENT SETUP
READER CONFIGURATION
CONNECTION
FILTERS
READER OFFSETS
MICROPLATES
FIRMWARE UPDATE
PROGRAM CONFIGURATION
PREFERENCES SHEET
VIEW SHEET
ASCII EXPORT FUNCTION
R U N STATISTICS
LOGIN
DATA PATH
17
17
18
19
21
22
25
26
26
28
29
35
36
36
DEFINING PROTOCOLS
37
PROTOCOL SELECTION WINDOW
CREATING A NEW TEST PROTOCOL
PLATE MODE FLUORESCENCE TESTS
BASIC PARAMETERS - PLATE MODE
TIME-RESOLVED TEST PROTOCOLS
KINETIC WINDOWS-PLATE MODE
WELL MODE FLUORESCENCE TESTS
BASIC PARAMETERS - WELL MODE
KINETIC WINDOWS-WELL MODE
LAYOUT DEFINITION
USING LAYOUT GROUPS
CONCENTRATIONS / VOLUMES / SHAKING
INJECTION TIMING
INJECTION TIMING-PLATE MODE
INJECTION TIMING-WELL MODE
MULTICHROMATICS
MULTICHROMATICS IN TLME-RESOLVED FLUORESCENCE
TIMING OVERVIEW
ABSORBANCE TESTS
LUMINESCENCE TESTS
FLUORESCENCE POLARIZATION TESTS
2002-11-15
7
11
0413F0003A
37
39
40
40
45
46
48
48
53
55
57
58
61
61
63
65
66
67
68
69
71
3/123
FLUOstar*OPTIMA
5
Software User Manual
BMG Labtechnologies
PRIMING / INCUBATION
72
5.1
PRIMING
72
5.2
INCUBATION
74
5.2.1
TEMPERATURE CONTROL
74
5.2.2
TEMPERATURE MONITORING FEATURE
74
5.2.3
A U T O P O W E R O N INCUBATION
75
6
PERFORMING A MEASUREMENT
6.1
P L A T E IDENTIFICATION
6.2
GAIN ADJUSTMENT
6.2.1
76
77
79
G A I N ADJUSTMENT - FLUORESCENCE A N D LUMINESCENCE M O D E
79
6.2.2
GAIN ADJUSTMENT - A B S O R B A N C E MODE
80
6.2.3
G A I N ADJUSTMENT - FLUORESCENCE POLARIZATION
81
6.2.4
REQUIRED VALUE
6.3
SAMPLE I D S / DILUTION FACTORS
6.4
MEASUREMENT
82
83
85
6.4.1
TIME DURATION
85
6.4.2
STOPPING THE TEST R U N
85
6.5
6.5.1
CURRENT STATE GRAPHICS
86
CURRENT STATE OVERVIEW
86
6.5.2
CURRENT STATE OPTIONS
87
6.5.3
Z O O M FEATURE
91
6.5.4
TIMING OVERVIEW
92
7
EVALUATION SOFTWARE • DATA REDUCTION
93
7.1
T H E WORKSHEETS
93
7.2
TEST RUNS WORKSHEET
94
7.2.1
FLUOSTAR
OPTIMA P U L L - D O W N M E N U
7.3
RAW DATA WORKSHEET
7.4
SIGNAL CURVE WORKSHEET
7.5
EVALUATION WORKSHEET
95
97
99
101
7.5.1
C A L C U L A T I O N S O N T H E T H R E E T A B L E S IN T H E E V A L U A T I O N S H E E T
103
7.5.2
TABLE CONTENT PULL-DOWN MENU
106
7.5.3
D A T A FOR S T A N D A R D C U R V E
108
7.6
SAMPLE IDS WORKSHEET
110
7.7
STANDARD CURVE WORKSHEET
111
7.8
RESULT LIST WORKSHEET
114
7.9
PROTOCOL SETTINGS WORKSHEET
116
8
KNOWN PROBLEMS AND SOLUTIONS
117
8.1
ERROR: 'CANNOT OPEN DATA PATH'
8.2
E R R O R 429 ' A C T I V E X C O M P O N E N T C A N ' T C R E A T E O B J E C T O R RETURN R E F E R E N C E TO T H I S
117
OBJECT1
117
8.3
E R R O R 1004
8.4
E R R O R 40009 'No C U R R E N T R O W '
118
8.5
DISABLED PLATE IN / O U T BUTTONS
118
8.6
A C C E S S R I G H T S U N D E R W I N D O W S NT / 2000 / XP
119
8.6.1
8.6.2
8.7
9
4/123
'VBA
INITIALIZATION FAILED'
118
FILE A C C E S S PERMISSIONS
119
REGISTRY A C C E S S
121
RUN LOG WINDOW
122
SUPPORT
123
0413F0003A
2002-11-15
BMG Labtechnologies
FLUOstar* OPTIMA Software User Manual
1 Installation
1.1 System Requirements
•
•
•
•
•
•
Computer with Pentium CPU (we recommend Intel Pentium III or higher with at least
500 MHz clock rate)
Minimum 128 MB RAM (we recommend 256 MB or higher, especially when you are
using Windows 2000 or XP)
One free serial communication port
20 MB free hard disk memory for software installation
Microsoft Windows 98 / ME or Windows NT / 2000 / XP
Excel 97 / 2000 / XP for data reduction
1.2 A version of FLUOstar OPTIMA Software is already installed
Please go to section 1.3: Software Installation if there is not a previously installed version
of the FLUOstar OPTIMA software.
Before installing a new FLUOstar OPTIMA software version over an existing version you
should export your test protocols and microplate definitions (if any changes are made) and
export your measurement data. It is possible to re-import these files into the new software
version after installation. Write down the filter settings.
You will find the export function in the test selection window (Test Setup | Test Protocol'
for test protocols. Select all the definitions you would like to export and click the 'Export'
button.
To export measurement data of already performed test runs start the evaluation part of the
FLUOstar OPTIMA software. The export function is in the FLUOstar OPTIMA pull-down
menu at the top of the Excel window ('Export Test Runs'). After the installation of the new
software, use the 'Import' function to bring the test protocols and test runs into the new
software.
Notes: Do not try to copy the data or definition folder in Windows Explorer and attempt to
paste it into the new user folder. This could result in the loss of your previous data
due to possible changes in the data format.
For complete removal of an old software version see chapter 1.4. A de-installation
of a former version is in general not necessary, you can install the new version
direct over an existing version.
The database format for microplate definitions and the filter database has not been
changed since version 1.10-0, therefore it is possible to perform a custom installation
without "Microplate Definitions" and "Filter Table" to keep your definitions when upgrading
from version 1.10-0.
The format for test protocols and for the measurement results database has
changed with version 1.20-0. Therefore, you should not deselect the groups
"Test Protocols" and "Measurement Data" during the first installation of
FLUOstar OPTIMA V1.2x-x.
2002-11-15
0413F0003A
5/123
FLUOstar*'OPTIMA
Software User Manual
BMG Labtechnologies
1.3 Software Installation
The software needs to be installed in the following order:
1. Excel
2. FLUOstar OPTIMA - Control
3. FLUOstar OPTIMA - Evaluation
Please follow the next set of instructions carefully to ensure proper installation of the
software.
1.3.1 Excel Installation
The Excel software should be installed prior to the FLUOstar OPTIMA software. There are
certain components that must be included in the installation. If Excel 97, Excel 2000 or
Excel XP has not been previously installed, follow the instructions below for complete
installation. If Excel 97 is already installed, follow the instructions below to ensure the
necessary components have been installed.
•
Complete installation of Excel 97 / 2000 / XP
-
Start the Office 97 / 2000 / XP or Excel 97 / 2000 / XP installation program.
-
Choose Custom or Complete Installation - this option installs all Excel components.
Be sure that all components are ticked (you can be sure of this if click on select all).
-
The Excel wizard will ask for the directory. The default directory is ~:\Program
Files\Microsoft Office.
If an older version of Excel already exists, a new directory should be created to prevent
a conflict between the two Excel versions.
-
Click on'OK'to install.
•
If Excel 97 already exists on the PC
-
Start the Office or Excel installation program.
-
Choose add/remove components.
-
In the section Microsoft Excel Program files select 'Change option' | 'Add-ins' | 'Change
option' | select: 'Solver and analysis tool pack' | press 'OK'.
-
Than choose: 'Data Access' | 'Change Options' | select 'Data Access Objects for Visual
Basic' | select: 'Data Base Driver' | 'Change Option' | select: 'AH' | press 'OK'.
A standard installation of Excel 2000 / XP should contain all necessary parts (This might
not be true for small business editions.).
Note:
6/123
Excel installation should be prior to the FLUOstar OPTIMA software installation or
run time errors can occur. If it is ever necessary to reinstall Excel it can be
necessary to reinstall the FLUOstar OPTIMA software. Therefore, important data
and definitions should be saved on a diskette or another directory prior to
reinstallation.
0413F0003A
2002-11-15
FLUOstarhOPTIMA
BMG Labtechnologies
Software User Manual
1.3.2 FLUOstar OPTIMA Software Installation
There are two parts to the FLUOstar OPTIMA software: the Control part and the
Evaluation part. Control setup installs the software necessary for configuring the
instrument, for setting up test parameters and for executing measurement procedures.
Evaluation setup installs the data reduction program (Excel macros). In a few words: the
control part is used to get the results and the evaluation part to look at them.
Place the CD into the CD ROM drive. This should start the program automatically, but if
CD auto start is disabled, then execute the program 'Start' from the CD drive. An
installation directory will appear:
Note:
If you are using Windows NT, Windows 2000 or Windows XP, it is necessary that
the installation is performed by a user with administrative rights.
2002-11-15
0413F0003A
7/123
BMG Labtechnologies
FLUOstar* OPTIMA Software User Manual
1. Control Part - Installation
Click on 'Install Control Part' and follow the instructions from the installation wizard.
Setup type
-Click thetype of Setup you prefer, then dick the Next button.
<? &IH installation
The program will be installed with all options.
Warning! All existing Test and Microplate definitions,
the User Data Base and the Filter Table will be
overwritten.
r
Custom Installation
Youmay choose the options you want to install.
Recommended foj* advanced users,
Ad9 prpgrafrf ehtrtf In start program menu for all users
C ^ t e J o f current user's menu)
| 7 Program should be usable also for non power users
(This involves changes in BMQ Labtechnologies registry key and
file access permissions. For details see software manual.)
| 7 Add'a short cut onto the desktop
<t Previous
j
Next>
X Cancel
You can choose either Full Installation or Custom Installation:
•
Full installation will install the programs with all options. This is the installation option
recommended for most users.
•
Custom installation allows you to choose the options you want to install and is
recommended for advanced users.
If you perform the installation as an user with administrative rights (using Windows NT /
2000 / XP), you can choose whether you want to get the start menu entry in the section
for all users or in the section for the current user only.
You may also decide whether the program should be usable also for non power users.
If you do not check this box, the program might not be usable for non-power users
(depending on the operating system or the current setting of the system policies on your
computer: beginning with Windows 2000 Microsoft changed the default access
permissions for some registry keys and newly installed program files in a way that a non
power user is, by default, not able to use nearly any newly installed program either than
some Microsoft certified programs). When you use this option, the access permission is
changed for the BMG Labtechnologies registry keys and files to enable program usage for
all users. For more information about access rights see chapter 8.6.
8/123
0413F0003A
2002-11-15
BMG Labtechnologies
FLUOstar*OPTIMA
Software User Manual
Custom Installation
If you use the custom installation mode, the next window displays a list of the components
that can be installed during the setup.
Select components to install
Select the components you want to install, clear the components
you do not want to install.
3T
Executables & DLLs
Program Data
j
Microplate Definitions
J5|j Test Protocols
Jsl User Database
7.3 MB
0.1 MB
0.0 MB
0.0 MB
0.1 MB
0.0 MB
Description
You can deselect this group when you upgrade and
want to keep the Filter information.
\,
Space Required:
Space Available:
SC
0.2 MB
SD
16.1 MB
439.5 MB
8,729.4 MB
zl
j-Destination Directory
< Previous
Next>
Cancel
By selecting an item with a single mouse click, you can obtain a description of the
individual software component. You can then decide if this feature needs to be installed.
Backup files
The installation program will create a backup of the existing test protocols, the user
database, the filter table, microplate definitions and measurement data when performing
an upgrade. At the end of the installation procedure there will be a window telling you
where to find the backup files.
2002-11-15
0413F0003A
9/123
FLU'Ostar*OPTIMA
BMG Labtechnologies
Software User Manual
Setup complete
The softwawttKbeen properly Installed. You may start the
software by clicking on the icon.
The following backups of existing data have been created:
-Filter Table:
;
lest
- User Database:
D:\Pwgr3mme\eMGVLUDoptima\StBmm_Bsckup_20D21015\
Please see the software manual for information about how to use these
backup files.
Finish
As long as the database format has not been changed (see chapter 1.2) it is possible to
copy the backup files back to their original directory (in case you want restore previous
data). But if there has been a format change, you can only use the backup files after reinstalling the old program version.
2. Evaluation Part - Installation
After installation of the control software, the main menu will reappear. Click on 'Install
Evaluation Part' and follow the instructions of the installation wizard to install the data
reduction software (the installation procedure and options are similar to the control part
installation, see above).
When the evaluation software in Excel is opened for the first time, the following screen
might appear:
Microsoft Excel
Thewori
Some macros may
IF you are sure thte wofMjook is
'Enable Macros', J ^ k f a r a f l s ( * £ a r ^ p £ t
any macros from r^r^jcMc'Dtsatite Macros'.
P Always ask before opening workbooks with macros
i
U
- £nablc Macros
|
Do Not Open
|
Then click on 'Enable Macros'. The macros are safe for the computer.
There are several bugs associated with Microsoft programs that effect
the FLUOstar OPTIMA software. If error messages appear when the
FLUOstar OPTIMA software is opened for the first time, please refer to
chapter 7 of this manual for bug fixes.
10/123
0413F0003A
2002-11-15
FLUOstar1'OPTIMA
BMG Labtechnologies
Software User Manual
1.4 Uninstalling the FLUOstar OPTIMA Software
An uninstall program has been included in the software package which allows you to
delete all components of the FLUOstar OPTIMA software in the registry.
Select'Start | Settings | Control Panel | Add/Remove Software'.
Select FLUOstar OPTIMA' and click on Remove'. In the Remove FLUOstar OPTIMA'
window, click on 'Start'.
A Remove FLUOstar OPTIMA
mmm
H H H H H H H H H | | To remove the software from your computer , click th^Start
^ ^ ^ ^ ^ ^ ^ ^ ^ ^ ^ H button below.
^ ^ ^ ^ j ^ ^
^^^H
Aliases
pWH^vf'j H ^ H
ActiveX/OCX components
^^^^^HH^^^I
IMI f le
^^BEKH^I
^^^HH^^^^^H
' entries
BDE
Registry entries
|
2002-11-15
0413F0003A
Start
;
? Close
1
11/123
FLUOstar1'OPTIMA
BMG Labtechnologies
Software User Manual
2 Control Software Overview
2.1 Login Screen
When the software is opened, a login screen appears (The Login Screen function can be
switched off, see chapter 3.3 Program Configuration). You can enter a user name, a
password and a directory path to your personal user folder. This feature allows more than
one user to perform test runs on one PC. The data and test protocols are stored in an
individual user folder. The user can also edit test parameters and some evaluation
features without the changes applying to all users.
FLUOstar'
tfaer
IBIS (a
Directory
I Password!
J- . . Cancel' ]
| Run OnlyLd
Em
1
Exit
| _ Help
1
For logging in as the standard user 'USER', by default no password is necessary.
The initial administrator password is 'bmg'. When the password is entered, the
Administrator buttons will become available and new users can be created or changes
for existing user entries can be made (see next page).
Run Only
If this field is checked, the respective user is only able to start pre-defined test protocols.
The user can perform a gain adjustment and enter plate / sample IDs, but can not change
or delete an existing test protocol or copy / import protocols or create new protocols.
Changing offset or filter values or microplate definitions is also not possible for this type of
user.
The Run Only property can only be set / unset by the administrator. When using this
option, it is strongly recommended to select Run Only also for the default user 'USER' (or
to define a password for this account) and to change the administrator password to
something other than 'bmg'.
Note:
12/123
Instead of setting / unsetting this option every time a protocol change is necessary,
you can also create two user entries using the same directory, one of these entries
with Run Only option and the other one without this option.
0413F0003A
2002-11-15
FLUOstar1" OPTIMA Software User Manual
BMG Labtechnologies
New / Save
Click on 'New' and enter the user name and desired password. Select the directory for the
user's data and test protocols. For directory options, click on the far right side under
'Directory' and a button appears [...]. After clicking this button, a user path dialog box
appears where you can select the drive, directory, etc (see section 3.6). After the
information is entered, click on 'Save' and the information is stored in the user data base.
When the information is saved, two new folders are automatically created in the new user's
directory: one for storing test protocols and one for storing data (see User Directories
below).
Delete
When an existing user entry needs to be deleted, highlight this entry and click 'Delete'.
Cancel
If you click 'Cancel' without clicking 'Save', all changes made after the last save will be
discarded.
W
Run
After clicking 'Run', the FLUOstar OPTIMA software will start using the test protocol and
measurement results paths of the selected user. For all users other than the default user
'USER', you need to enter the password first.
Mote;
Exporting the user table into a XLS (Excel), text or HTML file is possible after right
clicking on the table. The passwords will only be visible when the export function is
used by the administrator.
2.1.1 User Directories
After the initial login for a new user, two directories will be automatically created:
<Username>
Data
Definit
Definit:
The test protocols are stored in this directory.
Data:
The measurement data is stored in this directory. You will find here
'<number>.dbf (raw data) files and the file 'Measure.dbf (test runs overview file).
It is possible, at any time, to redirect the path of the data and to store the information in
another directory. You can do this in the FLUOstar OPTIMA control software by selecting
'Setup' and then 'Path' or 'Login' (see also Path and Login section 3.4).
2002-11-15
0413F0003A
13/123
FLUOstar*OPTIMA
BMG Labtechnologies
Software User Manual
2.2 Main Screen
After logging on, the main screen for the control software opens. An information screen
appears in the middle containing details of the software and firmware versions.
Note:
Write down the software version and firmware version so it is easily accessible if
you need technical support. You can also retrieve this information by selecting
'Help' and About FLUOstar OPTIMA' in the main menu.
FLUOstar'
Setup
Jest Setup
Measure
Results
Help
Test durahon
©2001-2002 BMG Labtechnologies
FLUOstar*
OPTIMA
Reader Serial No 413-0001
Software Version 1.20-0 Firmware Version 1.10-0
IMode*. Polarization
[User: USER
^ 3 |Path: D:\ProflfammeSBMGSFLUQoptirna\UserSDala
The status bar at the bottom of the main screen shows the currently selected reading
mode, the user logged in and the path used for storing the measurement results. You can
change these settings by clicking the respective field of the status bar.
The little icon in the user field shows whether the user is allowed to change test protocols
E3 or if he is only allowed to run pre defined protocols ^ 3 ('Run Only' mode).
14/123
0413F0003A
2002-11-15
BMG Labtechnologies
FLUOstar*OPTIMA
Software User Manual
2.3 Icons and Menu Commands
The main menu is displayed across the top of the screen. Click the item to display the pulldown menu for additional options. You can also use the corresponding buttons of the tool
bar that perform the same functions as the main menu items. The instrument must be
turned on and connected for certain functions to be available.
\\-± FLUOstarK OPTIMA
Setup '-TesfSetupv Measure
BMG Labtecfmoto&es H I S 13
JResults
Help
Test duration
Menu command
Icon
Function
Setup |...
Menu for configuring the instrument and
program settings. Select the measurement
mode (reader configuration), filters, change
offsets values and select a directory for
measurement data.
Setup |
Program Configuration
Changes program behavior, define options for
ASCII export.
Setup | Exit
Exits FLUOstar OPTIMA control software.
Test Setup | Test Protocol
Defines the test parameters - e.g. number of
flashes, intervals / cycles, content of the wells
in the microplate, standard concentrations,
injection volumes and times, etc.
2002-11-15
0413F0003A
15/123
FLUOstar*OPTIMA
BMG Labtechnologies
Software User Manual
Menu command
Measure | Plate Out
Measure | Plate In
Function
Icon
w|
Moves microplate carrier out of the instrument.
M
Moves microplate carrier into the instrument.
Measure | Measure
Performs a measurement using a pre-defined
test protocol. Before the measurement starts,
you can enter plate IDs and perform a
automatic gain adjustment.
Measure |
Pause after current Cycle
Stops the active test run after finishing the
current cycle (only available for plate mode
tests).
Measure | Stop Test Run
Stops the active test run.
Measure | Prime
Prepares the pumps for injection, if pumps are
installed. Define pump speed.
Measure | Temperature
Defines the temperature of the incubator.
Results | Excel
Opens the evaluation software for data
reduction. Test runs / raw data are
automatically stored in an Excel template.
Help | Contents
Opens the online help.
Help | Contact Addresses
Shows BMG's contact addresses.
Help | BMG Web Page
Starts an internet browser and makes a
connection to the BMG web page.
Help|
About FLUOstar OPTIMA
Help | System Information
16/123
-
Shows the software and firmware (reader
EPROM) version.
Shows information about the operating
system, the CPU speed, the current Excel
version and the amount of memory.
0413F0003A
2002-11-15
BMG Labtechnologies
FLUOstar*OPTIMA
Software User Manual
3 Setup
3.1 Instrument Setup
The configuration settings for the instrument include the reading mode, communication
port, filter definitions, instrument offsets, definition of microplates and the data path.
You can use the 'Setup' pull-down menu
§ § 2 B I e s t Setup
Measure
Reader Configuration
Connection
Filters
Reader Offset
Microplates
Firmware IJpdate
Program Configuration
Login
Ctrl+L
Path
Exit
or the
button.
3.1.1 Reader Configuration
The FLUOstar OPTIMA can measure fluorescence intensity and time-resolved
fluorescence and (optional) absorbance and luminescence. In addition, the POLARstar
OPTIMA can read in fluorescence polarization mode. Using the 'Setup | Reader
Configuration' function, you can designate the measurement procedure.
Reader Configuration
<•" jFiyorescence Intensity and time-Resolved Fluorescencej
C
Absorbance
C
Luminescence
C
Fluorescence Polarization
OK
2002-11-15
Cancel
0413F0003A
Help
17/123
FLUOstar*OPTIMA
BMG Labtechnologies
Software User Manual
3.1.2 Connection
You must select the corresponding communication port on the PC and check the
communication status between the instrument and the PC. You can only select com ports
which are available on the PC. If there is no communication between the PC and the
instrument, check that the power to the instrument is switched on. If there is still no
communication, try a different com port.
iI
| Connection
r'tsm •-*?
COM2 1* COM3 <"" COM4
r
C0M5
r
CDMG
r
:OM?
[
ncHeck
r C0M8 r COM3
Cancel
Help
1
Connection check allows you to validate communication between the PC and the
instrument. If there is no communication, a message box will appear:
18/123
0413F0003A
2002-11-15
FLUOstar* OPTIMA Software User Manual
BMG Labtechnologies
3.1.3 Filters
The FLUOstar OPTIMA can be configured with up to 8 excitation filters and up to 8
emission filters. The position in the table should correspond to the filter position in the filter
wheel. Click on 'Setup' and 'Filters' and enter the filter wavelength values in the
corresponding spaces. An empty position should be named on the emission side for the
luminescence and absorbance mode.
Note:
The table is common to all users.
D Qear | [^Standard | ^
Position | Excitation
Load | H^ Save|
{Emission
1
355
2
544
!590
3
485
!520
4
584
J612
5
A-405
6
A-450
7
A-492
8
A-620
OK
460
lens
Cancel
Help
Clear
After clicking this button, the table contents will be removed.
Standard
After clicking this button, standard filter values (see figure) will automatically
be entered into the table.
Load
Loads filter information from an ASCII or Excel (.xls) file into the table. This
might be useful if you are using more than one set of filter wheels.
Save
Saves filter information from the table into an ASCII or Excel (.xls) file.
OK
Saves the filter positions and returns to the main menu.
Cancel
Closes this window without saving changes.
Note:
Users with activated 'Run Only' option (see 2.1 Login Screen) are not allowed to
change the filter settings.
2002-11-15
0413F0003A
19/123
FLUOstar* OPTIMA Software User Manual
BMG Labtechnologies
Available Filters
BMG Standard Filters
Excitation and emission filters are optimized in pairs. Transmission profiles of the standard
filters are not symmetrical, and excitation and emission filters are not interchangeable.
Excitation
Wavelength
Emission
Wavelength
Absorbance
Wavelength
320 nm
405 nm
405 nm
355 nm
460 nm
450 nm
492 nm
390 nm
485 nm
520 nm
540 nm
515 nm
555 nm
580 nm
544 nm
590 nm
590 nm
584 nm
612 nm
595 nm
TR-EX, time-resolved
5 4 5 n m , Terbium
620 nm
6 1 5 n m , Europium
6 6 5 nm, Samarium
Customized filters
Additionally BMG Labtechnologies has special made filters with a bandwidth of 10 nm (± 5
nm) on stock. These filters are available for every 10 nm from 330 to 680 nm. BMG-10 nm
filters are symmetrical and can, therefore, be used both in the excitation and in the
emission position. The stokes shift should be at least 40 nm. Indicate wavelength with the
last three digits in the part number e.g. part number 010-340 for BMG340-10 nm filter.
Upon request, special filters can be custom made (specify wavelength and bandwidth).
20/123
0413F0003A
2002-11-15
BMG Labtechnologies
FLUOstar*
OPTIMA
Software User Manual
3.1.4 Reader Offsets
w
Every FLUOstar OPTIMA is accurately calibrated at the factory and has individually
defined offset values. The offset values correspond to the home position of the microplate
carrier. Correct offset values are important for optimal measurement results. The offset
values are stored in the reader EEPROM. The determination of the offset values should be
carried out only by a qualified service technician. If the plate carrier is removed or
replaced, the offset values should be re-calibrated.
The Reader Offsets screen can be reached by selecting 'Reader Offset' in the 'Setup'
menu.
Reader Offsets
Password:
Offset*:
Offset determination
Offset Y:
33
OK
Cancel
Help
The password to enable changes of the offset values is 'bmg'.
You can now enter new values. Do not perform an 'Offset determination' unless you are
qualified to do so!
The ^Wl button will move the plate carrier to the defined offset position.
The 'Offset determination' button is for service personnel only.
Click on 'OK' to save the offset values into the reader EEPROM.
Note:
Users with activated 'Run Only' option (see 2.1 Login Screen) are not allowed to
change offset values.
2002-11-15
0413F0003A
21/123
FLUOstar*OPTIMA
BMG Labtechnologies
Software User Manual
3.1.5 Microplates
The FLUOstar OPTIMA software contains a data base with dimensions of microplates
from most microplate manufacturers. While most plates have the standard spacing and
footprint, some plates have slightly different dimensions, and must be positioned
accordingly for optimal results.
In addition, new plates that are not on the current list can easily be defined by selecting
'Setup | Microplates'. If microplate dimensions are edited, the changes will apply to all
users.
Microplates
Mtcmplate
127.80
85.50
15.50
15.00
108.60
70.60
CO STAR 3548 48
127.70
85.40
18.00
9.90
109.70
75.50
:
127.80
85.60
18 70
10.50
109.20
75.20
-
127.60
85.60;
16.60
85 50 j
14 40 j
FALCON 3078 TISSUE CULT. PL48
* NUNC 150687 MULTIDISH 48
•
R(i);|'V(1)J X(n) | Y(n)| Rate Format L±J
|Lwg1fr
TPP24
K B M G L*iBTECHNOLOGIES 96
CORNING 25860 96
* CORNING 25880 96
-. COSTAR369596
; 128 00
;
9.00;
111.10
11 20; 11360!
24
48
48
76.50
48
I
74.30
96
i|||
127.60
85.50
14.40
11.20
113.20!
74.20
96
127.60
85.50
14.40
11.20
113.20
74.20
127.90
85.60
14.40
11.20
113.50
74.40
CYTOPLATE96
127.50
85.80
14.30
11.40
113.20
74.10
DYNATECH 96
128.00
85.80
14.40
11.20
113.60
74.10
DYNEX 6903 MICROFLUR 1 96
128.00
85.80
14.40
11.20
113.60
74.10
DYNEX 7521 MICROUTE TM 1 + 96
128.00
85.80
14.40
11.20
113.60
74.10
DYNEX 7571 MICROUTE TM + 96
128.00
85.80
14.40
11.20
113.60
74.10
96
96
96
96
96
96
96
FALCON 3072 96
127.60
85.80
14.30
11.40
113.40
74.40
96
•••••;i--
jjQpoft
I
Delete
|
Dose
|
^i
Help
. |
To select the first microplate, beginning with e.g. 'B', simply press the key [B]. To select
more than one microplate, press [Shift] together with [ t ] or [I] or press [Ctrl] and click on
the desired microplate names with the left mouse button.
New
Click on 'New' to enter the plate dimensions for a new plate. A new window will appear
that allows you to enter the necessary coordinates. Enter the plate format (well number)
and the mechanical dimensions of the microplate (see Edit below).
Note:
The dimensions should be measured from the center of the wells and need to be
very accurate in order for the wells to be positioned exactly during measurements.
Edit
Select a microplate entry that you want to modify. A second window appears that displays
the dimensions and plate format. All dimensions are in mm.
22/123
0413F0003A
2002-11-15
BMG Labtechnologies
FLUOstar*OPTIMA
Software User Manual
Microplate
Name:
|iaBMBaaiai:igiMiBmaia8BB
Plate format:
[9G
]*]
fi: •••ooooooooooo
Plate dimensions:
Length [O...134mm]: J12&00
Width [0...90mm]: | 85.50
Top left
X{1): | 14.40
l o p left
Y(1]: j 11.20
Bottomright
X(n): J113.60
Bottom right
Y{n): I 74.30
oooooooooooo
oooooooooooo
oooooooooooo
oooooooooooo
oooooooooooo
oooooooooooo
oooooooooooo
pi
OK
Cancel
Help
Name
Name of the new microplate
Plate
Format
Select the total number of wells in the plate - 1536, 384, 96, 48, 24,
12 or 6 wells.
Length
The outer length of the entire microplate, from border to border.
Width
Outer width of entire microplate, from top to bottom.
X(1)
Distance from the center of the upper left well to the left border of
the microplate.
Y(1)
Distance from the center of the upper left well to the top border of
the microplate.
X(n)
Distance from the center of the lower right well to the left border of
the microplate.
Y(n)
Distance from the center of the lower right well to the top border of
the microplate.
Copy
Select a microplate that you want to copy. A window will appear allowing you to rename
the microplate. The dimensions are copied exactly. This option allows you to edit a
microplate's dimensions without changing the original.
Export
Select a microplate definition that you want to export to a disk or to a different directory. A
new window will ask for the destination drive and directory. The file name will get an
extension '.MPL\
Import
Imports microplate definition from a disk or another directory and adds it to the existing
data base. The extension for the microplate file must be '.MPL'.
2002-11-15
0413F0003A
23/123
FLUOstarhOPTIMA
Software User Manual
BMG Labtechnologies
Delete
Deletes an existing microplate and its dimensions from the data base.
Close
Returns to main menu.
Notes: Exporting the microplate table into a XLS (Excel), text or HTML file is possible
after right clicking the table.
Users with activated 'Run Only' option (see 2.1 Login Screen) are not allowed to
edit, copy or import microplate definitions.
24/123
0413F0003A
2002-11-15
FLUOstar1'OPTIMA
BMG Labtechnologies
Software User Manual
3.2 Firmware Update
This function allows you to update the reader firmware (content of the built in FlashEPROM).
Firmware Update
Password:
Firmware file:
tar OPTIMA\Firmware\FLUOstar OPTIMA 1.00-0.H8G
Download
Close
Help
If you received a new firmware file from BMG, you should copy this file into the folder
-AProgram Files\BMG\FLUOoptima\Firmware.
Make sure that the reader is connected to the computer and switched on. After typing in
the correct password (you will get the password with the new firmware) select the firmware
file using the J=l] button, then press 'Download1. The FLUOstar OPTIMA program will bring
the reader into the download mode and then start the download program 'FlashTools'.
Downloading the new firmware is an automatic process, which will last a few minutes. Do
not interrupt this process by switching the reader or the computer off or by closing the
download program!
After the download is completed, the 'FlashTools' program will close automatically. Then
the FLUOstar OPTIMA needs to be switched off and on again to activate the new
firmware.
If the download process is interrupted, the FLUOstar OPTIMA will not work, but even in
this state it is possible to repeat the download process (you need to restart the FLUOstar
OPTIMA software after an interrupted download process).
2002-11-15
0413F0003A
25/123
BMG Labtechnologies
FLUOstar* OPTIMA Software User Manual
3.3 Program Configuration
Program Configuration allows the user to modify the appearance of the software. You can
activate a feature by ticking the box next to the statement.
3.3.1 Preferences Sheet
In the first sheet you can select how the measurement data should be stored. Here you
can also define some general program behavior settings.
Progiam Configuration
Preferences I View I
Define format
|7
| 7 £ave measurement data in dBase format (necessary for BMG's evaluation program]
P
geOirntoseiopkWwiridGto^:^^
testprdtdcds
17 fitfep a[ter:ftnfsn1n9<a test tun
V
Confirm program fexft
)K.._
O
K J
Cancel
|
Help
|
Save Measurement Data in ASCII Format
All measurement data is saved in the specified user directory, e.g. '~:\Program Files\BMG\
FLUOoptima\<Usemame>\Data'. The data is saved in a dbase file format that can be used
with the macros in the evaluation software. If you would rather use a different evaluation
software package, which will not work with dbase formats, then it is also possible to store
the data in ASCII format. If you select this option then the 'Define Format for ASCII
Export' window becomes available (see chapter 3.3.3).
Save Measurement Data in dBase Format
If this option is selected, all measurement data is stored in a set of dbase files in the data
directory of the user logged in. The data is saved in a dbase file format that can be used
with the macros in the evaluation software. If you would rather use a different evaluation
software package, which will not work with dbase formats, then it is possible to get an
ASCII file (see above).
Note:
It is possible to use both formats simultaneously.
Return to selection window after editing microplates or test protocols
The selection window for tests and microplates contains previously defined setups and
options to edit, export, import, etc.. By default, you can return to the main control software
after creating or editing a test or microplate definition without returning to the selection
window. If you wish to see the selection window for the microplates or test protocol
definitions again, check the box in the 'Program Configuration' window.
26/123
0413F0003A
2002-11-15
BMG Labtechnologies
FLUOstar^OPTIMA
Software User Manual
Auto Login
If you choose the option 'Automatically login as user "USER" at program start' there will be
no login screen at program start, instead you will be logged in as the default user 'USER'.
It is still possible to use the login function later ('Setup | Login').
Beep after finishing a test run
If you select this option there will be a short acoustic signal after a test run is finished.
Confirm program exit
If you deselect this option there will be no confirmation window when exiting the program.
2002-11-15
0413F0003A
27/123
FLUOstar*OPTIMA
Software User Manual
BMG Labtechnologies
3.3.2 View Sheet
Using this sheet you can change the program look.
Program Configuration
Gaelic
White marble
Green marble
Brown marble
Red marble
Caneel
I
Hefp
I
Use Color Gradient in Title Bar
The border or title bar at the top of the software can be either a solid color or a gradient
from dark to light. This is only for appearance and does not affect any other feature of the
software.
Note:
In Windows 98, 2000 or XP, you define the title bar style using the windows control
panel. Therefore, this option will be grayed out.
Speed bar background
It is possible to define the style of the speed bar. Choose any of the pre defined
background styles or use one of your own bitmap files (BMP-, GIF-, JPEG format).
Main window background
Similar to the speed bar it is also possible to define the background of the main program
window. Choose any of the pre defined background styles or use one of your own bitmap
files.
Note:
28/123
All settings from the program configuration window besides the Auto Login option
are user specific, therefore each user can select his preferences independently.
0413F0003A
2002-11-15
FLUOstar*OPTIMA
BMG Labtechnologies
Software User Manual
3.3.3 ASCII Export Function
If you click the 'Define format' button in the 'Program Configuration' window (see chapter
3.3.1) the 'Define Format for ASCII Export' window will appear. In this window, you can
choose the name and format of the file and where the data is saved.
Define Format for ASCII Export
Filename and Path I Format I
Directory:
Filename:
|\\Bmgg1 p1 \SeidelSASCIIdata
<testname>_Plate_<1 +ptt>.dat
Jf file exists: j rename old file by adding date/time
£ackup:
Directory:
j C:\backup
No. of executed runs: ]12
OK
Cancel
File
Directory
The data path where the ASCII files will be stored. This can be a network directory, too.
Filename:
The file name can be the test name or one of the following options given in the drop down
menu:
•
<protocol>
Name of the used test protocol.
•
<ID1>...<ID3> The information written in the plate identification window before the
measurement begins.
Tests will be assigned consecutive numbers. When the FLUOstar
OPTIMA software is restarted the numbers begin again with T . You
can change the start number; for example, enter the number 5 and the
test numbers will increase consecutively starting at 5.
You can add a '#' character in order to increase the number of digits
used. (<1+###> will produce file names 001, 002, 003, etc.)
If you want a number to be changed only after e.g. every tenths plate
you should add this value in parenthesis before the > character, e.g.
To use the Total no. of executed runs' instead of the number of
executed runs after program start add a T before the '#', e.g.
<1+!####>.
2002-11-15
0413F0003A
29/123
FLUOstar*OPTIMA
Software User Manual
BMG Labtechnologies
To use the 'No. of executed runs for the used protocol (used test
definition)' add a 'P' before the '#', e.g. <1+P##>. You can see a Run
Statistics after pressing the -SJ button.
Counting down is also possible, use a '-' instead of the '+'.
•
<A+#>
Identical to consecutive numbers except now the file name will be
consecutive alphabetical letters. The number of letters used can be
modified (i.e. <A+###> will result in AAA, AAB, AAC, etc).
•
<date>
insert current date
You can specify the date format if you add a format description after
"<date:" using yy or yyyy for the year, m or mm for the month and d or
dd for the day:
yy
yyyy
m
mm
mmm
mmmm
d
dd
ddd
dddd
ddddd
dddddd
year with two digits (1999 => 99, 2000 => 00)
with four digits
one or two digits for the month (January => 1, December
=>12)
month with two digits (January => 01)
abbreviated name of the month (January => Jan.)
full name of the month
day with one or two digits
day always with two digits
abbreviated name of the day (Monday => Mo.)
full name of the day
date in the format defined as "Short Date Format" under
windows ('Settings | Control Panel | Regional Settings')
date in the format defined as "Long Date Format" under
vear
windows
Example:
•
<time>
<date:yyyy_mm_dd>
If you do not specify the format "yyyymmdd" will be used.
insert current time
You can specify the time format if you add a format description after
h or hh
m or mm
s or ss
t
for the hour (one or always two digits)
for the minute
for the second
time in the format defined as "Short Time Format" under
windows ('Settings | Control Panel | Regional Settings')
tt
time in the format defined as "Long Time Format" under
windows
am/pm or a/p or AM/PM or Am/Pm use 12 hours format and show am
or pm (a or p...)
Example:
<time:hh.mm.ss>
If you do not specify the format "hhmmss" will be used.
30/123
0413F0003A
2002-11-15
BMG Labtechnologies
FLUOstar*OPTIMA
Software User Manual
You can use more than one of these parameters at one time in the filename (example:
<protocol> plate <1+###>.dat). If a file extension is not specified then '.DAT' will be added
automatically.
If file exists:
If a file with the same name already exists, then there are several options:
•
Rename the old file by adding date and time to distinguish it from the more recent
file.
•
Overwrite old file.
•
Append the new data to the existing file (it will list separate tests in the same file;
each test is separated by a dashed line).
Backup
Here you can choose what to do if the data storage to the above defined directory fails:
•
no backup file
Show an error message when creation / writing into the defined ASCII file failed. The
measurement results are still available in the database files (dBase format, for usage
with e.g. Excel).
•
create backup file only if main file writing fails
If creation / writing into the defined ASCII file failed the ASCII file will be stored in the
specified backup directory (same filename and behavior if file already exists as defined
above). If writing into the backup file fails too, then there will be an error message. This
setting is recommended if the main directory is on a network drive.
•
always create backup file
The ASCII file will be stored in the specified main directory. A second copy will be
stored in the backup directory (same filename and behavior if file already exists as
defined above). There will be no error message when writing into the main file failed.
But there will be an error message if writing into the backup file fails.
•
always create backup file (no error message when this fails)
The ASCII file will be stored in the specified main directory. A second copy will be
stored in the backup directory (same filename and behavior if file already exists as
defined above). There will be no error message when writing into the main and/or
backup file failed.
Directory
Specify the directory for storing the backup copy of the ASCII file.
2002-11-15
0413F0003A
31/123
FLUOstar*OPTIMA
BMG Labtechnologies
Software User Manual
Data Format
On the second sheet ('Format'), you can specify the data format:
Define Format for ASCII Export
Filename and Path Format |
r DateFcmat
Style:
J Table with well numbers, only measured wells
" NuflFibefJorirtat: |tt8880m
Hbn measured w)S$:
Seaderc
| Long header
J
P Use average ofl-all-blanR^r?om all groups for blank-correction (if groups are used)
EdaTization toste: |ctore polarization valuer [mP]
No. of executed juns: 12
^j
Cancel
Help
Style
The data can appear as a table (raw data side by side in a matrix) or a column (list). You
can select the following options from the pull-down menu:
•
List the data with the well number included.
•
Include or exclude non-measured wells.
Tests that have more than one cycle will have data blocks representing the results from
each cycle. Multichromatic measurements will appear with the data from the first filter set,
followed by the data from the second filter set, etc.
If you choose the option 'List sorted by wells', you will get the measurement results for all
cycles in one line per well, but if your test contains more than one filter setting, you will still
get a data block for each filter setting.
Separator
Select how the individual raw data number will be separated: for example, a comma, a
semi colon or back slash. By selecting '#9', a tab step will be used.
Number format
Select the number of digits before and after the decimal point. A position described with a
# symbol will be a number or a space; a position described with a zero will be a number or
a zero.
For absorbance tests, you should specify a format of 0.000 because the OD values can
range from 0.000 to 4.500. By adding a 'm' to the format string (e.g. '###0m') the numbers
will be expressed in milliOD (0 to 4500 mOD).
32/123
0413F0003A
2002-11-15
BMG Labtechnologies
FLUOstar*OPTIMA
Software User Manual
Non-measured wells
Select the appearance of a non-measured well, for example: hyphen (-), backslash (/), or a
zero (0).
Header
It is possible to include a description of the test run.
•
•
•
Short header
Describes the test run in 5 lines (test name, date, plate IDs, number of cycles, and
number of channels).
Long header
Contains the information of the short header but also includes the measurement mode,
layout name, filters and the gain settings.
Danish style
If you use this option there will be no header, but in the first column of every data line
the plate ID1 will be listed. This may be useful, if you combine data from more than one
test run in one ASCII file and search, for example, for the highest result in any well of
all plates. When you have found this result, you not only see the well name, you also
see immediately the plate identification.
Include sample IDs
Store the sample IDs (see 6.3 Sample IDs) also in the ASCII file (after the measurement
value).
Calculation
Store blank corrected values
If this option is selected, the measurement values stored in the ASCII file will be blank
corrected.
Use average of all blanks from all groups for blank correction
This option is only important when different layout groups (see chapter 4.5.1 Using Layout
Groups) are used. If this option is not selected the measurement values of a group will be
corrected using only blanks from the same group. If you select this option, the correction
will be done using the average of all blanks from all groups.
2002-11-15
0413F0003A
33/123
FLUOstar*OPTIMA
Software User Manual
BMG Labtechnologies
Polarization Tests
For polarization tests you can decide whether you want the raw data for both channels to
be stored or the blank corrected polarization or anisotropy values. If you choose the
second option the polarization value will be calculated and stored in mP. In this case and
for anisotropy values (stored in mA) you should use a number format with enough space
for decimal numbers, e.g. '####0.000'.
Polarization values:
p=
Ch1 - k(Ch2)
CM + k(Ch2)
Anisotropy values:
A =
CM - k(Ch2)
CM + 2k(Ch2)
Number of Executed Runs
The 'counter' tracks the number of measurements that were performed after the program
was started. You can manually type in a starting number. This number will be used in the
filename options <1+#> and <A+#>.
To see a Run Statistics press the J U button.
Note:
34/123
All settings from the 'Define Format for ASCII Export' window are user specific,
therefore each user can select his preferences independently.
0413F0003A
2002-11-15
FLUOstar1'OPTIMA
BMG Labtechnologies
Software User Manual
3.3.4 Run Statistics
In this window, you see a list of all used test protocols together with a number showing you
how often a protocol was executed. It is possible to edit these numbers or to delete a
protocol from the list.
Run Statistics
Mo. of runs executed for each test definition:
1536 S ER TEST
48ER TEST
FAST PLATE
FAST TEST
FLUO PLATE
FLUO PLATE TEST
FLUO WELL
H WELL PIP
QC TEST
TOM'S PLATE MODE TST
TOM'S TEST
TOM'S WELL MODE TST
Total no. of executed runs:
Cancel
5
±_
4
7
9
4
95
3
2
24
_
18
9
9
d
42
Help
You can use this number together with the <1+P#> or <A+P#> option for defining the
ASCII export filename or as part of a plate ID.
In this window, you also see the Total no. of executed runs'. This is the total number of
all tests executed using this computer after installing the FLUOstar OPTIMA software.
2002-11-15
0413F0003A
35/123
FLUOstar*OPTIMA
BMG Labtechnologies
Software User Manual
3.4 Login
The login function is described in chapter 2.1 Login Screen.
3.5 Data Path
This window allows you, to temporarily change the directory for your measurement results
to a directory different than the one specified using the Login screen (see chapter 2.1).
This might be useful, for example, to store the measurement results from different
methods in different subdirectories.
User Path
EJirectory:
| D AProgramme\B M G \FLLJ 0optimaUorrAData
| B d : [programme]
OK- ,
|
Cancef
Help
"| Measure. DBF
36/123
0413F0003A
2002-11-15
FLUOstariOPTIMA
BMG Labtechnologies
Software User Manual
4 Defining Protocols
4.1 Protocol Selection Window
To create or edit a protocol click on
menu.
or select Test Protocol' from the Test Setup'
The Test Protocols' window lists all previously defined tests and gives you options for
creating new test protocols or modifying existing protocols.
Test Protocols
Protocol Name
Microplate
Mqde
Config
CATEST
BMG LABTECHNOLOGIES 96
Well
Fluorescence
QCTEST
BMG LABTECHNOLOGIES 96
Plate
Fluorescence
GREINER 781096 384
Plate Fly
Fluorescence
f j TOM S 384 ER TEST
AEQUORIN TEST
INUNCMAXIS0RP96
Well
Luminescence
LUCIFERASE
BMG LABTECHNOLOGIES 96
Well
Luminescence
TOM'S TEST
BMG LABTECHNOLOGIES 96
Plate
i Luminescence
New
Edit
Copy
Export
Import
Delete
Close
Help
The FLUOstar OPTIMA can measure fluorescence intensity and time-resolved
fluorescence and (optional) absorbance and luminescence. In addition, the POLARstar
OPTIMA can read in fluorescence polarization mode. Before defining a new test, it is
necessary to select the correct measurement mode in the 'Setup | Reader
Configuration', see section 3.1.1.
w
Define a new test protocol. See section 4.2.1.
Edit
Modify a previous test protocol. Select the test and click on 'Edit' or double click on the test
name.
Copy
Select the protocol you want to duplicate. A new screen appears and asks for a name for
the copy. The duplicate will appear on the test protocol list under the new name. Making a
duplicate protocol means that you can modify a protocol without changing the original.
Export
You can copy a test protocol to a disk or another directory. Select the protocol(s) you want
to export then click on 'Export'. A new screen will ask for the destination drive and
directory and a name for the file.
2002-11-15
0413F0003A
37/123
FLUOstar*OPTIMA
BMG Labtechnologies
Software User Manual
In addition to this file (extension '.TST'), there will be an additional file with the extension
'.TSM' and a subdirectory (same name, but ending with MS') containing the layout
information and the sample IDs for the exported test(s). Do not forget the second file and
the complete subdirectory when sending the exported test protocol(s) to someone else!
Import
Import a test protocol from another drive and directory by clicking on 'Import'. Choose the
directory. A list of files with the extension 'TST' will appear under file name; select the
desired file and click on 'Open'. The imported test protocols will be added to the list of predefined test protocols.
Import Test Protocols
• '£ea«tfi1h: . ] £ 3 Extern
^INOVOSTDTESTs.TS
L3 NOVOJI
Novo_ wm.ru
Nwellpip.la
Toms.la
FLUO_PLATE.TST
Fife nartie:
S|fluo_welLTST
«3NOVOSTDTESTs.TST
5) N0V0_neu.TST
» j Nwellpip.tst
Tpmt.tst
,|Tom_Novo.tst
"| Test Protocols [*.TST)
Note:
Cancel
|
It is also possible to import test protocols created using FLUOstar 403 (old series),
FLUOstar Galaxy and LUMIstar Galaxy. If you import a test protocol from one of
these programs, the FLUOstar OPTIMA import function will ask you to import the
layout definitions used by these tests immediately after importing the test
definitions (In FLUOstar OPTIMA, the layout information is stored with the other
test parameters, the above mentioned programs use different data bases for
layout and test definitions.).
It is also possible to import test protocols from NOVOstar.
Delete
Remove a test protocol from the list by selecting the protocol and clicking on 'Delete'.
OK
Return to the main menu.
Notes: To select the first test protocol, beginning with e.g. T , simply press the key [T]. To
select more than one protocol (e.g. for export) use [Shift] together with [ t ] or [I] or
press [Ctrl] and click with the left mouse button.
Exporting the test protocols table into a XLS (Excel), text or HTML file is possible
after right clicking the table.
Users with activated 'Run Only' option (see 2.1 Login Screen) are not allowed to
edit, copy or import test protocols.
38/123
0413F0003A
2002-11-15
BMG Labtechnologies
FLUOstar^OPTIMA
Software User Manual
4.2 Creating a New Test Protocol
Click on 'NEW; the next dialog box will ask for plate mode or well mode. Select the
method that is appropriate for the assay. The following sections (4.3 Plate Mode
Fluorescence Tests and 4.4 Well Mode Fluorescence Tests) will explain the difference
between the two modes.
Mode (Fluorescence)
ipiie model
OK
C Well mode
Cancel
Help
After the mode is selected, the next window allows you to enter the test parameters.
2002-11-15
0413F0003A
39/123
FLUOstar*OPTIMA
BMG Labtechnologies
Software User Manual
4.3 Plate Mode Fluorescence Tests
Plate mode can be used for slow kinetics, i.e. the reaction lasts for an extended period of
time, even after injection. All wells defined in the layout are read once during a plate cycle;
it is possible to read up to 250 cycles. An injection can be defined for any cycle; all defined
wells will receive an injection followed by a measurement cycle.
Key words:
The number of times the entire plate will be measured. Each well is
read only once per cycle if no multichromatics are used, otherwise it will
be measured as many times as chromatics are used within each cycle.
Cycles
Cycle time The amount of time it takes to measure the plate during one cycle. You
can use the Minimum cycle time as calculated by the instrument (fastest
possible time) or enter a higher time if you want a delay between the
cycles.
4.3.1 Basic Parameters - Plate Mode
Plate Mode (Fluorescence)
Tntmg Overview (One cycle) J
JTOMSS PLATE MODE TST
Example test using plate
mode.
JBMG LABTECHNOLOGIES 9S
-^osHJOnjngjgeiojf v
Ftaowjsegftce Intensity O Time-iesolved Fluorescence
-t
(1...8): | T - » |
. Ejjcifetion
filter:
£mtesion filter;
J485
10
=
•': io^-rado.o *J:;f
BifCK!
(O,..ZUD}i j
0.0 _
integration:
Gain (0...4095):
3'
- -j \
sWt"(CU51 Q p»J- J O
T irne{10...1510 |«J- f ^ T
10
1
8
step fL.i
0 for F
rement time: j lm20s
0 secondsOK
Cancel
Test Name
Assign a test name, as you would like it to appear on the list of test protocols.
Microplate
Use the pull-down menu to select the microplate used in the assay. All microplates defined
under 'Setup | Microplates' will be listed. To select the first microplate, beginning with e.g.
'B\ simply press the key [B] after opening the pull-down box (using e.g. [I]).
40/123
0413F0003A
2002-11-15
BMG Labtechnologies
FLUOstar*OPTIMA
Software User Manual
General Settings
Positioning delay
You can define a waiting period after a well of the microplate moves to the measurement
position and before the measurement begins. The delay time allows the liquid to settle and
the surface to become stable so that the measurement is more accurate. For
homogeneous fluorescence assays BMG Labtechnologies recommends a delay time of
0.2s. For fluorescence measurements of cell assays, a delay time of 0.5s is adequate.
Liquid movements and hence delay time are influenced by viscosity.
Flying mode
This is a time optimized parameter for plate mode. When this function is selected the
measurement, using 1 or 3 flashes only, will occur at the exact moment that the center of
the well is under the measurement head. The plate carrier does not stop as the well
passes the measurement position. If you have defined injections, the injection cycles will
be performed in non flying mode.
Number of kinetic windows
You can split the measurement into up to 4 kinetic windows. You can define the number of
cycles, the measurement start time, the number of flashes and the cycle time
independently for each kinetic window. Therefore, it is possible to have denser
measurement points on more interesting parts of the kinetic curve. If you choose to use
more than one kinetic window, a new sheet 'Kinetic Windows' (see chapter 4.3.3) will
become available, where you can define the parameters for all kinetic windows. To switch
to this sheet, click the arrow button or on the 'Kinetic Windows' tab. If you use only one
kinetic window, you can define all necessary parameters on the 'Basic Parameters' sheet.
Kinetic Window 1
Number of cycles
This is the amount of times the entire plate will be measured for kinetic window 1. Each
well defined in the layout will be measured once per cycle if no multichromatics are used,
otherwise it will be measured as many times as chromatics are used within each cycle.
You can define up to 250 cycles (250 is the total number for all kinetic windows).
Measurement start time
Defines the time when the measurement will start for all cycles belonging to kinetic window
1, relative to the time when the measurement position is reached plus positioning delay.
Defining a measurement start time larger than 0 makes sense when i.e. injection or
shaking is performed before the measurement.
Number of flashes per well and cycle
You can define up to 200 flashes per well and cycle. All the measurement values obtained
for all flashes for a cycle are averaged for one intensity value per well. Therefore, the
greater the number of flashes, the greater the accuracy. For fluorescence measurements,
10 flashes are usually adequate.
Note:
Increasing the number of flashes also increases the minimum cycle time and,
therefore, the reading time.
2002-11-15
0413F0003A
41/123
FLUOstar*OPTIMA
Software User Manual
BMG Labtechnologies
Cycle time
You can define the duration of each cycle from 1 to 10000 seconds. When the instrument
is switched on, you can click the 'Check timing' button and the cycle time is automatically
validated by the instrument (You will see the minimum cycle time below this group box. If
the cycle time you have defined is smaller than this minimum cycle time, it will be
automatically corrected to the minimum time.). If you want to increase the cycle time (if you
want a delay between cycles), you can manually enter a time greater than the minimum
cycle time calculated by the 'Check timing' function.
For example, the instrument gives a time of 25 seconds per cycle, but you can change this
to 85 seconds so that there will be a delay of 60 seconds between cycles.
Filters and Integration
Select Fluorescence intensity or Time-resolved fluorescence
fluorescence involves a delay time between flash and measurement).
(time-resolved
Number of multichromatics
There is the possibility to analyze 8 fluorophores per well. Enter the number of
fluorophores to be analyzed, then click the arrow button or on the 'Multichromatic' tab to
define the filter combination for each fluorophore to be analyzed.
Excitation and Emission filter
If you only want to analyze one fluorophore, you can select the filter combinations directly
in this window. When you use the pull-down menu, the list of filters, as defined under
'Setup | Filters' (see chapter 3.1.3 Filters), is displayed.
Gain
This value will be used to adjust the sensitivity of the photo multiplier tube (PMT). A higher
gain factor will increase the signal. Choose a gain value which will keep the measurement
result of higher concentrations within the range of the instrument (i.e. 0 to 65000 relative
fluorescence units). You can enter the gain settings here or perform an automatic gain
adjustment before the measurement.
Integration Start and Time
This is for time-resolved assays. For integration start, enter the time in which the
measurement should begin after the flash (see also chapter 4.3.2). This time should
provide the maximum signal from the fluorophore after the flash has dissipated. The
integration time is the length of the measurement (i.e. how long the PMT reads the
emission light). To find the optimal times for the fluorophore, see section 4.8.1
42/123
0413F0003A
2002-11-15
BMG Labtechnologies
FLUOstar*
OPTIMA
Software User Manual
Calculation Range
Start / Stop
You can enter the cycles, which you want to use for calculations, here. This can also be
done later in the Evaluation part of the software.
Note:
The values specified here are used as default values for calculation range 1. All
cycles behind the entered stop cycle are used as presetting for range 2.
Pause before cycle
You can define a pause for plate mode tests. The default setting is 0, which results in an
uninterrupted measurement. If you want a pause, enter the cycle number before which the
reader should pause. The reader will pause the measurement before the defined cycle. If
you have defined 0 s as pause time, the Test Run Pause window will appear, otherwise
the measurement will automatically be continued after the defined pause time.
Test Run Pause
1 min 20 s
The test run has stopped as defined before cycle 3.
You can now use the 'Plate Out1 button to take out the
plate. Use the 'Continue' button to continue the
measurement or the 'Stop* button to abort the test run.
In the caption bar of the window you can see the time elapsed since the beginning of the
pause.
The pause window provides the possibility of bringing the plate out (to make a manual
injection, to incubate or to change the plate) or stopping the test run.
You can also pause after a measurement has started (plate mode only with more than one
cycle). Go to 'Measure' and select 'Pause after current Cycle'.
Note:
It is possible to define a pause before the first cycle, e.g. to incubate the plate for a
certain time.
Comment
Here you can enter a short description of the test protocol (up to 255 characters). The first
100 characters of this description will also be visible later in the comment field of the
evaluation sheet of the FLUOstar OPTIMA evaluation software (see chapter Fehler!
Verweisquelle konnte nicht gefunden werden. Evaluation Worksheet).
2002-11-15
0413F0003A
43/123
FLUOstar^OPTIMA
Software User Manual
BMG Labtechnologies
Check timing
Minimum cycle time 1
The minimum cycle time can only be calculated by the reader. After defining all necessary
settings (do not forget the filters), click the button 'Check timing'. The shortest possible
cycle time will be displayed. If you have defined a cycle time, which is shorter than this
minimum time, it will automatically be corrected. At the bottom of the test protocol
definition window, the calculated Total measurement time' for the entire plate will be
displayed.
Note:
The 'Check timing' function is only available if the reader is switched on.
After pressing the 'Check timing' button the Timing Overview' sheet will become available
(see chapter 4.9).
Limitations for 1536 well plates
Your reader has to be specially prepared for measuring 1536 well plates. Measuring 1536
well plates is only possible in plate mode. The following limitations exist for the test
protocol:
•
•
•
•
•
only one kinetic window
only horizontal bidirectional reading, starting top left
no multichromatics
no injection
no shaking
Printing the Protocol
To print the protocol use the key combination [Shift]+[Ctrl]+[P]. A standard print dialog box
will appear. Here you can decide, whether you only want to print the current sheet
('Selection'), all sheets ('All') or a selection of sheets ('Pages'). When using portrait format
two sheets will be printed on one page, using landscape format only one.
44/123
0413F0003A
2002-11-15
FLUOstar*OPTIMA
BMG Labtechnologies
Software User Manual
4.3.2 Time-Resolved Test Protocols
In the 'Filters and Integration' box you can define the optimal integration time for a timeresolved assay.
C Fluorescence Intensity* 1 [Time-iesqiyed FJuorescence
N o. of multichromatics
Excitation filter:
(1...8J: j 3 -> j
Emission filter:
Gain (0...4095J:
"505/
J485
integration:
.Start [0...1510 us): I 400" Time (10...1510 us): \ 400
If you have one time-resolved fluorophore you can define the same filter setting for up to 8
(multichromatic) tests and try different integration times (see chapter 4.8.1). You can then
compare the measurement data to find the optimal time for sensitivity.
2002-11-15
0413F0003A
45/123
FLUOstar*OPTIMA
Software User Manual
BMG Labtechnologies
4.3.3 Kinetic Windows - Plate Mode
It is possible to split the measurement into up to 4 kinetic windows. You can define the
cycle time individually for each kinetic window. Therefore, it is possible to have denser
measurement points on more interesting parts of the kinetic curve.
Plate Mode (Fluorescence)
Basic Parameters Kinetic" Window*
Number
No. of cycles
{EL250}
1
TimHgj Timing Overview (One cycle)}
Meas. start time
(0...1200.4
,
Mi
|
| 3b"
3
I
00
I cm ~;
ns. :r~sr
| 2b"
2
fTo
4
ttaijf flesh**
•(CLZOoj
r~s
-
Minimum
cycle time
Cycle time
{UIOOOBt)
| Too'
| 4b"
pa
F" Equidistant kinetic cycles [all cycles are as fortg as ntfcessaTy for thi longesVteteit injection or tneasurement to take place]
Check tjttiirjg [' • ^^^ measurement time. J33m2ds
Cancel.
1 . Help
Number of cycles
This is the amount of times the entire plate will be measured. Each well defined in the
layout will be measured once per cycle if no multichromatics are used, otherwise it will be
measured as many times as chromatics are used within each cycle. You can define up to
a total of 250 cycles divided into up to 4 kinetic windows.
Measurement start time
Defines the time when the measurement will start for all cycles belonging to the respective
kinetic window, relative to the time when the measurement position is reached plus
positioning delay. Defining a measurement start time larger than 0 makes sense when i.e.
injection or shaking is performed before the measurement.
Number of flashes (all modes except luminescence)
You can define up to 200 flashes per well and cycle. All the measurement values obtained
for all flashes of a cycle sent to one well are averaged for one intensity. Therefore, the
greater the number of flashes, the greater the accuracy. For fluorescence measurements,
10 flashes are usually adequate.
Note:
46/123
Increasing the number of flashes also increases the minimum cycle time and,
therefore, the reading time.
0413F0003A
2002-11-15
BMG Labtechnologies
FLUOstar* OPTIMA Software User Manual
Measurement interval time (only luminescence mode)
Defines the measurement time (defines how long the light is measured). By increasing this
time, you will get higher (and usually more accurate) measurement values.
Cycle time
You can define the duration of each cycle from 1 to 10000 seconds (=2hr46min40s). When
the instrument is switched on, you can click the 'Check timing' button and the cycle time
is automatically validated by the instrument. If you want to increase the cycle time (if you
want a delay between cycles), you can enter a time greater than the minimum cycle time
calculated by the 'Check timing' function.
For example, if the instrument gives a minimum cycle time of 25 seconds and you change
this to 85 seconds, there will be a delay of 60 seconds between cycles.
Equidistant kinetic cycles
If you use this option, the minimum cycle time for all cycles is as long as the cycle with the
latest / longest injection or measurement requires.
If you do not use this option, the time for cycles with injection can be different from cycles
without injection and the minimum cycle time for each kinetic window can be different. This
allows very short sampling rates in kinetic areas with a fast change in signal.
Note:
Even if you choose this option, it is possible to define different kinetic cycle times
for different kinetic windows, but the software will ensure that the timing of all wells
is equal by adding waiting times after processing each well.
Minimum cycle time
The minimum cycle times can only be calculated by the reader. If you do not use the
Equidistant kinetic cycles option, the Minimum cycle time can be different in different
kinetic windows (depending on the Measurement start time and the Number of flashes).
After defining all necessary settings (do not forget the filters), click the button 'Check
timing'. The shortest possible cycle times will be displayed. If you have defined a cycle
time in any of the kinetic windows which is shorter than the corresponding minimum time, it
will automatically be corrected. At the bottom of the test protocol definition window, the
calculated Total measurement time' for the entire plate will be displayed.
Note:
The 'Check timing' function is only available if the reader is switched on.
2002-11-15
0413F0003A
47/123
BMG Labtechnologies
FLUOstar* OPTIMA Software User Manual
4.4 Well Mode Fluorescence Tests
Well mode tests should be selected for fast kinetics, i.e. if the reaction, usually initiated by
an injection, occurs over a very finite amount of time. Measurements can then be
performed in small intervals when the reaction occurs. In well mode, each well, as defined
in the layout, will be measured individually for the defined number of intervals.
For example, a test can be defined with 3 intervals and an injection. Therefore, well A1
moves to the measurement position, a measurement is performed, then an injection,
followed by two more measurements. When all defined measurement intervals have been
performed on well A1 the microplate carrier moves to the next defined well for the same
protocol. Once all the defined wells have been measured, the assay is finished.
Key words:
Intervals
Number of times the well is measured. Up to 250 intervals per well
can be defined.
Interval time
The length of time, in seconds, for each measurement interval.
This includes the flashes and the time for measuring the emission
light.
Total measure- The amount time it takes to perform all the measurement intervals,
including any injections, on one well. It is calculated by multiplying
ment time per
the number of intervals by the interval time (and taking into
well
account all used kinetic windows and the measurement start
times).
4.4.1 Basic Parameters - Well Mode
Well Mode (Fluorescence
^ e * R a i M $ & JKinetteWir!d6ws 1tayewi Goncertttatfons/Volumes / Sh^ingj lnieetionT^ing| Timing Overview |
Gsnwm?
Example test using well
mode.
|BMG ^ T E C H N O L O G I E S 96
HDL1...1.0J* I
positioning
02
(1...4J: [ 7
Mo; 6T!$irHafc windows
eftsUjf-f"
(0...1200sJ: j
CLO
No., of intervals
(1...250): |
5
Mo. of flashes per well and interval
(O...200Jr J
I"
Interyafjirne
(D.O2...100S}: j
Efid'fime at kinetic window 1
Mia interval Wife 1; | 0 1 0 s
£hecKMhgj
48/123
fi...sj: rT
•HO. or rngmcnromau
^mission filter:
cjCKatton niter.
Measurement s^rt time
I i m * i e s6lyed#lubr sscence
1544
^j
1590
-»|
Gain (0. .4095):
J
I
1
1003
. integration'
Start (0.,.151 O j U j f '.
0
Time (10. 1510
MS]'
0.10
Stai
Stop (1...20):
20
Total meas. tirfte/wet
TotaF measurement time: j
43$
Cancel
0413F0003A
1
Help
2002-11-15
BMG Labtechnologies
FLUOstar* OPTIMA Software User Manual
Test name
Assign a test name, as you would like it to appear on the list of test protocols.
Microplate
Use the pull-down menu to select the microplate used in the assay. All microplates defined
under 'Setup | Microplates' will be listed. To select the first microplate, beginning with e.g.
'B', simply press the key [B] after opening the pull-down box (using e.g. [ i ]).
General Settings
Positioning delay
You can define a waiting period after the microplate moves a well to the measurement
position and before the measurement begins. The delay time allows the liquid to settle and
the surface to become stable so that the measurement is more accurate. For
homogeneous fluorescence assays BMG Labtechnologies recommends a delay time of
0.2s. For fluorescence measurements of cell assays, a delay time of 0.5s is adequate.
Liquid movements and hence delay time are influenced by viscosity.
Number of kinetic windows
You can split the measurement into up to 4 kinetic windows. You can define the number of
intervals, the interval time and the start time independently for each kinetic window.
Therefore, it is possible to have denser measurement points on more interesting parts of
the kinetic curve. If you choose to use more than one kinetic window, a new sheet 'Kinetic
Windows' (see chapter 4.4.2) will become available, where you can define the parameters
for all kinetic windows. To switch to this sheet, click the arrow button or on the 'Kinetic
Windows' tab. If you use only one kinetic window, you can define all necessary parameters
on the 'Basic Parameters' sheet.
Kinetic Window 1
Measurement start time
= Start time for kinetic window 1. Defines the time when the measurement will start,
relative to the time when the measurement position is reached plus position delay.
Example - measurement start time 5 seconds: After the reader plate carrier reaches the
measurement position, the defined positioning delay time starts. After this, there will be an
additional delay of 5 seconds before the measurement itself starts.
Using this measurement start time, it is possible to start the measurement after an
injection.
Number of intervals
This is the amount of times a measurement will be successively taken on each well
(equals the number of readings on each well). You can define up to 250 intervals (250 is
the total number for all kinetic windows). This is typically used for kinetic assays, in which
the dynamics of a reaction changes very quickly over time. Each interval is plotted as a
kinetic point displaying the change over time.
2002-11-15
0413F0003A
49/123
FLUOstar*OPTIMA
Software User Manual
BMG Labtechnologies
Number of flashes per well and interval
You can define up to 200 flashes per measurement interval. All the measurement values
from the flashes defined for one interval are averaged to produce one intensity value per
well. The greater the number of flashes, the greater the accuracy. For fluorescence
measurements, 10 flashes are usually adequate.
Note:
Increasing the number of flashes also increases the reading time.
Interval time
You can define the duration of each interval from 0.02 to 25.0 seconds. When the
instrument is active, you can click the 'Check timing' button and the interval time is
automatically validated by the instrument. If you want to increase the interval time (if you
want a delay between the intervals), you can manually enter a time. If you have defined an
interval time in any of the kinetic windows which is shorter than the respective minimum
interval time, it will automatically be corrected to the shortest possible value. If necessary,
the start times for following kinetic windows will also be corrected.
The minimum interval time depends on the number of flashes (1 flash equals 0.02
seconds, 10 flashes equals 0.2 seconds, etc.) and on the usage of multichromatics.
For example, the instrument gives a minimum interval time of 0.4 seconds, but you can
change this to 5 seconds so that there will be a delay of 4.6 seconds between intervals.
End time of kinetic window 1
This value is automatically calculated (Measurement start time plus Number of intervals
multiplied by Interval time). The start time for kinetic window 2 needs to be higher than or
equal this end time.
Filters and Integration
Select Fluorescence intensity or Time-resolved fluorescence
fluorescence involves a delay time between flash and measurement).
(time-resolved
No. of multichromatics
There is the possibility to analyze up to 8 fluorophores per well. In well mode, all
fluorophore settings will be measured in one cycle (one well at a time). Enter the number
of fluorophores to be analyzed, then click the arrow button or on the 'Multichromatic' tab to
define the filter combination for each fluorophore to be analyzed.
Excitation and Emission filter
If you only want to analyze one fluorophore, you can select the filter combinations directly
in this window. When you use the pull-down menu, the list of filters, as defined under
'Setup | Filters', is displayed.
50/123
0413F0003A
2002-11-15
FLUOstar1'OPTIMA
BMG Labtechnologies
Software User Manual
Gain
w
This value will be used to adjust the sensitivity of the photo multiplier tube (PMT). A higher
gain factor will increase the signal. Choose a gain value which will keep the measurement
result of higher concentrations within the range of the instrument (i.e. 0 to 65000 relative
fluorescence units). You can enter a gain manually or perform an automatic gain
adjustment before the measurement.
Integration Start and Time
This is for time-resolved assays. For integration start, enter the time in which the
measurement should begin after the flash. This time should provide the maximum signal
from the fluorophore after the flash has dissipated. The integration time is the length of the
measurement (i.e. how long the PMT reads the emission light). A way to find the optimal
times for the fluorophore is described section 4.8.1.
Calculation Range
Start / Stop
w
You can enter the intervals, which you want to use for calculations, here. This can also be
done later in the Evaluation part (see chapter 7.3) of the software.
Note: The values specified here are used as default values for calculation range 1. All
intervals behind the entered stop interval are used as presetting for range 2.
Comment
Here you can enter a short description of the test protocol (up to 255 characters). The first
100 characters of this description will also be visible later in the comment field of the
evaluation sheet of the FLUOstar OPTIMA evaluation software (see chapter Fehler!
Verweisquelle konnte nicht gefunden werden. Evaluation Worksheet).
Check timing
Minimum interval time 1
The minimum interval times (this time might be different for different kinetic windows) can
only be calculated by the reader. After defining all necessary settings (do not forget the
filters), click the button 'Check timing'. The shortest possible interval time will be
displayed. If you have defined an interval time in any of the kinetic windows which is
shorter than the respective minimum time, it will automatically be corrected. If necessary,
the start times for all following kinetic windows will also be corrected. At the bottom of the
test protocol definition window, the calculated Total measurement time' for the entire
plate will be displayed.
Note:
The 'Check timing' function is only available if the reader is switched on.
2002-11-15
0413F0003A
51/123
FLUOstar*'OPTIMA
Software User Manual
BMG Labtechnologies
Total measurement time per well
This time will be calculated using the settings in the protocol, i.e. the interval time, the
number of intervals and the start time for all kinetic windows. If the defined interval time for
the last interval (in the last kinetic window), is higher than the minimum interval time, the
calculated total measurement time per well will show a value slightly too high, as the
reader, when the last interval is finished will not wait for the defined interval time before it
goes on to the next well. If you have defined an injection which will last longer than the last
measurement (which usually makes no sense), this time will be too short. (The total
measurement time calculated by the reader will always be correct.)
After pressing the 'Check timing' button, the Timing Overview' sheet will become
available (see chapter 4.9).
Click on 'OK' to save the information and to add the test protocol to the list.
52/123
0413F0003A
2002-11-15
BMG Labtechnologies
FLUOstar*OPTIMA
Software User Manual
4.4.2 Kinetic Windows - Well Mode
It is possible to split the measurement into up to 4 kinetic windows. You can define the
interval time independently for each kinetic window. Therefore, it is possible to have
denser measurement points on more interesting parts of the kinetic curve.
Example:
Calcium Influx
Int.
Kinetic window
Start time
No. of intervals
Interval time
1
2
3
Os
3.0s
15.0 s
3
40
5
0.5 s
0.2s
1s
48 intervals in total
break
break
OVt
5
10
15
t[s]
baseline
Well Mode [Fluorescence!
Basic Parameters Kinetic Windows I Layout ] Concentrations / Volumes / Shaking j Injection Timing | Timing Overview |
Number
Start time
(O...1200s)
No. of intervals
[0...250]
No. of flashes
(0...200)
Interval time
(0.02...100s)
End time (s)
| 0.10s.
0.0
3.0
40
12.0
10
0.20
11
| 0.20 s
10
2.00
22
I 0.20 s
0.10
320.7
Total meas. timeAvell:
Check timing!}
Minimum
interval time
22 s
Total measurement time: 27m39s
Cancel
Help
Start time
Defines the time when the measurement for the selected kinetic window will start, relative
to the time when the measurement position is reached plus position delay. The start time
for a kinetic window needs to be higher than the end time of the kinetic window before.
2002-11-15
0413F0003A
53/123
FLUOstar*OPTIMA
Software User Manual
BMG Labtechnologies
Number of intervals
This is the amount of times a measurement will be successively taken on each well. You
can define up to a total of 250 intervals.
Number of flashes (all modes except luminescence)
You can define up to 200 flashes per measurement interval. All measurement values
obtained for all flashes defined for one interval are averaged to produce one intensity
value per well. The greater the number of flashes, the greater the accuracy. For
fluorescence measurements, 10 flashes are usually adequate.
Note:
Increasing the number of flashes also increases the reading time.
Measurement interval time (only luminescence mode)
Defines the measurement time (defines how long the light is measured). By increasing this
time, you will get higher (and usually more accurate) measurement values.
Interval time
You can define the duration of each interval from 0.02 to 25.0 seconds. When the
instrument is switched on, you can click the 'Check timing' button and the interval times
are automatically validated by the instrument. If you want to increase an interval time (if
you want a delay between the intervals), you can manually enter a time.
For example, the instrument gives a time of 0.4 seconds but you can change this to 5
seconds so that there will be a delay of 4.6 seconds between intervals.
End time
This value is automatically calculated (Start time plus Number of intervals multiplied by
Interval time). The start time for the next kinetic window needs to be higher than this end
time.
Minimum interval time
The minimum interval times (this time value might be different for different kinetic windows)
can only be calculated by the reader. After defining all necessary settings press the button
'Check timing'. The shortest possible interval times will be displayed. If you have defined
an interval time in any of the kinetic windows which is shorter than the respective minimum
time, it will automatically be corrected. If necessary, the start times for all following kinetic
windows will also be corrected. At the bottom of the test protocol definition window, the
calculated Total measurement time' for the entire plate will be displayed.
Note:
54/123
The 'Check timing' function is only available if the reader is switched on.
0413F0003A
2002-11-15
BMG Labtechnologies
FLUOstar* OPTIMA Software User Manual
4.5 Layout Definition
This sheet contains a grid representing the wells of the microplate that you selected. You
can define wells containing samples, blanks, standards and controls.
Bl
• Plate Mode (Fluoiescence)
Basic Parameters
Layout J Concentrations / Volumes I Shaking J njection / Timing |
Content
•
Standard
TOn
2.
|
Start value:
| 6 - H
C Constant
:
(* Increase
Number:
1
A
B
1
B
21 22 23 24 25 26 27 28 29 30 31 32 33 34 35 36 37 38 39 40
41 42 43 44 45 46 47 48 49 50 51 52 53 54 55 56 57 58 59 60
B
C
jj
J1 T J
(• Horizontal
C Vertical
15 is 17 18 19 20 211 22 23 *
9 10 11 12 13 14 15 16 17 18 19 20
384
D
E
F
G
H
1
J
K
L
Reading direction: fj—*-\
M
N
"^—'—•
o
P
,:1
2
•3
".'4'=
5
2|a
«
2
3
6
7
8
9 10 11 12 13
4
5
6
7
8
61 62 63 64 65 66 67 68 69 70 71 72 73 74 75 76 77 78 79 80
81 82 83 84 85 86 87 88 89 90 91 92 93 94 95 96 97 98 99 100
101 102 103 104 105 106 107 108 109 110 111 112 113 114115 116 117 118 119 120
121 122 123 124 125 126 127 128 129 130 131 132 133 134 135 136 137 138 139 140
141 142 143 144 145 146 147 148 149 150 151 152 153 154 155 156 157 158 159 160
161 162 163 164 165 166 167 168 169 170 171 172 173 174 175 176 177 178 179 180
181 182 183 184 185 186 187 188 189 190 191 192 193 194 195 196 197 198 199 200
201 202 203 204 205 206 207 208 209 210 211 212 213 214 215 216 217 218 219 220
221 222 223 224 225 226 227 228 229 230 231 232 233 234 235 236 237 238 239 240
241 24? 243 244 245 ?4fi 247 ?48 249 ?Rn 251 25? 253 254 ?Fi5 256 257 258 -JPjQ ?fin
261 262 263 264 265 266 267 268 269 270 271 272 273 274 275 276 277 278 279 280
281 282 283 284 285 286 287 288 289 290 291 292 293 294 295 296 297 298 299 300
301 302 303 304 305 306 307 308 309 310 311 312 313 314 315 316 317 318 319 320
Check timing I
•'; O K
If you edit a 384 or 1536 well layout, you can use the zoom buttons
reduce the layout display.
I
Cancel
I
1
2
3
4
5
B
B
Help
to enlarge or
Content
In the content pull-down menu, you can select the type of sample that the well contains;
select sample, standard, or blank.
Sample
(X) The well's content has unknown concentration.
Standard
(S) The well's content has a known concentration and is used to
formulate a standard curve in the data reduction
Negative
Control,
Positive
Control
Control
(N) The well's content has known concentrations, but will not be
used for the standard curve calculation. It can be used for
(P) comparisons or for special evaluation calculations.
(C)
Blank
(B) The well contains water or buffer for measuring background.
2002-11-15
0413F0003A
55/123
FLUOstar*OPTIMA
Software User Manual
BMG Labtechnologies
Index
The Index is the reference number of the sample or standard. The index box displays the
number that will be used for the next sample or a standard. If Increase is selected, each
sample or standard will be labeled with consecutive numbers. With Constant the number
will remain the same, in the case of continuous replicates. In the example picture above,
the index box shows that the next standard well number is 6.
Increase For each well the next consecutive number will be used. The number
shown in the index box is the number of the next well.
Constant The number remains fixed; use this if the samples are identical.
Replicates
Replicates are the number of repeated samples. If you have duplicates of a sample on the
microplate then you select '2' and whether they are labeled in the horizontal or vertical
direction.
Methods of Labeling
1.
Select the appropriate content from the contents box and then double click on each
well of that type. Select in the index whether the samples should be labeled with
increasing numbers or with the same number.
2.
If the samples are in successive rows or columns, select increase if the samples
should be labeled with consecutive numbers, or choose constant if they are
continuous replicates. Click on the first well with the left mouse key and drag across
the wells containing the samples, standards, controls or blanks.
3.
If a row or column contains the same contents (samples, standards, ...) click the row
letter or the column number and all wells of that row / column will be labeled.
4. To fill the entire microplate select the appropriate content (samples, standards, ...) and
click on the format number (e.g. '96') in the top left corner.
Note:
Exporting the layout grid into a XLS (Excel), text or HTML file is possible after right
clicking the grid.
Reading direction
After pressing the reading direction button ( J ^ 3 | ) , you can choose between horizontal
or vertical reading (horizontal: the plate carrier will move from left to right reading across
successive columns, vertical: the plate carrier will move up and down reading in
successive rows).
It is also possible to select a bidirectional or unidirectional reading mode. Example:
Using a bidirectional horizontal reading of a full 96 well plate, the reading will continue after
reading A1 ... A12 with B12 and then go back via B11, B10, ... to B1. If you choose
unidirectional reading, the plate carrier would move to B1 after A12 and continue reading
with B2, B3,... .
It is possible to start the reading from any of the four corners.
Note:
56/123
The reading direction has no bearing on the measurements; it is intended to
optimize the amount of time it takes to read the plate.
0413F0003A
2002-11-15
BMG Labtechnologies
FLUOstar*OPTIMA
Software User Manual
Possible reading modes:
bidirectional reading
start left
unidirectional reading
start right
start left
start right
2
H.9 5
8
6
i
#
F
S3 l i is
JD
t
1
*
11H
10
.i
16
m
• • r
ft1 5 ' m
Ad k
14
12
4.5.1 Using Layout Groups
It is possible to use up to 12 independent layout groups (sets of samples, blanks, controls
and standards). Each group can be individually blank corrected and it is possible to
calculate a separate standard curve for each group (see 7.7 Standard Curve Worksheet).
Plate Mode (Fluorescence)
Basic Parameters
Layout j Concentrations /Volumes I Shaking j Injection I Timing
Content:
I I Standard
FQn
2
3
4
5
6
7
8
9
10
11
12
A
SA1
SA2
SA3
SA4
BA
XA1
XA2
XA3
XA4
XA5
XAG
XA7
B
SB1
SB2
SB3
SB4
BB
XB1
XB2
XB3
XB4
XB5
XB6
XB7
C
SCI
SC2
SC3
SC4
BC
XC1
XC2
XC3
XC4
XC5
XC6
XC7
D
SD1
SD2
SD3
5D4
BD
XD1
XD2
XD3
XD4
XD5
XD6
XD7
E
SE1
SE2
SE3
SE4
BE
XE1
XE2
XE3
XE4
XE5
XE6
XE7
F
SF1
SF2
SF3
SF4
BF
XF1
XF2
XF3
XF4
XF5
XF6
XF7
G
SK1
SK2
SK3
SK4
BK
XK1
XK2
XK3
XK4
XK5
XK6
XK7
H
SL1
SL2
SL3
H
BL
XL1
XL2
XL3
XL4
XL5
XL6
XL7
Constant
(* Increase
Number:
fi
<• Horizontal
r
1
| L zl
S.tart value:
r
96
jj-j
Vertical
Reading direction:
Check timing
OK
Cancel
Help
To activate the usage of groups activate the 'On' check box in the groups box. Use the pull
down box next to this check box to select one of the 12 possible groups (A...L). Now enter
samples, blanks and standards as described above. The group will be shown in the layout
grid using different background colors and by inserting the group letter between content
type identifier (e.g. B for blank, S for standard and X for sample) and index.
Notes: When switching on the group mode, all existing layout entries will be converted to
group A.
When switching off the group mode, all layout entries not belonging to group A will
be erased.
2002-11-15
0413F0003A
57/123
FLUOstar*OPTIMA
BMG Labtechnologies
Software User Manual
4.6 Concentrations / Volumes / Shaking
To define the standard concentrations and the injection volumes, go to the
'Concentrations / Volumes / Shaking' sheet. In this sheet you will see a table that lists
contents and their reference numbers. Concentration refers to the known concentration of
the standards. Volume 1 ... 4 refers to the injection volumes of volume groups 1 ... 4,
respectively. The concentrations (of standards) and volumes for injection can be entered
manually into each space or by using the auto function.
Well Mode (Luminescence)
njection TimtriQ j
Content - Cohcetitf.
Start concentration:
|0
<* Factor C Increment f
Decrement
C Factor (? Increment C Decrement
Mote : : -
r
|1
|5
f u t i l e orbital C 'Linear
n...?mmj' j
Round? per minute
Additional1 shaking.
Shaking tinjft -
| Before plate reading
•
^ j
[1...3600 s): I
1
600
z\
V0
S1
S2
S3
S4
B
XI
X2
X3
X4
X5
XG
X7
X8
X9
Volume 1
1
10
100
1000
Pump to use:
Pump speed [\s.\h\.
Shaking time [0...300 s]:
Volume 2
0
0
0
0
0
Volume 4
0
0
0
0
0
0
0
0
0
0
0
0
0
0
Z Pump 2 ^
»
200
T,
5
0
0
10
15
20
25
30
35
40
Pumpi
310
Volume 3
50
50
50
50
50
50
50
50
50
50
50
50
50
50
CJl
Basic Parameters | Layout Concentrations / Volumes / Shaking
(5K
0
0
0
0
0
0
0
0
0
0
0
0
310
j
Cancel
*-
0
[
Help
The Auto function can be used to define the concentrations and volumes without entering
them manually. Define the start value and select Factor, Increment, or Decrement and
type in a factor. Then click with the right mouse button on the table headline
'Concentration' or 'Volume V ... 'Volume 4'. The calculations are done automatically. You
can also select a specific set of wells by finding the first well and clicking and scrolling
down with the right mouse button or using the cursor keys [4] and [ t ] together with [Shift].
Concentration
The auto function will automatically calculate the concentrations using the given start
concentration and a number to be multiplied (factor), added (increment) or subtracted
(decrement). Click on 'Concentration' at the top of the table or select a range of
standards with the right mouse button and the calculations will automatically be entered.
Volume
Enter the starting injection volume. Indicate whether the injection volumes for the wells
increase or decrease by a certain amount. Leave the factor as 1 if the volume is the same
for every well. With the right mouse button, click the desired field in the table title row
('Volume 1' for volume group 1) and the volumes are entered automatically in all columns
of this row, or select the desired columns using the right mouse button. It is not necessary
to use all volume groups consecutive (you can for example use only volume 2 and 4).
58/123
0413F0003A
2002-11-15
FLUOstar1'OPTIMA
BMGLa btechnologies
Software User Manual
You can enter the volumes in steps of 0.5 JLXI. If you prefer steps of 0.166 uJ (1/6 uJ =
minimum step of the injectors) add the following line to the [ C o n f i g u r a t i o n ] section of
the 'FLUOstar OPTiMA.ini' file: Minvolumestep=6, for minimum steps of 1 jJ use
MinVolumeStep=l. You will find this configuration file in the FLUOstar OPTIMA main
installation directory, usually '~\Program Files\BMG\FLUOoptima\\
Note:
Exporting this table into a XLS (Excel), text or HTML file is possible after right
clicking on the content column of the table.
Pump to use
Select which pump should be used to inject the defined volume(s). It is possible to use the
same pump in different volume groups.
Pump speed
The pump can dispense at different speeds. The injection speed is defined in \i\ / second.
The default speed is 310 jJ / second which should be appropriate for most assays. There
are pre-defined speeds available by using the pull-down menu.
Factors determining pump speed:
Viscosity:
Liquids, such as water and buffer, can be dispensed at higher speeds. For
highly viscous solutions you should use a slower speed to ensure higher
precision and lower the risk of air bubbles.
Cells:
Solutions containing cells should have a lower speed because it causes
less stress on the cells.
Volume:
Higher speeds are necessary for small volumes (below 3...5
the best performance.
to ensure
Shaking time
If you want shaking after an injection, add the desired shaking time here. It is possible to
define different shaking times for different volume groups. The shaking width and shaking
style (orbital or linear) will be defined for all volume groups (and for possible additional
shaking) in the 'Shaking Options' group box on the left side of this sheet.
Shaking Options
Shaking mode
o
orbital
Orbital:
Shaking mode is circular; mixing is more complete,
especially around the edges of the microplate.
Double orbital:
The shaking function is performed as orbital movement.
The plate carrier makes a figure eight movement.
Shaking mode is from right to left.
CO
Linear:
2002-11-15
0413F0003A
59/123
FLUOstar*OPTIMA
Software User Manual
BMG Labtechnologies
Shaking width
The width (linear) or diameter (orbital) of the shaking motion. The range is 1 mm to 7 mm.
The width depends on several conditions:
Plate format:
For plates with larger wells, such as 6 or 24 well plates, you can
use a larger diameter (slower speed) while you should use a
smaller diameter (faster speed) for plates with smaller wells.
Samples:
If the wells contain cells, the diameter should be larger so the
force of the shaking does not stress the cells. For viscous
solutions, you should also use a larger shaking diameter.
Volume:
A smaller diameter is suggested for smaller volumes.
Additional shaking
If you want additional shaking (other than shaking after injection), you can choose in plate
mode between shaking before or after each cycle or before / after the first cycle. In well
mode, additional shaking is only possible before plate reading.
Shaking time
The duration of time for additional shaking is defined in seconds. The maximum shaking
time is 300 seconds (5 minutes).
Limitations for Injection
The maximum amount per well (Volume 1 + Volume 2 + Volume 3 + Volume 4) is 500 JLLI
(6, 12, 24 and 48 well plates), 350 uJ for 96 well plates and 100 \i\ for 384 well plates
respectively. Injection is not possible in 1536 well plates.
Note:
It is necessary to prime all used pumps before performing a test with injections
(see chapter 5.1 Priming).
Shaking after Injection without Injection
If you need shaking at a certain time, but no injection at this time, you can use any of the
four volume groups. Please set all injection volumes in the table column belonging to this
group to 0, but select a pump (which will not be used). You can then specify the shaking
duration at the bottom of the table. The start time of this shaking procedure can be defined
under 'Volume group X injection start time' in the 'Injection Timing' sheet (see chapter 4.7).
60/123
0413F0003A
2002-11-15
FLUOstarhOPTIMA
BMG Labtechnologies
4.7
Software User Manual
Injection Timing
4.7.1 Injection Timing - Plate Mode
Plate Mode [Fluorescence!
Basic Parameters j Kinetic Windows j Layout j Concentrations /Volumes / Shaking
Injection Timing J Timing Overview {One cycle) |
20
_j
Volume group 1 .injection cycle
Volume group 2 injection cycle
J
Volume group 3 injection cycle
(j
Volume group 4 infection cycle
i
]
_i
i
i
i
*md
(1.-20):
(1.-20):
(1..-20J:
J
Q
(1...20):1
f" Equidistant kinetic cycles (all cycles are as long as necessary for the longest/latest injection or measurement to take place)
Timing E
Volume group 1 injection start time
IQL..1200.0 s): |"
2.0
Volume group 2 injection start time
(0...1200.0 s): f
TQ
Vojume group 3 injection start time
(0. .1200,0 s):
[
oT
Volume group 4 injection sta^t time
(0...1200.0 s):
f
tffteQfcfe:
Ivte3s. start time = 0.D s
Vbl.gr.1 inj. time = 2.0 s
Vbl.gr.2inj. time = 7.D s
10
delay
Start inj. 1
12
14
Start injection 2
Start measurement
OK
j Check timing]!. Total measurement time: [~ 5m23s
Cancel
Help
iiiiiSiiiiiiiiiiiiiiiiiiiiiiiiiSl
Note:
Only the input elements for volume groups, where a pump is defined in the
corresponding layout definition, are available (see chapter 4.6).
Injection Cycles
Volume group 1 injection cycle
The cycle in which the injection of volume group 1 will be performed. The defined cycle
number cannot be greater than the number of cycles defined.
Volume group 2 injection cycle ... Volume group 4 injection cycle
Same for volume group 2 ... 4.
Equidistant kinetic cycles
If you use this option, the cycle time for all cycles is as long as the cycle with the latest /
longest injection or measurement requires - otherwise the time for all cycles without
injection can be smaller.
Start Times
Using the Start Times box, it is also possible to meet special requirements regarding
timing on one well in a slow kinetic. The start of the injection(s) or of the measurement (in
Basic Parameters or Kinetic Windows sheet) can be delayed up to 1200 seconds on each
well after the time when the well reaches the measurement position and the positioning
delay is over.
2002-11-15
0413F0003A
61/123
FLUOstar*OPTIMA
Software User Manual
BMG Labtechnologies
Volume group X injection start time
Defines the time when the injection of volume group 1, 2, 3 or 4 is initiated, relative to the
time when the measurement position is reached, plus positioning delay.
Example: The following scenario would be possible with this method:
•
Inject the volumes defined in volume group 1 in the first cycle at 0.7 s
•
An incubation time of 10 minutes could be realized by setting the cycle time of the first
cycle (kinetic window 1) for 600 s.
•
Inject the volumes from group 2 in the second cycle (10 minutes later) at 0 s and the
volumes from group 3 in the same cycle at 2 s (which then will take place just after the
volume group 2 injection).
•
The measurement could be started at 4 s. This will then be directly after injection 3 (the
measurement will start in all kinetic cycles at the same time).
Measurement
Pumpi
I
qycl.1
Pump 2
•Hcvcl.2
.2
(]
0.5
1
1.5
;i
2.5
;3
3.5
4
4.5
s
Legend
H I Measurement
|
I Volume gioup 1
m i Volume gioup 2
| ^ | Volume gioup 3
62/123
0413F0003A
2002-11-15
BMG Labtechnologies
FLUOstar*OPTIMA
Software User Manual
4.7.2 Injection Timing - Well Mode
Click on the 'Injection Timing' tab in order to define the injection times:
Well Mode (Fluorescence)
Basic Parameters j Kinetic Windows j Layout ] Concentrations /Volumes / Shaking
Volume group 1 injection start time
(0...1200.0 s): [
7.0
Volume group 2 injection start time
(0...1200.0 s): |"
2.0
Volume group 3 injection start time
(0... 1200.0 s): f
2.0
Volume group 4 injection start time
(0... 1200.0?): f"
0.0
Injection Timing J Timing Overview j
/ JMBWTny^ £ j
Meas. start time 1 = 0.0 s
Vol. group 1 inj. time = 7.0 s
Vol. group 2 inj. time = 2.0 s
'O
2
4
6
8
10
12
Posit. I
delay I
^ a r * ' n J- ^
^ a r * injection 1
Start measurement 1
Check timing I
Total measurement time:
OK
9m30s
Cancel
Help
Volume group X injection start time
Defines the time the injection for volume group 1, 2, 3 or 4 is initiated, relative to the time
when the measurement position is reached, plus positioning delay. The time can be before
the beginning of the measurement (Measurement start time > Volume group X injection
time), it can be during or after the measurement. You can only define the injection time for
those volume groups, where volumes are defined and a pump is selected in the
'Concentration / Volumes / Shaking' sheet.
Time-optimized measurement
If a kinetic test run with time optimization is defined, then two consecutive wells are
processed at the same time. This mode is especially useful when there is a long
incubation time between e.g. an injection and the measurement. An injection into a well is,
in this case, immediately followed by an injection into the next well. Then the first well is
measured followed by the second well. By injecting into the next well in the sequence, the
incubation time of that well is underway during the measurement of the first well. The
ability to use Time-optimized measuring is contingent on the injection and measurement
start times, as well as on the duration of each action. This mode is only possible when
there is a lag time between different actions; this delay time must be longer than the time
necessary to perform all actions.
2002-11-15
0413F0003A
63/123
FLUOstar*OPTIMA
Software User Manual
V1
0 I
V2
\ move to
\ well i + 1
\
move to t
well i /
V1
BMG Labtechnologies
Well i
Measure
P2. m8
\ move to
\well i + 1
i p2V2 m.
/
Measure
1
Well i + 1
•
8
Example for well mode test with time optimization
V1
V2
p1 s
p2s
ms
64/123
Injection of volume 1
Injection of volume 2
Volume group 1 injection start time
Volume group 2 injection start time
Measurement start time
0413F0003A
2002-11-15
BMG Labtechnologies
FLUOstar*OPTIMA
Software User Manual
4.8 MultichromatJcs
When you choose to analyze more than one fluorophore per well (well mode or plate
mode), you must define the filter combinations for each fluorophore. First enter the number
of fluorophores to be analyzed ('Basic Parameters' sheet) and then click the arrow key or
the 'Multichromatic' tab. A new sheet will appear:
Plate Mode (Fluorescence)
Basic Parameters | Kinetic Windows j Layout} Concentrations / Volumes / Shaking | Injection / Timing Multichromitic | Timing Overview (One cycle) |
Number
Excitation filter
320
390
J485
Check timing I
d
d
d
zl
d
d
d
Emission filter
[405
460
460
Gain
rO...4O951
Integr. start
fO... 1510 us]
Integra time
I'lO... 1510 u.s|
;, 12
d
d
d
d
d
d
d
d
:• 1 2
12
'•: 12
12
f 12
OK
Total measurement time: 33rn20s
Cancel
Help
Now you can use the pull-down menu in each row to define the filters. The filters shown in
the pull-down menu are listed as they are defined in the 'Setup | Filter' section (see
chapter 3.1.3 Filters).
It is possible to define the gain for each filter combination. The gain is the amplification of
the signal in the PMT. This function allows you to optimize the sensitivity for each assay.
Enter the gain manually (from 0 to 4095) or perform an automatic gain adjustment for each
filter combination before the measurement (see chapter 6.2 Gain Adjustment).
2002-11-15
0413F0003A
65/123
FLUOstar*OPTIMA
BMG Labtechnologies
Software User Manual
4.8.1 Multichromatics in Time-Resolved Fluorescence
Using the Multichromatics function, you can determine the optimal integration time for a
time-resolved assay. Using one time-resolved fluorophore, you can define the same filter
combinations for all 8-filter settings and define 8 different integration times. You can then
compare the data in the evaluation part to find the optimal time for the fluorophore.
For example,, if you were using Eu3+, you would define all 8-filter settings as TR-EX and
TR-EM. You can keep the integration time constant and vary the integration start time in
order to find the optimal start time. You can then keep the integration start time constant
and vary the integration time to find the optimal measurement time.
IPIate Mode [Fluorescence]
riraaafl-Lwotrt|'Concentfaeoris/VolQmesf-Shakihgj
Saih-
-tfitegr, start
KUSfDwl
zl
[trem
trex
d
| trem
j (rex
ll
trem
j trey
100
Jtrem
'jtrex
d
zl
400
20C
400
40C
50C
trex
trem
" B
''jtrex
trem
400
7
' jtrex
jtrem
400
Itrex
zl
| trem
@ifeck thrwnjy 1
66/123
lntedr. time
fl0...1510us1
OK
0413F0003A
Canc'el
Help
2002-11-15
BMG Labtechnologies
4.9
FLUOstar*OPTIMA
Software User Manual
Timing Overview
After clicking the 'Check timing' button (lower left corner of the test protocol definition
window), the following sheet will become available:
Well Mode (Fluorescence)
Basic Parameters j Kinetic Windows | Layout j Concentrations /Volumes /Shaking) Injection Timing Timing Overview
Measurement
Pump!
r
Pump 2
•
(]
1
Legend
H H . Measurement (Kinetic window 1 ...4]
I
I Volume group 1
BUffl Volume group 2
m
Volume group 3
H H Volume group 4
Shaking
i\
)
Kinetic windows
Start
Stop
Os
|1.5S
1.6s
|1.9S
6.1s
'
i5
E)
Pump actions" Injections
Start
Stop
; Start
Stop
1.5s
|5.8s
2
-
3 2s
3.1s
4
-
Shaking
Start
Stop
1.5s
2.8s
2.8s
-
-
'-
2s
S
3.1s
•
-
-
5.8s
-
* incl. shaking after injection
The volume group 3 injection time should be higher than 5.8s to avoid overlap with injection 1 (using the same
pump).
.
Check timing I Total measurement time: 27m39s
OK
Cancel
Help
In this sheet, you can see a graphic overview of the measurement and all injections for
one well. (For plate mode tests, all actions are displayed in the timing overview of one
cycle. The displayed injections may occur in different cycles, as defined under 'Injection /
Timing'. The cycle used will be listed behind each injection bar.)
If there is a timing problem, e.g. overlapping injections using the same pump this will m
be marked by an exclamation mark and a description will inform you about the origin m
of the timing problem.
In addition, you will see tables containing the timing for measurements and the injection
times. If you use the 'Shaking after injection' option (definable in the 'Concentrations /
Volumes / Shaking' sheet), you will see these times as well.
Note:
The pump action times listed include time for shaking.
An injection action can contain different steps:
Injection Shaking
Injections are not possible during shaking.
2002-11-15
0413F0003A
67/123
FLUOstar1'OPTIMA
BMG Labtechnologies
Software User Manual
4.10 Absorbance Tests
You must select the absorbance mode in the reader configuration window (see section
3.1.1) before defining an absorbance measurement protocol.
Most test parameters are similar to those listed in fluorescence mode (see chapter 4.3
Plate Mode Fluorescence Tests or 4.4 Well Mode Fluorescence Tests). You can still
choose Well mode or Plate mode.
Plate Mode (Absorbance]
Baste Pawraefsrs-1 Le$ttut | Concentration? / Volumes / Shaking | Injedtion / Timing | Timing Overview (One-cycle}}
Teslfiam* '
TE'T
|EMr, ^TECHNOLOGIES 96
PosMohinffjjefay
(01 1.0*}:
10
|A-405
320
wI
No/of cyfefts
(1 250): |
Measurement start lime
gain (0...4095):
Emission filter
| empty
jrj
| 342
EacataKon filter
[1..4J:
1
2.
^
J485
fO 1200.0*}: | (To"
No offlashesper well and cycle
Cycle Jime
(0 .200). J
(1 10000 s)- I
26 s
£heck ttmino | Total measurement hme \
20~
(1...8): pTjfJ
No.«fnyGchtomatics
T
"1A-492
1 A-620
Stop
P..1*
r^
JZ.
2?
Pause before cycle
(0. .1)-
0 for I
26 s
d ceccnds
OK
Cancel
Filter settings
Important parameter for absorbance mode is the filter setting. The absorbance filter should
be in a position on the excitation side. The emission side should have a position defined as
'empty'.
No. of flashes
In absorbance mode the number of flashes should be defined as at least 20 to minimize
the deviation from flash to flash.
Positioning delay
The positioning delay should be defined as at least 0.5 seconds.
Multichromatics
Define up to 8 filter settings for multiple absorbance analysis. Select 280 and 260
excitation (absorbance) filters for DNA absorbance.
68/123
0413F0003A
2002-11-15
FLUOstar*
BMG Labtechnologies
Software User Manual
OPTIMA
4.11 Luminescence Tests
You must select the luminescence mode in the reader configuration window (see section
3.1.1) before defining a luminescence protocol.
Luminescence can be measured in plate or well mode. Most parameters are similar to
fluorescence protocols (see chapter 4.3 Plate Mode Fluorescence Tests or 4.4 Well Mode
Fluorescence Tests). Multichromatic measurements are possible.
Plate mode (Luminescence)
Basic Parameters j Kinetic Windows j Layout ] Concentrations/Volumes/Shaking) Injection/Timing] Timing Overview (One cycle) |
Testjiame:
;
[IHIfiWIMI
Microplate:
BMG LABTECHNOLOGIES 96
Catmxsnt
zl
Fitter Ss(tit)gs
(0.1 ...1.0 s):
Positioning delay
05
No. of multichromatics
(1...8}:j7j»J
£mission filter:
Gain (0...4095):
(1...4):
No. of kjnetic windows
| empty
(1...250): f
No. of cycles
Measurement start time
(0...1200.0 s): \
Measurement interval time
(0.02...100s): f
Cycle time
(1...100Q0s): \
Minimum cycle time 1:
Check timing j
2350
oT
0.10
30~
Start (1...10):
Stop (1-10):
Time to normalize the results
Pause before cycle
30 s
Total measurement time:
|
zl
10
(0... 10):
10
(0.02...100 s, O=off):
0 for I
TM
0 seconds
OK
5m00s
Cancel
Positioning delay
At least 0.2 seconds are recommended for luminescence tests.
Measurement interval time
Defines the measurement time (defines how long the light is measured). By increasing this
time, you will get higher (and usually more accurate) measurement values.
Interval time (only in well mode)
You can define the duration of each interval from 20 ms to 25.0 seconds. When the
instrument is active, you can click the 'Check timing' button and the interval time is
automatically validated by the instrument. If you do not use multichromatics, the minimum
interval time is equal to the defined measurement interval time. If you use multichromatics,
the minimum interval time is equal to the defined measurement interval time multiplied by
the number of multichromatics plus the time necessary to switch the filters.
If you want to increase the interval time (if you want a delay between the intervals), you
can enter a time manually. If you have defined an interval time in any of the kinetic
windows which is shorter than the respective minimum interval time, it will automatically be
corrected to the shortest possible value. If necessary, the start times for following kinetic
windows will also be corrected.
2002-11-15
0413F0003A
69/123
FLUOstar*OPTIMA
Software User Manual
BMG Labtechnologies
For example, the instrument gives a minimum interval time of 0.1 seconds, but you can
change this to 0.2 seconds so that there will be a delay of 0.1 seconds between intervals.
Time to normalize the results
As the measurement values depend on the measurement interval time, it is usually a good
idea to normalize the measurement values. This will allow you to compare the
measurement values of test runs using different measurement interval times. This will also
allow you to compare the results of different kinetic windows using different measurement
times. To switch off the normalization enter 0 here.
Example:
When you set the Time to normalize the results to 1.0s (to get the results in
counts per second) and use a Measurement interval time of 0.1s the raw
measurement values will be multiplied by 10.
Emission filter
It is possible to choose an emission filter or use an 'empty' position to measure without
filter.
70/123
0413F0003A
2002-11-15
FLUOstar*OPTIMA
BMG Labtechnologies
Software User Manual
4.12 Fluorescence Polarization Tests
Before defining a fluorescence polarization test protocol you must select the fluorescence
polarization mode in the Reader Configuration window (see section 3.1.1).
Fluorescence polarization can be measured in plate or well mode. Most parameters are
similar to fluorescence protocols (see chapter 4.3 or 4.4). Multichromatic measurements
and injections are not possible.
Plate Mode (Polarization)
Basic Parameters j Layout ] Concentrations /Volumes / Shaking} Timing Overview (One cycle
Cbmnienf
Test name:
|iaWBa«B^I
Microplate:
JGREINER 781091 UCLEAR 384
3
r /Stew a/trfZ/jfegrafot)
i? Standard
Positioning delay
P
(0,1.
.1.0s): f
1.0 .
Flying mode s.
(1-4): f T
No. of kjnetic windows .
-±J
Excitation filter:
^mission filter:
J485
J520
zl
(1.-250): |"
P...1200.0 s):
Measurement start time
No. of flashes per well and cycle
Minimum cycle time 1:
Check timing ]
f"
0.1
[Q...200J: |"
5b"
(1- ..10000 s):
Cycle time
|"
23
3'
HK-Factor:
Channel 2: | 2359
:j 1.002
Integration:
Start(0..,1510|Jis]: J"
0
Tirne(10...1510(j4 j
12
Stop fl-i^r 1
Start (1...1):
Pause before cycle
23 s
Total measurement time:
1
zl
Gain (0...4095):
Channel 1:| 2356
No. of cycles
I.
C Time-resolved
(0...1): j
0 for I
Q seconds
OK
23 s
Cancel
Filters
For polarization measurement, two identical emission filters should be installed in the filter
wheel positioned 180° from each other. When you select one filter, the other filter is
automatically selected.
Gain and K-Factor
You can specify a gain value for both channels. The necessary gain may differ slightly
between the channels.
The K factor is a fine adjustment for the two channels. It is best to perform an automatic
Gain and K factor adjustment right before test start (see chapter 6.2.3 Gain Adjustment Fluorescence Polarization).
No. of flashes
BMG Labtechnologies recommends 50 for the number of flashes for the most accurate
results. All flashes are averaged together for one intensity value.
Positioning delay
The positioning delay in fluorescence polarization tests is recommended to be 1 second,
so that the surface of the liquid is stable before measurement.
2002-11-15
0413F0003A
71/123
FLUOstar*OPTIMA
BMG Labtechnologies
Software User Manual
5 Priming / Incubation
5.1 Priming
The FLUOstar OPTIMA may have up to 2 pumps. Before starting a test run it is necessary
that all used injector pumps are initialized. This can be achieved by using the prime
function. The priming procedure needs to be repeated once after each program start.
Solutions for injections can be placed inside the reagent box.
To open the prime window, use the JMA button or choose the menu command 'Measure |
Prime1.
Note:
Before priming a pump, the injection needle must be removed from the
measurement head to prevent contamination of the instrument.
l ~ Invert dispensing function
F~ Insert dispensing function
Cancel
Prime pump'1
4
Pnrrift pyrnp 2
9
Help
Pump speed
The pump speed selected here will only be used for priming. The injection speed for test
protocols is defined in the 'Concentrations / Volumes / Shaking' sheet of the test protocol
definition window (see chapter 4.6).
Priming
It is necessary to fill the tubing with the dispensing solution prior to starting a
measurement. Place the tubing in the solution to be dispensed and place the injection
needle in a waste container. Do not leave the needle in the measurement head or you will
risk contamination of the instrument. Select the prime volume from 500 to 4500 JLLI. The
volume of the syringe is 500 JLLI, and a prime volume of at least 1000 \i\ is recommended
for priming the tubings and the syringe. A higher volume can be used for washing the
tubing after the measurements are complete.
After clicking on a 'Prime pump' button, a message will appear to remind you to remove
the injection needle from the measurement head. Repeat the procedure for all pumps you
want to use.
72/123
0413F0003A
2002-11-15
BMG Labtechnologies
FLUOstar*OPTIMA
Software User Manual
Back flush
If the pumps have been in use, it is important to flush out any solutions that could be
considered a contamination reagent (non contaminating reagent could be i.e. distilled
water or a water / alcohol solution). The back flush feature also allows you to conserve
expensive reagents, since the entire syringe can be emptied after use.
Invert dispensing function
The default position of the plunger is at the bottom of the syringe barrel. In this position,
the injection starts with the liquid in the syringe barrel being pumped through the tubing
and then the syringe is refilled as the plunger comes back down.
It is possible to change the order of the plunger's movements by clicking on 'Invert
dispensing function1. The plunger will begin at the top of the syringe barrel and the
syringe barrel will, in this case, first fill and then dispense through the tubing.
The invert function is helpful in cases where the solutions have particles or cells that may
settle at the bottom of the syringe barrel, and, therefore, will not be dispensed uniformly.
2002-11-15
0413F0003A
73/123
FLUOstar*OPTIMA
Software User Manual
BMG Labtechnologies
5.2 Incubation
5.2.1 Temperature Control
The incubation can be activated through the temperature button - i i J or by selecting
Temperature' under the 'Measure' menu.
The temperature range of the incubator is 25 °C to 45 °C (optional up to 60 °C). The
chosen temperature must be higher than the ambient temperature. The temperature can
be set in 0.1 °C increments. The temperature can also be monitored without activating the
incubator (see Temperature Monitoring Feature below).
You can enter the temperature manually or toggle to the desired temperature using the
arrow buttons.
Temperature Control
Temperatureflionitdringwithout-incubation I
Help
Click on 'Incubator on'. The temperature indicator in the toolbar of the control software
will be activated. The indicator will be red until the selected temperature is reached, then
the indicator turns green.
It is possible to perform a measurement before the target temperature is reached. In the
Excel data reduction, the current temperature for each kinetic point during the measurement is displayed in the raw data worksheet.
The 'Incubator on' button changes to 'Set new temperature' if you select a new target
temperature during incubation.
5.2.2 Temperature Monitoring Feature
It is possible to monitor the instrument's temperature without using the incubator. The
temperature sensor of the incubator will be activated and update the temperature display.
Click the Temperature monitoring without incubation' button. The temperature will
appear on the temperature display in the control software. When using this function, the
indicator color will be cyan. The temperature will also be stored with the measurement
data and displayed in the Raw Data Worksheet of the evaluation software (see chapter
7.3).
74/123
0413F0003A
2002-11-15
BMG Labtechnologies
FLUOstar*OPTIMA
Software User Manual
5.2.3 Auto Power On Incubation
When you click the 'Use above setting after auto power on', the currently selected
temperature value will be used as the default target temperature for the incubator.
If you have defined a value within the allowed temperature range, the built-in incubator will
be automatically switched on the next time the reader is switched on. Using this function,
the incubator will be turned on even without starting the FLUOstar OPTIMA software.
By using a target temperature of 00.1 °C (selected e.g. by clicking the Temperature
monitoring without incubation' button), only the temperature monitoring function is
switched on by default, the heating plates will not be used.
To switch off the auto power on incubation function, select a target temperature of 0°C
(either by clicking the 'Off' button or by manually entering this value), and click the 'Use
above setting after auto power on' button.
2002-11-15
0413F0003A
75/123
FLUOstar*OPTIMA
BMG Labtechnologies
Software User Manual
6 Performing a Measurement
Test runs are performed by selecting the menu command 'Measure | Measure' or by
using the
w I button.
A window displays all the defined protocols for the selected configuration, i.e. fluorescence
mode.
Test Protocols
Micropfate
Protocol Name
Mode 1
Config
CATEST
BMG LABTECHNOLOGIES 96
Well
F2
BMG LABTECHNOLOGIES 96
Plate
Fluorescence
BMG LABTECHNOLOGIES 96
Plate
Fluorescence
Fluorescence
0 FLYING W/INJECTION
Fluorescence
BMG LABTECHNOLOGIES 96
Well
:BMG LABTECHNOLOGIES 96
Plate
Fluorescence
TOM'S PLATE MODE TST
BMG LABTECHNOLOGIES 96
Plate
Fluorescence
TOM'S WELL MODE TST
GREINER 384
Well
Fluorescence
POWER-MODE
QCTEST
OK
[±J
J
Cancel
Double click on the desired protocol or select the protocol and click 'OK'. Click 'Cancel' to
return the main menu.
Note:
To select the first protocol, beginning with e.g. T , simply press the key [T].
76/123
0413F0003A
2002-11-15
BMG Labtechnologies
FLUOstar*OPTIMA
Software User Manual
6.1 Plate Identification
After selecting the test protocol, the next window gives you the option to add identifiers to
the test, to perform a gain adjustment or to start the measurement.
This is an optional feature that allows you to give the plate specific identifying features
such as a title, a description, or a number. Three identifiers with up to 20 alphanumeric
characters are possible. The drop down menu for each identifier allows you to choose
several options for the IDs or you can manually type in a description.
! Start Test Run
Plate IDs | Gain Adjustment | Sample IDs / Dilution Factors |
Selected protocol: T O M ' S T E S T
Clear IDs
,D1:
pm
|D2:
|PlateNo.:<1+Ptttt>
ID3:
|<date>,<time>
d
Get last IDs
zl
W Automatically enter previous plate IDs when using same test protocol
No. of executed runs since program start: 1(3
Total no. of executed runs: 185
Please ensure a microplate is inserted!
Sjart test run I
Save & Close I •
Run statistics:
Cancel
Help
Options
<protocol>
The name of the used test protocol will be entered.
Consecutive numbers for each test run (with the same test name) will be
automatically entered. You can manually change the start number in the
space 'No. of executed runs since program start.' The number of digits to be
used can be changed by adding '#' characters, i.e. using <1+###> 001, 002,
003, etc. will be generated.
To use the Total no. of executed runs' instead of the number of executed
runs after program start, add a T before the '#', e.g. <1+T####>.
To use the 'No. of executed runs for the used test protocol', add a 'P' before
the '#', e.g. <1+P##>. You can see a Run Statistics after pressing the JBJ
button (see section 3.3.4).
Counting down is also possible, use a '-' instead of the '+'.
<A+#>
Same concept as consecutive numbers using the alphabet.
Example: <A+###> -*AAA, AAB, AAC ...
2002-11-15
0413F0003A
77/123
FLUOstar^OPTIMA
<date>
Software User Manual
BMG Labtechnologies
The date of the test run.
You can specify the date format if you add a format description after "<date:"
using yy or yyyy for the year, m or mm for the month and d or dd for the day:
yy
yyyy
m
mm
mmm
mmmm
d
dd
ddd
dddd
ddddd
year with two digits (1999 ^ 9 9 , 2000 ~
year with four digits
one or two digits for the month (January - • 1, December - • 12)
month with two digits (January ->01)
abbreviated name of the month (January Jan.)
full name of the month
day with one or two digits
day with two digits
abbreviated name of the day (Monday - *
full name of the day
date in the format defined as "Short Date Format" under windows
('Settings | Control Panel | Regional Settings')
dddddd
date in the format defined as "Long Date Format" under windows
Example:
<date:yyyy_mm_dd>
If you do not specify the format, the date format defined as "Short Date
Format" under windows will be used.
<time>
Time of the test run.
You can specify the time format if you add a format description after "<time:":
h or hh
for the hour
m or mm for the minute
s or ss
for the second
t
time in the format defined as "Short Time Format" under windows
('Settings | Control Panel | Regional Settings')
tt
time in the format defined as "Long Time Format" under windows
am/pm or a/p or AM/PM or Am/Pm
use 12 hours format and show am or
pm (a or p...)
Example: <time:hh.mm.ss>
If you do not specify the format, the time format defined as "Long Time
Format" under windows will be used.
Clear IDs
Delete the plate IDs that are entered.
Get last IDs
Recall the ID settings used for the last test run performed by the user currently logged in.
Automatically enter the previous plate IDs when using same test protocol
If this box is checked, then the same plate identifiers will be entered automatically when
using the same protocol. You can still edit the identifiers or use the 'Clear IDs' button.
78/123
0413F0003A
2002-11-15
BMG Labtechnologies
FLUOstar*OPTIMA
Software User Manual
6.2 Gain Adjustment
By clicking the tab for Gain Adjustment, the sheet with the gain settings and the layout
defined will appear.
The purpose of a gain adjustment is to optimize the signal amplification so that the results
have the maximum sensitivity and dynamic range. The gain is usually performed on the
well containing the standard with the highest concentration of fluorophore (highest
intensity). This sets the gain so there is no overflow in the higher intensity wells (an
overflow means the relative fluorescent units of a well exceeds the maximum range, i.e.
65,000 rfu).
Zoom Feature
For 384 and 1536 well formats, the gain adjustment screen has a zoom function, allowing
you to zoom in a certain section of the layout. To zoom in and out of the screen use the
icons.
The gain adjustment window is specific for each configuration. The parameters for different
test modes are described on the following pages.
6.2.1 Gain Adjustment - Fluorescence and Luminescence Mode
Start Test Run
Plate IDs ^Gain Adjustment ] Sample IDs / Dilution Factors
fiequired value:
Filter setting:
n
Excit.
1 320
2 390
3
991
Emiss.
Gain
405
2782
4G0
605
96
1
A
3
A
B
XI
X2
X3
X4
X5
B
S1
X9
XI0
XII
X12 XI3
C
S2
X17
O
S3
E
5 | 6
9
10
XB
X7
XB
B
XI4
XI5
X16
SI
XI8
X19 X20 X21 X22 X23 X24
S2
X25
X2G
X27 X28 X29 X30 X31
X32
S3
S4
X33
X34
X35 X3G X37 X38 X39 X40
S4
F
S5
X41
X42
X43 I X44 X45 X46 X47 X48
S5
G
SB
X49
X50 X51 X52 X53 X54 X55 X56
SG
H
B
X57
X58
2
7
X59 X60 X61
8 :
XG2
XG3
11
XG4
12
B
gain adjustment (well)
Please ensure a microplate is inserted!
Start test run] Save & Closet
Cancel
j
Help
The filter settings are displayed on the left (in luminescence mode there are no excitation
filters, only emission filters). If the protocol is multichromatic, then all filter combinations
used will be displayed (you can perform a gain adjustment for each filter set).
Automatic Gain Adjustment for one Well
Select a well for gain adjustment, then click the 'Gain adjustment (well)' button. The
instrument samples the well eleven times in 3 seconds to find the optimal gain. The
optimal gain value appears in the box next to the filter settings.
2002-11-15
0413F0003A
79/123
BMG Labtechnologies
FLUOstar* OPTIMA Software User Manual
'Stop' will terminate the gain adjustment process.
Automatic Gain Adjustment for the entire Plate
There are occasions when a well gain adjustment is not possible, for example, when the
well with the highest intensity is not known. You can then do a gain adjustment on the
entire plate. The instrument finds the well with the highest intensity and determines the
gain. Click on the blue microplate format number in the top left corner of the layout (i.e. 96
or 384). All wells are selected and the caption of the gain adjustment button changes to
'Gain adjustment (plate)'. Click this button and the instrument will return a gain value in
the box next to the filter settings.
Note:
An automatic gain adjustment for the entire plate is not possible for 1536 well
plates.
6.2.2 Gain Adjustment - Absorbance Mode
In absorbance mode, the gain is determined when the instrument measures the full
transmission of light (0% absorbance). The gain is dependent on the filter wavelength
used.
During the gain adjustment procedure, the plate carrier moves out of the way of the optics
and the instrument samples the full transmission of light.
Start Test Run
Plate-IDs
Sain Adjustment | Sample IDs / Dilution factors |
Measurement Value tor 0% absorption (100% transmission):
[382
unnii
390
3_ 485
4_ 544
empty
mm,
327
429
empty
13G0
empty
gain adjustment
R ¥ « l ^ ^rreure ft micropla*& is msertetll
. Start t&tfun
Save & Dose I
Cancel
I
Stop
I
Help
The gain sets the optimal signal amplification to achieve optimal sensitivity. Perform the
gain adjustment on the well with the highest intensity.
It is also possible to perform a gain adjustment for the entire plate as described above.
'Stop' will terminate the gain adjustment process.
80/123
0413F0003A
2002-11-15
FLUOstarhOPTIMA
BMG Labtechnologies
Software User Manual
6.2.3 Gain Adjustment - Fluorescence Polarization
Gain adjustment for polarization requires some extra parameters.
Start Test Run
Plate IDs Gain Adjustment | Sample IDs / Dilution Factors |
Required value: |9tT% j j j
Jarget mP;
(0...500)
He
Channel 1: J1484 j-j
Channel 2: I1497 - M
K-Factor:
96
1
2
3
4
5
6
7 | B
9
10
11
12
A
;.-.si
SI
S1
S1
SI
SI
B
SI
SI
S2
S2
si
SI
C
S3
S3
D
S4
S4
E
S5
S5
F
SG
SG
G
S1
S1
S7
S7
S1
S1
H
S1
S1
B
B
S1
SI
gain adjustment
Pleq.se ensure a microplate is inserted!
Start test run I
Get K-Factor,
Save & Close V
Cancel
Stop
Help
Gain
There are two PMTs (photo multiplier tubes) involved in polarization, one for channel 1
(vertical light) and one for channel 2 (horizontal light). As with standard fluorescence, you
want to perform the gain adjustment on the well with the highest concentration of free
fluorophore. Because the relationship between channel 1 and 2 determine polarization, it
is important that the two channels are optimized for the best results. Select the desired
well and click on 'Gain adjustment'. The automatic gain adjustment calculates the gain
settings needed to reach the required value (in percent of the measurement range) for
each channel. The required value you enter in this window is used as target value for
channel 1. An optimal value for channel 2 is calculated automatically based on the entered
Target mP (see below). After performing the gain adjustment, the K factor is calculated
automatically.
K-Factor
The K factor is used for fine adjustment of the two channels. During calculation of the
polarization (and anisotropy) values the measurement results of channel two are multiplied
by the K factor as a correction factor for the difference in the two channels.
Target mP
It is recommended to use free fluorescein for adjustment of gain and K factor, but it is
possible to use other fluorophores or labeled biomolecules. The theoretical polarization
value for free fluorescein is 35 mP. Enter this value in the field Target mP'. In case you
use a different fluorophore or a labeled biomolecule, you need to use the theoretical mP
value of this molecule as Target mP'.
2002-11-15
0413F0003A
81/123
FLUOstar*OPTIMA
Software User Manual
BMG Labtechnologies
Now, when you perform a K factor adjustment on the well with the highest concentration of
free fluorophore, the result of that well will become equal to the target value entered (so for
fluorescein the polarization value of the well is equal to 35 mP).
After a gain adjustment, the K factor is automatically calculated, but it is also possible to
perform a K factor estimation without a preceding gain adjustment (using the predefined
gain values) by pressing the 'Get K-Factor' button. The two intensity values of channel 1
and channel 2 are measured using the two gain values and a K factor is given.
To reduce the influence of intensity deviations it is recommended to use a K factor near
1.0. To increase the K factor you should decrease the gain value of channel 2, to decrease
the K factor you should decrease the gain value of channel 1.
Custom Target mP value
If you are using a different fluorophore or a fluorescein-labeled peptide (bound
fluorescein), you must change the Target mP' value. If you do not know what this value
should be, you can start with, for example, 35.
Perform a gain adjustment / K factor estimation as described above.
Start the measurement. After the measurement is complete, look at the Excel worksheets
for the test run. If the results are negative, then you must increase the target value.
Increasing the target value will shift the results to the positive range.
6.2.4 Required Value
The measurement range for fluorescence is 0 to 65,000. If an overflow occurs, the
measurement value will be 65,000. The measurement range for luminescence depends on
the measurement interval time (max. 200,000,000 for 100 s). To avoid an overflow, it is
necessary to set that the gain so the values stay within the range of the instrument.
In the top left corner of the gain adjustment screen is a 'Required Value' number. This
value refers to the percentage of the maximum value of the dynamic range. The default
value is 90%. Therefore, when you perform a gain adjustment on the well with the highest
concentration of fluorophore, the result will be 90% of the maximum fluorescence value,
i.e. 65,000 x 0.90. This prevents an overflow in case of deviation of the intensities over the
plate.
Required value:
If the measurement is an endpoint test, then the required value can remain at the default
value of 90%.
For a kinetic assay, an injection can increase the intensity values over the entire plate. If
you do not know the final results you should lower the required value to 50% (or less) of
maximum value in order to have enough space for higher intensity values and to prevent
an overflow.
82/123
0413F0003A
2002-11-15
FLUOstar1'OPTIMA
BMG Labtechnologies
Software User Manual
6.3 Sample IDs / Dilution Factors
You may enter identification values for each well in this sheet. These values will be shown
in the Sample IDs sheet and in the Evaluation sheet (when 'Sample IDs' is selected in the
pull down box) of the FLUOstar OPTIMA evaluation part. It is also possible to store these
IDs together with the measurement results in an ASCII file (see chapter 0).
In addition, it is possible to define dilution factors for all wells which does not contain
blanks or standards. The dilution factor will be taken into account when calculating the
unknown concentrations (see chapter 7.7 Standard Curve Worksheet).
Note:
If you are using replicates, the sample ID and the dilution factor you entered for
one well will be used for all replicates.
Start Test Run
Plate IDs I Gain Adjustment
Sample IDs / Dilution Factors I
Well
Content
A1
XA1
A2
XA2
Probe 008/2
A3
XA3
XB1
Probe 008/3
Probe 009/1
2
B2
B3
B4
XB2
XB3
Probe 009/2
Probe 009/3
2
2
XB4
Probe 009/4
2
C5
CG
XC1
Probe 010/1
2.5
XC2
Probe 010/2
2.5
C7
XC3
Probe 010/3
2.5
B1
Sample ID
i Dilution
1
H
Clear IDs
Get last IDs
1
1
J
Table sort order:
| Content
Print ID list
import IDs J
J7 Automatically enter sample IDs previously used with this test protocol
| 7 Export/ Print also lines without sample ID entry
3
£xport IDs
[<7 Include dilution (actors when exporting:/ printing
I
j
Save & Close]:
|
Cancel
I
Help
Clear IDs
Pressing this button will clear all ID fields.
Get last IDs
By clicking this button you can recall the last IDs used for the selected test even if you did
not use the option 'Automatically enter sample IDs previously used with this test protocol'
(see below).
Table sort order
You can choose between sorting for rows, columns or well content. The selected sort
order will also be used for printing or exporting the sample ID / dilution factor list.
Print ID list
You can print out the ID list on any available printer.
2002-11-15
0413F0003A
83/123
FLUOsta^OPTIMA
Software User Manual
BMG Labtechnologies
Import IDs
Import sample IDs / dilution factors from a text file (created using the export function or
using a text editor like Notepad) or from a XLS (Excel format) file.
Format for Sample ID text files:
In the first column of such a file, there is the well number (e.g. 'A1'), the sample ID for this
well should be in the same line beginning with position 12. If you want to include dilution
factors, these values should be entered beginning at position 44.
Format for Sample ID Excel files:
A
X Well
.2 B2
3 B3
B4
"4.
B5
5
C2
6
C3
7
C4
8
C5
9
B
Content
X1
X2
X3
X4
S3
S4
B
B
|
C
Sample ID
Probe 007.1
ProbG 007.2
Probe 007.3
Probe 007.4
Standard 50%
Blank
Blank
D
Dilution
2
2
0.5
1
1
1
1
1
The well order in the files does not matter. If there are no dilution factors included, the
dilution factors entered so far will not be changed.
Export IDs
Export current sample IDs (and if the appropriate option described below is selected also
the dilution factors) into a text or XLS (Excel format) file.
Automatically enter sample IDs previously used with this test protocol
If this option is checked, then the last used sample IDs for the selected test protocol
automatically will be reentered as default values.
Export / Print also lines without sample ID entry
If this option is checked, all lines will be exported or printed, otherwise only the lines where
a sample ID was entered would be exported or printed. When exporting into an Excel file,
all lines will always be exported.
Include dilution factors when exporting / printing
If this option is checked the dilution factors will also be exported or printed.
Note:
Exporting the table into a HTML file (in addition to the XLS or ASCII format) is
possible after right clicking the table.
The settings from this window are user specific, therefore each user can select his
preferences independently.
84/123
0413F0003A
2002-11-15
BMG Labtechnologies
FLUOstar*OPTIMA
Software User Manual
6.4 Measurement
After entering IDs / performing the gain adjustment, you have the following options:
Start test run:
Begins the measurement using the defined gain.
Save & Close:
Saves the results of the gain adjustment, the ID settings and the
dilution factors and return to the main menu without performing a
measurement.
Cancel:
Closes this window without saving the gain adjustment results and ID
settings and without starting the test.
6.4.1 Time Duration
On top of the main program window, there is a time gauge indicating the elapsed time of
the test. The remaining time will be displayed above the time gauge. It is updated
dynamically during the measurement.
s= FLU O star* OPTIMA
Setup
Jest Setup
Measure
BMGLabtecfmologies
jResults
JHelp
If you move the mouse cursor to the time gauge, a small window with additional timing
information will appear.
Total test run time:
Elapsed test run time:
2 min 15 s
39 s
Current cycle:
2 of 3
Total time for current cycle: 50 s
Remaining cycle time:
42 s
6.4.2 Stopping the Test Run
It is possible to stop a measurement procedure after it has started by pressing the stop
button. If there is already measurement data available, a dialog box will ask if you want to
save the incomplete data.
2002-11-15
0413F0003A
85/123
FLUOstar*OPTIMA
Software User Manual
BMG Labtechnologies
6.5 Current State Graphics
6.5.1 Current State Overview
When the measurement has started, the 'Start Measurement' button will change to the
'Current State Graphics' JL^J button. This function allows you to view raw data graphically
as the measurement occurs.
|10:45127
V
3
6
8
9
10
n
12
Mrc
. it
^
The Current State window displays a grid of the microplate format. The measurement
results can be displayed as curves: Each measurement value is represented by a dot and
you can see the relative position of the values. You can choose between a curve of points
or lines. It is also possible to display the measurement values of the last measured cycle /
interval numeric or use colors for a fast overview (see 6.5.2 Current State Options).
Current cycle:
Shows the number of the cycle currently being measured
(only for plate mode tests).
Well:
Shows the name of the current well (only for well mode
tests).
Display cycles / intervals:
Kinetic points that will be displayed. This can be changed
manually, otherwise the default number of cycles / intervals
as defined in the test protocol will be used.
Options:
Opens the 'Current State Options' dialog box.
Timing:
Opens the 'Timing Overview5 window.
Save:
Saves the data as bitmap (windows BMP format or JPEG
format).
Print:
Prints the screen on any available printer.
Close:
Closes the current state window.
86/123
0413F0003A
2002-11-15
FLUOstar1^OPTIMA
BMG Labtechnologies
Software User Manual
If you are using layout groups (see chapter 4.5.1), the layout grid will be displayed using
the background colors belonging to the layout groups used. When you move the mouse
pointer over a well, the well content (e.g. 'SA1') will be shown for a few seconds.
You can double click on a square to get a zoomed view of the measurement values (see
chapter 6.5.3).
6.5.2 Current State Options
After clicking the 'Options' button in the Current State window, the following dialog box will
appear:
Current State Display Options
Display mode:
IThree colors
Curve
~ CisrsntStsfeOk Measurement values of last measured cycle / interval
i • -i »•
n i I Auto (values if only one cycle / interval exists, otherwise curve)
L.m.tat.ons: Only| j
^
^
Range:
Color gradient
f g Layout
20000I Reading order of the wells
Mirv.
LJpdate display:
1 every second
J[j
0
(for plate mode tests)
Polarization mode: j show raw data from both channels
f " Use blank corrected values
Close
Help
Display Mode
The measurement results can be displayed as:
Curve
The measurement results can be displayed as a curve of points or lines. If there is more
than one chromatic used (multichromatic, more than one filter pair), you will see the results
of all chromatics displayed together.
Measurement values of last measured cycle / Interval
You will see the last measurement values in numeric style. Due to space limitations, only
the results for up to two chromatics (filter pairs) will be shown (the first two). To see values
from an earlier cycle / interval, you can change the number in the Cycles / Intervals input
box of the Current State window.
Note:
When you use this option in plate mode with an update display setting (see below)
of more often than 'only after a cycle is completed', for all wells, which are not yet
measured in the current cycle, '•••' will be displayed to avoid that measurement
values of different cycles can be mixed up.
2002-11-15
0413F0003A
87/123
FLUOstar*OPTIMA
BMG Labtechnologies
Software User Manual
If you want to see the last available measurement value for each well, regardless
whether this measurement value is from the current cycle or still from the previous
cycle, add the following setting to the [ C o n f i g u r a t i o n ] section of the
'FLUOstar OPTIMA.ini' file: ClearBeforeUpdateInMValuesMode=False.
You will find this configuration file in the FLUOstar OPTIMA main installation
directory, usually '~\Program Files\BMG\FLUOoptima\\
Auto
If you use this option, you will get numeric values for all tests with only one cycle / interval
(endpoint tests) and a curve display for all other tests.
Two colors
If you are only interested in a good / bad decision, you should choose the option to display
different colors for all values under a certain limit and for all values above the limit. You
can select the two colors and change the limit value. Only the results from one chromatic
will be displayed, but if your test uses multichromatics you can decide which chromatic
should be used for the current state display.
Three colors
Same concept as Two colors', but here you can also define a range 'in-between' to be
displayed in a third color.
Color gradient
The measurement values will be displayed in different shades of colors or gray levels.
;. - I Color gradient
Limitations: undone chfomStiG (filter pair) will be displayed.
- .
y:
-
Chromatic:: [ T j - j
\ every second
j
(for well modei tests)
Polarization mode-1 show raw data from both channel•
rli
Well; _
Displqyjntervafs-
88/123
-Mede: Raw data
P ^
... J250
1
liming
0413F0003A
I
Save
I
Print
I
Help
I
2002-11-15
BMG Labtechnologies
w
FLUOstar*OPTIMA
Software User Manual
You can select a start and an end color. It is also possible to use colors from the rainbow
spectrum. If your measurement values use only a part of the total measurement range (i.e.
0...30000), it might be useful to change the start and/or end value to enlarge the used
range of the color gradient. Similar to the Two and Three colors option, it is only possible
to display the results from one chromatic.
Note:
For this option, it is important to use a graphic mode with more than 256 colors
(windows control panel).
Layout
Shows which wells are used for samples, standards and blanks.
Curve Display
The settings in this group will be used for the Curve display in the Current State window
and for the Current State Zooming window.
Auto scale:
The limits for the graph will be selected automatically according to the
measurement results.
Manual scale:
This options allows you to personally specify the graph limits. You can
use this function to enlarge parts of the graph of special interest.
Max:
Maximum value displayed
Min:
Minimum value displayed
w
Update display
Here you can specify how often the display is updated. In well mode the display is updated
at least after finishing the measurement of a well, in plate mode it is updated at least after
each cycle. If you select any of the 'Update every X seconds' options, there will be updates
even for unfinished cycles / wells showing the already available measurement values.
w
Notes: For updating the Current State Overview and the Current State Zooming window,
a large amount of computing power is necessary, especially for tests with a large
number of cycles / intervals or multichromatics. If the computer is too slow to
redraw the current state display between two measurement values, the update
sequence will be lowered automatically.
The update display modes for well mode tests and plate mode tests are
independent.
2002-11-15
0413F0003A
89/123
FLUOstar^OPTIMA
Software User Manual
BMG Labtechnologies
Polarization mode
The measurement results from polarization tests can be displayed as
•
Raw data from both channels
•
Polarization values in mP units
These values are calculated from the results of channel 1 and channel 2:
p_
CM - k(Ch2)
CM + k(Ch2)
•
Anisotropy values in mA units
A =
CM - k(Ch2)
CM + 2k(Ch2)
Use blank corrected values
If you use this option, all results will be blank corrected before display.
Notes: If you use this option during well mode tests, measurement results cannot be
displayed before the first "Blank" well is measured. Therefore, it might be a good
idea to place at least one blank at the beginning of reading (depending on the
selected reading direction, see chapter 4.5.1 Using Layout Groups) if you are
interested in the current state display. As soon as the measurement values of
additional blanks become available, the entire current state display will be
recalculated and updated.
If you use this option during plate mode tests, the current state display will only be
updated when a cycle is finished (regardless of the selection under 'Update
display').
Use average of all blanks from all groups for blank correction
This option is only available when different layout groups (see chapter 4.5.1 Using Layout
Groups) are used. If this option is not selected, the measurement values of a group will be
corrected using only blanks from the same group. If you select this option, the correction
will be done using the average of all blanks from all groups.
Note:
90/123
All settings from this window are user specific, therefore each user can select his
preferences independently.
0413F0003A
2002-11-15
FLUOstar^OPTIMA
BMG Labtechnologies
Software User Manual
6.5.3 Zoom Feature
After double clicking on a well in the Current State window, you get a zoomed view of the
measurement values. Here the measurement values are always displayed as a curve.
There is also a table on the right side of the window where you can see measurement
results for all used filter pairs in numeric style. When you move the mouse pointer to the
filter setting number column of the table a little hint box, containing the filter setting details,
will appear.
Current State Zooming
Weil A1: XI E|
TOMS TEST
IDs: Plate: 007
16.05.02
Current measurement values:
50000 -
40000 i
30000 -1
30000 -
X
10000 -j
Inttrv. 1
Timt[i]1.10
13
2.10
U
4.20
15
6.20
Sample ID:
Probe X323/011
16
8.20
17
10.30
13
13.30
Save
19
14.20
Print
Automatically move cursor
to last value when updating
Close
Help
You can click and drag the cursor line to each kinetic point to see the measurement
value(s) of this point. It is also possible to move the cursor by using the following keys:
[ < - ] . [ - > ] , PgUp], [PgDn], [Pos1] and [End].
Using the %>\ ' \ [ keys you can zoom into the curve and out again.
When the option Automatically move cursor to last value when updating' is selected,
the cursor will automatically move to the newest value when the measurement result of a
new cycle becomes available. The table on the right side will show the new value(s)
numerically.
If you have defined a Sample ID for the selected well, this ID will be displayed below the
graph.
Save
Saves the data as bitmap (windows BMP or JPEG format) on the hard
drive.
Print
Creates a print out of the screen on any available printer.
Close
Closes this window.
2002-11-15
0413F0003A
91/123
FLUOstar*OPTIMA
BMG Labtechnologies
Software User Manual
6.5.4 Timing Overview
After clicking the Timing' button in the Current State window, you will get a window
showing an overview of the timing of the currently running test.
Pump actions*
Start Stop
Stop
Os
1s
3s
4$
3.3s
-
Os
44
5.3s
•
1
3s
Injections
Start Stop
Shaking
Start Stop
1s
•
5s
•
Os
4s
•
-
-
•
1s
5s
3s
•
•
•
•
•
•
-
incl. shaking after Injection
;fl°*e
J
Help
In this window, you can see a graphic overview of the measurement and all injections for
one well. (For plate mode tests all actions are displayed in the timing overview of one
cycle. The displayed injections may occur in different cycles. The used cycle will be listed
behind each injection bar.)
In addition, you will see tables containing the measurement and the injection times.
Note:
The listed pump action times include the time for shaking after injection.
An injection action can contain different steps:
Injection Shaking
92/123
0413F0003A
2002-11-15
BMG Labtechnologies
FLUOstar*OPTIMA
Software User Manual
7 Evaluation Software - Data Reduction
The data reduction package provides powerful Excel macros for easy data calculations as
well as all the functions possible with the Excel software. Once a run is performed the data
is automatically saved as a database file in Excel. The test run will be present in a list of all
saved test runs on the first worksheet in Excel.
You can access the data by clicking on the Excel L ^ $ l icon in the tool bar or selecting
'Results | Excel' from the main menu bar. Or you can go directly to Excel from the
Windows Start menu: 'Programs I BMG I FLUOoptima I FLUOstar OPTIMA Evaluation'. If the evaluation software is opened from the start menu then a login screen
will appear as with the control software. The same user path and password applies.
At the top of every worksheet is the normal Excel menu with all the functions from the
Excel program. In addition there is a FLUOstar OPTIMA menu on the far right with some
special functions specific to the data reduction package. There is also an g icon for
switching back to the control part of the FLUOstar OPTIMA software.
Note:
The worksheets are designed for a screen resolution of 800 x 600 pixels or higher.
7.1 The Worksheets
The FLUOstar OPTIMA evaluation software will be opened with up to 8 worksheets:
Test Runs
This worksheet is displayed when Excel is opened. It lists all test runs sorted by date and
time, with the newest at the top.
Raw Data
This worksheet gives the raw results from the measurement. You can select the type of
evaluation for kinetic calculations and select the data you want included in the calculations.
Signal Curve
If working with kinetic you can view the signal curve for a single well or a group of wells. It
appears only if the measurement has more than one kinetic point.
Evaluation
View the results on three tables; you can select how the data is presented on the table, i.e.
averages, raw data, blank subtraction, standard concentrations, etc.
Sample IDs
Contains a list of all sample IDs. This sheet is only available if sample IDs are defined.
Standard Curve
Presents a graph of the standard concentrations and lists the resulting calculated concentrations.
Protocol Settings
In this sheet you can see the used protocol settings.
2002-11-15
0413F0003A
93/123
FLUOstar*OPTIMA
Software User Manual
BMG Labtechnologies
7.2 Test Runs Worksheet
The Test Runs worksheet is automatically displayed when Excel is opened. It lists all the
test runs that have been saved or imported. At the bottom of the worksheet the user path
is shown; only the test runs stored in this directory are displayed on the worksheet.
Microsoft Excel FLUOstar Optima
Anal
- 10
B
iBB
-/a
lit!
Ccpy Selection
Change Qate path
Lpgm
100%
D6
C 0413 SF DARK VALUE W
C; POLAR 384
C A B S PLATE
CABS WELL
CLUMITIMEOPT
CLUMI PLATE
CLUMIMULTI
CATEST
QCTEST
413-0006
413-0006
£opy Test Run
©tfflrt Test Run
frnporf Test Run
Qetete Test Run
Info
UTP-DR
700-0014
H \41 • I WNTest Runs / Raw Data j Evaluation 96 / Standard Curve / Protocol Settings /
•Us*: USER USER-Path: C p r o g r a m Files\pMG LabtBchnblogfosSFLUOstar' OPTlMA\User\fj
2001/10/21
2001/10/19
2001.10.17
2001.10.17
2001.10.17
2001.10.16
2001.10.16
2001.02.16
2001.02.15
12:36:10
16:32:45
10:45:48
10:01:12
09:32:42
17:11:44
17:01:58
22:43
16:36
96
384
96
96
96
96
96
96
96
(NUM!
Testname
The testname is listed first and appears as it is defined in the protocol definition. There is a
small column to the left of the testname. If a test has been modified in any way, a marker
will appear in this column. If the test run has only been copied or imported, a 'C will be
used as marker. This distinguishes the test from the original. If the test run has been
modified, e.g. wells have been taken out (see Save under 7.3 Raw Data Worksheet) or
Sample IDs (see chapter 7.6) have been changed, this test run will be marked using a 'M'.
ID1 / ID2 / ID3
These are the plate identifiers that were created before the measurement (see chapter 6.1
Plate Identification).
Date and Time
The date and time that the measurement took place.
Wells
Plate format (number of wells) of the microplate.
Filename
The number of the database file assigned to the test run.
Select the test run whose results you want to view and double click it. You can also select
the test run and select one of the options from the FLUOstar OPTIMA pull-down menu
located in the toolbar.
94/123
0413F0003A
2002-11-15
BMG Labtechnologies
FLUOstar^ OPTIMA Software User Manual
7.2.1 FLUOstar OPTIMA Pull-Down Menu
The following options are located under the FLUOstar OPTIMA menu entry at the top of
the Excel worksheets.
FLUOstar OPTIMA
Copy Selection
Change Data path
Login
Copy Test Run
Export Test Run
Import Test Run
Delete Test Run
Copy Selection
Select the data you want to copy in a worksheet and choose 'Copy Selection'. A new
workbook is created and the selected data will be copied into a sheet within the new
workbook. This workbook can be saved under a new name and can be used like any Excel
workbook.
Change Data Path
Select a new destination directory for the test runs. The change is valid only for the user
who is logged in. The new directory must be a subdirectory of the user folder. Select the
drive and directory in the user path window (see chapter 3.5 Data Path).
Login
This allows you to change the logged in user. The functions are the same as in the control
part (see chapter 2.1 Login Screen).
Copy Test Run
This feature allows you to copy an entire test run - with all the raw data, IDs, layout, etc.. It
is then possible in a safe way to modify the data and save the changes without loosing the
original data. Select the test run you wish to copy by adding the test name, than choose
'Copy Test run'. The copied test run appears on the test run list with an C to the left of the
name.
For example, if you want to delete raw data from the calculations you can copy the original
test run and then in the copied test run delete the data you do not want to use and save
these modifications.
Export Test Run
With the export function you can copy the test run onto a diskette, a new drive or directory.
Select a test run or a group of test runs and then choose 'Export Test Run'. A new window
will ask for the destination drive and directory as well as the file name. The extension for
the test run export file is '.RUN'. In addition to this file a directory will be created
('<name>.RU') containing one file for each exported test run. Do not forget this directory
(and its content) when you copy the exported file.
For example, you may select a test run, export and choose the 'A' drive as the destination.
You can give the file a name, e.g. Testi.run'
2002-11-15
0413F0003A
95/123
FLUOstar1'OPTIMA
Software User Manual
BMG Labtechnologies
Import Test Run
With the import function, you can copy a test run from a disk or another drive. Click on
'Import Test Run', and the next window will ask for the file name and the directory and
drive where it is located. Highlight the test run and select 'OK'. The test run is added to the
list on the Test runs worksheet.
Delete Test Run
If you want to delete a test run, select it and choose 'Delete Test Run'. You can select and
delete several test runs at a time.
Switch to Control Part
With this function you can switch back to the FLUOstar OPTIMA control software or use
the S button in the toolbar. The evaluation software will stay open in the background.
To access the Raw data, Signal curve and Standard curve worksheets for a test run,
double click on the desired test run.
96/123
0413F0003A
2002-11-15
BMG Labtechnologies
FLUOstar*OPTIMA
Software User Manual
7.3 Raw Data Worksheet
This worksheet displays all the raw data for each interval or cycle from the measurement.
Each row represents the data from a specific well. Each column represents the data at a
particular interval (well mode) or cycle (plate mode).
Test Name GROUP A STANDARD
$
ID 1: Rhodamin
ID 2:
2001*09*12 11:42:17
ID 3:
Order by rows
O Order by columns
Calc. Range Start 11
Veil
Cont.
A01
A01
A01
AOt
A02
A02
A02
A02
A03
A03
A03
A03
A04
A04
AM
A04
A05
A05
A05
A05
SA1
SA1
SA1
SA1
SA2
SA2
SA2
SA2
SA3
SA3
SA3
SA3
SA4
SA4
SA4
SA4
SA5
SA5
SA5
SA5
143
5666?
1
Stopi
Calc. Range Start 2
Stop 2
286
0
0
57495
57194
249
24S
247
1565
62
1516
1564
59
5S
19777
19642
19119
136
134
137
894
902
910
42
42
44
8902
8630
S453
69
72
68
532
564
559
35
42
37
4762
34
354
36
4514
4431
32
34
29+7
2S45
2723
40
43
376
351
21
23
24
253
290
287
37
35
31
Description of the chart:
; Order by rows • The order of the wells appears sorted by rows on the microplate (default).
Order by
The order of the wells appears sorted by columns on the microplate.
columns
! Well
The coordinates of the well in the microplate (A01 = row A, column 1)
! Cont.
Content of the well as labeled in the layout definition.
Here you can select a specific well or a group of wells to be displayed in the
Signal Curve sheet by highlighting the well name(s) in the Cont. Column. If
you do not select anything here the signal curve for all wells will be
displayed, although with a maximum of 253 wells.
Veil Cont.
A01
A02
B03
B04
BOS
BOG
B07
BOS
BOS
BIO
B11
SI
S2
' ^H
• ^1
i ^fl
i ^•1
i ^H
S10
"
S11
2002-11-15
0413F0003A
97/123
FLUOstar^OPTIMA
CH
CH
Software User Manual
BMGLa btech nolog ies
Channel: Number of the used filter setting. The numbering will always start
with 1, which corresponds to the first defined filter in the multichromatic
sheet (see section 4.8 Multichromatics).
t: In the channel column, the "t" stands for time. For more than one cycle or
interval the T row shows the time in seconds in which the cycle / interval
occurred.
C: In the channel column, the "C" stands for Celsius. If the incubator was
used during the measurement or if the Temperature Monitoring Feature is
switched on (see chapter 5.2), this row displays the temperature of the
instrument at the particular kinetic cycle (only plate mode).
Cycles /
Intervals
Lists the number of the particular interval (well mode) or cycle (plate mode).
Calc. Range Start 1 / Stop 1
Calc. Range Start 11
1
Stop 1
1
You can select the kinetic cycles / intervals that you want included in the data calculations
by entering the first cycle / interval in 'Calc. Range Start 1' and the last cycle / interval in
'Calc Stop 1'. The cycles / intervals you select will be highlighted in red. The calculation
start and stop values defined in the test protocol (control part) are used (see chapter 4.3.1
and 4.4.1) as default values for this range.
Calc. Range Start 2 / Stop 2
Here you can select a second range of kinetic intervals / cycles. With this function it is
possible to calculate the difference or the quotient of range 1 and range 2. The cycles /
intervals selected for range 2 will be highlighted in green. All cycles / intervals after the
calculation stop cycle / interval defined in the test protocol (control part) are selected as
default for range 2.
98/123
0413F0003A
2002-11-15
FLUOstar1' OPTIMA Software User Manual
BMG Labtechnologies
7.4 Signal Curve Worksheet
The signal curve worksheet graphically plots the data points for one well or a group of
wells selected in the Raw Data Worksheet, see chapter 7.3 (Cont. description). This sheet
only appears if you have more than one kinetic point.
FLUOstar OPTIMA
BMG Labtechnologies
ankCorr.
Startt: 1
27000
Test Name:
ID 1,2,3:
CA TEST
UTP-DR
21:05:18
O Averages of replicates
Stop1:8
Start2:,9
Stop2: 64
001 B1
002 31 1
26000
003 S2 1
•04 S3 1
rjO5 S4 1
-+- DOB S5 1
- i - 007 S6 1
— 008 S7 1
15
20
25
33.6 sec
TIME [sec]
You can choose to show the curve in Linear or Logarithmic form.
You can change the scale for the units by clicking on the scale in the lower left corner.
If threshold is the evaluation type (selected in the Evaluation Worksheet, see chapter 7.5),
the legend will show a threshold line (as The') and the desired threshold number.
Blank Corn:
Appears only if blanks are defined. If checked, the average of
the blanks will be subtracted from each data point of the
corresponding signal curves. The blank curve itself will not be
shown.
Averages of replicates: If checked, the averages of each selected content and channel
will be calculated and displayed as signal curve. In the legend
the names of the contents appear instead of the names of the
wells.
Y-Zoom:
A scrollbar to zoom the signal curve in y-direction.
Lin / Log:
Buttons to switch between linear and logarithmic scaling of the
y-axis.
2002-11-15
0413F0003A
99/123
FLUOstar*OPTIMA
Software User Manual
Ratio calculation
between filter pairs:
[ D Blank Corr.
Slart1:1
100 -r-
100/123
BMG Labtechnologies
This feature is for e.g. FURA-2 applications and only available
for the fluorescence measurement. In this software version
(V1.20-0), it is only activated for the multichromatic
fluorescence measurement type. There appear three dropdown
boxes. You can calculate the ratio, the product, the difference
or the sum between the measurement results of two filter pairs.
The operand and the filter pairs are selectable with dropdown
boxes. The option 'Ratio calc. off' appears as standard.
Ratio calculation between filter pairs
340-10/440-10
HH Averages of replicates
355 / 460
0413F0003A
2002-11-15
BMG Labtechnologies
FLUOstar*OPTIMA
Software User Manual
7.5 Evaluation Worksheet
In the evaluation worksheet you can specify the evaluation method. It contains tables
where you can see calculated data. The name of this worksheet is 'Evaluation' followed by
the plate format (i.e. 'Evaluation 96' for a 96 well format).
You can see the most important settings from the used protocol definition on the top
portion of the evaluation sheet. You can see all settings in the Protocol Settings Sheet
(see chapter 7.8).
Note:
The header section of 24-, 48- and 96-evaluation sheets is fixed for better
general view of the results. If you use the scrollbar at the left of the window, only
the tables move.
FLUOstar OPTIMA
; Test Name: GROUP A+B+C STANDARD
BMG Labtechnologies
ID 1,2,3:
9/1201 12:09
CD Hide protocol settings
Rhodamin+4 Methylumb +Coumarin
Fluorescence, plate mode equidistant
Microplate
BMG LABTECHNOLOGIES
Kinetic window
No. of cycles
Cycle time [s]
Meas. start time [s]
No. of flashes
Gain
118;048;116;093
Excitation filter 544; 355; 340; 485
Emission filter 590; 460; 440; 520
Volume group
Volume [pi]
Injection cycle
Shaking after inject [s]
1
3
143
0.0
10
2
1
2
20
1
-
-
3
4
;
:
-
-
3
4
Pos. delay fsi 0.2
Reading direct. 1
Comment
Y-*=*1
Calculation Starti 1 Stopi 2
Start2 3 Stop2 3
110 JJLI color reagent per well
Calculation: Sum
Table 1
SA1
SB1
sci
XD1
I •
|_J Use average of blanks of all groups
Channel
Range1
Maximum
j Minimum
Average
5lope/second
Slope/minute
Time to threshold
; Time to maximum
5D of raw data
%CV of raw data
;SA5
SA6
B4
SB5
SB6
!C4
SC5
SC6
XD5
XD6
1
SA7
XA2
SB7
XB13
SC7
XC13
XD7
XD13
SA8
SB8
SC8
XD8
SA9
XA1
SB9
XB12
SC9
XC12
XD9
XD12
Table content
•
]
Layout
SA10
SA11
;BA
SB10
SB11
BB
SC10
SC11
BC
XD10
XD11
BD
10
11
12
Hide protocol settings
It is possible to hide the header area and the comment to give better overview for the data
by checking the 'Hide protocol settings' checkbox.
2002-11-15
0413F0003A
101/123
FLUOstar*OPTIMA
Software User Manual
BMG Labtechnologies
Reading Direction Icon Legend
bidirectional reading
unidirectional reading
start left
start left
start right
start right
m
2
c c
"5* •"
6
7
8
3 1 1 ^ 9 ft
10
11
12
S S « I 13
14
15
1G
JD
w
I
Comment
It is possible to insert a comment on the worksheet. The comment is automatically saved
in the test run file.
102/123
0413F0003A
2002-11-15
BMG Labtechnologies
FLUOstar*OPTIMA
Software User Manual
7.5.1 Calculations on the Three Tables in the Evaluation Sheet
The data is presented on three different tables. Each table presents different information
based on what you choose from the pull-down menu on the right side of each table.
FLUOstar OPTIMA
Test Name: GROUP FP A TEST
BMG Labtechnologies
ID 1,2,3:
-I
Calculation: Sum
[~~| Use average of blanks of all groups
56575
L
D
E
F
G
H
20477
9915
of
5137
3087
••••
1799
yr
DO
39
5
8
-2
2
33
525
198
91
87
50
43
1
2
5
6
971
24
-74
15
-60
37
8
z\
Range1
Table 2
9
* H
A
B
15293.85
7407.372
C
D
5.868
0.978
1.956
•:•:•:•:•:•:•:•:•:•:•:•:•:•
2 . 9 3 4
0.978
11.736
7.824
6.846
3.912
3.912
4.89
54.768
26.406
12.714
9.78
5.868
0.978:
5.868
4.89
5.868
1.956
8.802
5
6
7
8
9
1
2
3
Responsible for standard curve
Table calculation: Polarization
A 141.0702 144.; None
Table 1 / Table2
B
Table2 / Table 1
C 885.912 966! Table 1 - Table2
I Table2 - Table 1
D
E
F
537 3699
G
H
811.0693
4
567.24
1.956
-0.978
2.934
4.89
2.934
3.912
of
42
42
35
0
32
10
11
•
12
Raw data - blank
426.408
3042.558
351.102
4.89
3.912
5.868
3.912
1.956
3.912
3.912:
2.934
0.978
1.956
10
•
409.782:
11
12
200.3000 202.4010 217.0920 2G0.0G55; 200.2900
177.4601
154.6757
974.916 849.2834 924.7055 889.9764 956.0232
829.587
951.8756
973.9123
1142.027
.22S3BEBEE3WBKKKM 192.05
-323.41 741.8844 672.8003 875.6358 803.9687
829.587 845.3103
TAnisotropy
1177.463
1190.421
1 Intensity
764.6587
754.8258
1.7307 104.7520
201.2379
789.9334
955.5232
797.8921
1
2
3
4
Gray fields contain deleted values
2002-11-15
700.248
185.82
655
70
-15
42586.03
3790.728 2124.216 1196.094
589
S4
-59
54
-45
59
75
-48
7
Table content
664
4156
tb
0 Use K-Factor
E
F
G
H
0 Hide protocol settings
Raw data - blank
1128
266
iiy
4
3
Channel
z\
Range1
Table 1
A
B
9/12/01 10:50
Rhodamin
854.8746
1226.862
5
726.2294 945.6334
3840.271
-1000
10
884.7921
11
12
Sawe changes
0413F0003A
103/123
FLUOstar*OPTIMA
Software User Manual
BMG Labtechnologies
Calculation Pull-Down Menu for Kinetic Evaluations
The menu on the left side has additional calculation options and evaluation types. These
calculations are for kinetic assays in which there are more than one cycle/ interval. They
are related to the selected intervals / cycles defined by the calculation start 1/stop 1 resp.
start 2/stop 2 controls on the Raw Data sheet.
5um
Sum
Maximum
Minimum
Slope/second
5lope/minute
Time to threshold
Time to maximum
SD of raw data
%CV of raw data
Sam
You can add all the kinetic points together for each well. Select Sum in the pull-down
menu. The sum of the selected range will be listed in the tables of the evaluation sheet.
Maximum
Finds the maximum value for a set of intervals for each well. Select Maximum in the pulldown menu. The maximum of the selected range will be listed in the tables of the
evaluation sheet.
Minimum
Finds the minimum value for each well for a set of intervals. Select Minimum in the pulldown menu. The Minimum of the selected range will be listed in the tables of the
evaluation sheet.
Average
Finds the average value for each well for a set of intervals. Select Average in the pulldown menu. The average of the selected range will be listed in the tables of the evaluation
sheet.
Slope/second
Calculates the linear regression curve and gives the corresponding slope per second for
each well. The slope of the selected range will be displayed in the tables of the evaluation
sheet.
104/123
0413F0003A
2002-11-15
BMG Labtechnologies
FLUOstar*OPTIMA
Software User Manual
Slope/minute
Calculates the linear regression curve and gives the corresponding slope per minute for
each well. The slope of the selected range will be displayed in the tables of the evaluation
sheet.
Time to threshold
When you select threshold over time, an additional box appears next to the pull-down
menu.
30
Time to threshold
You must enter the threshold that you are interested in in this field. The time that the
threshold is reached is indicated in the tables of the evaluation sheet.
Time to maximum
Calculates the time until the maximum is reached for each well.
SD of raw data
Calculates the standard deviation of the raw data for each well.
SD =
%CV of raw data
Calculates the standard deviation of the raw data for each well over the selected range of
cycles / intervals divided by the average of the raw data for this well / range, expressed in
percent.
Use average of blanks from different groups
se average of blanks of all groups
Here you can collect the blank values from different groups as average instead of using an
individual blank value for each group. This box appears only if there is more than one
group defined.
Range Pull-Down Menu
You can select the range you are interested in for each table.
2002-11-15
0413F0003A
105/123
FLUOstarhOPTIMA
Software User Manual
BMG Labtechnologies
Range 1
The measurement values of range 1 (Calc. Range start 1 ... Stop 1 on the raw data
worksheet) will be used in the corresponding table.
Range 2
The measurement values of range 2 (Calc. Range start 2 ... Stop 2 on the raw data
worksheet) will be used in the corresponding table.
7.5.2 Table Content Pull-Down Menu
Raw data
Raw data - blank
Averages
Averages - blank
5D of replicates
%CV of replicates
Layout
Standard concentration
Volumes 1
Volumes 2
Volumes 3
Volumes 4
Sample IDs
Dilution factors
Raw Data
The raw data with no calculations will be displayed.
Raw Data - blank
The average of the blanks (background) is subtracted from the raw data and displayed.
Averages
The average of the replicates will be displayed.
Averages - blank
The average of the blanks subtracted from the average of replicates will be displayed.
SD of replicates
The standard deviation of the replicates and the blanks will be displayed.
106/123
0413F0003A
2002-11-15
FLUOstar1'OPTIMA
BMG Labtechnologies
Software User Manual
% CV of replicates
The CV (standard deviation / average) in percent of the replicates and the blanks will be
displayed.
Regression coeff. (r)
The regression coefficient as calculated from the linear regression equation is displayed.
Appears only if'Slope/secondCminute)1 is chosen in the calculation pull down menu.
Layout
The contents (standards, samples, blank) as defined in the layout section will be
displayed.
Standard concentration
The concentrations of the standards that were defined in the layout ('Concentrations and
Volumes' window) will be displayed.
Volumes 1, 2, 3, 4
The injection volumes for each pump, as defined in the layout ('Concentrations and
Volumes' window) will be displayed.
Sample IDs
Shows the Sample ID for each well.
Note:
If you use very long sample IDs you will only see a part here (approximately up to
10 characters). To see the full sample ID, use the Sample IDs worksheet.
Dilution factors
Shows the dilution factor for each well.
Multichromatic Data
If more than one filter setting was used in the test protocol (multichromatic) it is
possible to view the data for each setting by using the small pull-down box. The
box contains numbers corresponding to the order of the filter combinations. The
number is in the order in which the filters were defined in the test protocol (see
chapter 4.8 Multichromatics).
5
Choose the number in the box that corresponds to the raw data you want to view.
You can choose different numbers for each of the three tables to make
comparisons of the data.
Which filter setting correspondent to which position can be seen in the header of the
evaluation sheet. The pull-down box will be empty if only one filter pair has been used.
2002-11-15
0413F0003A
107/123
FLUOstar*OPTIMA
Software User Manual
BMG Labtechnologies
7.5.3 Data for Standard Curve
Table 3 is used for defining the data used for the Standard Curve. If you choose 'Raw data
- blank' then the results, if valid, will be plotted on Standard Curve worksheet. This
standard curve will be the basis for calculating the unknowns.
The data selection that is valid for plotting the standard curve includes raw data (minus
blank) and averages (minus blank).
A standard curve cannot be formed from volumes or layout information. If the data from
table three cannot form a graph, the standard curve worksheet will be blank. If a value in
table 3 is negative, the logarithmic scale for the standard curve cannot be selected.
Calculations in the three tables
Responsible for standard curve
Table calculation: Polarization
141.0732
885.912
537.3699
•
144.; None
Table 1 / Table2
Table2 / Table 1
966J Tablel - Table2
Table2-Table 1
-22C
Anisotropy
Intensity
There is an additional pull-down menu on the left, between the second and third table. You
can select optional calculations between the tables here.
Description
Explanation
None
All 3 tables are independent
Tablel / Table2 The content of table 1 is divided by the content of table 2, results
are shown in table 3.
Table2 / Tablel The content of table 2 is divided by the content of table 1, results
are shown in table 3.
Tablel - Table2 Values from table 2 are subtracted from the values from table 1
and the results are shown in table 3
Table2 - Tablel Values from table 1 are subtracted from the values from table 2
and the results are shown in table 3
*Polarization
The polarization values are calculated using tablel and table 2,
results are shown in table 3.
*Anisotropy
The anisotropy values are calculated using tablel and table 2,
results are shown in table 3.
Intensity
The intensity values are calculated using tablel and table 2,
results are shown in table 3.
Note: The items marked with an asterisk appear only in polarization mode.
When a calculation is chosen then all three tables will convert to the same type of data
(i.e., 'Raw Data', 'Averages', etc). If no calculation is possible the third table will be gray.
108/123
0413F0003A
2002-11-15
FLUOstar1'OPTIMA
BMG Labtechnologies
Note:
Software User Manual
If there is a division by zero, the respective value will be set to empty in the
evaluation sheet.
Removing data:
If you want to eliminate the results of a well from the data reduction,
highlight it in one of the three tables and press 'Delete'. The content
name of this well will now appear in lower case letters. Its value will
not be used in calculations. Pressing 'Delete' again will restore the
data value.
Save changes:
If you remove data in the described way, a save button at the far right
below the evaluation sheet will appear. Click on this to save the
changes you have made to the data permanently.
2002-11-15
0413F0003A
109/123
FLUOstar^OPTIMA
Software User Manual
BMG Labtechnologies
7.6 Sample IDs Worksheet
This worksheet is only available if you have defined Sample IDsbefore starting the test run
(see section 6.3).
It contains a list with all sample IDs. You can choose between sorting for rows, columns,
well content or sample IDs.
Save changes
(* Sort column up
C Sort column down
C Sort row up
C Sort row down
Sort up C" Sort down
C- Sort up
Well
Contents
Sample IDs
A01
S1
RG100%
B01
S2
RG100%
C01
S3
RG100%
D01
S4
RG100%
E01
S5
RG 100%
F01
S6
RG100%
G01
B
Blank
H01
B
Blank
A02
X1
Probe X321/751
B02
X9
Probe X321/752
C02
X17
Probe X322TO6
D02
X25
ProbeX322/018
E02
X33
Probe X322/030
Sort down
It is possible to change the sample IDs here by editing the respective fields in the Sample
ID column. You can store these changes permanently by using the 'Save changes' button.
110/123
0413F0003A
2002-11-15
BMG Labtechnologies
FLUOstar*OPTIMA
Software User Manual
7.7 Standard Curve Worksheet
After the data is selected in table three on the Evaluation worksheet, click on the tab for
Standard Curve at the bottom of the screen. The worksheet contains the graph of the data,
optional curve fits, and tables of known and unknown concentrations. You see the
parameter table where the parameters for each group are listed at the top of the sheet.
You can select the groups you wish to see by clicking the corresponding checkbox above
the parameter table.
Note: In this example there are group A and B selected. You see the regression lines for
these groups.
4 Parameter Fit: Y = (a-d)CI +((x/c) A b)) + d
M
•
A
• C
-2.84E3
• D
9.49E1
1.01E2
1.82E0
1.23E0
2.30E-8
2.68E-8
1.929E3 1.502E4
0.997837 0.999636
6.75E-1
2.69E-6
5.302E5
0.999483
•
Evaluation Type: Sum
Edit start parameters for curve fit
150000 •
(• Lin
OLog
|
100000 -
50000 /
00.0000002
0.0000004
0.0000006
0.0000008
0.000001
0.0000012
CONCENTRATIONS
4 Parameter Fit
Standard concentrations
i 0.000001
0.000001 ;
o 000001;
0.000001
Linear Regression
Segmental Regression
5E- Pninh hn Pninh
nun IL ku nun IL
5E- 2nd Polynomial
<?• Lin
C Log
S.25E-08
3.13E-08
S.25E-03
3.13E-08
5E- 3 r a ^ o l y n o m i a l ^ ^ ^ ^ ^ S.25E-0S 3.13E-08
5E- ElSffiWHHlpMM J.25E-08 3.13E-08
in
i f f nH A i « : nn ; -~)C.e n o 'i -1 i c no
The calculated unit values for the standard concentrations defined in the test setup are
plotted in a 'Standard curve1. The graph can be plotted on linear or logarithmic scale in x or
y direction by clicking the 'Lin' or 'Log' button of the correspondent axis.
2002-11-15
0413F0003A
111/123
FLUOstar*OPTIMA
Software User Manual
BMG Labtechnologies
Curve Fits
There is a pull-down menu for selecting one of six curve fits below the graph. You can
choose the one that best fits the data and provides the best results for calculating the
unknowns.
Note: a) The Segmental Regression curve fit is useful especially for solubility applications.
It tries to split the data range into two regions with optimal regression fit, displaying
also the coordinates of the intersection point. If the parameter r for the whole data
range is bigger than 0.98, only one regression line will be drawn.
b) The 4 Parameter Fit option is not available if the data is not suitable for this type
of curve fit. For this option, parameter a means the minimum, b the maximum, c the
turning point and d the slope of the asymptote. Parameter c is also known as the
IC50.
Values which are greater than the maximum or lower than the minimum of the 4
Parameter Fit asymptote (parameters a resp. b) are not shown.
Edit start parameters for curve fit:
If you choose the 4 parameter fit calculation, you have the option to edit the start
parameters for the curve optimization.
fteset
0
|
Optimized
Edit start parameters for curve fit
The graph is now plotted with the default start parameters. You can edit the start
parameters by changing the values in the parameter table. Each time you press the
'Optimize fit button', an optimization routine is done. With the 'Reset' button you can reset
the values to the original ones.
112/123
0413F0003A
2002-11-15
BMG Labtechnologies
FLUOstar*OPTIMA
Software User Manual
Calculation of the Unknowns
There are two tables below the graph:
Standard concentrations
1
2
0.000001
0.000001
5E-07
2.5E-07
1.25E-07
6.25E-08
3.13E-08
5E-07
2.5E-07
1.25E-Q7
6.25E-08
3.13E-08
0.000001
5E-07
2.SE-07
1.25E-07
6.25E-08
3.13E-08
0.000001
5E-07
2.5E-07
1.25E-07
6.25E-08
1E-07
5E-08
2.5E-08
1.25E-08
6.25E-09
3.13E-08
3.13E-09
1E-07
5E-03
2.5E-08
1.25E-08
6.25E-09
3.13E-09
1E-08
5E-09
2.5E-09
1.25E-09
6.25E-10
3.13E-10
1E-08
5E-09
2.5E-09
1.25E-09
6.25E-10
3.13E-10
3
;
10
11
12
Calculated concentrations
Rangei
Table calculation: None
9.5E-07
Channel 1
2.89E-07: 2.04E-07; 1.42E-07; 9.97E-0S;*
2.86E-07' 1.89E-07! 1.26E-07! 9.67E-08
1
2
3
4
5
6
7
8
9
Raw data - blank
;
3.5E-08:
10
11
12
*: The signal of the respective sample is lower or higher than the asymptote min or max values!
Used for calculation:
® Group O A
OB
O
O
First Table: Standard Concentrations
This table contains the standard concentrations as defined in the layout (Concentration
and Volumes).
Second Table: Calculated Concentrations
This table contains the calculated concentrations based on the graph of the standard
concentrations. They are calculated by using the formula for linear regression, segmental
regression, point to point, 2 nd and 3rd polynomial or the 4-parameter fit.
Used for Calculation
With these radio buttons at the bottom of the sheet, you can select the standard of the
group, which is used for calculating the sample values. With the button 'Group' selected,
which is activated by default, every group uses its own standards for calculation.
Note:
In the case of 2nd and 3rd degree polynomial equations, it is possible that there are
problems calculating the unknowns. The point could be out of the range of the
curve or there could be more than one concentration possible. In these cases, the
table will contain asterisks in the place of the data.
The signal of the respective sample is out of the signal range of the standards.
No extrapolation is possible.
The signal of the respective sample is lower or higher than the asymptote min
or max values (can only appear if 4-parameter-fit is chosen).
**
2002-11-15
For the signal (units) there is more than one concentration possible. No clear
relationship between signal and concentration.
0413F0003A
113/123
FLUOstar*OPTIMA
Software User Manual
BMG Labtechnologies
7.8 Result List Worksheet
This worksheet is only available if the standard curve worksheet is visible. This means that
standards must be defined in the layout, and in the third table of the Evaluation Worksheet
one of the following selections must be used: 'Raw data' (minus blank) and 'Averages'
(minus blank).
FLUOstar OPTIMA
Test Name: DNA1
BMG Labtechnologies
ID 1,2,3:
7/26/0210:51
V Hide parameter settings
f~" Hide standard curve
Fluorescence, plate mode
Evaluation type
Sum
Calculation
Starti 2 Stopi 2
Selected
Rangei
Table calculation
None
Curve fitting
Linear Regression
m
3.319E3
b
-1.403E2
r
0.980503
Comment
Start2 0 Stop2 0
DNA Test
onnnn
1 *
15000 •
jjjj 10000 A
5000 •
n -
c
0.5
1
1.5
2
2.5
3
3.5
4
4.5
5
5.5
CONCENTRATIONS
Sort contents
Sort sample IDs
^
^
•--.
(•Up
\ Down ( U p
f Down
Content
S1
Sample
ID
Well
Dilution
factor
—
C Up
Sort rows
~
\ Down
Sort columns
_,
-.
s Up
t Down
Raw data - Avge of
SD of
blank
replicates replicates!
A01
70.25
A02
60.25
65.25
%CV
5 7.662835
;
r~
1
...
.
use dilution factor
Calculated
concentr.
0.06193665
The worksheet contains a list of all raw data, based on the selection you made for the third
table on the evaluation sheet. The data values are grouped by replicates. Also the
calculated concentrations are shown using the curve fitting method of the current standard
curve worksheet. In the header appear the most important measurement parameters, the
parameter table for the standard curve and the graph of the standard curve. Both can be
hidden by checking the checkboxes 'Hide parameter settings' and 'Hide standard curve' to
get a better overview of the data.
114/123
0413F0003A
2002-11-15
FLUOstar*OPTIMA
BMG Labtechnologies
Software User Manual
The data can be sorted by plate rows, plate columns, well contents or sample Ids in
upward or downward direction using the corresponding checkboxes.
If you check the box 'Use dilution factor' the raw data results are multiplied with the
corresponding dilution factor. The calculated concentration will be recalculated from the
new raw data results.
FLUOstar OPTIMA
Test Name: FSS
BMG Labtechnologies
ID 1,2,3:
7/26/0210:51
;
Sort columns
Sort sample IDs
Sort rows
Sort contents
f Down
^ Down ^ Up
f Down C Up
{* Up
C Down C Up
SDof
%CV
Calculated
Well
Dilution Raw data - Auge of
Content Sample
replicates replicates
factor
blank
concentr.
ID
S1
S1
S2
S2
;
X3
X4
X4
X5
X5
A01
A02
B01
B02
iC01
C02
D01
D02
E01
E02
F01
F02
G01
G02
H01
H02
A03
A04
B03
B04
C03
C04
D03
D04
E03
E04
X6
X6
F03
F04
S3
S3
S4
S4
S5
S5
i
S6
'
;
'
:
i
S6
S7
S7
;S8
S8
:
!
;X1
X2
X2
i
'
X3
2002-11-15
1
1
1
1
1
1
1
1
1
1
1
1
70.25;
65.25;
60.25:
1315.25; 1330.25;
1345.25
2630.25; 3125.25
3620.25'
3277.25; 3247.25
3217.25
5046.25: 6720.25
8394.25;
7973.25: 8148.75
8324.25;
11068.25: 15459.75
19851.25
15318.25; 15541.75
15765.25;
5033.25
5002.25
4971.25
8965.25
9069.25
9173.251
1941.25; 1963.75
1986.25
2140.25; 2142.25
2144.25:
2763.25
2804.75
2846.25
28519.25; 28725.75
28932.25
9 Hide parameter settings
W Hide standard curve
r
use dilution factor
5 7.662835 0.06193665;
;
,
15 1.127608 0.44309318;
:
\
495 15.83873
0.98394376!
30 0.923859 1.02070352
1674 24.90979
i
2.06715147;
;
I
175.5 2.153705 2.49757211 '
\
\
4391.5 28.40602
4.70044596
'
223.5 1.438062 4.72515334
j
31 0.619721 1.54950172:
104 1.146732 2.77492751
;
•
;
22.5 1.145767 0.63397276
2
206.50.718867
0413F0003A
i
0.09336 0.68775651 [
41.5 1.479633 0.88737406;
.
I
.
I
I
8.69761798
115/123
]
\
j
FLUOstar^OPTIMA
Software User Manual
BMG Labtechnologies
7.9 Protocol Settings Worksheet
Here you can see all settings defined in the used protocol.
FLUOstar OPTIMA
Test name: GROUP A+B+C STANDARD
2001/09/12 12:09:07
BMG Labtechnologies
ID 1,2,3:
Modified
Rhodamin+4 Methylumb +Coumarin
Fluorescence, plate mode
Kinetic window
Plate type
No. of cycles
BMG LABTECHNOLOGIES
Cycle time [s]
Meas. start time [s]
No. of flashes
Chromatic No.
1
118
544
590
Gain
Excitation filter
Emission filter
Last req. value [%]
2
48
355
460
3
116
340
440
1
3
143
0.0
10
4
93
485
520
Volume group
Volume [ul]
Used pump
Positioning delay [s] 0.2
Injection speed [ul/s]
Injection cycle
Injection start time [s]
1
20
1
50
1
0.0
Shaking after inject, [si
Pause cycle
0
Pause duration [s]
0
Reading direction
1
Comment
110 |_il color reagent per well
2=3;
Calculation Starti 1 Stopi 2
Software version control
1.20-8
Software version evaluation
1.20-8 B:0031
Serial number
413-0034
User
USER
Start2 3 Stop2 3
All the settings are described in section 4 Defining Protocols.
Note:
116/123
for the 'last required value [%]' it is the last required value to be saved together
with an automatic gain adjustment. A gain can be typed in manually and hence the
required value [%] is not taken into account.
0413F0003A
2002-11-15
BMG Labtechnologies
FLUOstar*OPTIMA
Software User Manual
8 Known Problems and Solutions
There are (at least) five possible errors caused by Microsoft (1. - 4., 6.):
1. Error 'Cannot open Data Path'
2. Error 429 'ActiveX component can't create object or return reference to this object'
3. Error 1004 VBA initialization failed'
4. Error 40009 'No current row'
5. Disabled Plate In / Out Buttons
6. Access Rights Problems under Windows NT / 2000 / XP
For solutions see the following chapters.
8.1 Error: 'Cannot open Data Path'
This error can occur if there is a problem with the Microsoft JET engine or if there is a
language conflict between the Windows operating system and Excel. Installing a new
service pack for the operating system or installing a new service release of Excel may
sometimes help, but we strongly recommend not to use different language versions of
Excel and Windows.
The BMG software is tested with English Windows and Excel versions (Windows 98 / ME /
NT / 2000 and Excel 97 / 2000 / XP) and with German Windows / Excel versions. We can
not guarantee that our software will run without problems on computers with Windows /
Excel in other languages, especially on mixed language systems.
Note:
This error can also occur when you have installed the evaluation part for Excel 97
and upgrade to Excel 2000 / XP (or vice versa). In this case, please reinstall the
evaluation part. The installation program will automatically install an evaluation
part optimized for the Excel version used.
Alternatively you can manually start ~ : \ F L U 0 s t a r
OPTIMA
VX.XXx \ I n s t a l l a t i o n f r o m CD-ROM\Evaluation\setup97.exe for the Excel
97 optimized evaluation program version and ~ : \ F L U 0 s t a r O P T I M A V X . X X x M n s t a l l a t i o n f r o m CD-R0M\Evaluation\setup2 000 . exe for the Excel
2000/XP version.
8.2 Error 429 'ActiveX component can't create object or return
reference to this object1
If this message appears when you open the Excel evaluation sheet, you should use the
Fix429 program from the installation CD-ROM (under ~\FLUOstar OPTIMA V1.xx\
Installation from CD-ROM\Evaluation\).
This program checks a registry key responsible for ActiveX data access objects delivered
with Microsoft programs (Office (Excel), Visual Basic, Internet Explorer...) regarding
presence and correct value.
Key:
Value:
2002-11-15
HKEY_CLASSES_ROOT\LICENSES\F4FC596D-DFFE-llCF-9551-00AA00A3DC45
mbmabptebkjcdlgtjmskjwtsdhjbmkmwtrak
0413F0003A
117/123
FLUOstar*OPTIMA
Software User Manual
BMG Labtechnologies
A wrong value of this key will cause the error 429 ('ActiveX component can't create object
or return reference to this object') at startup of the evaluation software.
- If the key does not exist, it will be created (after pressing the 'Correct Error' button).
- If the key exists but has a wrong value, the old value will be saved under the name
'backup' in the same key and the key value will be changed to the correct value. Should
you encounter problems with other programs, you can restore the old key value using
the 'Restore' button of the Fix429 program.
Note:
The patch program 'Fix429' will be called automatically during the installation of
the FLUOstar OPTIMA evaluation part, so this error should occur (after
installation) only if you install a new Microsoft program, which may have deleted or
changed this registry key.
8.3 Error 1004 'VBA initialization failed'
When you get this error message after starting the evaluation part, some Excel add-ins are
missing or are not enabled, e.g. the VBA macro language.
Please start the evaluation part directly from the windows start menu (and not using the
Excel button in the control part). There will be a message telling you what parts are
missing and asking you whether you want to install these Excel parts. Please answer
'Yes'.
Using Excel XP it is also necessary to set the security level to medium or low as the high
level will not allow execution of our set of macros. To do so, please use the Excel menu
command 'Extras | Security'.
8.4 Error 40009 'No current row'
If this message appears when you open the evaluation worksheet, you must update the
Dao350.dll file installed on your computer.
•
Close Excel and open a Windows Explorer.
•
Open ~:\Program Files\Common Files\Microsoft
•
Rename the existing Dao350.dll file in the folder to Daoold.dll.
•
From the FLUOstar OPTIMA installation CD-ROM go to the directory
~:\FLUOstar OPTIMA Vx.xx-x\Installation from CD-ROM\Evaluation\
Shared\Dao\.
Excel97_RunTimeError40009V Copy the file Dao350.dll from the CD and paste it
in the ~\Microsof t Shared\Dao\ folder.
•
Reopen the software. There should be no error messages.
8.5 Disabled Plate In / Out Buttons
If both plate buttons (Jffij, -E_J) are disabled and there is no test run active and the
communication to the reader is OK, then it is most likely that there is a wrong setting in the
configuration file '~\Program Files\BMG\FLUOoptima\FLUOstar OPTIMA.ini'.
The value behind 'DisablePlateCmds=' should be 'False'. This parameter will be set
to 'True' if the reader is connected to a robotic/stacker system and the plate in/out
movement will be controlled only using the robotic software.
118/123
0413F0003A
2002-11-15
FLUOstar*OPTIMA
BMG Labtechnologies
Software User Manual
8.6 Access Rights under Windows NT / 2000 / XP
8.6.1 File Access Permissions
Microsoft changed the default access permissions for all program files newly installed. In
all Windows versions before Windows 2000, any standard user has access to the files
installed using a standard installation program. Beginning with Windows 2000, a normal
user (non-power user) has only read access by default. As we store important information
in data base files, all users of the BMG software need to have write access to certain files
in the program directory (usually ~\Program Files\BMG\FLUOoptima).
If you have used the option 'Program should be usable also for non power users'
during installation (see chapter 1.3.2 Control Part - Installation), the write access rights to
the necessary files will be set during the installation. If you did not use this option or if you
have added new users / user groups after installation, the following error might appear:
Error: You do nol have enough access rights for the folder 'D:\Prpgramme\BMG\FLyOoptima1.
Please run this program as a Power User or ask your system administrator to changetthe file access permissions.
For more information see software manual.
-
Solution
Logon as administrator (or user with administrative rights).
Run the program 'SetPermission' from the FLUOstar OPTIMA CD-ROM (folder
~:\FLU0star OPTIMA V x . x x \ I n s t a l l a t i o n from CD-ROM\).
Alternatively, you can also manually change the permissions: Open the Windows Explorer
and right-click the folder where the BMG Labtechnologies software is installed (usually
~: \Program Files\BMG\FLUOoptima). Choose 'Properties', then 'Security'. Check the
'Modify' permission, 'Write' permission will be checked automatically. Uncheck the box
'Allow inheritable permissions from parent to propagate to this object'. Now all users
should be able to write to the BMG Labtechnologies directory and work with the software.
2002-11-15
0413F0003A
119/123
FLUOstar*OPTIMA
BMG Labtechnologies
Software User Manual
Customized settings:
Default settings:
JJJll
I ,ibl*»thiHiltKjies Properties
Geneial | Sharing Security |
Geneial I Sharing SecurSy
Add,..
PWjtfflS
rdtors (MEETINGZVAdmrairattxs)
Mame
1 5 Adnwirtraters (MEETING2\Adminntreior$)
fiamow
f S CREATOR OWNER
f S CREATOR OWNER
B«wve
f $ Form Users (MEETING2MPowei Users)
f £ Ptoww Users (MEETING2\Povv« Users)
f 5 SYSTEM
SYSTEM
Alow
Dory
FtJCortrci
D
Modify
Read
D
g
El
0
W<it»
D
D
D
D
D
D
D
Read Si Execute
List Fcfcfei Conterte
Alow
•
FtlCcrirol
E
E
E
E
B
Modify
Read & Execute
List F C U M Conler<s
Read
Wiite
Deny
D
D
D
D
D
D
Advanced..
Advanced... |
rihadtabb permissions from parent to propagatetothis
P Alow
object
OK
]
Caned
iiow parent to pwipaflateibotfife1
ctiec*
j
Caned
Listing of files where write access is necessary
The following files / directories need to have full access to write (temporary) data.
Directory
File
Usage
~:\Program Files\BMG\FLUOoptima\
FLUOstar OPTIMA.ini
Configuration file
FLUOstar OPTIMA.ms
Run Statistik File
FLUOstar OPTIMA.log
Log file
~:\Program Files\BMG\FLUOoptima\Temp
Directory for temporary files
~:\Program Files\BMG\FLUOoptima\User
Subdirectories for test protocol
definitions and measurement data of
standard user
-AProgram Files\BMG\FLUOoptima\Admin
Subdirectories for test protocol
definitions and measurement data of
administrator
-AProgram Files\BMG\FLUOoptima\
<UserName>
Subdirectories for test protocol
definitions and measurement data of
defined users
~:\Program Files\BMG\_Flashtools
Used by Flash-EPROM Update
Program
120/123
0413F0003A
2002-11-15
FLUOstar* OPTIMA Software User Manual
BMG Labtechnologies
Borland Database Engine
Directory
File
Usage
~:\Program Files\Borland\Common Files\BDE\
idapi32.cfg
BDE properties
idapi32.bak
Backup of idapi32.cfg
pdoxusr.net
Paradox network control file
~:\
You can use the BDE Administrator to change the location of the
pdoxusr.net file (Configuration | Drivers | Native | Paradox | Net
Dir).
8.6.2 Registry Access
There are two places in the registry where the BMG Labtechnologies software stores
information:
All user specific things, like program settings (e.g. the program window position or current
state display options), are stored in the registry part HKEY_CURRENT_USER. There are no
access problems to this part.
All settings which are important for all users, like the selected communication port or
reading mode, will be stored in the H K E Y _ L O C A L _ M A C H I N E part of the registry (as this part
of the registry is intended for non-user specific information). For unintelligible reasons,
Microsoft changed the default access permissions for this part of the registry beginning
with Windows 2000. On all Windows versions before Windows 2000, every user has read
and write access to this general information part of the local registry, beginning with
version 2000 a standard user (non-power user), by default, only gets read access to newly
generated keys in this part of the Windows registry.
This access limitation can cause the Error: '0509: The program has not been correctly
installed or you are using W2000/XP without appropriate registry access rights.' at
program start if you did not use the option 'Program should be usable also for non
power users' during installation (see chapter 1.3.2 Control Part - Installation).
Solution
•
Logon as Administrator (or a user with administrative rights).
•
Run the program 'SetPermission' from the FLUOstar OPTIMA CD-ROM (folder
~:\FLU0star OPTIMA V x . x x \ I n s t a l l a t i o n from CD-ROM\).
or
• Start the program 'Regedt32' (Windows XP: 'Regedit', use the 'Run' from windows
start menu).
•
Goto'HKEY_LOCAL_MACHINE\Software\BMG Labtechnologies'.
• Select 'Permissions'.
•
Add read and write rights for everyone to this key and all sub keys.
2002-11-15
0413F0003A
121/123
FLUOstar*OPTIMA
BMG Labtechnologies
Software User Manual
8.7 Run Log Window
The Run Log window (control part) shows all commands sent to the FLUOstar OPTIMA
and all responses. You can open the Run Log window using the key combination
[Shift]+[Ctrl]+[L] from the program main window.
Run Log
Bii!
16:39:07 Run Log started 17.10.01 at 16:39:07.
16:39:07 9 ending to reader: $02 $00 $0A $05 $01 $00
$00$00$12$0D
16:39:07 (I nit command)
16:39:08 busy
16:39:08 Processing I nit cmd.
16:39:10 standby
16:39:10 Sending to reader:$02 $00 $0C $05 $05 $07
$00 $90 $00 $00 $AF $0D
16:39:10 (EEPROM data values command)
16:39:11 Reader response: [$02 $01 $0D $05 $07 $B8
$00 $00 $00 $01 $00 $00 $00 $00 $00 $00 $00 $00 $00
$00 $00 $00 $00 $00 $00 $00 $00 $00 $00 $00 $00 $00 $00 $00 $00 $00 $00 $00 $00 $00 $00 $00 $00 $00 $00
$00 $00 $00 $00 $00 $00 $00 $00 $00 $00 $00 $00 $00
$00 $00 $00 $00 $00 $00 $00 $78 $00 $78 $00 $01 $00
$EE $02 $00 $00 $00 $00 $00 $00 $00 $00 $00 $00 $00
$00 $00 $00 $00 $00 $00 $00 $00 $00 $00 $00 $00 $00
$00 $00 $00 $00 $00 $00 $00 $00 $00 $00 $00 $00 $00
$00 $00 $00 $00 $00 $00 $00 $00 $00 $00 $00 $00 $00
$00 $00 $00 $00 $00 $00 $00 $00 $00 $00 $00 $00 $00
!"~ Show status commands
f
Fitted pitch font
H
P
Stop
Sfrowconfifmationrespfeftses
| [Hjjjjp~]
.•GjBar
It is possible to stop the process of adding new entries to the run log by checking the
'Stop' checkbox.
You can print the entire run log or a marked part of the run log.
The run log will automatically be saved into a the file 'FLUOstar OPTiMA.log' in the
FLUOstar OPTIMA main directory (usually '~\Program Files\BMG\FLUOoptimaV).
You can switch off the generation of the run log file by changing the line 'RunLog=true' in
the configuration file '~\Program Files\BMG\FLUOoptima\FLUOstar OPTIMA.ini'
(section [Debug]) into 'RunLog= f a l s e ' .
Note:
122/123
At the next program start the existing content of this file will be erased. Whenever
you need support from BMG due to a software / firmware malfunction you should
send us the log file together with a description of the nature of the problem.
0413F0003A
2002-11-15
BMG Labtechnologies
FLUOstar* OPTIMA Software User Manual
9 Support
If you have any problems / questions regarding the software / the instruments, you should
visit our web page (http://www.bmqlabtech.com) and read the 'Frequently Asked
Questions' (FAQ) on the Support page. If you can not find an answer there, please contact
BMG using the following email addresses:
•
Problems / questions regarding software:
[email protected]
•
Problems / questions regarding the instruments:
tech .service® bmqlabtech .com
You can also use our on-line bug report form:
http://www.bmqlabtech.com/html/support/buqreport.cfm
2002-11-15
0413F0003A
123/123

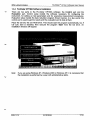
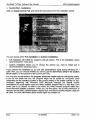
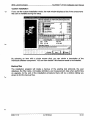
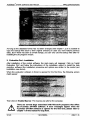
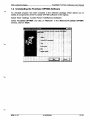
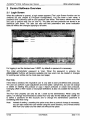
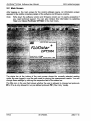
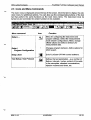
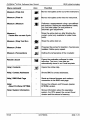
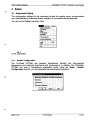
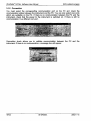
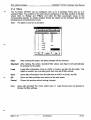
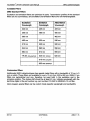
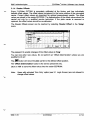
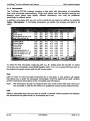
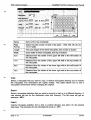

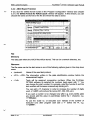
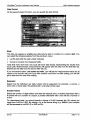
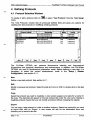
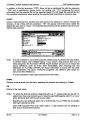
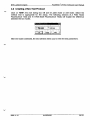
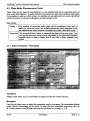
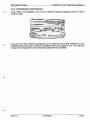
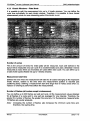
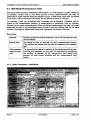
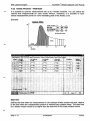
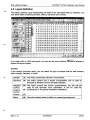
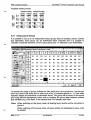
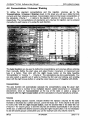
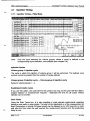
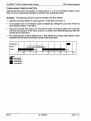
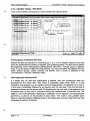
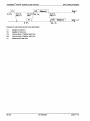
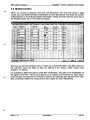
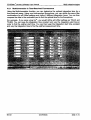
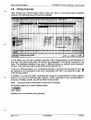
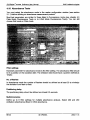
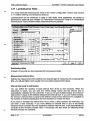
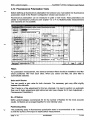
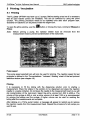
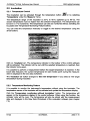
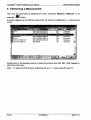
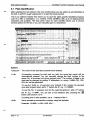
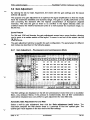
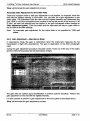
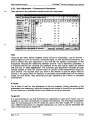
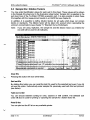
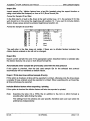
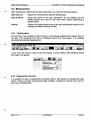
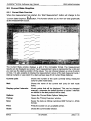
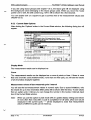
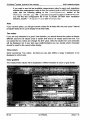

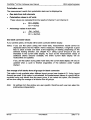
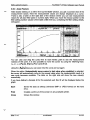
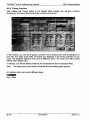
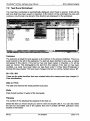
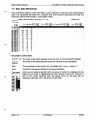
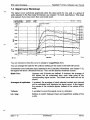
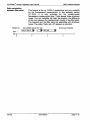
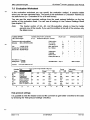
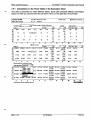
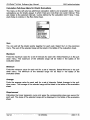
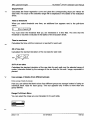
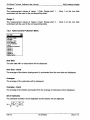
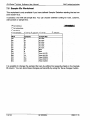
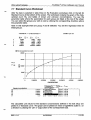
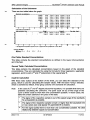
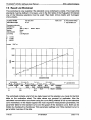
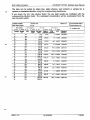
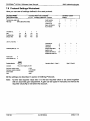
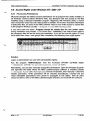
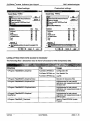


![[v0.3.5.63 Blue Release] (4.17MB PDF)](http://vs1.manualzilla.com/store/data/005758602_1-69f3b29a9a050ef0b6d8d37fccf12e09-150x150.png)