1
SIMUL8 User’s Manual
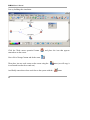
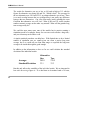
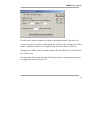
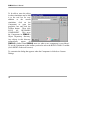
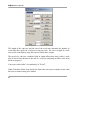
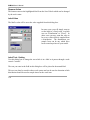
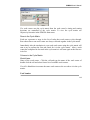
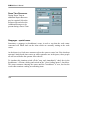
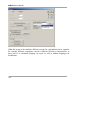
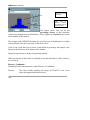
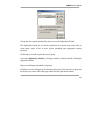
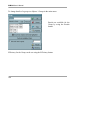
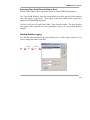
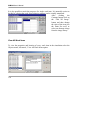
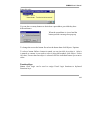
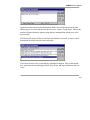
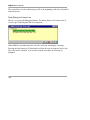
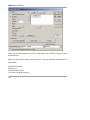
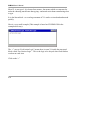
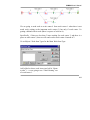
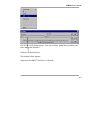
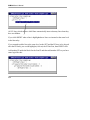
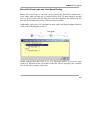
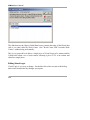
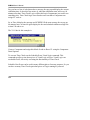
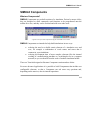
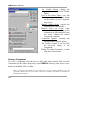
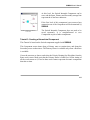
Drag the bars up
and down to change
percentages.
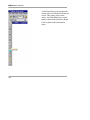
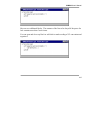
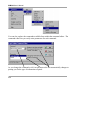
Click
the
RIGHT
mouse
button
for
additional
facilities,
like locking the bars or
adding more bars.
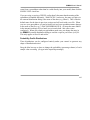
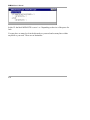
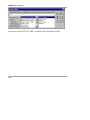
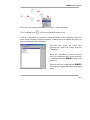
The figures above each bar are the
percentage chance of that particular
value being sampled from the distribution. (These figures are rounded to the nearest
whole number in this picture).
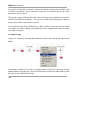
The example model PPDIST illustrates the use of this type of distribution to set label
values and then route the work items on the label values.
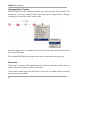
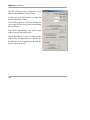
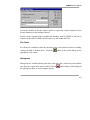
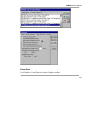
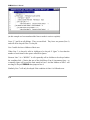
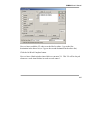
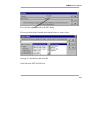
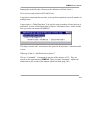
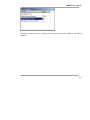
Click on one of the blue bars to select it and obtain its percentage and sample value
figures in the edit boxes at the bottom of the window.
Drag a bar up or down to change its percentage quickly.
When you do this all other bars are adjusted so the total still adds to 100% (Unless a
bar is locked).
Discrete / Continuous
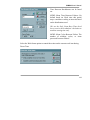
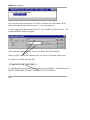
Probability Profile distributions are either Discrete or Continuous.
Discrete:
148
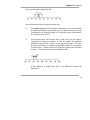
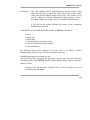
The value actually sampled will always be EXACTLY one of the
values that appear under the blue bars.