1
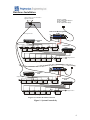
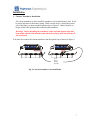
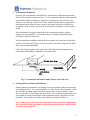
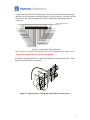
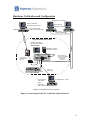
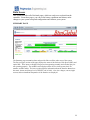
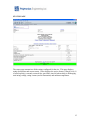
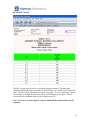
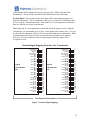
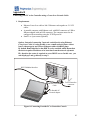
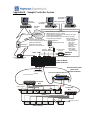
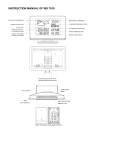
BtmGlobal SYSTEM
CONTROLLER
User Manual
Version 3.1.6
POLYTRONICS ENGINEERING
Referred to as PENG
Copyright PENG
©2006 All Rights Reserved
Table Of Contents
INTRODUCTION............................................................................................................. 4
REQUIREMENTS............................................................................................................ 5
HARDWARE OVERVIEW............................................................................................. 5
HARDWARE INSTALLATION..................................................................................... 6
INSTALLATION.............................................................................................................. 7
1.
2.
3.
4.
5.
CURRENT TRANSDUCER INSTALLATION ..................................................................... 7
CONCENTRATOR INSTALLATION ................................................................................ 8
SENSING AND POWER HARNESS INSTALLATION......................................................... 8
CONDUIT .................................................................................................................. 10
COMMUNICATION PATH INSTALLATION ................................................................... 10
HARDWARE VERIFICATION AND CONFIGURATION ....................................... 11
6. VERIFICATION .......................................................................................................... 12
SYSTEM SETUP AND OPERATION .......................................................................... 13
SYSTEM OPERATION................................................................................................ 13
ACCESSING BATTERY DATA................................................................................. 13
DATA ACCESS .............................................................................................................. 14
SUMMARY PAGE ...................................................................................................... 14
STATUS PAGE ............................................................................................................ 15
PRESENT DATA PAGE (BAR GRAPH) ........................................................................ 17
SINGLE JAR VOLTAGE PROFILE ........................................................................... 18
DETAIL DATA PAGE (NUMERIC TABLE) ................................................................... 19
PRESENT DATA PAGE (NUMERIC TABLE) ................................................................ 20
HISTROY LOG PAGE................................................................................................. 21
REQUEST DATA FORM ............................................................................................ 22
STRING PERFORMANCE (PROFILE) GRAPH .......................................................... 27
SYSTEM ALARM LOG PAGE................................................................................... 28
MONITOR STATUS PAGE ........................................................................................ 29
MAINTENANCE PAGE.............................................................................................. 30
VOLTAGE ADJUSTMENT ............................................................................................ 31
MAINTENANCE SYSTEM PAGE ............................................................................. 32
NETWORK PAGE ....................................................................................................... 33
STRING CFG ............................................................................................................... 34
BATTERY SERVICE .................................................................................................. 37
ADVANCED PAGE..................................................................................................... 38
TIME AND DATE PAGE ............................................................................................ 39
MAINTENANCE ACTIVATION PAGE .................................................................... 40
APPENDIX A .................................................................................................................. 42
HARDWARE INSTALLATION SITE NOTES ......................................................................... 42
APPENDIX B .................................................................................................................. 43
CONNECTING YOUR PC TO THE CONTROLLER USING A CROSS-OVER NETWORK CABLE 43
APPENDIX C .................................................................................................................. 46
CONTROLLER ALARMS AND STRING STATUSES ............................................................. 46
47APPENDIX D ............................................................................................................ 477
47SAMPLE CONTROLLER SYSTEM................................................................................ 477
3
Introduction
The controller is a real-time, stand-alone battery monitor with full networking support. It
is used for storing individual cells/jars and full string data, detecting abnormalities
coming from the battery measurements, warning about the changes in the battery
condition and alarming when critical conditions occur on an individual Jar(s) or the entire
string. Based on the collected data, the controller generates various comprehensive
reports for assessing the operational conditions and the health of the battery. The
generated reports are presented in Hyper Text Markup Language (HTML) and in Portable
Network Graphics formats (various graphs and plots) to utilize the Internet based World
Wide Web browsers.
The controller’s network support facilitates TCP/IP protocol over Ethernet and the PSTN
(built-in modem). The system is easily accessible (locally or remotely) over PSTN for
report viewing, data downloading, configuration and system upgrading. The system can
also be configured to automatically upload the report-pages to a predefined Web Site and
use Email for the remote enunciation of alarms (local ISP access point or local network
Gateway access is required).
Note: When required, the controller system can be augmented with a local monitor,
keyboard and mouse for on-site data viewing. As a standard, the controller system
installs without a monitor. Also, Modbus and Open Modbus can be used as optional
Interface protocols.
The controller system is composed of one or many measuring device(s) such as:
concentrators, RS232/485 to Optical converter, optical link or combined optical and
twisted pair link (Fiber-Optical Network) and data analyzing and storage device
(Controller/Modbus Console). The controller console controls the system and interfaces it
to the upper network layer.
The Modbus console controls the system and interfaces with the Modbus based higher
level monitoring system
The Controller console supports the following services over TCP/IP network:
Http:
serves battery report pages for WEB-browser
Ftp:
file transfer service (for remote configuration, or other file exchanges)
Ssh:
secure shell for remote system configuration/upgrade (replaces telnet)
SNMP: higher level network management protocol (eg. interface to Openview)
Mail:
electronic mail agent (configured to send alarm messages )
4
Requirements
On site, you need at least one RS232/485 optical converter, fiber optical cable, and a
portable computer (running Dos 6.2 or Windows XX) to check individual parts of the
system and verify the system is up and running correctly.
The Ethernet interface to the controller console is an asset, which will provide additional
interfacing capabilities.
A direct telephone line is required for remote access capability, data upload for global
access and support by PENG.
REQUIREMENTS FOR SITE
•
•
•
•
Ethernet access (optional)
Direct telephone line (optional if remote access/support is required)
Uninterruptible power supply 500VA or UPS protected AC outlet
RS232/RS485 optical service converter (for setup and troubleshooting)
Hardware Overview
The concentrators are configured either as low voltage or high voltage devices. The high
voltage concentrators can serve up to 15 Jars if the intercell resistance and internal
impedance of the Jar are measured together, and the low voltage concentrator can serve
up to 30 Jars if the intercell resistance and internal impedance of the Jar are measured
together. See Figure 1.
Warning: The total input voltage cannot exceed 280Vdc or fall below 18Vdc.
There are a few small differences in the equipment depending on whether the system is
monitoring 2V or 12V Jars. Although concentrators may look the same, it is important to
check the nameplate to tell whether the concentrator has the proper voltage for your
application.
All concentrators are powered from the battery monitored. However, the data acquisition
module (Controller) uses a 120/220 Vac outlet for power.
Note: In order to maintain data acquisition during a power failure, the AC outlet
must be UPS protected or have an emergency generator as a backup. The Fiber
Optical Converter(s) and line driver is powered from the Controller Console.
5
Hardware Installation
Alarm contacts, may be connected to
light/bell if desired)
120 Vac (1 A Max)
12 Vdc output power supply or
220 Vac (1 A Max)
12 Vdc output power supply
AL WD
IN
OUT
Float Current Monitoring Device
ID #31
Fiber Optical Cable
Out
In
Concentrator
ID #3
T Sensor
Charger Negative
Concentrator
ID #1
Jar #32
Jar #17
Charger Positive
Jar #16
Jar #1
Battery String #1
Out
In
Concentrator
ID #3
T Sensor
Charger Negative
Jar #32
Jar #17
Concentrator
ID #1
Charger Positive
Jar #16
Jar #1
Battery String #4
Diagram of Controller Back End Connections
Figure 1: System Connectivity
6
Installation
1. Current Transducer Installation
If a current transducer is used, install the transducer coil around a battery lead. It can
be placed anywhere in the battery string. Make sure the arrow is facing the positive
post of the battery as shown in the diagram below in Figure 2. Make certain to retorque all the bolts loosened after connecting the transducer.
Warning: Before installing the transducer, make sure that proper steps have
been taken with the critical load so that when the string is open, the system will
not be affected.
You must also connect the current transducer into the optical loop as shown in Figure 1.
(+)
(-) (+)
(-) (+)
(-) (+)
(-)
(+)
(-) (+)
(-)
(+)
(-) (+)
(-)
Arrow
Facing
Positive
Terminal
Fig 2: Current transducer core installation
7
2. Concentrator Installation
Typically, the concentrators are installed as a wall mount or under the upper battery
rack at 30 Jar intervals as shown in Fig. 3. It is recommended that the concentrator be
placed in the middle of the battery segment it is monitoring in order to reduce the
amount of wire needed. If there were a more suitable location for the concentrators
other than the wall inside the battery room or the battery racks, this would also be
acceptable. Make sure that wherever the concentrator is installed, it is held in place
firmly.
Each concentrator is uniquely identified by the concentrator number, which is
displayed on the nameplate. Concentrators must be installed sequentially and in
accordance with the wiring chart.
All the jar numbers noted here (and on the wiring chart) are in reference to the most
positive end of the string. The jar at the most positive end of the string will be called
Jar #1 and counted sequentially.
Check the wiring diagram for the concentrator ID number that is designated to be
connected to the transducer. Install this concentrator first.
Fig. 3: Concentrator installation under battery rack (side view)
3. Sensing and Power Harness Installation.
Starting from the concentrator, run sensing wires in accordance with the concentrator
wiring diagram Fig 4. It is recommended to use AWG 18 wire for the hookup. When
the concentrator wiring diagram specifies separate wire, you must install it even if
there is more than 1 wire going to the same point. For a connection to the battery, the
wire should be stripped and crimped to the appropriate battery clip (black or red as
specified). Next, connect the battery clip to the post as shown in Figure 5.
Note: Make sure the wire is terminated at the battery post with the appropriate
clip as specified in the concentrator wiring diagram (black clip is fused, red clip
is resistive current limiter).
8
Connect the other end of the sensing wire to the specified terminal connector using
the labels on the faceplate as shown in Figure 4 as your reference. Typically, the first
block of 4 is not connected unless the pilot jar temperature monitoring option is
requested.
Fiber Optics
Output
B- 28 26 24 22 20 18 16 14
12 10 8 6 4 2 B1+ B+
29 27 25 23 21 19 17 15 13
11 9 7 5 3 1 BC HC
JAR 30(-), FUSED
JAR 30(-), FUSED
JAR 29(-), RESISTIVE
JAR 28(-), RESISTIVE
JAR 27(-), RESISTIVE
JAR 26(-), RESISTIVE
JAR 25(-), RESISTIVE
JAR 24(-), RESISTIVE
JAR 23(-), RESISTIVE
JAR 22(-), RESISTIVE
JAR 21(-), RESISTIVE
JAR 20(-), RESISTIVE
JAR 19(-), RESISTIVE
JAR 18(-), RESISTIVE
JAR 17(-), RESISTIVE
JAR 16(-), RESISTIVE
JAR 15(-), RESISTIVE
JAR 14(-), RESISTIVE
BTM CONCENTRATOR, ID #1,
JARS 1 - 30
Fiber Optics
Input
JAR 1(+), FUSED
JAR 1(+), FUSED
JAR 1(-), RESISTIVE
JAR 2(-), RESISTIVE
JAR 3(-), RESISTIVE
JAR 4(-), RESISTIVE
JAR 5(-), RESISTIVE
JAR 6(-), RESISTIVE
JAR 7(-), RESISTIVE
JAR 8(-), RESISTIVE
JAR 9(-), RESISTIVE
JAR 10(-), RESISTIVE
JAR 11(-), RESISTIVE
JAR 12(-), RESISTIVE
JAR 13(-), RESISTIVE
UNUSED
Figure 4: Concentrator Wiring Diagram
Note: Before you connect the sensing wires to the terminal block, make sure to
remove the terminal blocks from the concentrator.
It is highly advisable that all wires should be labeled at each end of the cable. These
labels are provided with each system.
Figure 5: Typical battery sensing clip connection to a battery post
9
4. Conduit
Run the plastic wiring duct along the battery rack rail with the outlets positioned at
each battery cell or use other means (cable ties) to bundle and hide the sensing
harness (wires).
5. Communication Path Installation
Layout the communication loop, and measure the distances between the connection
points. Run the twisted pair cable, if necessary, and the fiber optical cable next. The
devices are connected in a daisy chain format - from the Fiber Optics Output (White)
of one device and then connected to the Fiber Optics Input (black) of the next.
Warning: The fiber optical loop must be planned very carefully
before cutting the fiber optic cable because there are no way to join
cut pieces of fiber optic cable together without any extra equipment.
Also, neither the sequence nor the total length of the cable is
important. The only important aspect is the length of the longest
piece of the cable is. The longest fiber optic cable must not exceed 60
meters.
The Fiber Optics Output of the last Concentrator of the fiber optical link is connected
to the RS232/485 to Optical converter input (black). The Fiber Optics Output (white)
of the Optical Converter is connected to the closest device Fiber Optical Input. Plan
your connections of fiber optical cable to minimize the length of the longest fiber
optical cable run. If multiple strings are connected to the single optical loop, then
fiber-optical cable must connect across strings (sometimes in an other battery room).
Take care to keep the radius on all bends at least 2 inches or 40 mm. Fiber optic
cables cannot be joined. Care should be taken to run all lengths prior to cutting.
Terminating Fiber Optic Cables
The fiber optic cable from the concentrators should be terminated in the appropriate
socket in the RS-232 converter unit. The converter should be located close to the
computer and modem. Prepare the end of the fiber optic cable by cutting it at a right
angle with a sharp utility knife. The outer covering should then be stripped back for a
length of 0.15 inches or 3 mm. To smooth off the fiber optic for better light transfer,
heat the blade of the utility knife for a few seconds and then place it on the end of the
fiber cable for about 1 second. This will leave a shiny flat end on the cable. Position
the prepared end of the fiber optic cable in the input (or output) of the special fiber
optic’s connector, be sure the connector is loosened. Push the end of fiber optics cable
into the housing, tighten the connector with finger force as would be used to close a
toothpaste container.
10
Hardware Verification and Configuration
Workstations on IP network
Remote Workstation
Windows Hyperterminal SW
Internet Explorer
HTML Report Pages
Dial-in / Remote data
access / remote configuration
PSTN line
Data access
system configuration
Controller Stand-alone system
LAN / WAN
LCD/CRT with VGA IF
(min. Resolution 800x600,
NOT INCLUDED)
120/220 Vac (1 A Max)
protected power source
PWR
P/ WLED
PSTN Interface:
external modem
(optional)
CF LED
HDLED
COM1
KM
LAN1
CRT
Ethernet interface
(RJ-45 for 10/100Mbs):
TCP/IP protocol:
- HTML server
- FTP server
Ethernet access-point
Rs232 cable
Keyboard/Mouse if local LCD option
selected (NOT INCLUDED)
Cross-over
network cable
Internet explorer HTML Report
Pages
On Site Mobile PC / Laptop
Data access
system configuration
Diagram of Controller Front end connectivity.
Figure 6: Connecting Portable PC to the Fiber Optical Network.
11
6. Verification
Verify the installation by testing the connections to the terminal blocks before
actually connecting the terminal blocks to the concentrators.
With the help of a voltmeter (range 0 – 300V), measure the potential between
terminals B+ and B-. The value should be equal to:
V = Number Of Jars Monitored By Concentrator * Average Jar Voltage
(E.g. 2.2V average jar * 24 = 52.8V)
Warning: Under no circumstances should the total voltage be:
Below 18V or above 200V (low voltage range device);
Below 60V or above 280V (high voltage range device);
Measure the potential between the connector labeled at BC and B1+. This value
should be the average Jar voltage. Next, move the voltmeter lead to the next
connector (1). The voltage reading should be two times the average Jar voltage.
Continue this method until reaching connector 29. Each new connector should
have an increase in potential, over the previous Jar, of the average Jar voltage.
If the voltage verification checks out, connect the terminal blocks of every
Concentrator.
The red LED on the left side of the faceplate should start to blink approximately
once every second to verify everything was done correctly.
12
System Setup and Operation
The controller you have received has been pre-configured for your installation.
Reconfiguration of the controller box can be performed remotely over the telephoneline (dial in), Ethernet or locally.
SYSTEM OPERATION
The standard controller console operates without a local interface. The basic system
information is displayed on the numeric LED-display. The local display (monitor) can
be easily connected at any time.
To activate the battery monitor, make sure that the hardware is installed and
functional, the fiber optical loop is connected to the optical converter and the optical
converter is connected to the COM 1 (9-pin male connector on the controller
console).
Verify that the network is connected to the Console and the line is active. Turn the
controller console power switch on, and within approximately 30 – 60 seconds, the
console should boot up and start functioning.
ACCESSING BATTERY DATA
The controller system facilitates several means to access data. All necessary battery
data is stored in the controller and is also presented in an HTML formatted report file.
Any graphics are produced in the PNG (Portable Network graphics) format. All
report files will be periodically uploaded by the System to a pre-configured website
from where the data can be viewed using any internet-browser.
The global data access is restricted and protected with password. Contact PENG for
account and password information for accessing data on the Internet. Complete
access to all data (including raw data) can be achieved by establishing a dial-in
network connection, or by connecting the Controller Console to a local Ethernet
network. The Console has a built-in web-server capability and, all HTML report
pages can be browsed using a local network connection or over a dial-in network.
Raw data, ASCII text tables and other relevant files, can be retrieved using an FTP
site.
NOTE. The Controller Console is configured for dynamic IP address and should
work with any existing network. The Ethernet interface is configured to be
active.
13
Data Access
This section describes all of the html pages, which are used to access data from the
controller. From these pages, you can see the battery conditions and alarms, make
changes to your system setup and configuration and calibrate your system.
SUMMARY PAGE
The Summary page summarizes data and provides links to all the other areas of the system.
The first (or upper) section of the page displays the status of the Software, Disk Space (DSP), and
optical link. These areas are displayed in green when operating normally and red when they are
not operating properly. The middle section displays all the devices in the system, their ID
number, and their status. The lower section displays information about the batteries themselves:
the status, alarms, and charge level (CHGLEV) out of 100%. Also, the voltages, current, ripple
current, and room ambient temperature of the batteries are displayed.
14
STATUS PAGE
The status page summarizes all the strings configured for the site. This page displays
string descriptions and current status. It also displays the active alarm(s), charge level (%
of rated capacity), currently restored Ahs, rated Ahs, time left when string is discharging,
total string voltage, string current (and its fluctuation) and ambient temperature.
15
HI/LO DATA PAGE.
The Hi/Lo report page gives you overall battery health summary. The individual
calculated parameters used to calculate the Overall Index are available in the Detail data
table. The Jars will be ordered from weakest to strongest. If a Jar overall index value is
close to the pre-configured limit value, the jar will be displayed in yellow. If the jar
exceeds the pre-configured limit, it will be displayed in red.
Note: For a more accurate battery analysis, detailed battery data studies may be
required.
16
PRESENT DATA PAGE (bar graph)
The present data page shows all Jar readings in graph form. This page can be accessed
from the status page.
If values are close to the pre-configured limit, they will be displayed in yellow. Any
values that are outside the pre-configured limits will appear in red. The total string
voltage, average Jar and voltage standard deviation are displayed on the left side of the
header of the page. The voltage ripple and slow changes are displayed on the right.
Selecting a single bar and clicking on it will produce a single Jar voltage profile for last
six months (see below).
17
SINGLE JAR VOLTAGE PROFILE
18
DETAIL DATA PAGE (numeric table)
The Detail report page gives an overview of all the individual parameters used in the
overall battery index calculation.
If the parameters are available, the column header will have the date and time the string’s
parameter was last calculated. If the parameter is not available or a calculation is not
possible, NA will be displayed.
Note: All parameters are normalized and expressed in percentage of normalizing
value (100%). Calculation algorithms are constructed such that an increase in the
value correlates to the degradation of the battery.
Only the latest calculated parameter set is available in this table.
19
PRESENT DATA PAGE (numeric table)
The present data numeric table gives an overview of the current battery voltages, terminal
ripple and slow voltage changes during float operation.
20
HISTROY LOG PAGE
This page gives an up to date overview of all activities on the system such as: their start
time, duration, average current during an event, and remaining capacity percentage.
Note: Events are listed from the most recent to latest.
21
REQUEST DATA FORM
This form allows you to specify the voltage profile parameters for selected jars, current,
and temperature. The form is displayed when accessing data through the local network,
or over the Internet.
To generate a report, you must select a start date and time and an end date and time for
the reporting period. If multiple strings are configured for the site, you must select string
number.
If you would like to generate a report for a few selected jars, you can fill in Jar list 1 and
Jar List 2 (both lists are appended to each other, however, if List 1 is empty then List 2 is
ignored). Lists can be comma separated as shown below.
E.g. List 1: 5,9,15..20,33,69..71 will produce report for jars 5,9,15,16,17,18,19,20,33,69,
70 and 71.
22
Note: Do not forget to check selected jars radio-button, when requesting reports for
limited jars.
The graphical report Y-scale is the battery terminal voltage. Its minimum and maximum
values are defined automatically by min and max values measured for the reporting time
period. Also, filling in the HIGH VOLTAGE and LOW VOLTAGE LIMIT values can
configure these values. Do not forget to check the Configured Limits radio-button, when
using user-defined limits. Any value can be used as long as the HIGH VOLTAGE is
greater than LOW VOLTAGE
Following report pages can be requested:
Average jar and individual jars, battery current and ambient temperature.
In addition, if Float Current Monitor (optional) device is included in the monitoring
system, the battery float current and ripple current profiles are available.
Report graphs are produced in time-domain(x-axis). However, sometimes it is more
informative to plot the profile-date in event-points (to evaluate emerging trends in
terminal voltages). See sample graphs on the next page.
Report data can be presented as graphical plot, or data can be received as ASCII text
table. The latter can be imported into MS-Excel or any other spreadsheet program for
further analysis.
23
Battery Profile Report in Time-Domain
The same as above Battery Profile Report in event-points
24
Requested String Current Profile.
25
Requested ambient temperature profile
Requested Jar Voltage profile
26
STRING PERFORMANCE (profile) GRAPH
The string performance profile graph displays string current, ambient temperature, and jar
voltage (average, minimum and maximum) behavior over last 2 months (depends on
configuration). The maximum jar ripple voltage and slow change difference is also
graphed. This page helps the operator to evaluate battery current status.
27
SYSTEM ALARM LOG PAGE.
The alarm log file lists all the alarms recorded, their activation time and pairs of Ids with
their values. If the alarm is String related, ID#0 denotes average voltage and ID#1
denotes string current. Otherwise, the ID is jar ID number that is counted from the most
positive end (facing charger positive) of the String.
For detailed description of alarms for Controller, see Appendix C.
28
MONITOR STATUS PAGE
The monitor status page displays information about all the installed concentrators.
In this table, all configured devices are listed by their type (Concentrator, Float Current
Monitor, Loader, etc.), data acquisition status (OK, OFF-LINE) and a device data
acquisition time. If some devices have observed intermittent communication problems,
the device will appear in yellow on the table, and the number of lost packages and/or CSerrors will be displayed.
29
MAINTENANCE PAGE
This page will take you to the configuration and setup section. There is a password in
order to get in and change the configuration of the system. It is important that only
experienced personnel work on the maintenance page. The password is “dixie” and is
case sensitive. Once you type in the password you will select the string you wish to edit.
After that, you will chose either the BTM configuration screen or the Voltage
Adjustment screen. The BTM configuration page will allow you to make changes to the
setup of your system, and the Voltage adjustment will allow you to easily calibrate your
devices.
30
VOLTAGE ADJUSTMENT
As a part of the controller maintenance program, the concentrators need to be verified
periodically against a calibrated voltmeter. If any of the voltage readings need
correcting, the controller offers a convenient way to adjust every individual input reading.
This page allows you to make calibration changes to the specified string. The jars are
listed in columns with the present reading beside them. The new reading column allows
you to enter the new value. If another string needs to be adjusted, you must go back to
the Maintenance page and enter the next string number and the corresponding password.
It is not necessary to adjust every value, just the values that read inaccurately.
31
MAINTENANCE SYSTEM PAGE
The System page allows you to edit site information and most importantly the system
configuration. This screen is where you enter the number of strings and total number of
devices in your system. These values must be entered in order for you system to detect
all of your devices properly. For the changes to take effect, you must click ‘Submit’ and
then ‘Maintenance’. The next step is described in the Maintenance Activation Page.
32
NETWORK PAGE
The Network page allows you to make adjustments to the network configuration.
For the changes to take effect, you must click ‘Submit’ and then ‘Maintenance’. The
next step is described in the Maintenance Activation Page.
33
STRING CFG
The String CFG page allows you to edit the detailed aspects of the configuration.
Important areas included:
Shunt device: Must always be a device (concentrator), which is part of the string you are
editing.
Float-Current Device: Is the Float Current Device ID number that is connected to the
current string. If there is no Float Current Device, this value should be zero.
Temperature Device: Is the Float Current Device ID number that is connected to the
current string. IF there is no Float Current Device then this value must be a concentrator
unit ID that is within the string.
Concentrator List: This list must include all the concentrator ID numbers, which are
within the current string. You can list them individually with commas, ex. 1,2,3,4,5 or
you can select a sequence by using two periods, ex. 1..5, which would indicate units 1 to
5. You can also use a combination of these methods.
The limits allow you to set where the alarms become activated.
34
After entering all the changes to be made, you must click ‘Submit’ and then click
Maintenance. The next step is described in the Maintenance Activation Page.
Exclude Inputs: This section requires knowledge of the internal input mapping of a
physical concentrator. The key point here is that in every ‘physical’ Concentrator, there
are two ‘logical’ concentrators inside. That means for every one physical concentrator,
there are actually two logical concentrators.
That being said, it is also important to realize that not all the input are used. With one
concentrator, you can monitor up to 30 jars. As the figure below shows, jars 1-15 are on
the first logical conentrator, and jars 16-30 are on the second logical concentrator. When
excluding inputs, the first five are not used and all intercell inputs can be ignored.
However, if you do exclude the intercell inputs along with the jar inputs, this is
acceptable as well.
Internal Input Mapping Structure of a Concentrator
Temperature
Not Used
Current
Total Voltage
Intercell 1
Jar 1
Intercell 2
Jar 2
Intercell 3
Logical
Concentrator
One
Intercell 4
Jar 4
Intercell 5
Jar 5
Intercell 6
0
1
2
3
4
5
6
7
8
Intercell 10
Jar 10
Intercell 11
Jar 11
Intercell 12
Jar 12
Intercell 13
10
11
12
13
14
15
16
17
18
19
20
21
22
23
24
25
26
27
28
Intercell 14
Jar 14
Intercell 15
Jar 15
30
31
32
33
Intercel l 7
Jar 7
Intercell 8
Jar 8
Intercell 9
Temperature
Not Used
Current
Total Voltage
Intercell 16
Jar 16
Intercell 17
Jar 17
Intercell 18
Logical
Concentrator
Two
Intercell 19
Jar 19
Intercell 20
Jar 20
Intercell 21
0
1
2
3
4
5
6
7
8
Intercell 25
Jar 25
Intercell 26
Jar 26
Intercell 27
Jar 27
Intercell 28
10
11
12
13
14
15
16
17
18
19
20
21
22
23
24
25
26
27
28
Intercell 29
Jar 29
Intercell 30
Jar 30
30
31
32
33
Intercel l 22
Jar 22
Intercell 23
Jar 23
Intercell 24
One Physical Concentrator
Figure 7: Internal Input Mapping
35
Here is an example:
Jar Inputs 1-18 and 29 are to be used. The line in the Exclude Inputs section will be as
follows:
0:2:(10..29,32..33)
or could be looked at as:
0:2:(10..29,32..33)
This is the convention. The first 0: is simply used to open the section. The 2: is the
logical concentrator number 2. The (10..29,32..33) are excluding jars 19-28, leaving 29,
and excluding 30. You should be able to see the values with the corresponding input
values in the Internal Input Mapping figure. You must use a comma ‘,’ to separate
values, or two periods ‘..’ to include a range of values.
Now, if you wanted to exclude the last 3 jar inputs (jars 28, 29, 30) on all three
concentrators in String 2, you would use the following line:
0:2:(28..33),4:(28..33),6:(28..33)
or could be looked at as:
0:2:(28..33),4:(28..33),6:(28..33)
In this example, remember that you are excluding the last 3 jar inputs on three separate
concentrators. Therefore, you are excluding the last 3 jars on the second logical
concentrator of each of the three. You must place a comma between each concentrator
you decide to excluding inputs on. The initial 0: does not need to be repeated.
36
BATTERY SERVICE
The Battery Service Section allows you to enter the battery servicing information.
For changes to take effect, you must click ‘Submit’, and then ‘Maintenance’. The next
step is described in the Maintenance Activation Page.
37
ADVANCED PAGE
This section deals with the advanced communication settings. Do not edit these values
unless you are very familiar with their functions due to the fact that incorrect settings will
cause the system to lose communications. For the changes to take effect, you must click
‘Submit’, and then ‘Maintenance’. The next step is described in the Maintenance
Activation Page.
38
TIME AND DATE PAGE
This page simply sets the time and date of the controller. This is very important to set
accurately so that when data and/or alarms are recorded, they display the correct time.
39
MAINTENANCE ACTIVATION PAGE
The Maintenance Activation Page will cause all changes made in the Maintenance pages
to take effect. There are several functions that can be made which are related to
Activation.
Clear All: This clears all recorded data and will not be unrecoverable from the system.
This function is destructive and must be used with care. However, it should be used
when starting a new setup (possibly after installing a new concentrators) in order for the
displayed data (Graphs etc.) to display the correct data. Before the Clear All function is
used in this situation, the ‘Dump CSV’ and/or ‘Dump Binary’ should be used first.
Dump CSV: This function allows you to save all the recorded data your remote
computer. It will be saved as a CSV file.
Dump Binary: The system records all data in binary form and converts it to a useable
(.csv) format for viewing. Technically, the Dump Binary and Dump CSV are very
similar. However, the Dump CSV is the data in a usable form. If you want the binary
files, click on the Dump Binary icon.
Reactivate BTM: This function is used when changes have been made to the
configuration of the device in the maintenance section. This will cause all changes to
take effect.
Reactivate Network: This restarts the network in order to have Network changes take
effect.
40
Reboot System: This performs a soft OS reboot of the system. It is suggested that your
IT department backup all recorded data before using this function (Dump Binary/CSV)
Clear CSV’s: This is used to recover hard drive space. It is similar to Clear All function,
but it does not clear the Binary files and the data is recoverable.
41
APPENDIX A
Hardware installation site notes
Hardware installation site notes.
Concentrators
Serial #
used as
#
Fiber #
in
#/FROM
Fiber #
out
#/TO
string
#
Serving Jars
from - to
42
Appendix B
Connecting your PC to the Controller using a Cross-Over Network Cable
1. Requirements.
Ethernet Cross-Over cable to link 2 Ethernet cards together or 2 CAT-5
cables
A portable computer with Ethernet card with RJ45 connector or USB to
Ethernet adaptor with an RJ45 connector. The computer must also be
configured for networking using the TCP/IP protocol.
Small 2 or 4 port router (optional)
Option: Instead of connecting 2 network cards directly using Ethernet
Cross-Over Cable, it is also possible to use a small network router with at
least 2 ethernet ports and 2 direct Ethernet cables with RJ45 plugs.
By default, BtmGlobal device has DHCP service enabled, which means that
the device acquires IP address at its boot time from the network (dynamic
IP), therefore the router is required to act as DHCP server. In this case, you
can skip dyep 2 and go directly to step 3.
RS232/Modbus Interface
Ethernet Cross-Over
Cable
To ETH interface
connector
To Portable PC
Network adapter
Figure 8: Connecting Portable PC to Controller Console
43
2. Setup
• Connect your portable computer to the controller box’s Ethernet port
connector using the crossover cable (or use 2 direct cables and a small hub). (see
figure above)
Warning: The BtmGlobal Controller must have Static IP defined. If this is not the
case, direct connection with cross-over cable is not possible. Only connection using
small network router will work.
• Modify (or verify) your network card TCP/IP settings. This can be done by
going to the <Start> menu, select <Settings> and <Control Panel>. From the
<Control Panel> window, you double click on the <Network> icon. In the icon
<Network>, click on the <Configuration Tab> dialog box and then the <Installed
Component List box>. Highlight the entry TCP/IP-> Ethernet-card (connected to
Modbus Box). If your computer has multiple network cards configured, make
sure that you select is the right one. After highlighting the entry, click
<Properties>. Next, select the <IP ADDRESS> tab. Write down the existing
settings. To modify the settings, select the <SPECIFY an IP Address:>. See
Figure 9.
Figure: 9 TCP/IP Protocol Settings
Figure: 10 Network Settings
44
If the OS requires an installation CD after closing the <Network> dialog, specify the
location as your windows directory (For example: C:\WINDOWS). For Windows 98:
You must restart the computer after completing this step.
3. Connecting to Controller
• Start your Microsoft Internet Explorer or Netscape Internet Browser.
• In the address bar, type http://BtmGlobalXX, where XX is digits 01 – 99. The
Controller name is recorded on the front-label.
• The Battery Index page should be displayed. Now, navigate through battery
data as desired.
4. Restoring your Computer TCP/IP settings
After finishing the upgrade, disconnect the network cable and restore your original
TCP/IP settings as you recorded from step 2. If you do not restore to your original
settings, some of your applications or network connections may not work properly. The
Modbus Translator Box must remain operational (you will see changing scan-codes on
the LED display).
45
Appendix C
Controller Alarms and String Statuses
Alarm
String Exhausted
String Open
Pending Jar Reversal
Low Capacity
Jar Internal resistance High
Jar Voltage Below set limit
Jar voltage Above set limit
Jar High Float Mobility
Jar High Noise during Float
Temperature Abnormalities
Discharge Warning
Charge Warning
Equalization Warning
Jar Parameters Degraded
Description
Battery total voltage is below discharge
end voltage (during discharge)
String is at open potential, charger not
connected or malfunctioning
A jar terminal voltage is near its end
voltage during discharge. This jar does not
support the load any longer.
String capacity near exhaustion, a few
minutes reserve time remaining
The internal resistance of a jar has
increased drastically.
During float operation, the jar terminal
voltage is below preset limit.
During float operation, the jar terminal
voltage is above preset limit.
Jar terminal voltage drifts significantly
during battery floating
High ripple voltage during float operation
Ambient/Pilot temperature outside limits
String is discharging
String is charging
String is at Equalization potential
Jar calculated parameters during discharge,
charge or Float have been degrading.
Note: Each alarm can be individually enabled/disabled. The controller can send
an e-mail when an alarm is detected if it is connected to the LAN or has a dialout to the ISP capabilities enabled.
String Status
Description
String status unknown. During a system
NA
start-up or communication failure
String is at open potential
OPEN
String
is
fully charged and floating at its
FLOATING
nominal voltage
Charge current is not detected, battery not
FLOAT-CHARGING
at open potential but its capacity is not
fully restored.
Charging current to the battery detected.
CHARGING
Battery at equalizing potential (prolonged
EQUALIZING
application will be harmful to the battery).
Load is on the battery.
DISCHARGING
46
Appendix D. Sample Controller System
Local Network
Workstation
Remote
Workstation
HTML Report Pages
Local Network
Workstation
WW WEB
Access
LAN
TCP/IP Address for Controller Console:
* Statically assigned (in factory - default)
INTERNET
Dial-in
* Dynamic address ( DHCP protocol, from local sub-net master,
ISP/Web hosting
Networking (PPP)
configurable during installation)
* Dynamic address (DHCP protocol, as local sub-net master,
configurable during installation)
Ethernet interface
ISP dial-in
(RJ-45 for 10/100Mbs):
Automatic HTML-pages upload
120/220 Vac
* TCP/IP protocol:
E-mail messaging (fax/pager options)
- HTML server
protected power source
PSTN Interface (Modem)
- FTP server
Supports PPP and TCP/IP
- Telnet/SSH server
PSTN line or Auto answer / automatic dial-out
- Mail server
Satellite Modem
- SNTP support
- DHCP support
VGA for KBD
- Open Modbus
Rs232 to Rs485
local LCD mouse IF
Protocol support
Converter
MODBUS
Master
COM 3 COM 1
9V
Ethernet
External AT Command Set
Compatible Modem
Linux OS Based
System Controller
2 Alarm contacts
can be connected to
light/bell
Fiber Optical Cable
Float Current monitor
power from
System Controller
Float Current Monitoring Device
ID #31
Out
In
Concentrator
ID #3
T Sensor
Charger Negative
Concentrator
ID #1
Jar #32
Jar #17
Charger Positive
Jar #16
Jar #1
Battery String #1