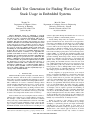
1
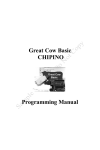
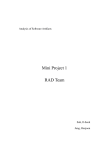
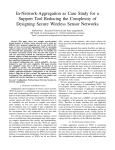
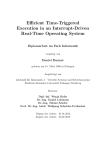
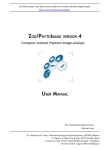
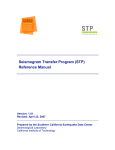
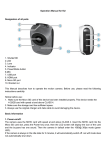
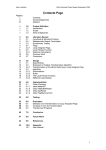
Guided Test Generation for Finding Worst-Case
Stack Usage in Embedded Systems
Tingting Yu
Department of Computer Science
University of Kentucky
Lexington, KY, 40506, USA
[email protected]
Myra B. Cohen
Department of Computer Science & Engineering
University of Nebraska - Lincoln
Lincoln, Nebraska, 68588, USA
[email protected]
Abstract—Embedded systems are challenging to program
correctly, because they use an interrupt programming paradigm
and run in resource constrained environments. This leads to
a class of faults for which we need customized verification
techniques. One such class of faults, stack overflows, are caused
when the combination of active methods and interrupt invocations
on the stack grows too large, and these can lead to data loss
and other significant device failures. Developers need to estimate
the worst-case stack usage (WCSU) during system design, but
determining the actual maximum value is known to be a hard
problem. The state of the art for calculating WCSU uses static
analysis, however this has a tendency to over approximate the
potential stack which can lead to wasted resources. Dynamic
techniques such as random testing often under approximate the
WCSU. In this paper, we present S IM S TACK, a framework that
utilizes a combination of static analysis and a genetic algorithm
to search for WCSUs. We perform an empirical study to evaluate
the effectiveness of S IM S TACK and show that S IM S TACK is
competitive with the WCSU values obtained by static analysis,
and improves significantly over a random algorithm. When we
use only the genetic algorithm, S IM S TACK performs almost as
well as the guided technique, but takes significantly longer to
converge on the maximum WCSUs.
I.
I NTRODUCTION
Modern embedded systems are highly concurrent, memory,
and sensor intensive, and run in resource constrained environments. They are often programmed using interrupts to provide
concurrency and allow communication with peripheral devices.
This combination of resource constrained, interrupt driven
execution makes embedded software prone to several specific
classes of runtime faults, such as those caused by worst-case
execution or long interrupt latency, by timing violations and/or
by stack overflows. Stack overflows, the subject of this paper,
is a memory fault that occurs when the stack usage grows until
it reaches and overlaps with another section of memory.1
Stack overflows can cause catastrophic software crashes resulting in data corruption, loss of return addresses or both [11].
For example, a stack overflow failure shut down a German
railway station [1], and the unintended acceleration of the 2005
Toyota has been recently identified as being caused by this
type of fault [7]. Therefore, engineers must ensure that the
maximum allowable stack size will not be exceeded prior to
1 Stack overflow should not be confused with stack-based buffer overflows
which result from vulnerabilities in programs (e.g., improper boundary check).
software deployment through the identification of worst-case
stack usage (WCSU), an undecidable problem.
Usually during design time, the engineer will allocate a
specific maximum stack size, based on his or her approximation for the system WCSU. A stack that is set too small is likely
to be overrun, yet one that is set too high, will waste valuable
resources. This trade-off is important, but WCSUs in embedded systems are difficult to identify, isolate, and correct once
violated. The stack size at a certain program point depends
both on the executed program paths as well as interrupt service
routines (ISRs), i.e. executing the maximum possible stack
requires executing specific program paths in combination with
particular interrupt interleavings. Static analysis and testing
are the two commonly used approaches to approximate the
WCSU. Static analysis estimates the WCSU by finding the
paths pushing the maximum amount of data into the stack
(e.g., adding up instructions such as pushes and pops along
each path). These paths may involve both functions in the
main program as well as multiple ISRs. Static analysis can
be fast and effective at estimating WCSU for small devices
with simple program structures [16], [18], [28].
As the complexity of programs increase, static analysis
tends to overestimate the WCSU by conservatively abstracting
program constructs and values from source code or binaries [19] and this affects its precision and applicability, and
can waste on-chip RAM resources. Existing work that favors
static analysis over testing [16], [28] argues that it is safe.
However, our experiments demonstrate that the static analysis
tools can still underestimate the results since they consider
only certain aspects of the system such as enabling/disabling
of interrupts, and use explicit operations and bounding on
the number of interrupts. This type of dynamic information
can only be obtained during runtime and can obfuscate static
analysis. Although research to date has aimed to address some
of these problems [24], static analysis also still requires user
annotations in order to properly handle libraries, as well as to
identify any non-standard set of interrupt locations.
Testing, in contrast to static analysis, is more general,
in that it eliminates the need for annotations, by simply
attempting to dynamically generate test inputs and interrupt
schedules that can cause the WCSU to occur. Since it is
using runtime information, testing may produce more precise
WCSUs than a static analysis approach, however, its results
can be an underestimate because only a subset of scenarios
978-1-4799-7125-1/15/$31.00 ©2015 IEEE
are explored. This problem is exacerbated for interrupt-driven
software because the conditions required to achieve worst case
scenarios involve specific timing relationships between the
occurrence of different hardware interrupts [24], [36].
In this paper, we introduce S IM S TACK, an automatic testing framework meant to uncover WCSUs that is informed
by the path information obtained from static analysis (SA).
Specifically, S IM S TACK first utilizes existing static analysis
tools to compute program paths and interrupt interleavings that
potentially lead to WCSUs. S IM S TACK then uses a weighted
genetic algorithm (GA) for test case generation to find inputs
and interrupt arrival points that favor these paths and interleavings. In the case of infeasible paths or interleavings reported
by the SA, S IM S TACK drives the GA towards different paths
that produce a larger stack size. S IM S TACK runs on top
of a full system simulator, which allows for control over,
and observability of the interrupt mechanism. To evaluate
S IM S TACK, we compare its results with static analysis and
those of random test case generation. We also compare against
a GA alone. Our results show that S IM S TACK is more effective
for estimating WCSU than other testing approaches, increasing
the WCSU over random by as much as 161%. It compares
favorably with static analysis, and is also efficient, identifying
WCSUs in significantly less testing time compared to a GA
without the static analysis. The contributions of this work are:
1) A testing approach, S IM S TACK, for finding WCSUs
in interrupt driven software that is informed by, and
can assess, the the results of static analysis; and
2) An empirical study demonstrating the effectiveness
of S IM S TACK.
In the next section we provide some motivation and background on interrupt driven programs, WCSUs and genetic
algorithms. In Section III we present SimStack, followed by
a case study in Section IV. We then discuss some of our
interesting results (Section V) and follow this with related
work (Section VI), conclusions and future work (Section VII).
II.
M OTIVATION AND BACKGROUND
We begin by providing definitions and notations used in
this paper, and then present our motivating example, followed
by background on weighted multi-objective genetic algorithms.
ISR1
Stack
Several dynamic test case generation techniques have been
proposed. Regehr [27] uses a random approach and discusses a
preliminary genetic algorithm to direct the search for interrupt
schedules that cause the system to reach maximum stack size.
This algorithm only considers stack size (as we will see, this
is less effective than our combined approach) and does not
consider nested interrupts. Eslamimehr et al. [19] use concolic
testing to direct test input generation, while interrupts are
issued based on time intervals. In prior work, we utilized a
genetic algorithm for a similar embedded testing problem,
that of finding worst-case interrupt latencies [36]. There we
learned that a random approach may not be effective as a
genetic algorithm; random can greatly underestimate the real
worst-case time. It is also not as efficient as the genetic
algorithm, because it may require hundreds to thousands of
runs to uncover some extreme values, especially for programs
with complex structures and contain nested interrupts. Despite
suggestions of combining a static and dynamic approach [19],
[28], we do not know of work that has taken this path.
f1
ISR4
Heap
Data, BSS
Fig. 1: RAM layout for an Embedded System
A. Problem Definition
We denote an interrupt-driven program as
P = MainISR1 ISR2 . . . ISRN ,
where Main is the main program and ISR1 , ISR2 , . . .,
ISRN are interrupt service routines, and where subscripts
indicate interrupt numbers, with larger numbers denoting lower
priorities. Typically, P receives two types of incoming data:
command inputs as entered by users and sensor inputs such as
data received through specific devices (e.g., a UART port). An
interrupt schedule specifies a sequence of interrupts occurring
at specified program locations. In testing, the input data and
an interrupt schedule for P together form a test case for P . In
this work do not consider reentrant interrupts (interrupts that
can preempt themselves); these are uncommon and used only
in special situations [28]. We also assume that there is a finite
lower bound on the inter-arrival times of interrupts. This is a
reasonable assumption for embedded systems in practice [25].
Figure 1 illustrates a typical RAM layout for an interruptdriven embedded system (the gray area reflects the stack).
Whenever a function or an ISR is called it will result in a
new stack frame. It shows a current program execution path
{f1 ->ISR1 ->...->ISR4 ->...}, where one function from
the main program and two ISRs are on the stack, with A->B
denoting the fact that B is called after the entry, but before
the exit of A. A stack overflow occurs when are too many
active functions in combination with running interrupts. The
stack can grow downward into the heap or into the DATA/BSS
sections which overwrites values and thus corrupts them.
B. Static Analysis of Maximum Stack Size
Static analysis for embedded systems is typically performed by constructing a control flow graph (CFG) and then
examining all possible execution flows accounting for instructions that allocate stack space. Specifically, the instructions of
interest include branches, calls, returns, loads, pushes, pops,
and loads from and stores to the stack pointer. It is common
for an embedded system to run ISRs with interrupts either
enabled or disabled [28], so multiple ISRs can accumulate.
Thus, the WCSU for an application is the maximum stack
depth of Main plus the sum of the maximum stack depths of
all ISRs. This can be computed using the formula:
n
WCSU = Depthmax (M ain) +
Depthmax (ISRi ),
i=1
where i is the interrupt number. This formula is conservative
because it counts for preemptions that may never happen. To
1. main{
2. ...
3. if( input < 10){
4.
setMotor1();
5. }
6. else{
/*disable ISR2*/
7.
SREG = val;
8.
setMotor2();
9. }
10. }
11. ISR2(){
12. ...
13. }
14. ISR1(
non_interruptible){
15. ...
16. i2cSend(ADDR, Length,
Data)
17. }
18. i2cSend(...){
19.
for(i = 0; i < 10;
i++)
20.
i2cSendData[i] = *
data++;
21. ...
22. check(data)
23. ...
24. }
Fig. 2: Example of WCSU Over-estimation
overcome this limitation, most existing analyses determine for
each program point which interrupts are enabled or disabled.
Imprecision can occur because of several reasons. First,
without running the program being assessed, it is difficult
to statically track the changes to the interrupt status, which
is commonly done by modifying the status register (e.g.,
SREG) using variables instead of constants. Most tools include
a pre-defined set of operations (e.g., cli and sei) where
interrupts are commonly disabled/enabled. Interrupts that fall
outside of this set must be annotated by the user. Second,
interrupts are highly platform dependent so static analysis is
not applicable in the case that the interrupt status is dynamically changed by other software components or by underlying
systems at arbitrary system execution points. Third, with the
complexity of these programs and the variety of interrupt
sources, it is difficult for static analysis to reason about the
possible interrupt interleavings for interrupt-driven embedded
systems that typically use the priority preemptive scheduling
policy [25]. This can become even harder or infeasible for
static analysis if the priority is adjusted at runtime. Fourth, the
value analysis used to determine stack usage of interrupt-driven
code suffers when indirect function calls, memory accesses,
stack pointer modifications, and data dependencies between
the main program and ISRs occur. Finally, modern embedded
systems (e.g., automative systems) tend to be integrated with
libraries and encrypted object code from different vendors.
Figure 2 shows a simplified snippet of code from our
experiments, on which we ran three static analysis tools [5],
[9], [32]. All three report the WCSU path
Pw =<main->setMotor2->
->ISR2->ISR1->i2cSend->check>
This path overestimates the WCSU because line 7 disables
interrupt 2, so ISR2 cannot be called inside setMotor2.
While static analysis may track interrupt bits written with
constant values, it is obfuscated when the interrupt register is
written with a variable. This problem may be addressed by
by more precise data-flow analysis, but it is unclear whether
such analysis is applicable to interrupt-driven programs. In
addition, the interrupt disabling/enabling operations may not
be visible when calling encrypted third-party libraries. Such
information can be observed only at runtime.
C. Weighted Multi-Objective Genetic Algorithms
S IM S TACK formulates the test case generation problem as a
multi-objective optimization problem using a weighted fitness
approach. In a genetic algorithm, a population of individuals
are evolved iteratively over a series of generations using a
set of genetic operators (crossover, mutation, selection). The
fitness function determines which individuals are closest to the
stated objective and this is used during selection and crossover
to evolve the next generation. In a weighted GA, each objective
in the fitness function is given a coefficient which is the
weight for its fitness value [26]. The weights can be tuned to
drive the application more towards one objective or another.
Since a weighted GA can only find a single best solution, it
is commonly applied to multi-objective problems where it is
possible to prioritize or order the objectives in a meaningful
way [26] As noted in Section I, the goal of S IM S TACK is
to assess the WCSU produced by static analysis, while also
constructing new test cases that compute different WCSUs
if the paths reported by static analysis cannot be exercised.
As such, we can use two objectives and prioritize them. The
first (higher priority) objective is increasing the stack size.
The second objective is path coverage. Note that weights can
impact both effectiveness and efficiency of WCSU estimation
(described in Section V). The weights can be empirically
chosen to maximize effectiveness.
For path oriented coverage, the state of the art fitness
function comprises two measures: an approach level and a
path distance [35]. When both of the metrics are 0 the desired
test data has been found. The approach level records how many
path sections (edges in the CFG) are missed by a particular
input. Consider the example from Figure 2 and assume the
target is the edge 3-4 for the true branch. If an input takes the
false then the approach level is 1, otherwise it is zero.
III.
S IM S TACK
We now present S IM S TACK. We begin with its architecture
and then described the genetic algorithm in more detail.
A. SimStack Architecture
Figure 3 illustrates the overview of S IM S TACK. It is
implemented on AVRORA, a simulator platform that supports
programmable event monitoring and application profiling [32].
We use the simulator because it allows for control of the
interrupts; it provides system level observability and controllability. The Execution Engine and Execution Profiler are builtin modules. We use the programming interfaces AVRORA
provides to create three additional modules to support testing:
an Interrupt Controller, a Test Case Generator, and an Event
Observer. We re-use the interrupt controller and event-observer
from prior work for this framework [36]. The Static Analyzer
is optional. We can plug a variety of existing tools into this
part of the framework. S IM S TACK is configurable so that
we can, for example, disable static analysis (due to platform
restrictions) and use only the GA portion of the test case
generation instead. We can also disable the GA and use random
test case generation.
The input to S IM S TACK is an initial (possibly empty) test
suite and a set of (optional) paths generated by the static
analyzer module (if applicable). For each static path, the GA
targets that path to evolve the test suite. When there are no
static paths, the GA evolves using only information from the
test suite in its fitness function. As test cases are generated,
they are executed to determine fitness (described later in this
Virtual Platform: Avrora
Test
Suite
Fitness
(WCSU)
Test Case
Generator
(Genetic Algorithm)
Updated
Inputs
Interrupt
Controller
Event
Observer
Execution
Engine
Execution
Profiler
Paths
Static
Analyzer
Application
Binary
Fig. 3: SimStack Architecture
section). To do this, the GA interacts with the execution controller. For example, when an interrupt arrival point specified in
a test is detected by the event observer module, the execution
engine pauses the current program execution and requests the
interrupt controller to invoke a specific number of interrupts.
The execution controller also issues opportunistic interrupts to
force an ISR to be reentered. Upon completing a test execution,
the test case generator is updated with new test cases. The
profiler is then used to measure performance and stack usage
based on bytes allocated on the stack. The GA iteratively
generates a test suite until all static paths are tried. In the
case where all paths are unreachable, S IM S TACK chooses a test
suite that produces the largest stack size. Since the execution of
the full-system simulator is timing deterministic, the generated
test cases are repeatable.
B. S IM S TACK Genetic Algorithm
S IM S TACK’s genetic algorithm accepts five parameters: a
time limit titer , a path reported by static analysis PSA , a
set of existing test cases T C, a maximum stack size smax
(optional), and constraints, C, that need to be enforced. The
algorithm returns a set of new test cases N T C. If the program
specifies the WCSU, the stopping point is set to the point
when the WCSU is reached. It includes an alternative: iteration
limits. If T C is empty then the initial population is random.
Chromosome. The chromosome is a combination of input
data (main program inputs and sensor device inputs) and an
interrupt schedule (interrupt arrival points) that consists of
all interrupts in the program. A gene in the chromosome is
denoted as a triple (num, instr[wait,. . . ], data), where num
is the interrupt number, instr is the instruction location where
the first interrupt num is issued, and data is the sensor input
data associated with interrupt num. The array following instr
indicates the time interval wait (measured by instruction
cycles) between two occurrences of interrupt num during a test
execution. The total number of interrupt occurrences (i.e., the
sum of the array length for each interrupt num ) interrupt density, i.e., the percentage of instruction cycles spent on handling
interrupts in a test run. As suggested in random testing for
interrupt-driven software [27], interrupts should be neither too
sparse nor too dense. Our previous work [36] also showed that
appropriately adjusting interrupt density can enhance testing
effectiveness. Based on our empirical observations for the
subject programs (Section IV), S IM S TACK chooses interrupt
density 60%, i.e., the system spends 60% of its instruction
cycles executing interrupt handlers.
Fitness Function. The first objective, f1 , is the stack objective
and is defined as worst case stack usage. This objective is
used to drive GA towards executions that can produce larger
stack size if the path objective cannot be met. The stack size
is calculated during the execution of test cases. When an
interrupt interval time defined in the chromosome is reached,
its associated interrupt is issued.
The second objective (i.e., path objective) is defined
as covering paths reported by static analysis. The path
objective is a minimization task, where the optimal solution
has a fitness value of zero. The fitness value can be
formulated as f2 = a+d/(d + 1), where a is approach
level and d is the branch distance. Unlike the traditional
approach level that considers only sequential programs,
the approach level used in our technique also records path
sections involving interrupt interleavings. In the example
from Section II in Figure 2, suppose the executed path is Pe
= {main->setMotor2->ISR1->i2cSend->check}.
Since ISR2 is not invoked, the approach level for Pe is 1.
If an interrupt is invoked but at a different preemption point
(e.g., ISR2 is called after main but before setMotor2 )
the approach level for the test case is added by 1.
When a test case misses the target path section, the branch
distance measures the distance to the critical branch, where the
critical branch is the branch where control flow diverged from
reaching the target. Resuming the example from Figure 2, if the
input takes the false branch at line 3, the distance is |input −
10|+k, where k is a failure constant. We use k=1 in S IM S TACK.
If a statement is executed multiple times, the branch distance
d is the minimum over all executions. The normalized branch
distance is defined as d/(d + 1). A path distance is the sum of
the branch distances along a test execution [13]. We treat the
branch distance of an interrupt arrival as k (i.e., 1).
Since the stack objective is a maximization task and we
need to combine this with the path objective, we use the inverse
of the normalized number [26] of bytes, b, allocated on the
stack, therefore f1 = (1.001−b ). The combined fitness is:
f = wb · f1 + wp · f 2,
where wb and wp are the weights for the stack and path
objective, respectively.
In general, our intuition is that the larger stack size
and smaller path deviation provide the best fitness. SA
tends to overestimate the stack size, so generating a
test that exercises the path may lead to more efficiently
uncovering WCSU. In the example from Figure 2,
suppose there are two test cases tc1 and tc2; wp and
wb are 0.001 and 1 respectively. The tc1 exercises
P1 =<main->isr2-> isr1->i2cSend->check>
with input data 1. The stack size is 70, the path objective
is 2.91, and thus the fitness is 0.962 (2.91*0.01+1.001−70 ).
The
tc2
exercises
P2 ={main->setMotor2->
isr1->i2cSend->check} with input data 11. The
stack size is 80, the path objective is 1.67, and thus
the fitness is 0.94 (1.67*0.01+1.001−80 ). In this case,
S IM S TACK favors P2 by comparing its fitness value to
that of P1 . Both path objective and stack objective in P2
are closer to their optimized fitness values. However, the
two objectives may be offset by each other under certain
circumstances. For example, suppose there is a test case
tc3 with input data 1. When P3 ={main->setMotor1->
->isr2->isr1->i2cSend->check} is reached, the
stack size is 100, the path objective is 1.91, and the fitness
TABLE I: Initial Test Case Population
C.S. Main ISR1
ISR2
tc1
128 (1,0x9c[22,88],‘a’) (2,0xbd[44,12],‘d’)
tc2
... ...
...
tc3
64 (1,0xfa[57,11],‘z’) (2,0x12[20,33],‘a’)
tc4
... ...
...
tc5
56 (1,0xad[33,20],‘c’) (2,0x90[42, 96],‘a’)
tc6
... ...
...
tc7
225 (1,0xbc[80, 34],‘f’) (2,0x88[45, 32],‘n’)
tc8
... ...
...
ISR3
(3,0x2b[82],‘m’)
...
(3,0x4c[99],‘k’)
...
(3,0x2d[93],‘l’)
...
(3,0x12[33],‘x’)
...
TABLE III: Result of a CrossOver Operation
Sk.
162
128
131
144
101
120
95
114
Pt.
1.25
2.34
1.5
1.98
2.48
2.66
3.18
3.22
Fit.
0.45
0.87
0.78
0.64
1.24
0.98
1.31
1.02
TABLE II: Result of Test Case Selection
C.S. Main ISR1
ISR2
tc1
128 (1,0x9c[98,88],‘a’) (2,0xbd[44,12],‘d’)
tc4
... ...
...
tc3
64 (1,0xfa[57,11],‘z’) (2,0x12[20,52],‘a’)
tc2
... ...
...
ISR3
(3,0x2b[82],‘m’)
...
(3,0x4c[99],‘k’)
...
Sk.
162
144
131
128
Pt.
1.25
1.98
1.5
2.34
Fit.
0.45
0.64
0.78
0.87
is 0.924 (1.91*0.01+1.001−100 ). In this case, P3 is favored
over P2 in terms of their fitness values. However, The path
deviation in P3 is larger than that of P2 . This indicates that
the fitness relies on the weight assigned to each objective.
Constraints. Constraints must be adhered to in order for the
test cases generated by S IM S TACK to be valid. Although
Regehr’s approach [27] may avoid spurious interrupts in
random testing by setting interrupt mask bits, it does not
consider other constraints such as the specifications for devices
and interrupt frequencies. which may lead to violations of
system semantics and cause undefined program behaviors.
First, the sensor data accepted by a device must conform to
the range defined in the device specifications. For example,
the sensor data accepted by the UART port has to be in
the ASCII table. Second, the number of interrupts N to be
issued is generated in terms of the specified interrupt density.
Specifically,
T ·D
N= ,
n
ISRiwcet
i=1
where D is the interrupt density, n the number of ISRs, and
ISRiwcet is the worst-case execution time (WCET) for ISRi .
S IM S TACK randomly generates N interrupts with different
interrupt numbers to determine the time interval arrays in
a chromosome. Third, each time interval in the array must
at least as long as the minimum inter-arrival time for the
associated interrupt. For constraints that cannot be determined
statically, S IM S TACK checks these dynamically. For example,
S IM S TACK checks hardware states (e.g., interrupt bits) and
issues only interrupts that are allowable by the hardware.
SimStack GA Example. To illustrate S IM S TACK’s GA we
present an example. Let P = Main ISR1 ISR2 ISR3 .
Suppose the WCSU path estimated by static analysis is
{Main->f0->ISR3 ->f3->ISR2 ->ISR1 ->f1}. Table I
shows the initial population consisting of eight randomly
generated test cases. The column labeled Pt. shows the path
objective. The maximum stack size values and fitness values
are shown in the columns labeled Sk. and Fit, respectively.
We use 8-bit addressing, and each number related to the time
interval has been divided by 100 for simplification. After
running these test cases, S IM S TACK selects the four best test
cases in terms of fitness values; in the example, this includes
the first four (shown in Table II). At this point, some of the
C.S. Main ISR1
ISR2
ISR3
tc1
128 (1,0x9c[98,88],‘a’) (2,0xbd[44,12],‘d’) (3,0x2b[82,. . . ],‘m’)
tc3
64 (1,0xfa[57,11],‘z’) (2,0x12[20,98],‘a’) (3,0x4c[99,. . . ],‘k’)
ch1 128 (1,0x9c[98,88],‘a’) (2,0x12[20,98],‘a’) (3,0x4c[99,. . . ],‘k’)
ch2
64 (1,0xfa[57,11],‘z’) (2,0xbd[44,12],‘d’) (3,0x2b[82,. . . ],‘m’)
Sk.
162
131
180
156
Pt.
1.25
1.5
0.5
1.77
Fit.
0.45
0.78
0.33
0.49
Pt.
1.25
1.58
0.5
1.77
Fit.
0.45
0.66
0.36
0.49
TABLE IV: Result of a Mutation Operation
C.S. Main ISR1
ISR2
ISR3
tc1
128 (1,0x9c[98,88],,‘a’) (2,0xbd[44,12],‘d’) (3,0x2b[82,. . . ],‘m’)
tc3
64 (1,0xfa[57,11],‘k’) (2,0x12[20,98],‘a’) (3,0x4c[99,. . . ],‘k’)
ch1 128 (1,0x9c[98,88],‘a’) (2,0x12[20,98],‘a’) (3,0x56[99,. . . ],‘k’)
ch2
64 (1,0xfa[57,11],‘z’) (2,0xbd[44,12],‘d’) (3,0x2b[82,. . . ],‘m’)
Sk.
162
144
176
156
wait points of ISRs have been updated (shown in bold font)
in terms of the dynamic constraints, because interrupts cannot
be invoked at the original interrupt arrival points (i.e., 22 for
ISR1 and 33 for ISR2 ).
Taking tc1 as an example, suppose it exercises path
{Main->f0->ISR3 ->ISR2 ->ISR1 ->f1}. the first invocation of ISR1 is at the location 0x9c. Then the second
invocation occurs after 9800 cycles of the execution, followed
by the third invocation after 8800 cycles. Since tc1 misses the
target f3, the path objective is 1.25. The stack size calculated
is 162 bytes.
Next, the GA performs a crossover between two pairs of
chromosomes. We cross tc1 and tc3 using a 1-point crossover
with a randomly selected division point (the crossover choice is
flexible). Table III shows the results of the crossover operation
on two parent chromosomes and the generated offspring. The
double line between the third and fourth columns indicates the
crossover point. The non-shaded areas represent genes in the
first parent (tc1), and the shaded areas represent genes in the
second parent (tc3). The rightmost column shows the fitness
values of the chromosomes.
Last, mutation is performed by altering either data or wait
in a gene. Table IV shows the results for four chromosomes
after the mutation operator has been applied (mutated elements
in bold). Following mutation, the four test cases are executed.
The rightmost column shows the resulting fitness values.
IV.
E MPIRICAL S TUDY
To assess S IM S TACK we explore two research questions.
RQ1: How does the effectiveness of S IM S TACK compare to
those of the static analysis, a non-guided GA and a random
testing technique?
RQ2: How does the efficiency of S IM S TACK compare to that
of static analysis and a non-guided GA?
To answer the first research question, we use two weighting
schemes for the fitness function of S IM S TACK and compare it
to static analysis [27], and a regular GA without the guidance
of path information. While testing and static analysis each
have strengths and weaknesses, comparing them allows us
to evaluate how testing can help static analysis in estimating
WCSUs. The second research question explores to what extent
using static analysis can impact the efficiency of S IM S TACK
in terms of converging on a WCSU.
TABLE V: Object Program Characteristics
-
-
OS
875
-
-
1
-
HC
1,550
0.8
1
SS
2,088
-
0.8
(p)
-
1.2
1
(p)
-
0.004
(p)
-
SG
2,373
-
-
-
-
SPI
TM3C
-
I2C
TM1C
-
ADC
INT2
201
341
UT1
INT1
LD
UT0
NLoC
SD
TM1O
App.
Interrupt Source (frequency KHz)
In Decreasing Order of Priority
1
0.06
8
(p)
-
-
1.4
-
-
-
1.4
-
-
-
-
-
22
(p)
-
8
(p)
8
(p)
-
2
-
8
(p)
1.4
0.4
0.5
(p)
0.06
10
(p)
-
As objects of analysis we chose five embedded system applications. The first two SMALLDEMO (SD) and LARGEDEMO
(LD), are open source programs downloaded from GNU
Savannah [2], [3]. We configured the UART interrupt handler
in LARGEDEMO to make it preemptible; this allows us to study
diverse interrupt behaviors. SMALLDEMO controls an LED
with a PWM (Pulse Width Modulation) output. The PWM
value is changed when timer TM1 is triggered. LARGEDEMO
extends the basic idea of SMALLDEMO, but adds methods
to adjust the LED brightness. Its main function accepts an
operation mode (e.g., ADC, button, serial) and PWM values.
O SCILLOSCOPE (OS), is an application adapted from
the TinyOS distribution [4] which was extended as a lab
assignment in a graduate embedded systems course at the
University of Nebraska - Lincoln. It is a data-collection demo
that periodically samples the sensors and broadcasts a message
over the radio to a base station. We modified the default
O SCILLOSCOPE to let it fetch both temperature and humidity
values of a mote. We also let it use UART to transmit and
receive data. Its timer TM3 controls the sampling rate. Every
time the timer expires it signals a timer event and reads data
via the Read<uint16_t> interface. It then issues an SPI
interrupt that calls AMSend.send to forward the data to next
hop. The results are relayed to PC via serial port UT0.
H AND -M OTION C HESS (HC), is a student project developed in a microcontroller class at Cornell University [6]. It
simulates the physical (hand) motions involved in playing
chess without the need for a physical chess set. Its main
function performs actions based on the motion values of two
contact sensors that are used to detect the motion of players
(e.g., the position of the hand on the chess board). INT1 and
INT2 generate interrupts for the contact sensors. TM1 ensures
a constant sampling interval of ADC conversion, and TM3
ensures that the cursor’s position on the chess board is updated.
S URVEILLANCE S YSTEM (SS), is from a graduate-level
wireless sensor network project at the University of Nebraska
- Lincoln, It detects motion using MICAz and four CMOS
cameras to achieve 360°coverage. The outputs of the IR
sensors in the cameras are fed to ADC. TM1 ensures a constant
sampling interval of ADC conversion, and TM3 is used to
refresh the sensor status stored in the database. UT0 is used by
users to send commands and receive messages. SPI monitors
the radio for incoming data and sends it to the base station.
Last S NUGGLZ (SG, is from a graduate-level embedded
systems course project at the University of Nebraska - Lincoln.
It implements code for motion detection by a hovercraft,
and runs on microcontrollers with voltages 3.3V and 5V. Its
main function (on the 5V processor) accepts three inputs as
commands to control directions, and sends them to the 3.3V
processor through the I2C bus for processing. UT0 and UT1
are a pair of ZigBee radios used to receive and send data. I2C
sends commands from the 5V processor to the 3V processor.
TM0 controls periodic task scheduling.
Table V lists these programs and shows the numbers of
lines of non-commented code they contain, and the interrupt
sources utilized by the programs with priorities ranging from
highest to lowest. The interrupt complexity (the number of interrupts, critical sections, and branches within critical sections)
of these programs ranges from lowest to highest across the
the programs. The numbers in the columns corresponding to
interrupts denote interrupt frequencies (the inverse of interrupt
inter-arrival time). The notation “-” indicates that an interrupt is
not utilized by the corresponding program. The notation “(p)”
indicates that the interrupt is preemptible for the corresponding
program; interrupts not so marked are not preemptible.
Our programs utilize various interrupt sources. INT1 and
INT2 are external interrupt interfaces that can be used to attach
non-built-in devices. TM1 and TM3 are compare timers that
trigger two interrupts when each of the timers reaches two
different compare values. TM0 is an overflow timer that triggers
an interrupt when it reaches its top value. UT0 and UT1 are
UART devices used to receive and send ASCII data through
UART ports; interrupts are triggered when data is available.
ADC is an analog-to-digital converter, and triggers an interrupt
when a new value is converted. I2C is a two-wire interface
that sets communications between two devices; interrupts are
generated based on their events.SPI is simple but a faster
alternative to I2C. The timer interrupts (TM1, TM3 and TM0)
are periodic interrupts that are issued at a periodic interval.
The other interrupts are non-periodic interrupts that can occur
any time after being issued by their associated devices.
A. Setting GA Parameters
We heuristically chose 32 as an initial population size,
and 16 as the population size in succeeding generations. The
resulting new number of new test cases is 16. We used
two weighting schemes for wb and wp . wb is is left at 1.0
for both versions, but the wp is set to either 0.01 or to
0.001. In the former case, the path objective has a higher
importance than the latter one. In both versions the objective
has a higher priority than the path objective. For selection,
we configured the algorithm to select the best half of the
population from which to generate the next generation; the
selected chromosomes are retained in the new generation. The
chromosomes are ranked, and evens and odds are paired, to
generate offspring.
We configured the algorithm to perform a one-point
crossover by randomly selecting a division point in the
chromosome. Smith et al. [30] conclude that mutation rates
considering both the length of chromosomes and population
size perform significantly better than those that do not. Thus,
√ as suggested by Haupt
we utilize a mutation rate of 1.75
λ l
et al. [21], where λ is the population size and l is the the
length of chromosome. Our object programs do not specify the
maximum WCSUs. Thus, iteration limits govern the stopping
points for S IM S TACK. In this study, we used time limits
to control iteration limits. To compare the effectiveness of
S IM S TACK to other techniques, we set a maximum time limit
of 24 hours for all techniques including S IM S TACK; this lets
us examine the relative effectiveness of the techniques when
each is given the same amount of time.
B. Variables and Measures
Independent Variable. The independent variable is our technique. We have two weighings of S IM S TACK, S IM S TACK.01
and S IM S TACK.001 , In addition, we consider three additional
techniques. The first technique that we consider is static
analysis (SA). We use two existing open source static analysis
tools, TOS - RAMSIZE that analyzes tinyOS applications [5],
and a built-in stack analyzer in AVRORA that analyzes Atmel
AVR machine code [32]. The TOS - RAMSIZE applies on OC
and SS, and the tool in AVRORA applies on the rest of the
subject programs. To make the static analysis more precise, we
modified the tools so that they track the change of interrupt
status caused by the modification of the status register when
using constant values. The current implementation identifies
only explicit interrupt operations (i.e., cli and sei). As such,
these tools reported more precise results than their original
implementations did on our subject programs.
The second technique that we consider is S IM S TACKGA ,
and is used to evaluate the effects of employing static analysis
to guide the search of GA. S IM S TACKGA is implemented
based on the S IM S TACK framework (Figure 3), except that
it does not apply static analysis (e.g., wp = 0). The fitness
function involves only stack objective.
The third technique, R ANDOM, is a random testing approach based on the approach presented in [27]. R ANDOM
neither applies a GA nor static analysis; instead, it randomly
generates test cases following static constraints, and randomly
issues interrupts with the same interrupt density achieved by
S IM S TACK. For example, if the average interrupt density for
device number 5 when using S IM S TACK is 8%, R ANDOM
randomly selects interrupt locations for device number 5 with
interrupt density 8% during testing.
Dependent Variables. We measure the effectiveness and efficiency of the foregoing techniques. To measure effectiveness,
we report the WCSUs calculated by the SA and the testing
techniques for a given amount of testing time. To measure
efficiency, we report the time required for the SS and the GA
based testing techniques to converge. We do not consider the
efficiency of random testing because it did not converge on a
WCSU during the test case generation process.
C. Study Operation
We implemented S IM S TACK and on AVRORA, by tailoring
the algorithm described in Section IV-B. The GA part was
implemented on top of the Java Genetic Algorithm Library
(JGAL)2 . As noted in Section III-B, the number of interrupts
in a test case are partially determined by the worst-case
execution time (WCET) for each ISR. To calculate WCET, we
use BOUND - T, a commercial static analysis tool that analyzes
Atmel AVR machine code to compute the WCETs [22]. For
each test case, we pass the sensor inputs to the devices. By
2 http://jgal.sourceforge.net
utilizing the monitor features, we can monitor each instruction
access such that whenever an interrupt location of interest is
reached, this interrupt is issued. AVRORA provides an API
forceInterrupt(num) that lets users force a specific
interrupt to occur. For dynamic constraint checking, AVRORA
allows us to monitor hardware states and wait times (determine
whether it is possible to issue an interrupt). Calculating fitness
values including stack size, approach level and path distance
can also be done using monitoring features.
To control for variance due to randomization we ran each
of the techniques ten times. We used a Linux cluster to perform
the executions, distributing each job on a distinct node.
D. Threats to Validity
The primary threat to external validity for this study
involves the representativeness of our object programs. We
controlled for this threat by studying programs developed on
various types of microcontrollers (e.g., MicaZ and Atmel) and
languages (e.g., nesC and C). The primary threats to internal
validity involves the lack of a true oracle, and possible faults
in the implementation of the algorithms and tools that we
used to perform the evaluation. Given that the programs are
non-trivial with loops and jumps, it is difficult to validate
whether the faults are false WCSUs, therefore the ground
truth cannot be determined. We have extensively tested our
tools and verified their results against a smaller program for
which we can manually determine the correct results. We
also chose to use the well-established Avrora simulator to
implement our algorithm. Note that changes in hardware states
including preemption delays due to the cache can also affect
the execution time of interrupts. We do not consider these
factors because they can be implementation dependent. For
example, the Atmega processor that we model does not use
cache memory. However, to apply our proposed framework to
test for WCSU in systems that utilize cache memory, existing
techniques such as Evicting Cache Block-Union [12] can be
integrated with our framework to estimate delays due to cache
preemption. Where construct validity is concerned, there are
other metrics that could be considered such as the costs of
engineer time. Alternative metrics are left as future work.
E. Results and Analysis
1) RQ1: Effectiveness: Figure 4 plots the effectiveness
results (the stack size) on individual programs observed in
our study. Labels on the horizontal axis reflect techniques.
Each box reflects the effectiveness scores (WCSU – bytes
allocated on the stack) measured across all ten runs of the
given technique. Asterisks show the means and dark horizontal
lines reflect medians. The horizontal dotted lines show the
effectiveness scores of static analysis.
We first compare the effectiveness of S IM S TACK (SS.01
and SS.001 ) to that of static analysis (SA). For SD and OS,
S IM S TACK estimated the same results as those computed by
the SA. In fact, all ten runs of S IM S TACK reach the WCSU
estimated by SA. On programs LD, HC and SS, S IM S TACK
estimated smaller WCSUs than those computed by SA. In
all three programs, SA overestimated the results (see Section
V). On SG, SA underestimated the WCSU (explained in
Section V). These results indicate that S IM S TACK is effective
and achieves the same effectiveness as static analysis for
80
60
40
20
0
SS_.01
SS_.001
SS_GA
RAND
400
SS_.001
SS_GA
RAND
SS_.01
SS_.001
SS_GA
RAND
500
400
12
1.5
400
SS_.01
SS_GA
SS_.01
SS_.001
SS_GA
L.D.
SS_GA
RAND
S.G.
40
22
35
SS_.001
30
SS_.01
20
RAND
18
SS_GA
S.S.
16
SS_.001
14
SS_.01
Time (minites)
200
24
100
SS_.001
S.D.
300
200
300
H.C.
0
Fig. 4: WCSU calculated by different techniques. The horizontal
SS_.01
dotted line represents the static analysis WCSU
SS_.001
SS_GA
SS_.01
Comparing S IM S TACK (SS.01 and SS.001 ) and
S IM S TACKGA (SS GA), on programs SD, LD and OS,
S IM S TACKGA and S IM S TACK were equally effective in
their best runs. However, on LD and OS, when averaging
over the 10 runs, S IM S TACK was more effective than
S IM S TACKGA . The improvement of S IM S TACK.01 was 4.5%
and 1.8%, and that of S IM S TACK.001 was 4.5% and 1.6%.
On programs HC, SS and SG, S IM S TACK.001 was more
effective than S IM S TACKGA for each of the ten runs, with
average improvement of 6.2%, 5.6% and 6.1%, respectively.
These results indicate that the use of the SA did impact the
effectiveness of S IM S TACK in estimating WCSU. This impact
was more obvious as the complexity level increased.
On the other hand, S IM S TACK.01 was less effective than
S IM S TACK.001 on programs HC, SS and SG, with average
improvement over S IM S TACKGA 0.9%, 2.8% and 3.5%. In
fact, on HC and SG, the best run of S IM S TACKGA outperformed that of S IM S TACK.01 by 2.6% and 3.5%, respectively.
These results indicate that the weights did impact the effective-
62
90
60
80
58
70
56
60
Time (minites)
We next compare the effectiveness of S IM S TACK (SS.01
and SS.001 ) to that of R ANDOM (RAND). As shown in
Figure 4, on all six programs, S IM S TACK was more effective
in all runs than the best runs of R ANDOM. Taking SS.001 as
an example, the average improvement for individual programs
ranged from 9% to 161.8%. The lowest level of improvement
(9%) occurred on LD, while the highest levels of (161.8% and
149.7%) occurred on HC and SG, respectively.
SS_GA
H.C.
54
programs of lesser complexity, but as the complexity increases
S IM S TACK and static analysis diverge.
SS_.001
100 110
O.S.
52
Stack Size (bytes)
O.S.
Time (minites)
0
SS_.01
10
100
3.5
200
300
180
140
100
Stack Size (bytes)
220
L.D.
8
RAND
6
SS_GA
S.D.
3.0
SS_.001
2.5
SS_.01
2.0
20
15
10
Stack Size (bytes)
ness of S IM S TACK. When the path estimated by S IM S TACK
deviates from the one estimated by SA, larger weights to
the path objective can negatively impact the effectiveness of
S IM S TACK. On examination of the results in SS,we found that
only 58% of path sections in the path estimated by S IM S TACK
are identical to those estimated by SA, but in program LD,
although the path sections estimated by S IM S TACK are not
identical to those estimated by SA, the deviations occurred on
only interrupt interleavings, and not on sequential code. The
correlation between the path objective and stack objective is
always positive during the test case generation process. In such
cases, assigning a larger weight to the path objective can still
be effective.
SS_.01
SS_.001
S.S.
SS_GA
SS_.01
SS_.001
SS_GA
S.G.
Fig. 5: Time required to converge on WCSUs
2) RQ2: Efficiency: To address RQ2, we rely on Figure 5,
which plots the time (measured by minutes) required for
S IM S TACK and S IM S TACKGA to converge on WCSU across
the ten sets of runs. We first measured the amount of time
required to estimate WCSU on our object programs using
static analysis; in no case did the analysis require more than
one minute, and thus, the analysis was more efficient than the
analysis conducted by other testing techniques.
We next compare the efficiency of S IM S TACK(SS.01 and
SS.001 ) to that of S IM S TACKGA . As Figure 5 shows, in all six
programs, S IM S TACK required less time than S IM S TACKGA to
converge. Taking S IM S TACK.001 as an example, the average
savings ranged from 2.4% to 32.3% across ten sets of runs.
This indicates that SA did impact the efficiency of S IM S TACK.
When comparing S IM S TACK.01 and S IM S TACK.001 , for
SD, LD and OS, S IM S TACK.001 required less time than
S IM S TACK.01 to converge, with average savings 24.7%,34.3%,
and 4.9% across ten sets of runs. However, on programs
HC, SS and SG, S IM S TACK.01 was more efficient than
S IM S TACK.001 across ten sets of runs, with average savings
3%,3%, and 11.2%. These results indicate that weights did
affect efficiency of S IM S TACK. For only programs whose
stack objective is positively correlated to the path objective,
assigning larger weights to the path objective can enhance the
efficiency of convergence.
V.
D ISCUSSION
We first analyze the results that diverge between testing and
static analysis. On program LD, SA overestimated the WCSU.
SA assumes that the UT0 and TM1O can both exist on the
stack at the same time because UT0 is preemptible. However,
the worst-case execution time (WCET) of UT0 can never
exceed the minimum inter-arrival time of the TM1O, meaning
that TM1O can’t preempt UT0. In fact, the system cannot be
proven to be stack safe by SA without reasoning about the
WCET [28] and the priority preemptive scheduling [25]. This
process requires manually creating abstract timing models,
reasoning about possible event interleavings, handling dynamic
priority adjustment, etc.
On program HC, SA estimated a higher WCSU than S IM S TACK. On further examination of the program, we ascertained
that the modified AVRORA identified only explicit interrupt
disabling and enabling operations (e.g., cli, sei), as well
as changing the SREG register using constant values (e.g.,
SREG = 0xff). However, the program writes a variable to
the SREG register (e.g., SREG = val) to disable interrupts
in several execution points. This operation can not be handled
by SA. As such, the SA incorrectly assumed INT1 and INT2
are preemptible all the way along the execution path, hence it
overestimated the WCSU.
On program SS, SA overestimated WCSU for two reasons.
First, when SPI is enabled, both Main and UART0 have data
dependencies with SPI. For example, when the WCSU path
is selected in M AIN with a shared variable defined in SPI, the
WCSU path in UART0 cannot be executed because it also has a
dependency with this variable. Second, there exists an indirect
jump in the Main that refers to a memory address which can
be determined only at runtime. Users have to annotate the
target memory address and provide an estimated concrete value
for the SA. SA cannot handle the indirect calls and jumps (e.g.,
virtual function tables, exceptions, device driver interfaces, and
callbacks), because the target addresses are located in registers
and thus will not be easily known until runtime.
On program SG, the static analysis actually underestimated
the WCSU, which was a surprise. The imprecision is caused
by the stack alignment subtracting from the stack pointer in the
assembly code. The modification of the stack pointer can affect
the size of the stack, however, the SA does not handle explicit
stack pointer modification, such as adding and subtracting
contents stored in registers (this case occurred in SG), and
using an address offset combining with the memory-mapped
address. In addition, it is difficult to statically distinguish the
writes to the stack pointer that create a stack, modify a stack,
or switch to a new stack [28].
Underestimation by Testing. While we ascertained that SA
overestimated the WCSUs on HC and SS, it does not guarantee that S IM S TACK did not underestimate the results. By
further examining the two programs, we did find a new path
in program SS that leads to a larger stack size. This path
was not exercised by the S IM S TACK. A specific interleaving
is required to change a branch condition in the ISR of UT0
to exercise that path. While S IM S TACK does not guarantee
to find the true WCSUs (this is a fundamental limitation to
testing-based approach), it can still help engineers assess the
WCSUs estimated by SA.
Reentrant Interrupts. The occurrence of reentrant interrupts
is another factor that may cause underestimation in both SA
and testing techniques, because interrupts are usually assumed
to be non-reentrant in order to bound the analysis. In fact,
reentrant interrupts occur in rare cases and are generally considered to be design faults [28]. On program OS, if reentrant
interrupts were permitted, S IM S TACK would have obtained a
higher WCSU. Specifically, this program uses a high-frequency
preemptible timer interrupt TM1O, so the SPI preempted
TM1O and executed its handler. Since AMSend.send doesn’t
disable the SPI interrupt, the timer device requested its next
interrupt causing TM1O to be reentered. The reason is that
the execution time of the ISR of the SPI is longer than the
minimum inter-arrival time TM1O. This indicates that testing
can also be used to disclose such design faults.
VI.
R ELATED W ORK
Static analysis to estimate WCSUs for interrupt-driven
software [16], [17], [24], [28], has resulted in multiple
open source and commercial tools [5], [31], [32], [34].
These techniques all suffer from the limitations of static
analysis, including high rates of false positives and possible
false negatives. For example, Bucur et al. [17] assume all
ISRs are atomic and thus do not handle nested interrupts.
There has also been work handling interrupts using dynamic
analysis techniques [20], [27], [36], [37]. Gracioli et al. [20]
propose a technique to trace interrupt behaviors; traces can
be used to help debug control flow problems in the software.
Our previous work tests for worst-case interrupt latencies by
conditionally controlling interrupts at certain points [36]. None
of the techniques attempts to address the WCSU problems.
Regehr [27] uses a GA to estimate WCSU for one TinyOS
program. This approach does not leverage static analysis. and
enforces only constraints on preventing reentrant interrupts; it
does not consider other constraints, such as minimum interrupt
inter-arrival times. Furthermore, it studies only one program
meaning the evidence provided is limited. VICE [19] estimates
WCSUs using concolic testing to explore paths and event
sequences in interrupt-driven programs. This approach does
not consider runtime constraints. In addition, this technique is
applied on the method level and does not handle dependencies
between the main program and ISRs.
Hybrid techniques to estimate worst-case execution time
(WCET) include [14], [29]. Schaefer et al. [29] use a feedback
mechanism, manually generating test cases to bridge the gap
between testing and SA. More testing is performed if the
outcome deviates from that of static analysis. Rapitime [8] is a
commercial WCET tool that uses testing to extract timing for
smaller program parts, and static analysis to deduce the final
program WCET estimate from the program part timings. These
techniques all focus on sequential software systems, and none
provide support for interrupts or directly address WCSUs.
There has been work on testing embedded systems using
evolutionary algorithms [10], [15], [23], [33]. Iqbal et al. [23]
model the environments of real-time embedded systems, to
generate test cases reaching a system’s error states. Briand
et al. [15] apply model-based stress testing to real-time systems using genetic algorithms. They encode chromosomes as
task arrival times, and search for schedules that can cause
the system to miss deadlines. These methods are based on
software modeling and do not consider a system’s real runtime
states. In contrast, our technique does not require source code
annotation or modeling, and our inputs and interrupt schedules
are generated under real system runtime environments.
VII.
C ONCLUSIONS AND F UTURE W ORK
We have presented a hybrid testing framework, S IM S TACK,
for use in estimating worst-case stack usage for interruptdriven embedded systems. Our framework is built top of the
AVRORA system simulator which provides both controllability and observability. S IM S TACK uses static analysis to first
identify a set of paths leading to WCSUs. It then attempts
to cover each of these using a genetic algorithm. The fitness
combines both a path objective and a stack objective, but is
weighted towards the stack size. When a path is infeasible,
the GA evolves the first objective alone. We conducted an
empirical study to evaluate the efficiency and effectiveness
of S IM S TACK. The study demonstrates that S IM S TACK can
produce more precise WCSUs than static analysis alone and
that it is more effective for estimating WCSUs than random
testing or than a genetic algorithm which is not informed by
static analysis.
As future work we intend to extend S IM S TACK to consider
more factors that may contribute to the effectiveness of estimating WCSUs, and to evaluate it on more subjects. We also
intend to investigate using the results of testing to feedback
into and improve the static analysis.
VIII.
ACKNOWLEDGMENTS
This work was supported in part by NSF grants CCF1161767 and CNS-1205472.
R EFERENCES
[1] About the Altona Railway software glitch. http://catless.ncl.ac.uk/Risks/
16.93.html#subj1, 2005.
[2] AVR C Runtime Library – Large Demo. http://www.nongnu.org/
avr-libc/user-manual/group largedemo.html#largedemo src, 2007.
[3] AVR C Runtime Library – Small Demo. http://www.nongnu.org/
avr-libc/user-manual/group demo project.html, 2007.
[4] Oscilloscope application.
http://www.tinyos.net/tinyos-2.x/apps/
Oscilloscope/, 2008.
[5] A stack depth analysis tool for TinyOS. http://tinyos.stanford.edu/
tinyos-wiki/index.php/Stack Analysis, 2009.
[6] Hand-motion chess. http://people.ece.cornell.edu/land/courses/ece4760/
FinalProjects/f2012/oaq3 cig23 rk447/oaq3 cig23 rk447/index.html,
2012.
[7] Toyota’s killer firmware: Bad design and its consequences.
http://www.edn.com/design/automotive/4423428/
Toyota-s-killer-firmware--Bad-design-and-its-consequences, 2013.
[8] Rapita Systems. http://www.rapitasystems.com/products/rapitime, 2014.
[9] Using static analysis to bound stack depth. http://www.cs.utah.edu/
∼regehr/stacktool/, 2014.
[10] N. Al Moubayed and A. Windisch. Temporal white-box testing using
evolutionary algorithms. In ICSTW, pages 150–151, 2009.
[11] D. M. Alter. Online stack overflow detection on the TMS320C28x DSP.
Technical report, Texas Instruments, 2003.
[12] S. Altmeyer, R. I. Davis, and C. Maiza. Cache related preemption delay
aware response time analysis for fixed priority preemptive systems.
pages 261–271, 2011.
[13] A. Baars, M. Harman, Y. Hassoun, K. Lakhotia, P. McMinn, P. Tonella,
and T. Vos. Symbolic search-based testing. In ASE, pages 53–62, 2011.
[14] A. Betts and A. Donaldson. Estimating the WCET of GPU-accelerated
applications using hybrid analysis. In ECRTS, pages 193–202, 2013.
[15] L. C. Briand, Y. Labiche, and M. Shousha. Stress testing real-time
systems with genetic algorithms. In GECCO, pages 1021–1028, 2005.
[16] D. Brylow, N. Damgaard, and J. Palsberg. Static checking of interruptdriven software. In ICSE, 2001.
[17] D. Bucur and M. Kwiatkowska. On software verification for sensor
nodes. JSS, 84(10):1693–1707, 2011.
[18] K. Chatterjee, D. Ma, R. Majumdar, T. Zhao, T. A. Henzinger, and
J. Palsberg. Stack size analysis for interrupt-driven programs. In SAS,
pages 109–126, 2003.
[19] M. Eslamimehr and J. Palsberg. Testing versus static analysis of
maximum stack size. In COMPSAC, 2013.
[20] G. Gracioli and S. Fischmeister. Tracing interrupts in embedded
software. In LCTES, pages 137–146, 2009.
[21] R. L. Haupt and S. E. Haupt. Practical Genetic Algorithms. John Wiley,
1998.
[22] N. Holsti, T. Lngbacka, and S. Saarinen. Using a worst-case execution
time tool for real-time verification of the Debie software. In DASIA,
2000.
[23] M. Z. Iqbal, A. Arcuri, and L. Briand. Empirical investigation of search
algorithms for environment model-based testing of real-time embedded
software. In ISSTA, pages 199–209, 2012.
[24] D. Kastner and C. Ferdinand. Proving the absence of stack overflows.
In SAFECOMP, pages 202–213. 2014.
[25] J. Kotker, D. Sadigh, and S. A. Seshia. Timing analysis of interruptdriven programs under context bounds. In FMCAD, pages 81–90, 2011.
[26] K. Lakhotia, M. Harman, and P. McMinn. A multi-objective approach
to search-based test data generation. In GECCO, pages 1098–1105,
2007.
[27] J. Regehr. Random testing of interrupt-driven software. In EMSOFT,
pages 290–298, 2005.
[28] J. Regehr, A. Reid, and K. Webb. Eliminating stack overflow by abstract
interpretation. TECS, 4(4):751–778, Nov. 2005.
[29] S. Schaefer, B. Scholz, S. M. Petters, and G. Heiser. Static analysis
support for measurement-based WCET analysis. In RTCSA, pages 47–
56, 2006.
[30] J. Smith and T. C. Fogarty. Adaptively parameterised evolutionary systems: Self-adaptive recombination and mutation in a genetic algorithm.
In PPCN, pages 441–450, 1996.
[31] StackAnalyzer: Stack Usage Analysis.
http://www.absint.com/
stackanalyzer/index.htm, 2014.
[32] B. L. Titzer, D. K. Lee, and J. Palsberg. Avrora: Scalable sensor network
simulation with precise timing. In IPSN, pages 477–482, 2005.
[33] M. Tlili, S. Wappler, and H. Sthamer. Improving evolutionary real-time
testing. In GECCO, pages 1917–1924, 2006.
[34] VerOStack – Static Worst-Case Stack Analysis. http://www.verocel.
com/products/stack-analysis, 2014.
[35] J. Wegener, A. Baresel, and H. Sthamer. Evolutionary test environment
for automatic structural testing. Information and Software Technology,
43(14):841–854, 2001.
[36] T. Yu, W. Srisa-an, M. B. Cohen, and G. Rothermel. SimLatte:
A framework to support testing for worst-case interrupt latencies in
embedded software. In ICST, pages 313–322, 2014.
[37] T. Yu, W. Srisa-an, and G. Rothermel. SimTester: A controllable and
observable testing framework for embedded systems. In VEE, pages
51–62, 2012.