1
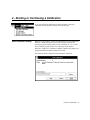
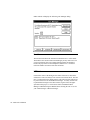
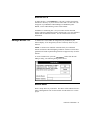
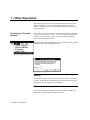
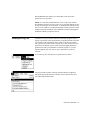
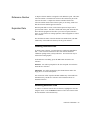
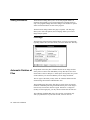
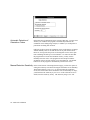
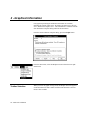
Selecting Graphs
Use the four graph buttons to select among the four graphs available,
including the Scanner Profile curve, the Density Deviation curve, the LFC
curve, and the Film Response curve.
Use these selector buttons to reopen a closed graph window or to bring a
graph window to the front.
Selecting Curves
Each graph is broken down into three curves corresponding to the red,
green, and blue components of the graph. Use the red, green, and blue
curve buttons to turn the desired curves on and off. These buttons affect
all graphs simultaneously.
Note: The LFC graph actually shows six curves: two red, two green, and
two blue. Refer to the section on the LFC graph for more information.
Showing Symbols
For each of the graphs except the LFC graph, you can view the raw data
points in addition to the smoothed curve representing these points. To
toggle the symbols, press the Symbols button on the toolbar. This button
affects all graphs simultaneously.
Note: No symbols are display for the LFC graph. The curves follow the
raw data points exactly.
Previous & Next
Use the Previous and Next buttons to view the graphs for different
iterations. It is sometimes useful to compare the results from one iteration
FullCircle Calibration - 67