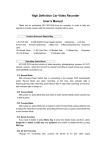
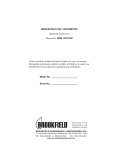
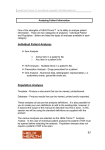
1
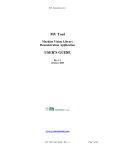
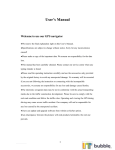
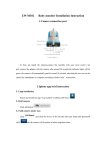
User’s Manual
4C-Rheometer
Version 2.0
Danish Technological Institute
04-07-2008
4C-Rheometer version 2.0
The information in this document is subject to change without notice and does not represent a
commitment on the part of Danish Technological Institute. The software described is furnished
under a license or nondisclosure agreement. No part of this manual may be reproduced or
transmitted in any form or by any means, electronic or mechanical, including photocopying and
recording, for any purposes other than the purchaser’s personal use, without the written permission
of Danish Technological Institute.
Warning
Do not attempt to open the 4C-Rheometer control unit (PC), the monitor, lifting unit or any other
part of the 4C-Rheometer system. Do not try to format, re-partition, or in any other way alter the
contents or structure of the hard disk of the control unit.
When the lifting unit is in motion keep your hands away.
Do not try to connect the 4C-Rheometer system in any other way than what is described in the
installation guide. Do not touch, or in other ways get in contact with, the cords and connections on
the back of the control unit, when the system is connected to the electrical supply.
Warranty for the 4C-Rheometer system will expire immediately if any of the above-mentioned rules
have been violated without written consent of Danish Technological Institute, or any other damage
on the 4C-Rheometer system caused by abuse or improper use.
© Danish Technological Institute
1
Table of Content
About the 4C-Rheometer system version 2.0............................................. 3
Installation of 4C-Rheometer ....................................................................... 4
Software......................................................................................................... 6
How to perform an analysis ....................................................................... 10
2
About the 4C-Rheometer system version 2.0
The 4C-Rheometer is an automated image analysis system performing determination of the
Bingham-rheological parameters (yield stress and plastic viscosity) of self-compacting concrete
(SCC).
The 4C-Rheometer system includes a control unit (PC), a 19’’ color LCD monitor, a video camera,
a modified Abrams slump cone, a cone lifting unit and a base plate (12mm thick, Ø1000mm
hardened glass with sand blasted surface).
The pixel resolution of the 4C-Rheometer is roughly 0.500mm.
Following the video image analysis and data treatment, analysis results and the raw video can be
saved to the hard disk.
The 4C-Rheometer operates in a MS-Windows XP environment and does not require additional
software installations.
3
Installation of 4C-Rheometer
The 4C-Rheometer should be placed on a horizontal vibration-free surface. Place the base plate
on the three rubber supports of the lifting unit. Fine adjustment to level the base plate can be made
by adjusting the height of each of the three legs. Place the Abrams cone on the lifting arm. Mount
the camera on the top-arm of the lifting unit, so that the camera is looking down on the base plate.
With the lifting unit now in position, the chords and cables between the different units and to the
power outlets should be connected.
The following connections should be made (Figure 1):
1. Connect the camera to the fire-wire port on rear of the PC using the fire-wire cable.
2. Connect the USB-cable from the lifting unit to the PC.
3. Connect the monitor to the PC.
4. Connect the keyboard, and the mouse to the PC control unit.
5. Connect all power supply chords to a power outlet.
When the above connections have been made, the PC control unit should be powered up. Use
“administrator” and “it-service” as login and password respectively.
Figure 1. Left: Camera (in the blue circle) mounted on top-arm looking down towards the base
plate. Right: Rear view of PC. Green circle = Lifting unit USB-cable. Yellow circle = Camera firewire cable.
Activate the preinstalled software by clicking the “4C-Rheometer” icon on the desktop. Click the
“PREVIEW” button and adjust the position of the camera, so that a small part of the slump cone is
visible to the left in the live preview image. Adjust the focus and shutter of the camera. The 4CRheometer is now ready for operation.
The spacial calibration between field of view and the pixels on the camera CCD has been carried
out on your 4C-Rheometer. In fact all preferred settings are found on the PC’s desktop as
4
screendumps. However, should the camera be moved up or down, a new spacial calibration has to
be performed, i.e. the field of view must be measured with a ruler and the values entered into the
system setup as “Board Width” and “Board Height” (see page 8).
The lifting speed of the cone is adjusted by turning the upper left hand side button on the device
shown in Figure 2. The speed should by 7cm/s, which is achieved by turning the button all the way
to the right – maximum speed.
Figure 2. The speed is adjusted on the button indicated by the yellow circle.
Test that the large red emergency stop button is working and that the lifting arm moves up and
down, when either of the two green buttons are pressed – see Figure 3.
Emergency button
Up
Down
Figure 3. Position of emergency button (red) and buttons for moving the lifting arm up and down
(green).
5
Software
When the 4C-Rheometer software is launched, the user interface shown in Figure 4 is displayed.
The interface consists of a “Video Analysis” area (left side) and a “Results” area (right side).
Figure 4. The 4C-Rheometer user interface.
The “Video Analysis” area
In the “Video Analysis” area, it is possible to shift between the “Preview”, “Analysis” and “Setup”
taps.
Under the “Preview” tap, the live video image is shown if the large “PREVIEW” button is clicked.
Figure 5 shows good light settings and how the cone should be visible in the left hand side of the
live video image. Click the “STOP” button to deactivate the live preview.
Under the “Analysis” tap, recorded videos can be reanalysed by activating the “REANALYSE
MOVIE” button and selecting the video to be reanalysed.
6
Figure 5. Appearance of the user interface, when “PREVIEW” is activated under the “Preview” tap.
Good light settings and position of cone.
Under the “Setup” tap, the parameters governing the video recording and analysis is selected. If
“Setup” is selected, the screen will appear as in Figure 6.
Figure 6. Appearance of the user interface, when the “Setup” tap is selected.
7
Under “Setup” it is possible to select values for the following parameters:
Board Width (mm) – measured width of the field of view (live image) in the direction that the
concrete flows (the horizontal direction on the screen).
Board Height (mm) – measured width of the field of view (live image) perpendicular to the
direction that the concrete flows (the vertical direction on the screen).
Threshold – intensity cut-off value. During the video analysis each frame is binarized, i.e. the
image is made to consist of only black and white pixels. The threshold is the cut-off intensity value
below which all pixels are set to black (intensity 0) and above which all pixels are set to white
(intensity 255). Under normal light conditions a threshold value of 120 will provide good results. If
the green bar shown during analysis of the video correctly defines the front of the concrete, then
the threshold value is set correct.
Preroll Time (s) – time from video collection start to the cone is lifted. The recommended value is
0.5s.
Analysis Time (s) – duration of video collection. The recommended value is 40s.
Stripe Width (pixels) – number of pixels over which the average position of the concrete front is
determined. Recommended value is 50pixels.
Frame Rate (1/s) – number of frames per second in the video collected. The value has to be 15s-1.
Image Width (pixels) – number of pixels in the width direction. The value should be 640pixels.
Image Height (pixels) – number of pixels in the height direction. The value should be 480pixels.
Cone Lift Time (ms) – time during which the cone is lifted at a speed of 7cm/s. The preferred
value is 2000ms.
An analysis is initiated by clicking the “START ANALYSIS” button and typing in the file name,
under which the video file (.avi) will be saved, followed by clicking “Open”. The “START
ANALYSIS” button should not be clicked, when the live preview window is active, as this will result
in erroneous video acquisition.
The “Results” area
In the “Results” area, slump flow vs. time is shown, and the determined values for yield stress,
plastic viscosity, slump flow and t500 are displayed. It is possible to type in the density of the
concrete and the manually measured slump flow, and recalculate the output parameters by clicking
the “RECALCULATE” button. Data is saved by clicking the “SAVE DATA” button. Saved data files
can be displayed by clicking the “LOAD DATA” button and selecting the appropriate file.
An example of the user interface after analysis is shown in Figure 7. The green bar indicates the
width, over which the average position (red line) of the concrete front is determined.
8
Figure 7. Example of the 4C-Rheometer user interface after analysis.
9
How to perform an analysis
•
Power up all units and launch the 4C-Rheometer software.
•
Make sure that cone and base plate are clean and dry.
•
Using the up and down buttons on the side of the lifting unit, position the lifting arm so that
there is no or virtually no free space between the lifting arm and the cone. Make sure not to
lift the cone so that paste will run between the cone and the base plate.
•
Make sure that part of the cone is visible to the left in the live video image in “Preview”
mode. Close the preview window.
•
Make sure that all parameters are correctly selected in “Setup”.
•
Fill the cone with concrete by pouring the concrete straight down the centre of the cone as
quickly as possible.
•
Make sure that there is no concrete in the camera’s field of view.
•
Click “START ANALYSIS” and type in the desired file name. By clicking “Open” the cone is
lifted and the analysis begins. During analysis make sure that no objects are interfering with
the camera’s field of view.
•
After analysis measure the actual slump flow and type it in the “measured slump flow” box
and click “RECALCULATE”. This will ensure the most accurate determination of the
rheological parameters.
•
To save the analysis results click “SAVE DATA”.
•
Clean cone and base plate with water and wipe them off with a towel.
•
Lower the lifting arm and reposition the cone.
•
The 4C-Rheometer is ready for a new analysis.
10