1
SCOPE 3.0 Help User Manual
Copyright: Total Metrics
August 2010
This text is also online:
www.totalmetrics.com
http://www.totalmetrics.com/w
ebhelp2-2/Scope.htm
Table of Contents
Table of Contents
Getting Started ........................................................................................................... 1
Start Scope ............................................................................................................. 1
Step by Step - your First Function Point Count ....................................................... 2
Tutorial Using Sample SCOPE Database............................................................... 4
Flash Tutorials ........................................................................................................ 8
http://www.totalmetrics.com/function-point-software/scope-project-sizingsoftware/flash-tutorials ............................................................................................... 8
SCOPE License Registration .................................................................................. 9
SCOPE Support ......................................................................................................... 9
Overview SCOPE Features...................................................................................... 11
What is SCOPE .................................................................................................... 11
Why Hierarchies? ................................................................................................. 12
Multi-Lingual ......................................................................................................... 13
Multi-User - SCOPE Corporate ............................................................................. 14
Types of Hierarchy Trees ..................................................................................... 16
Using SCOPE to Support FPA ............................................................................. 18
SCOPE Training ................................................................................................... 19
Mapping SCOPE terms to IFPUG and IT Terminology ......................................... 20
SCOPE Relationships - Applications Releases Projects Counts .......................... 21
Managing your Function Point Counts ..................................................................... 22
Start a new Measurement..................................................................................... 22
Performing a Function Point Count ....................................................................... 23
Setting up the Count ......................................................................................... 23
Basic Steps of an FPA Count ................................................................................... 23
©Copyright Total Metrics Pty Ltd 2010
iii
SCOPE 3.0 Help User Manual
Setting up the Model to Count ........................................................................... 55
Managing Applications Projects and Counts ........................................................ 60
Applications ....................................................................................................... 60
Releases ........................................................................................................... 61
Count Sessions ................................................................................................. 66
Projects ............................................................................................................. 72
Value Adjustment Factor ................................................................................... 75
Managing the SCOPE Database .......................................................................... 79
Export to SPR KnowledgePLAN® (CSV) .......................................................... 79
Export XML to a Metrics Repository .................................................................. 79
Import / Export Count Sessions......................................................................... 80
Import / Export Release .................................................................................... 82
Import / Export Trees and Parts of Trees .......................................................... 84
Import Counts from MS Excel®.......................................................................... 85
Import from FPW™ All Versions ....................................................................... 87
Export Single Snapshot of Count Session, Project or Release ......................... 88
Auto Save Backup and Recovery...................................................................... 91
Audit Trail of History of Changes to Counts ...................................................... 91
Multi-User - SCOPE Corporate ......................................................................... 92
SCOPE Reporting .................................................................................................... 95
SCOPE Report List ............................................................................................... 95
Types of Functional Size Reporting .................................................................... 101
1.
Release Baseline Functional Size.......................................................... 102
2.
Release Impacted Functional Size......................................................... 102
3.
Release Reworked Functional Size ....................................................... 103
©Copyright Total Metrics Pty Ltd 2010
iv
Table of Contents
4.
Count Session Impacted Functional Size .............................................. 104
Reporting the Functional Size in Function Points ............................................... 104
Flags and Filters ................................................................................................. 106
Previewing Printing and Exporting Reports ........................................................ 110
Exporting SCOPE reports into MS Office® WORD and EXCEL documents ....... 112
Convert SCOPE Reports to Text ........................................................................ 113
Embedding SCOPE Reports into a Client Report ............................................... 114
Merging a SCOPE PDF file into another PDF File .............................................. 114
Merging Annotating and Searching SCOPE Reports.......................................... 115
Sending SCOPE Reports via Email .................................................................... 115
SCOPE Viewer ................................................................................................... 116
Screens and Layout and Navigation ...................................................................... 119
Main Screen Layout ............................................................................................ 119
Keyboard Shortcuts ............................................................................................ 122
Change the Count Session in the Display .......................................................... 125
Building Trees ..................................................................................................... 125
Expanding and Collapsing Trees ........................................................................ 126
Moving and Copying Nodes................................................................................ 127
Using the Mouse to Copy and Move ................................................................... 128
Search and Find and Replace ............................................................................ 129
Sorting Tree Nodes............................................................................................. 130
Status Line .......................................................................................................... 131
Toolbars.............................................................................................................. 132
Compact Database ............................................................................................. 132
Basic SCOPE Commands .................................................................................. 133
©Copyright Total Metrics Pty Ltd 2010
v
SCOPE 3.0 Help User Manual
Exit .................................................................................................................. 133
New ................................................................................................................. 133
Open ............................................................................................................... 133
Import from FPW ............................................................................................. 133
Close / Close Current ...................................................................................... 133
Save/SaveAs................................................................................................... 134
Compact Database ......................................................................................... 134
SCOPE Online HELP ...................................................................................... 134
Starting Up SCOPE......................................................................................... 134
Setup Template Function Groups ....................................................................... 135
Reversing the Order of the Verb and Nouns in Template Function Groups .... 137
Importing and Exporting Template Function Groups ....................................... 138
Changing Language Screen Display and Reports .............................................. 138
Features in Versions of Scope ............................................................................... 141
Overview of SCOPE 1.9 Features ...................................................................... 141
Overview of SCOPE 2.0 Features ...................................................................... 144
Overview of SCOPE 2.1 Features ...................................................................... 147
Overview of SCOPE 2.2 Features ...................................................................... 149
Overview of New SCOPE 3.0 Features .............................................................. 151
1.
SCOPE 3.0 has Flexible License Options – Single User or Multi-user? 151
2.
Complete Audit trail of all Count Updates .............................................. 152
3.
Snapshot a Project and all its Count Sessions ...................................... 152
4.
Automatically Saves your data at user defined intervals ........................ 153
5.
New Hierarchy Style Function Point Count Details – all on a single Report
153
©Copyright Total Metrics Pty Ltd 2010
vi
Table of Contents
6.
Other Features and updates - SCOPE 3.0 responds to your at your
requests. ......................................................................................................... 154
Moving from FPW to SCOPE ................................................................................. 157
Background of Comparison of SCOPE and FPW ............................................... 157
Summary Gap Analysis - SCOPE 3.0 and FPW7............................................... 158
Detailed Comparison SCOPE 3.0 and FPW7 ..................................................... 161
1 SCOPE maintains the Integrity of the Count Repository .............................. 161
2 SCOPE maintains the Security and Confidentiality of the Data ................... 163
3 SCOPE reduces risk of database corruption ................................................ 163
4 SCOPE provides the evidence for Project Managers to charge for Rework 163
5 SCOPE makes it easy to upgrade from other tools ...................................... 164
6 SCOPE can be used by Novices.................................................................. 164
7 SCOPE is more cost effective when recording counts ................................. 164
8 SCOPE is more cost effective when Maintaining and Auditing Counts ........ 166
9 SCOPE facilitates more Accurate and Consistent Counting ........................ 167
10 SCOPE counts are more understandable by the Business Users.............. 168
11 SCOPE makes Count Results freely accessible ........................................ 169
Moving from FPW to SCOPE - Types of Counts ................................................ 170
Moving from FPW to SCOPE - File Complexity .................................................. 172
Moving from FPW to SCOPE - Transaction Complexity ..................................... 174
Moving from FPW to SCOPE - Adding Transactions and Data .......................... 176
Moving from FPW to SCOPE - Enhancement Counts ........................................ 178
Moving from FPW to SCOPE - Profiling Results using Labels ........................... 180
Key Advances of SCOPE over FPW .................................................................. 183
Advanced Ease of Use and Time Saving Data Entry ...................................... 183
Advanced Configuration Control ..................................................................... 183
©Copyright Total Metrics Pty Ltd 2010
vii
SCOPE 3.0 Help User Manual
Merging Count Sessions into a Release ......................................................... 185
Tracks Rework for Enhancement and Development Projects ......................... 185
Detailed Recording of Data Groups ................................................................ 185
Extended Length for Names and Descriptions ................................................ 187
Online Reporting of over 40 Different Reports ................................................ 187
Single Database File for Ease of Administration ............................................. 187
Background and Articles on Functional Size .......................................................... 189
Introduction to Function Point Analysis ............................................................... 189
Background ..................................................................................................... 189
Classification of Functional Components ........................................................ 190
Identification of Functional Components ......................................................... 190
Weighting of Functional Components ............................................................. 192
What is Function Point Analysis (FPA)?.......................................................... 192
What is Functional Size Measurement? .......................................................... 194
Function Point Counting Expert System.......................................................... 195
Levels of Function Point Counting ...................................................................... 196
Introduction ..................................................................................................... 196
Level 1: Detailed Linked and Flagged Count .................................................. 197
Level 2: Detailed Linked Count ....................................................................... 198
Level 3: Detailed Count ................................................................................... 200
Level 4: Default Complexity Count .................................................................. 201
Level 5: Rough Count ..................................................................................... 202
Level 6: Size Approximation ............................................................................ 203
What is FP Outline? ........................................................................................ 205
Metrics for Project Governance .......................................................................... 208
©Copyright Total Metrics Pty Ltd 2010
viii
Table of Contents
Background ..................................................................................................... 208
Role of Scope Manager During Project Life Cycle .......................................... 210
The Role of the Scope Manager in Project Governance ................................. 218
Uses and Benefits of Sizing ................................................................................ 220
Introduction ..................................................................................................... 220
Customising Packaged Software .................................................................... 221
FPA Uses and Benefits after Software Implementation .................................. 224
FPA Uses and Benefits in Project Construction .............................................. 229
Managing Project Development ...................................................................... 230
References and Recommended Reading ........................................................... 236
About SCOPE ........................................................................................................ 239
Installation .......................................................................................................... 239
Machine Requirements ....................................................................................... 240
Intended Audience .............................................................................................. 240
Versions Published ............................................................................................. 241
Copyright Notice ................................................................................................. 242
Flash Tutorials ........................................................................................................ 243
Glossary ................................................................................................................. 245
Index ...................................................................................................................... 249
©Copyright Total Metrics Pty Ltd 2010
ix
Getting Started
Start Scope
1. Select Windows START - Programs - SCOPE and double click on SCOPE.exe
2. Enter your Contact Name, and your Company or Organization Name, and the
SCOPE Serial Number (Note: each of these fields has been supplied with your
software or by your supplier) into the dialogue boxes provided.
3. Use the example SCOPE databases under the SCOPE Directory/Databases to
explore the functionality provided by SCOPE.
SCOPE records the project data entered by you within a single database consistent
with a Microsoft ACCESSTM format. SCOPE database files are stored as .fpa files.
If Total Metrics provides you with an updated serial number for a new version of
SCOPE software then you can update it by selecting Change Registration Details
under Help on the main menu.
©Copyright Total Metrics Pty Ltd 2010
1
SCOPE 3.0 Help User Manual
Version 1.0
Step by Step - your First Function Point Count
To download and print these instructions click here.
1. Select to <New> under <File> and enter the File Name of your new SCOPE
database, e.g. MySCOPEdatabase.fpa.
2. From the Application List displayed select [New Application] to insert the
Application name of your count (e.g. Customer Information System). Once
created, highlight the Application name, expand [+] and highlight the Work in
Progress Release branch.
3. Counts are recorded under Releases for an Application. Select to add a [New
Release] of the software application e.g. Name it “Release 1.0 of Customer
Information System”.
4. Highlight the Release and select [New Count] to set up a new function point
count session for this Release. Name the new Count Session e.g. “Initial
Count for Project Scoping”. Record background details about the count;
assign it to a Project from the Project List. When you select OK you see your
new Count Session listed (calliper icon) ready for you to highlight and [Open].
5. When you open the Count Session your cursor will be positioned on the
Function Tree. Create a functional breakdown of your software by first adding
Functional Groups (Function Folders) using [Alt+Ins] or selecting from the
Node button on the top tool menu.
6. At the lowest level Function Folder insert the Elementary
Processes/Transactions you want to add by pressing [Ins] or right clicking to
display insert menu. NOTE: The Function Groups, allow you to logically
hierarchically group your processes, just like MS Explorer uses a directory
structure to enable you to group your files.
7. After you create a functional group, use F2 or double-click to rename it from
the default name of “Function Folder” (e.g. call it Maintain Customer Details).
8. New elementary processes are created with a ‘green’, right facing arrow.
Double click the Process and the Details screen displays in the right hand
©Copyright Total Metrics Pty Ltd 2010
2
Getting Started
side screen. The direction of the arrow indicates the process has defaulted to
being an INPUT. If you change the Process Type to OUTPUT you will see
the arrow reverse. Green indicates that it is a new process to the application.
You will see the radio button in the status bar at the bottom of the screen
indicate it as an Added function. If you want to record it as ‘changed’ for an
enhancement project then you can select the ‘Changed’ radio button and the
arrow will change to orange.
9. Use the right hand details screen to assess the Type and Complexity of each
Elementary Process.
10. To count your logical data groups (Internal and External Files) select the Data
tab at the top of the LHS screen. Highlight the Data Release root node and
you can begin by entering a Data Folder. Data Folders allow you to 'Group'
your Logical Data
11. Insert the Logical Data Groups {Alt+Ins}. Highlight the Data Group, and in the
Details screen in the opposite window, determine the Data Group Type (ILF or
EIF) using [User Select] - Data Group Type, then select the complexity.
Complexity defaults to Low, to select the range of RETs and DETs select
Range then the appropriate position on the matrix or you can enter the
number of RETs and DETS.
12. If you want to list the actual RETs and DETS right click on the Data Group
and select to insert.
13. If you want to link your processes to the Data Groups they access. Select the
[Function] Tree Tab on the top LHS of the screen and the Data Tab on the top
RHS of the screen. Highlight the Process you want to link, then ‘click’ in the
box next to the Data Group name. You can also create [Notes] for your
Processes and Data Groups by selecting the [Notes] tab, creating a Note
under a Note SET and linking. Attributes can also be assigned using the
[Attribute] Tab.
14. The function point count will automatically calculate from any position in
the[Function] Tree Tab on the top LHS of the screen and the Data Tab on the
top RHS of the screen. Highlight the Process you want to link, then ‘click’ in
the box next to the Data Group name. You can also create [Notes] for your
Processes and Data Groups by selecting the [Notes] tab, creating a Note
©Copyright Total Metrics Pty Ltd 2010
3
SCOPE 3.0 Help User Manual
Version 1.0
under a Note SET and linking. Attributes can also be assigned using the
[Attribute] Tab.
15. To see the detailed report, select Report Selection under File on the main
menu. Expand [+] the branch that says Function Point Count Results and
select the report named Count Session Impacted Functional Size - Detail.
Select to Preview the report and it will display online.
16. The above instructions provide the basic guidelines for creating a basic
Project Development Count or Enhancement count. Record your Adds,
Changes and Deletes for your Change Requests using the Impact options in
the status bar in a Count Session. Baseline counts can be created from
Project counts by selecting the Update to Baseline button in the Applications
List. SCOPE has many more features that allow you to profile your count and
track functional creep across project life cycles. Please view the Online
Tutorials and HELP within SCOPE to understand all the features in SCOPE.
Also open the Example database
Tutorial Using Sample SCOPE Database
This Chapter assists you to open our Sample Database provided in your SCOPE
installation software and explore the functionality of SCOPE.
Select File – Open
Browse to the directory where the SCOPE example database is stored (SCOPE
EXAMPLE DATABASE VER 2.1 175 VER1.6.FPA) (Note: the example database is
under the directory where SCOPE was installed typically C:\Program Files\Total
Metrics\Scope). To open, either ‘double-click’ or select Open.
The List of Applications stored on this database is displayed. Select the + icon to
display the releases stored for the Application with the name “Assignment
Management System - Example Counts Here”.
The Production Releases are the Functional Size models for the Baseline
Application Releases. The Gold Open Padlock Icon indicates that this is the latest
release and that there are no current project counts to update this release.
©Copyright Total Metrics Pty Ltd 2010
4
Getting Started
The Work in Progress Releases stores the functional model for the original
Development Project Count “AMS Development Project V 1.0” and the Enhancement
project “AMS Enhancement Vers 1.1 July 2006”.
Expand the directories under the Release AMS Development Project V 1.0 by
pressing the [+] next to the name, and display the three Count Sessions for the three
Change Requests that were recorded during the project. Select “#001- CR- Daily
Rate Impact Count” and Open.
The Function Tree displays.
To explode the tree use the Icons on the Tools Bar at
the top of the screen or select from the top menu Trees – Expand Level 4 tool
button.
Move the mouse down and highlight the first Process “Create Assignment”. Either
double click the process or select
the Detail Tab along the top of the Right Hand
Screen. The functional size details of the “Create Assignment” process displays on
the right hand Details Screen.
The Details screen also displays a history of the impacts to the Process in the
Session Impact dialogue box. We see that the Create Assignment Process was
added new in the first Count Session for the Development Project and subsequently
this Count Session “#001- CR- Daily Rate Impact Count changed the process in
response to the users change request. This is also shown to us in the Function
screen where the icon is coloured orange.
The Count Session that is currently selected is displayed just above the status bar
under the bottom LH screen and should be displaying “session “#001- CR- Daily
Rate Impact Count”. With the “Create Assignment” Process highlighted select the
‘Delete’ radio button at the bottom of the screen. You will see the colour of the
arrow icon next to the Process change from Orange to Grey, to show it is deleted.
You would select this option when recording a Change Request to remove existing
functionality from an application.
©Copyright Total Metrics Pty Ltd 2010
5
SCOPE 3.0 Help User Manual
Version 1.0
To display the Data Groups accessed by the Process Create Assignment select the
Data Tab along the top of the Right Hand Screen. The red
in the check box
indicates that these Data Groups are accessed by Create Assignment. The Pen
Icon next to Assignment indicates that this is an Internal Logical File updated by the
Processes in AMS. In comparison, the Notebook Icon next to CLIENT DETAILS
indicates that this is an External Interface file and only ‘read’ by the AMS Processes.
Highlight the Data Group CLIENT DETAILS and Right click the mouse to change the
Access Type for the Data Group from Read Only to Update. Notice the change of
the Icon. The orange colour of the ASSIGNMENT Pen Icon is showing that this Data
Group was recorded to be ‘changed’ within this Count Session.
Highlight the ASSIGNMENT Data Group and double click or select the Detail Tab
along the top of the Left Hand Screen to show the Details screen for the
ASSIGNMENT Data group.
Select the Function Tab along the top of the Left Hand Screen to show the Function
tree again. Select the Notes Tab along the top of the Right Hand Screen to show the
Notes linked to the Create Assignment Process. Place your cursor on the top node
and use the Trees- Expand Level 4 tool button to expand the Notes trees. The red
in the check box indicates that this Note is accessed by Create Assignment.
Select the first linked Note Section 1.2 - Create Assignment and the Detail tab on
the LH side to display the functional requirements for this Process.
Select the Function Tab along the top of the Left Hand Screen to highlight the next
note linked to Create Assignment. This is under the List of Errors identified in
Acceptance Testing. The error identified for this Process is. “Data entry box for
Assignment name is too small - please increase to allow 100 characters”.
©Copyright Total Metrics Pty Ltd 2010
6
Getting Started
‘Flip’ the views by using the Flip Icon
(HINT: Looks like a double headed arrow
or anchor) on the top menu. The Note is now on the LH side of the screen. Select
the Attribute Tab on Right Hand Screen to show the Attribute Tree. Explode the
Category “Defect Severity Levels” to display the severity which has been attributed
to the highlighted error.
The Attributes can also be linked to any other Tree. Select the Function Tab along
the top of the Left Hand Screen then explode the Priority for Release 1 Category.
You can see the function Create Assignment has been assigned a ‘mandatory’
priority.
To see what other functions have been determined as being Mandatory to Release
1, select the Filter Icon on the top menu. Highlight the priority “mandatory” then click
the
option (OR) along the top menu. Immediately all the Processes identified as
being mandatory are highlighted with red Flags. If you want to know which ones are
mandatory and required then click on the ^ option again while required is highlighted.
More Processes are Flagged. To report the Functional Size of just the ‘Flagged’
items, select the top node of the Function tree Function AMS Development Project v
1.0 and then File – Report Selection - Function point count result – Baseline
Release Functional Size and tick the check box for ‘Select Flagged Nodes” and then
select to Preview the report. Only the ‘Flagged nodes’ for the Mandatory and
Required Processes will be included in the report.
To toggle the Flags on and off use the ‘X’ option to clear the Filter selection and
then
option to reset. To clear the Flags select the clear Flags Icon on the top
menu.
All of the four types of Trees (Function, Data, Attributes and Notes) can be displayed
on this screen. Each tree type is identified by the Tab at the top of the screen and
can link to any other Tree type displayed in the opposite side. To display a particular
combinations of trees just select the appropriate Tabs.
©Copyright Total Metrics Pty Ltd 2010
7
SCOPE 3.0 Help User Manual
Version 1.0
Continue experimenting with the different ways you can Filter the data, combining
Filters across trees and within branches. Each will give you a different profiled view
of your Processes and Data.
If you want to create a new Release to try out your new skills, then return to the
Software Applications List (See under File on the main menu). Follow the
instructions for creating a new Release, (see Create a new Release ).
Flash Tutorials
Most of the major functions and features within SCOPE are fully explained via a
Flash Tutorial on the topic. Please go to
http://www.totalmetrics.com/function-point-software/scope-project-sizingsoftware/flash-tutorials
For Tutorials on how to do the following functions:
•
•
•
Set Up a New Application
Set Up a New Release
Set Up a New Baseline Count
•
Set Up an Enhancement Count
•
Set Up Multiple Counts on the Same Release
•
Import Export Release Counts
•
Building Hierarchical Trees
•
Counting An Elementary Process
•
Counting a Logical File
•
Import Count Sessions from other Databases into a Release
•
Import a Count from EXCEL
•
Import and Export Trees or Parts of Trees
©Copyright Total Metrics Pty Ltd 2010
8
Getting Started
SCOPE License Registration
Once SCOPE is installed, you will be prompted to register your license details.
When you purchase SCOPE or are supplied with an Evaluation copy of SCOPE,
Total Metrics will provide you with your License Registration details. These include
three fields:
Organisation Name - as supplied by you on your purchase
Contact Name
- name of SCOPE user
Serial Number
- encrypted number that is validated against the Organisation
Name and Contact Name
When provided with these three fields you must enter them into the SCOPE License
Registration Window when prompted. The three fields need to be entered
EXACTLY as sent (we suggest using copy & paste from the email message from
Total Metrics for simplicity and accuracy)
e.g.
Contact Name:
Thomas Vajda
Organisation Name:
Medlit
Serial Number:
7o9& 4g9* em9& fx9*
When a new Release of SCOPE is issued you will be sent an updated Serial
Number. You may also be issued with a new Serial Number if your type of SCOPE
license changes. For example: from an Evaluation Version to a full production
version or from SCOPE Professional to SCOPE Corporate. To update the
Registration Details of an installed version of SCOPE, select Help / Change License
Details from under the main menu.
SCOPE Support
Support for SCOPE Project Sizing Software ™ (SCOPE) is available free:
o
for the first year after purchase
o
for any SCOPE users with a current maintenance agreement
However experience has shown us that our users require very little support since
SCOPE is very easy to learn and use. Please read all the hints in the HELP text and
do the SCOPE tutorials to fully understand the full flexibility of the product.
©Copyright Total Metrics Pty Ltd 2010
9
SCOPE 3.0 Help User Manual
Version 1.0
We welcome feedback from SCOPE users and many of the new features and
functions we have implemented in SCOPE are the direct result of Users having a
need and letting us know. If you think of a feature that would help you in recording,
managing, validating, reporting your counts, please let us know and we will review
the potential for other users also needing it and prioritise it accordingly.
To register any suggestions or give us feedback about SCOPE contact us using our
online Feedback form:
http://www.totalmetrics.com/function-points-forms/feedback-form
©Copyright Total Metrics Pty Ltd 2010
10
Overview SCOPE Features
What is SCOPE
SCOPE is a software Project Management and Functional Size Measurement tool that
supports the IFPUG 4.3 Function Point Analysis (FPA) methodology. It is a powerful
combination of easy to use features and comprehensive functionality. SCOPE makes it
easy to measure the Functional Size of software applications and software projects.
SCOPE enables logical groups of Functions and Processes to be visually mapped out as
nodes on a hierarchical tree, providing a detailed view of a project’s functionality and the
relative size of each functional area. This capability to expand or collapse functional
branches allows you to see as little or as much detail on one screen as you wish.
•
You can find out the size of any functional area within an application by clicking
on a branch node and checking the Function Point count in the status bar.
•
You can quickly and easily gain an overview of an application’s functionality by
expanding or collapsing the relevant part of the tree.
If you need to measure the Functional Size of an existing software application or
project, then SCOPE allows you to simply record the type and complexity of Processes
and Data Groups and calculate the functional size. Simple FPA counts like these may
be all that is required, but SCOPE is designed to do much more towards providing an
audit trail to monitor and control your project’s progress and the growth of an application
over multiple releases during its lifetime.
By using SCOPE in the initial stages of project development, you can model your
planned software’s functionality in higher level Functions, and easily evaluate the impact
of a particular decision to include or exclude functions. As a project evolves, SCOPE
supports you as you add detail and decompose the Functions down into Processes.
Additionally, SCOPE supports complex development cycles with multiple change
©Copyright Total Metrics Pty Ltd 2010
11
SCOPE 3.0 Help User Manual
Version 1.0
requests within the same release it acts as a software asset register and by keeping a
history of multiple software versions in production. SCOPE enables you to keep a
‘functional’ history of each application by providing a documented audit trail of changes
to the software throughout its life. Traceability and being able to quantify changes is
particularly important for contract negotiations of pricing variations in outsourced
development.
During a software development project, uninformed decisions can lead to inconsistent
and incorrect resource allocation that can ultimately jeopardize the project’s outcome.
For example, a project’s success in terms of remaining within budget and time
constraints can sometimes mean sacrificing functionality. These trade-off decisions are
made more difficult without some way to measure and compare functionality across
different parts of the application being developed. SCOPE allows you to easily do this
“what-if” analysis, and thus make informed management decisions on the impact of
scope changes; plus you will have a record that enables those decisions to be justified,
if required later.
Why Hierarchies?
SCOPE uses Tree Hierarchies as a means of modelling the functional requirements of
the software. Hierarchies are a powerful organisational technique to break large
problems down into manageable tasks. The human race itself is a hierarchy; we have
parents, grandparents, great-grandparents, and so on, in an extended hierarchy that
graphically describes our inter-relationships and forms our family trees.
Whenever we face the need to introduce a system of classification to describe
relationships, it is the hierarchy that we naturally choose. Phylum, class, order, etc. for
plants and animals, Dewey decimal notation for library books, domain names on the
Internet, directory classifications in Microsoft® Windows Explorer; these are all
examples of hierarchical arrangements.
©Copyright Total Metrics Pty Ltd 2010
12
Managing your Function Point Counts
Hierarchies are powerful precisely because they are natural to us. They enable us to get
around our built-in limitations and sort complex information in a structured and
comprehensible manner.
SCOPE supports this natural way of thinking by visually arranging information in a way
that makes sense. It reduces hundreds of pages of functional specifications to a
graphical model that can be used to quickly communicate and negotiate software
content and project scope with the business user.
See also Types of Hierarchy Trees in SCOPE
Multi-Lingual
SCOPE allows you to dynamically select your own language for its screen displays,
messages; menus and reports (see View/User Options).
Languages include:
•
English
•
Portuguese
•
Dutch
•
German
•
Italian
•
Spanish
•
Japanese
•
Chinese
•
Korean
•
French
•
etc.
See Changing Language Screen Display and Reports
©Copyright Total Metrics Pty Ltd 2010
13
SCOPE 3.0 Help User Manual
Version 1.0
Multi-User - SCOPE Corporate
SCOPE Corporate License Type is designed for large organisations that require
concurrent access by multiple users to a SCOPE database. It enables storage of all
your function point counts in a central repository that can be updated and /or viewed
simultaneously by any number of SCOPE Corporate and SCOPE Viewer users.
To avoid the issues of two users working on the same hierarchy at the same time and
moving and changing components, SCOPE will lock a Release once it has been
opened. I.e. As soon as a User opens a Count for a Release, that Release is locked by
the User and no other Users will have access to it until the first User selects to exit the
count or opens another Release in the same database. SCOPE displays the name of
the User currently working on a count. Other Users can open and access any other
Release in the Database that is not specifically Locked.
©Copyright Total Metrics Pty Ltd 2010
14
Managing your Function Point Counts
•SCOPE Professional – has all the features of SCOPE Corporate but operates in the
same mode as previous versions of SCOPE and is ideal for organisations that prefer to
store their SCOPE counts locally and only need single user access at any one time to
the database.
Users can upgrade current licenses from SCOPE Professional to SCOPE
Corporate to take advantage of having global accessibility to your counts.
©Copyright Total Metrics Pty Ltd 2010
15
SCOPE 3.0 Help User Manual
Version 1.0
Types of Hierarchy Trees
SCOPE has four types of Hierarchy Trees: two of which model the functionality to be
delivered by the software and must be created in order to measure functional size:
these two are:
Function Hierarchy Tree -
- models what the software does. It has two levels of
nodes.
1. Functions: record the functional areas into which the software’s functionality can
be decomposed.
2. Processes: record the lowest elementary work task that the software is required
to complete. This is the node level that is assessed for its function point
weighting.
Data Hierarchy Tree -
– models the data that the software is required to store
and access. It has four levels of nodes.
1. Data Group Folders: -
- allows the cataloguing of Data Groups into
folders for documentation purposes. This level of grouping corresponds to the
Function Groups on the Function Tree; it is just used for modelling purposes
and not considered for the function point count.
2. Data Groups: -
- record the logical groupings of data at the level of an
‘entity’ or ‘object’. This is the node level which is assessed for its function point
weighting.
3. Record Element Types (RETs) -
- record the sub-groupings of the fields
to be stored within the Data Group.
4. Data Element Types (DETs): -
- record the fields to be stored within the
data group. If there are no sub-groupings of fields (i.e. no RETs) then they may
be recorded directly under Data Groups, if they belong to a sub-grouping then
they are recorded under their related RET.
©Copyright Total Metrics Pty Ltd 2010
16
Managing your Function Point Counts
The other two Hierarchy Trees do not contribute to functional size, instead they enable
the functionality within the Function Hierarchy and Data Hierarchy to be annotated and
dynamically grouped for analysis. These other two trees are:
Notes Hierarchy Tree -
- models related textual information that needs to be
cross-referenced to the software’s functional and data nodes or attribute nodes. Notes
act in a similar way to a ‘footnote’ or ‘comment’ and provide annotation to other tree
nodes. The Notes Hierarchy has two levels of nodes.
- record the names of the groupings of textual information
1. Note Sets: -
such as ‘Specifications Documents’.
2. Notes: -
- record the textual information to be cross-referenced, e.g. under
the Note Set ‘Specification Documents’ each Note would map functions and data
groups to specific sections within the functional specification document.
Attribute Hierarchy Tree -
– enables categories to be set up that can be used to
selectively identify, characterise and group either software Functions, Data Groups or
Notes. It has two levels of nodes.
1. Categories: -
- record the names of the groups of characteristics, e.g.
“Implementation Priority Ratings”, “Specification Quality”.
2. Attributes: -
- record the different types of characteristics you may want to
assign to your software Functions, Data Groups or Notes.
E.g. if at the group level the Category was “Implementation Priority Ratings” then the
Attributes could be:
•
Mandatory – High Priority”
•
“Required – Medium Priority” and
•
“Optional – Low Priority”.
E.g. The ‘Specification Quality’ Category could have Attributes such as:
•
“Complete”
•
“Incomplete” or
©Copyright Total Metrics Pty Ltd 2010
17
SCOPE 3.0 Help User Manual
Version 1.0
•
“Not Specified”.
Each software Process could be selectively characterised for priority and Specification
Quality and then the relative size of each attribute grouping or the combined attribute
grouping determined using the Filter Mode function. E.g. “Mandatory – High Priority”
functionality can be selected and analysed separately and found to be 100 function
points of a total of 150 function points. If the Attribute “Complete” is also included in the
Filter then the selection is reduced to be only 75 function points. That is, of the
Mandatory – High Priority functions only 75 functions points of the total 100 functions
points have a “Complete” specification.
SCOPE enables more than one attribute within any Category to be Linked to any single
node on another tree. E.g. a Process may exhibit the characteristics of more than one
Attribute in the same Category and Linked to them all. For example if you had a
category called Country Installed and it had attributes called USA, Europe, Australia,
Japan. If a process was planned to be implemented in all countries then it could be
linked to all attributes. A process can be linked to attributes on one or many categories.
For example this allows you to report the Functional Size of the ‘Mandatory- High
Priority ‘functions and data that had been ‘Completely’ specified and installed in
Australia and Japan.
How are Attributes different to Notes?
All nodes in any of the four SCOPE Hierarchy Trees can be Linked to another node in
any of the other three trees, thus providing a multi-dimensional documented model of
your software.
Using SCOPE to Support FPA
Using SCOPE to support the FPA methodology makes it easy to make changes as a
project’s requirements inevitably evolve, and to analyse an application in many different
ways. SCOPE enables you to track an application's functions from its initial
development release, into production and through all subsequent releases.
©Copyright Total Metrics Pty Ltd 2010
18
Managing your Function Point Counts
Once the application is delivered, SCOPE records it as a Production Release. If an
enhancement to the functionality is requested, then SCOPE enables you to take a copy
of the Production Release as a size model base on which to record the impact of the
changes required for the next Release (e.g. Release 2.0).
SCOPE allows you to record planned work or current work on software as "Work in
Progress Releases”. These changes to the same release of software may be the
result of multiple change requests from a variety of users, each with their different
priorities. The impact of each change request can be separately recorded and
functionally sized by associating each enhancement with a Count Session. The net
cumulative impact on the release can be quantitatively assessed, as can the rework.
Functions can be prioritised and different scenarios can be sized to assist with making
decisions on which changes are included or excluded
The activity of performing a Function Point count proceeds through a series of
prescribed procedural steps. When this methodology is applied consistently, the
Function Point size result is repeatable and the software size can be universally
compared with the size of other software projects or applications.
SCOPE Training
•
1 hour free online interactive training in SCOPE features - book your session now
with Total Metrics ([email protected])
•
In-house half day training sessions in all the features and functions of SCOPE with
practical exercises to complete.
•
1 day full SCOPE training integrated into the FPA Process - so you know how to
use which features of SCOPE for each FPA counting step
•
3 day intensive IFPUG certified training course in applied IFPUG function point
analysis and using SCOPE.
For details on Locations and times for training sessions contact
[email protected] or your local SCOPE distributor.
©Copyright Total Metrics Pty Ltd 2010
19
SCOPE 3.0 Help User Manual
Version 1.0
For full details of Training content visit: http://www.totalmetrics.com/training-softwaremetrics
Mapping SCOPE terms to IFPUG and IT Terminology
The terminology differences between how SCOPE works and how clients describe their
Application and Maintenance environment sometimes results in the same word being
used to mean different concepts.
To assist the reader and avoid confusion we have provided some guidance to the
terminology below. E.g. Clients typically use the following terms: ‘Count’ to mean a
‘Project Count’ (Project Size in SCOPE). Whereas, in the real world, a business
initiative resulting in a software development Project can impact one or many
applications and each application may have one or more counts of the impact of that
Project on the application.
SCOPE implements these concepts but it terminology is slightly different. SCOPE has
been developed to be compliant with the IFPUG ISO standard 20976 and the new
IFPUG CPM version 4.3.
SCOPE Terminology:
•
SCOPE refers to a ‘Project Size’ for the equivalent concept of the typical client
term ‘Project Count’. Where the Project Size is the aggregate functional size of
all the impact counts for each the application boundary impacted by the Project.
Within SCOPE ‘Count’ is reserved for the Work Package impact by the Project
on a particular Application Boundary (SCOPE calls this a ‘Count Session’).
•
SCOPE assumes that a project may impact transactions and Files in one or more
Application Boundaries
•
SCOPE assumes that an Application Boundary may incorporate one or more
Physical Systems, each of which will need to record and report its impact
•
SCOPE allows for each Physical System to have its own Work Package for the
Project. This Work Package is measured in a Count Session
•
SCOPE therefore allows the user to record one or more ‘Count Sessions’ for
each Physical System impacted by the Project in the Boundary. Or if the User
wanted they could combine all impacts for the Project into one count session
•
Each ‘count session’ records the impact within a single Application Boundary and
is linked to a single project. However a Project, may have assigned to it many
count sessions impacting many application Boundaries. A project can also have
©Copyright Total Metrics Pty Ltd 2010
20
Managing your Function Point Counts
more than one count session for a single Application Boundary. E.g. One for
each work package or one or more for each Physical system impacted
•
SCOPE recognises that Logical Applications from a User View has an
Application Boundary. Therefore the Count Session for an Application will only
include functions (transactions and data groups) that are accessed by
transactions within that Application boundary. Physical Systems can be recorded
within the Logical Application Model as belonging to the Application Boundary
•
SCOPE recognises and incorporates the concept that Logical Applications from a
User View may incorporate one or more ‘physical systems’ and that one or more
Projects may impact these systems concurrently
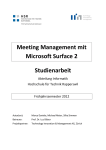
SCOPE Relationships - Applications Releases Projects
Counts
The following model maps the SCOPE concepts of Applications, Projects, Releases,
and Count Sessions to the terms commonly used in Software Development.
©Copyright Total Metrics Pty Ltd 2010
21
SCOPE 3.0 Help User Manual
Version 1.0
Managing your Function Point Counts
Start a new Measurement
To start your first Function Point count - under File select to open a new or an existing
SCOPE database file.
SCOPE will open with the Software Applications List. Before starting to actually function
point count you need to:
1. Set up a New Application
2. Set up a New Release
3. Set up a New Project
4. Set up a new Count Session
See also Basic Steps of an FPA Count and Count Using Function and Data Trees
If you have an existing counts in:
o
An MS Excel® spreadsheet then import the spreadsheet into an existing
database. (see Import Counts from MS Excel )
o
FPW database then select to import it (see Import from FPW)
You may decide to create a new SCOPE database file for each application depending on
how you want your Function Point Counters to manage their counts.
If your applications are very large and you have many of them, then we would suggest
that you create a SCOPE database file for each Application. This avoids contention of
multiple counters wanting to access the same SCOPE database file, at the same time.
In order to have Reporting of Size across your Software Portfolio you have to have a
central Repository of Counts. We would recommend that you set up a Master SCOPE
©Copyright Total Metrics Pty Ltd 2010
22
Managing your Function Point Counts
database file and have an administrator manage its configuration, such that on a regular
basis it is updated by the completed approved Releases and their Count Session.
Performing a Function Point Count
Setting up the Count
Types of Trees in the SCOPE Model
The four types of Trees in SCOPE
•
Function trees display Functions and Processes that can be performed by the
software applications. This is where you hierarchically functionally decompose an
application’s functionality.
•
Data trees display data groups, RETs and DETs. This is where you map out the
projects data
•
Structures in hierarchical form.
•
Attribute trees represent the characteristics of the Functions, Data and Notes
and are the conditions that are used for selective analysis.
•
Notes trees hold text information related to nodes in the other trees.
Function and Data trees contribute to the functional size; whilst Attribute and Notes
trees do not directly contribute, but add valuable documentation and demographic
information during profiling and analysis.
Basic Steps of an FPA Count
Set Up a New Baseline Count Tutorial
(If the video does not fit on the screen
please adjust the resolution to the highest settings)
Set Up an Enhancement Count Tutorial
(If the video does not fit on the screen
please adjust the resolution to the highest settings)
©Copyright Total Metrics Pty Ltd 2010
23
SCOPE 3.0 Help User Manual
Version 1.0
When you first open a Count Session the Function Hierarchy Tree is displayed. This is
where your software is modelled as a hierarchical structure. Your first step is to
determine the main functional areas within the software application to be measured and
enter them into SCOPE as Functions (use Alt INS Key) in the Function Tree
Hierarchy. Continue breaking down each Function until you get to the lowest
elementary Process to be performed within the software application. Enter each
Process (use Ins Key) into SCOPE.
Working from the application’s functional specification, in the Detail screen classify each
elementary Process as either an:
•
Input i.e., something that enables the user to input data into the software to be
stored.
•
Output i.e., something that enables the user to extract derived information from
the software.
•
Inquiry i.e., something that enables the user to query stored data.
Select to display the Data Tree Hierarchy by selecting the Data Tab at the top of the
screen on the RHS window. Determine the categories of logical files in your software
and create some File Folders. Under each Data Group Folder identify the logical
groups of data in your software and enter each Data Group (ILF or EIF) into SCOPE
under the appropriate Folder the Data Tree Hierarchy. Data groups may be further
decomposed into sub-groupings of Record Element Types (RETs). You can also
enter the fields (Data Element Types-DETs) under each RET sub-grouping.
Working from the application’s functional specification, in the Detail Screen classify
each Data Group as either an:
•
Internal File (ILF) i.e. something that stores data input from the user’s
transactions, i.e., Processes on the Function Tree update ILFs.
•
External File (EIF) i.e. something that stores data accessed by the user’s
transactions. i.e. Processes on the Function Tree only read EIFs.
©Copyright Total Metrics Pty Ltd 2010
24
Managing your Function Point Counts
Use the detail screen to classify Processes and data groups as either low, average or
high complexity.
SCOPE will assign a weighting in function point units to the software’s functional and
data components using a set of prescribed formula’s, based on the type and complexity
you have selected.
NOTE: SCOPE defaults Processes to be Inputs of average complexity and data groups
to be of a type undefined and low complexity. You can change these defaults by
selecting VIEW, Function Point Count Default Values, from the Main Menu.
After the assessment of each Process and Data Group is complete, the Functional
Size in Unadjusted Function Points can be reported for the whole application, or any
selected part of it or just for those functions and data impacted by a change request.
The size is reported in the status bar at the bottom of the screen or can be seen in
detail by selecting the Reporting Selection option under the Main Menu.
SCOPE:
•
Can be used to measure the size of a functional branch of the hierarchy by
selecting a node at any level,
•
Can use Flags to select sets of function and or Process nodes, for selective
measurement,
•
Can be used to selectively record and report functions impacted by a project
using an impact Count Session.
SCOPE allows you to perform the optional step of evaluating an application’s General
Systems Characteristics to calculate the Value Adjustment Factor for the application
for that Release. The Functional Size can then be combined with a Value Adjustment
Factor to take into account quality and technical characteristics, which will then give a
product size in Adjusted Function Points.
©Copyright Total Metrics Pty Ltd 2010
25
SCOPE 3.0 Help User Manual
Version 1.0
Recording and Counting Transactions
The Function Tree and the Data Tree are used to model the functionality delivered by
the software that will be function point counted. The Function Tree is where the
Transactions (Elementary Processes) are recorded. The Data Tree is where the Data
Groups or logical files (ILFs and EIFs) are counted. The Attributes Tree and Notes
Tree are used for selective profiling and documenting the functionality, (see Types of
Hierarchy Trees).
HINT: The lowest level of the function tree (process level) is the level at which function
points are assigned. If you do not wish to take the time to model your software then
create a single Function node and just list your processes below.
Recording Processes on the Function Tree
•
Press Alt+Ins to insert Function Folder nodes. These represent the major
functional areas of the software. Insert the name of the node on the RH side
Detail view or double click the node name or press F2 to rename.
•
Continue decomposing the software hierarchically by inserting functions until you
reach a stage where you identify individual elementary Processes.
•
Press Ins to insert an elementary Process.
•
Use the detail view (select the Details Tab at the top of the screen or double click
the node) to enter the Functional Size details of Process Type and Complexity.
The Process type defaults to Input and the complexity to Average.
•
Select any of the following options from Result Source to override the default
complexity:
•
Range: select the appropriate range of DETs (unique fields entering or
exiting the Process) and FTRs (unique Data Groups accessed by the
Process)
•
Assessment: select Low, Average or High
•
Enter Value: insert the actual number of DETs and FTRs
•
Default: accept the industry default value of Average
©Copyright Total Metrics Pty Ltd 2010
26
Managing your Function Point Counts
•
Derived: calculates complexity from the number of Data Groups (FTRs)
and DETs linked to the process
Quick Counting
If you want to group the details of multiple Processes into one Process node then enter
the number of Processes in the Multiplier field. E.g. where you know there are 4
Maintenance functions for a Customer of average complexity (each 4 function points),
name the Process ‘Maintain Customer’ and enter 4 into the multiplier. The function
points calculated for the Process are multiplied by 4 to total 16. SCOPE will display the
calculated function points for the Process at the bottom right of the Detail screen.
If you want to quickly generate many maintenance, and reporting processes for an
object e.g. Create Customer, Modify Customer, View Customer, then all you need to do
is insert the Object Name in the Insert Function Group Dialogue Box. SCOPE will
generate whole branches of processes with their type and complexity defaulted, to
enable you to hundreds of function points of count standard functionality in minutes.
NOTE: If you do not want a node to be counted then set the multiplier to zero and the
nodes will be excluded from the count results and display in 'blue' text on the screen.
Alternatively you can make the node type "undefined" and SCOPE will assign zero
function points.
©Copyright Total Metrics Pty Ltd 2010
27
SCOPE 3.0 Help User Manual
Version 1.0
Recording and Counting Files
The Function Tree and the Data Tree are used to model the functionality delivered by
the software that will be function point counted. The Function Tree is where the
Transactions (Elementary Processes) are recorded. The Data Tree is where the Data
Groups or logical files (ILFs and EIFs) are counted. The Attributes Tree and Notes
Tree are used for selective profiling and documenting the functionality, (see Types of
Hierarchy Trees).
HINT: The second level of the Data Tree (Data Group Level) is the level at which
Logical Files are inserted and function points are assigned to each Logical File. If you
do not wish to take the time to model your software then create a single Data Group
Folder and just list your Data Groups (Logical Files) below it.
©Copyright Total Metrics Pty Ltd 2010
28
Managing your Function Point Counts
Recording Data Groups on the Data Tree
•
Select the Data tab at the top of the screen to view the Data Tree. Highlight the
top node and Right Click the mouse and select Insert Data Group Folder to
create a Folder in which to group your list of logical files. Creating Folders
enables you to group logical files that are related for ease of finding and easy
understanding of your count. E.g. Accounts Related Files, Customer Related
Files. Press F2 to rename the folder.
•
Highlight the top node or the Data Group Folder and press Alt+Ins to insert Data
Group nodes. These represent the major data entities or classes of objects
accessed by the software. Insert the name of the Data Group on the opposite
side by selecting the Detail or double click the Data Group name or press F2 to
rename.
•
Use the detail view (select Details Tab above the status bar) to enter the
Functional Size details of Data Group Type and Complexity.
•
The Data Group type defaults to Undefined and the complexity to Low.
Override the default Data Group type using the User Select option under DG
Type Result Source. By default the Data Group is Derived from how it is
accessed by Processes Linked to it.
•
If functions or Processes that Update the Data Group are Linked to the Data
Group then the Data Group Type derived is an Internal Logical File (ILF).
•
When you select to link a process to a Data Group, the access type defaults to
READ ONLY, indicating that the process only reads the Data Group and does
not update it. The READ ONLY access type is identified by a RED TICK.
. If
you the process actually updates the data group then click on the link box a
second time and the second mouse click changes the link to a blue to
designate the data group is UPDATED. The next click resets the status to
UNLINKED status to the UNLINKED state of a blank box1 .
•
As you move down the Function Tree and highlight each process, SCOPE
dynamically displays the list of data groups linked to that process and the colour
of the link (tick colour) indicates the access type for each data group
•
Alternatively you can elect to change the access type of the link by right clicking
the mouse button when located on the data group and selecting the access type
from a drop down list (UPDATE or READ ONLY)
•
Select any of the following options from Complexity Result Source to override the
default complexity :
©Copyright Total Metrics Pty Ltd 2010
29
SCOPE 3.0 Help User Manual
Version 1.0
•
Range: select the appropriate range of DETs (unique fields stored by the
data group) and RETs (unique sub-groups of DETs)
•
Assessment: select Low, Average or High
•
Enter Value: insert the actual number of DETs and RETs
•
Default: accept the default value of Low
•
Derived: calculates complexity from the number of RETs and DETs
recorded as child nodes under the data group
SCOPE enables you to record individual RETs and DETs and their details by inserting
child nodes under each Data Group. These are only used to calculate complexity when
the Derived option is selected. For very detailed documented counts SCOPE allows you
to link processes to the DETs that they use. This is useful when a DET is impacted by a
Change Request; SCOPE will highlight all the processes that use that DET.
©Copyright Total Metrics Pty Ltd 2010
30
Managing your Function Point Counts
If you want to group the details of multiple data groups into one Data Group node then
enter the number of data groups in the Multiplier field. E.g., where you know there are 6
Tax Rates Reference Files of low complexity (each 7 function points), name the Data
Group ‘Tax Reference Files’ and enter 6 into the multiplier. The function points
calculated for the Data Group are multiplied by 6 to total 42. SCOPE will display the
calculated function points for the Data Group at the bottom right of the Detail screen.
Quick Counting - Template Function Groups
Often software that is being counted has groups of similar functionality e.g. groups of
similar types of elementary processes for a group of data. For example an Employee
System would have the following functionality such as:
•
•
Manage Department Information
•
Add New Department - Input - Average Complexity
•
Modify Department Details - Input - Average Complexity
•
Delete Department Details - Input - Low Complexity
•
View Department Details - Enquiry- Average Complexity
•
Browse Departments Details- Enquiry- Average Complexity
•
Report Department Details - Output - Average Complexity
Manage Division Information
•
Add New Division - Input - Average Complexity
•
Modify Division Details - Input - Average Complexity
•
Delete Division Details - Input - Low Complexity
•
View Division Details - Enquiry- Average Complexity
•
Browse Divisions Details- Enquiry- Average Complexity
•
Report Division Details - Output - Average Complexity
SCOPE allows you to quickly count ‘standard’ functionality by generating function
blocks of transactions that have their name, type and complexity automatically assigned
to previously defined default values. This is particularly useful in early counting.
For example: Often a logical file will have one or all of the following transactions –
Create, Modify, Delete, View, Browse/List and, or Report. To generate all of these
transactions and their file links, just locate your cursor on the logical file and select to
insert a ‘Template Function Group’ and SCOPE will automatically generate all the
©Copyright Total Metrics Pty Ltd 2010
31
SCOPE 3.0 Help User Manual
Version 1.0
transactions for you. You can create multiple Template Function Groups and set up
their default name, type and complexity and whether they update or only read a file.
Once you have set up your default templates SCOPE allows you to import and export
them for future use by yourself or your colleagues.
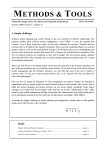
In the screen below the User has selected to Insert Template Function Group to quickly
insert the maintenance processes for a new set of functionality around a "Loyalty
Member". By selecting the Template "Standard (one)" from the list and typing in the
words "Loyalty Member" as the object name , SCOPE has automatically created the 6
elementary processes on the tree using the 'object' and assigning the correct 'type' and
'complexity' e.g. Add Loyalty Member is an External Input of Average complexity.
Function Tree - Insert Template Function Group
On the Function Tree, right click and select to Insert Template Function Group.
SCOPE will display the following dialogue box to allow you to select which type of
Template Group you want to generate.
©Copyright Total Metrics Pty Ltd 2010
32
Managing your Function Point Counts
Data Tree - Insert Template Function Group
•
Select Template is where you select from the list of existing Template Groups
on your SCOPE database.
•
Insert Object Name is where you insert the name of the 'object' of the
functionality. For example in an accounts system an 'object' could be Invoices
and we would want to generate processes that 'Create an Invoice', 'Delete an
Invoice', 'Cancel and Invoice' etc. In the following example Loyalty Member was
the Object and we created a list of processes for that object using our Template
Function Group - Standard (one).
•
Add will generate the Elementary Processes defined by the Verbs in the selected
Template. These will be generated as a new branch on your function tree. Just
keep changing the Object Name and pressing Add to generate multiple Function
Groups.
•
Setup allows you to create your own Template Function Groups in addition to the
default Templates installed with SCOPE.
•
Locate the cursor on the Function Tree either on the Root node or on a Function
Folder Node.
•
Click on the Data Tree and highlight a Data Group which is the 'object' for which
you want to generate functionality
•
Right click and select to Insert Template Function Group. SCOPE will display
the dialogue box to allow you to select which type of Template Group you want to
generate.
•
Follow instructions as per the Function Tree
©Copyright Total Metrics Pty Ltd 2010
33
SCOPE 3.0 Help User Manual
Version 1.0
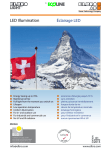
•
When the Function branch is created you will see that all the processes have
automatically linked to the selected Data Group with the Link Type (Update or
Read-Only) that was pre-assigned for the Process verb in the template.
In the example below the Function Group "Manage Points Reference File Information"
was generated when the cursor was located on Points Reference File ILF. All the
Inputs have been assigned Update links to the Points Reference
File.
©Copyright Total Metrics Pty Ltd 2010
34
Managing your Function Point Counts
Documenting your Count
Creating Attributes to selectively report your software
Filtering - Using Links as Search Criteria Tutorial
(If the video does not fit on the
screen please adjust the resolution to the highest settings)
Select the Attributes tab at the top of the screen to open the Attributes Tree. Related
Attributes can be grouped into Categories for easy access and selective reporting.
First insert an Attribute Category (Alt+Ins) and give it a collective name. For example
you may want to use Attributes to record which Processes will be included in the First
©Copyright Total Metrics Pty Ltd 2010
35
SCOPE 3.0 Help User Manual
Version 1.0
Version of the software and which have been left for a later version. Name the
Category, “Priority” and then insert an Attribute (Press Ins) representing each of the
different Priority Levels you want to allocate to the functions and data. When you have
created your Attributes, select Link mode to Link the Attribute to the Processes or Data
Groups.
You may link more than one Attribute under the same Category to the same Function,
Data Group or Note. For example you may want to use Attributes to identify which
functions are available to each security access level. Some functions may be available
to all levels and others only to some levels.
Attributes may also be linked to Notes
Other suggestions for Attribute Categories could be:
•
Development Environment: to record which language platform will be used to
deliver the function or to determine the appropriate productivity rates to apply for
different proportions of the functionality. E.g. Attributes could be C++, Access
and Java etc.
•
Project Team: to record which project teams are responsible for which functions,
to compare the size of the functionality that each is to deliver. Attributes would be
the Team Names.
•
Specification Quality: to record if the specification for that function or Data
Group is complete, partially complete or non-existent. This would enable
quantitative reporting on the completeness of the specification of the software.
•
Defect Severity Level: to record the severity rating for each of the bugs
identified in the Notes linked to the functions.
•
Business Area: software functions can then be linked to the Business area that
has requested their implementation.
•
Restructuring: identifies functionality that has been restructured to assist in
evaluating productivity gains by Change Requests that impact these functions
compared to those which have not yet been restructured.
©Copyright Total Metrics Pty Ltd 2010
36
Managing your Function Point Counts
Hint: it is easier to locate the Attribute Tree on the LH side if you want to link a single
Attribute to many Processes or Data Groups or Notes. (Right click and use the Link-set
All function)
How are Attributes different to Notes?
Reporting using Attributes
SCOPE has a number of Reporting options that selectively report the count using the
Attributes as the Selection Filter. This allows you to profile what is printed on any of the
SCOPE reports.
o
Hierarchy FP Size Attribute Summary Reports - If you manually 'Flag' up to 5
Attributes (use the Toggle Flag Icon on the Main Menu or highlight the Attribute
and press ALT+F). Then select a Hierarchy FP Size Attribute Summary Report,
it will show all the Process and Data Nodes currently assigned to these flagged
Attributes and the FPs for each Attribute will be totalled for the report.
o
Attribute FP Size Profile Reports - Reports the percentage of the Functionality
selected that has been assigned to each attribute within a Category. If you just
want to select particular Attribute Categories for reporting then with the Attribute
Tree on the Left, highlight the Category and select to print the Attribute FP Size
Report, selecting "From Current Position". SCOPE will report the relative
percentage contribution of each of the attributes to the overall Baseline and
Release and Count Session.
o
All FP and List Reports - with the Attribute Tree on the Left Hand side,
manually Flag the Attributes (ALF+F) you want to report on. When selecting any
of the reports, also select the option "Select Flagged Nodes" and the report will
only include those nodes actually linked to the Attributes you flagged.
Detailed Analysis and Tracking using Notes and Attributes
Filtering - Using Links as Search Criteria Tutorial
(If the video does not fit on the
screen please adjust the resolution to the highest settings).
©Copyright Total Metrics Pty Ltd 2010
37
SCOPE 3.0 Help User Manual
Version 1.0
If you need to further document the functionality of your software then you can create
Notes, and then link the Notes to one or many nodes on the other trees.
You can selectively report on all Process and Data nodes linked to a particular Note or
group of Notes.
(See Flags and Filters)
Functionality can be selectively reported based on its characteristics. You can set up
any number of types of characteristics or Attributes on which you would like to profile
the software. Once you have created a Note or an Attribute they can be linked to any
node on any other Tree but their own.
©Copyright Total Metrics Pty Ltd 2010
38
Managing your Function Point Counts
Select the Notes tab at the top of the screen to open the Notes Tree. Similar types of
Notes can be grouped into Note Sets for easy access and selective reporting. First
insert a Note Set (Alt+Ins) and give it a collective name. For example you may want to
use the Notes to record function point counting assumptions. Name the Note Set “FPA
Assumptions” and then insert a Note (Ins) to record each assumption. You may want to
further group these assumptions into ones that you have checked and ones that need
checking. In that case create a Set called “Checked” and “Not Checked” under the Set
called “FPA Assumptions”. Then insert your Notes under the appropriate parent Set.
When you have created your Note, select Link mode to Link the Note to the Processes
or Data Groups about which the assumption has been made. Notes may also be linked
to Attributes.
Other suggestions for Notes Sets could be:
•
Questions – to record questions you need to clarify with the application’s experts
•
Specification – to record your specifications for change requests, business rules
etc in a note which could be linked to the relevant Process
•
Errors – to record software bugs noted for each Process and data group. The
severity level could be further classified using an Attribute called Severity Level
•
List of Physical Files - to cross reference to logical files. This is particularly
useful when validating someone else's counts or when the users identify a
physical file they need changed for an enhancement, it allows easy identification
of the corresponding Logical File.
Hint: it is easier to locate the Note Tree on the LH side if you want to link a single Note
to many Processes, Data Groups or Attributes. Right click on the parent node of the
group you want link on the RH screen, select Link, Set All and all child nodes will be
automatically linked.
How are Attributes different to Notes?
©Copyright Total Metrics Pty Ltd 2010
39
SCOPE 3.0 Help User Manual
Version 1.0
How are Attributes different to Notes?
SCOPE has methods ways of further documenting your functional model of your
software:
•
Attributes
•
Notes
The difference between these two types of trees is that:
Attributes are set up as 'key words' that are used to profile your software model to
selectively report only those Processes or Data Groups that have that key word as their
Attribute. Since there may be several options of available SCOPE allows you to group
your Attributes into Categories. An example of a common Attribute Category could be
"Business Area"; this could be further broken down into specific business areas
responsible for specifying the functionality. Each of these Business Areas would be
listed as an Attribute e.g. HR, Accounts, Marketing etc. Processes specific to that
business area could then be associated by linking to that node on the Attribute Tree.
Usually every process would be linked to one or more attributes in a Category.
Typically an organisation would have a standard set of Attribute Categories defined so
that they can profile the reporting in a standardised way.
Notes in comparison are usually created to be specific to one Process or Data Group
but they may be linked to more than one node in the case of a generic Note. Notes are
designed to be used for textual descriptions about a Process or Data Group, rather than
for using as a means of profiling the model. Typically Notes are specific to a particular
Application, Release or Count Session, rather than being applicable for all Applications
within an organisation.
SCOPE has multiple hierarchy trees that provide a multi-dimensional map of the software
application’s functionality. This map enables you to develop ‘what if’ scenarios for
measuring different sets of functions, based upon selected nodes in other Trees.
For example, you might choose to map specific functions against a particular Category
of Attributes such as different developers, implementation priorities or user types.
©Copyright Total Metrics Pty Ltd 2010
40
Managing your Function Point Counts
Mappings may be made between any other SCOPE tree to the Attributes Tree. Once
these mappings (or Links) have been set-up, they can be recalled at any time and used
to selectively profile the application’s size for a particular attribute. For example linking
to a high priority attribute enables you to measure the application’s projected size based
on the ‘what-if’ scenario that only the high priority functions would be implemented.
For example, different sets of Notes can be used to record assumptions about the
specification background for counting decisions, references to project or other related
documentation, bug reports, test cases etc. Individual Notes can be written under each
of these Note Sets and, if desired, Linked to nodes in one or more other trees.
Linking Trees
(If the video does not fit on the screen
Building the Hierarchical Trees Tutorial
please adjust the resolution to the highest settings)
Counting an Elementary Process Tutorial
(If the video does not fit on the screen
please adjust the resolution to the highest settings)
Counting a Logical File Tutorial
(If the video does not fit on the screen please
adjust the resolution to the highest settings)
A Link joins two nodes on different trees. It records the relationship between the nodes
and enables you to later analysis the application based on selected nodes and their
Links, using criteria that you define. Examples of the types of analysis are:
•
Report the Functional Size of all Processes that access (are Linked to) the
Invoice Data Group.
•
Report the Functional Size of all Processes and data groups that are to be
developed in the first version of the software (i.e. are Linked to the Mandatory
attribute).
©Copyright Total Metrics Pty Ltd 2010
41
SCOPE 3.0 Help User Manual
Version 1.0
•
Report all the errors for the Invoice Processes that have been allocated a
severity 1 rating. (All Notes Linked to the invoice Processes that have been
Linked to the severity 1 attribute.)
To set. Links:
•
Display two trees by clicking the appropriate tabs (they must be different trees,
you cannot set Links within the same tree).
•
Choose Link mode from the menu (Trees–Link) or the Link Mode icon at the top
of the screen (HINT: icon looks like a bent paperclip)
•
.
On the left side select the node you wish to Link from, on the right side highlight
the node you wish to Link to and click on the checkbox next to the node (or
nodes) or press the space bar to set the Link. A red tick is displayed in the linked
node.
To display the trees on the opposite sides, use the ‘flip’ icon along the top of the screen
and display the converse view. Alternatively select Trees – Flip Views menu or press
CTRL+Tab.
Hint: If you are linking the same node to many nodes on other trees it is easier to locate
the tree with the node to be linked on the Left side tree and use the Set All option found
by Right clicking the mouse and selecting Links from the Pop-up menu.
Hint: The flip icon
is a double-headed arrow and looks like an ‘anchor’. It can also
be used to refresh the screen.
To Set and Clear Links quickly:
•
Select the node you want to link to on the LHS Tree. Highlight the Parent Node
on the RHS Tree. Right Click the mouse and select Link – Set All and SCOPE
will set links to all the children of the Parent Node. Select Link - Clear All, to
unlink all child nodes.
•
Use the Search and Replace function to find and Flag all nodes that satisfy
specific search criteria. Then use the Link –To Flagged Nodes to automatically
link the currently selected LHS node to all the flagged nodes on the RHS Tree.
©Copyright Total Metrics Pty Ltd 2010
42
Managing your Function Point Counts
To link to everything that is not currently flagged select the Link – To Unflagged Nodes option. You can selectively clear current links by selecting either
the Link – Clear Un-flagged Nodes or Clear Flagged Nodes options.
•
If an existing node already has all the links that you would like a new node to
inherit, then they can be cloned to one or many other nodes. Select Edit – Copy
Links (CNTL-L) to copy the links on the source node, highlight your target node
and select to Paste the links (Edit – Paste Links ALT-L). You can select to paste
the links to the just the target node or to all of its descendents.
Linking Processes to the Data Groups they access is a special case of crossreference linking in SCOPE
The colour of the link (tick box) can be changed to provide a dynamic display of the way
each process accesses the data group. I.e. As you link a Data Group / RET or DET to a
process, the screen dynamically displays the access type. The first mouse click to set
up the link defaults to a red
to indicate the Data is READ ONLY by the process, a
second mouse click changes the link to a blue
to designate the data group is
UPDATED and the next click resets the status to the Unlinked state of a blank box
.
As you move down the Function Tree and highlight each process, SCOPE dynamically
displays the type of access using different coloured text.
©Copyright Total Metrics Pty Ltd 2010
43
SCOPE 3.0 Help User Manual
Version 1.0
To Quickly Link Process and Data Groups, RETs and DETs right click on a Parent
node or the Root node either on the Function Tree or the Data Tree and select to Link
– Set All (Read Only) or Set All (Update). SCOPE will link to all Child nodes but will NOT
overwrite existing links. If you want to change the existing links then select to Clear All,
then select to Link as Update or Read Only.
©Copyright Total Metrics Pty Ltd 2010
44
Managing your Function Point Counts
Copy ‘Links Only’ from another Node
If you have already set up the links for a node and then realise that other nodes need
the same links, you can selectively copy just the links so that the other nodes can inherit
some or all the links.
To do this - highlight the source node (i.e. it has the links you want to copy) then select
< Copy Links> from Edit under the Main Menu (or use CNTR L). Highlight the target
node and select <Paste Links> from the Main Menu (or use ALT L).
A dialogue box displays to allow you to paste selected link types (process, attribute,
notes and data) and to restrict the paste to the just the highlighted target node or
©Copyright Total Metrics Pty Ltd 2010
45
SCOPE 3.0 Help User Manual
Version 1.0
choose to paste links to all its children (i.e. from current position down). The default
<OK> pastes all link types just to the target node.
Recording the Relationships between Functions and Data
Counting an Elementary Process Tutorial
(If the video does not fit on the screen
please adjust the resolution to the highest settings)
Counting a Logical File Tutorial
(If the video does not fit on the screen please
adjust the resolution to the highest settings)
©Copyright Total Metrics Pty Ltd 2010
46
Managing your Function Point Counts
To record how each Function or Process uses the data groups, display the Function
Tree on the LH screen and select Link Mode. (See Linking Trees.) Display the Data
Tree on the RH side and click on the box next to the Data Node name. A
displays
to record that you have set the Link. SCOPE assumes by default that the Access
Type is Read Only (Red tick). To change the Access Type of a Linked Data Node
display the Data Tree on the RH side, select the data node and click the tick will change
colour from Red for Read Only to Blue for Update, a second click will remove the link.
Alternatively you can view the access type and change it by right clicking the mouse,
when located on the Data Node and select Access Type, then select Update or Read
©Copyright Total Metrics Pty Ltd 2010
47
SCOPE 3.0 Help User Manual
Version 1.0
Only. Access Type can only be set if the data node is already Linked to a function or
Process node.
SCOPE allows linking of individual processes to DETs listed in the Data Groups Tree. If
a DET is linked then the link is automatically assumed also by the parent RET and the
Data Group. If you link at this level then SCOPE will count the linked DETs when it
derives the number of DETs and FTRs for the Process.
HINT: If you want to include additional DETs,that are not stored on a Logical File, in the
DETs counted for a linked process, then create a File Folder in the Data Groups Tree
to store these DETs and then link them. Examples of DETs that cross the boundary but
are not stored are Messages, Action Control DETs, Calculated totals etc.
The Attribute Tree
©Copyright Total Metrics Pty Ltd 2010
48
Managing your Function Point Counts
The Attribute tree represents the characteristics and conditions that you want to assign
to nodes in other trees in order to selectively group them for analysis. For example, you
may have an Attribute Category called Priority for Implementation, with the priority
levels (Mandatory, Optional, Later) as its Attributes. You could then assign the priority
for implementation to the individual Processes and Data Groups using the Link Nodes
function, and use the Filters and Flags to analyse and report the total Function Points
assigned determined to be mandatory for this Release.
The more information that is placed within an attribute tree and Linked to other tree
nodes, the more detailed and comprehensive your analysis can be.
©Copyright Total Metrics Pty Ltd 2010
49
SCOPE 3.0 Help User Manual
Version 1.0
The Notes Tree
This tree holds text information that can be Linked to nodes in any other tree. Typical
usages could be to record as Notes to be linked to processes or data:
•
Any counting assumptions
•
Queries against the specification
•
Identified bugs during acceptance testing
•
Cross-reference to the specification
•
Physical tables, screens or programs etc.
Notes are organised into Sets. You can nest Sets to any depth then the Icon changes
from
to
©Copyright Total Metrics Pty Ltd 2010
50
Managing your Function Point Counts
Viewing Linked Processes, Data, Notes and Attributes
Counting an Elementary Process Tutorial
(If the video does not fit on the screen
please adjust the resolution to the highest settings)
Filtering - Using Links as Search Criteria Tutorial
(If the video does not fit on the
screen please adjust the resolution to the highest settings
If your NOTE has .additional text in the description
SCOPE provides the function point counter with the ability to document their function
point count to the highest level of accuracy such that all processes can be linked to:
•
Data Groups - i.e. the process is linked to the DETs, RETs and FTRs that the
accesses and the type of access (Read or Update) can also be assigned.
•
Notes - any textual comments relevant to the process
•
Attributes - any key words relevant to the profile the process
Similar linking to Processes, Notes and Attributes can be done by any node on the Data
Tree.
These links for a particular process or data node can be viewed via two different
methods, in Links Mode, highlight the process:
•
Select the tab for the tree type on the opposing window for the tree that you want
to view the nodes linked to this process. The links for selected process display
as a red tick against the nodes in the opposite Tree.
Double clicking on the process to display the details screen and then select 'Display
Links to' option in the Details screen to select which tree you want to see the linked
nodes. The linked nodes then display as a list, rather than a tree, thus enabling all links
to be viewed in one screen.
©Copyright Total Metrics Pty Ltd 2010
51
SCOPE 3.0 Help User Manual
Version 1.0
Finalising your Count
Set up a New Application
Set Up a New Application Tutorial
(If the video does not fit on the screen please
adjust the resolution to the highest settings)
Create a new Software Application
If the List of Software Applications is not displayed, then select Project and Application
List from the main menu and select the Application you want to modify. Select Details
button to modify its descriptive details or position the cursor at the top of the
Applications Tree List to create a new application (New Application button). Enter the
©Copyright Total Metrics Pty Ltd 2010
52
Managing your Function Point Counts
new software application name and descriptive details. Expand the Release trees for
your new application name by clicking on the [+] beside the application name.
Then Create a New Release and Create a new Count Session in order to start your
measurement
Excluding Counts from Baseline Update
The Count Sessions for a Release can be selectively used to update the Production
Baseline Release. If a change request for some reason was not implemented or you do
not want the Count to reflect its outcome in the baseline then SCOPE will let you decided
how you want it handled.
Situations when this may occur are when the Count Session was:
•
Not approved and the project did not proceed, then the Count Session can be
deleted and the integrity of the Release is retained.
•
Not actually implemented but the project is still in progress or is planned to be
implemented at some time in the future. In this case SCOPE allows you to
selectively exclude that Count Session from the Update to Baseline i.e. puts the
Count Session on Hold and SCOPE will create a new WIP Release, based on
the new Baseline Count but also includes the 'Held Over' Count Session so that
is now part of the Latest Release Count. It will be removed from the previous
WIP Release where it was originally created.
•
Conversion functionality or any functionality delivered by the project but not in
the Production Release. SCOPE allows you to select to NOT Apply the Count
Session to the particular Baseline Update. The Count Session will remain in the
Work in Progress Release where it was created but its impacts will not be
considered in the Update to Baseline.
©Copyright Total Metrics Pty Ltd 2010
53
SCOPE 3.0 Help User Manual
Version 1.0
Updating Baseline Counts
SCOPE allows you to record all your project counts as Count Sessions on a copy of the
Production Baseline that you have created in the Work in Progress Release Group.
Once all the project counts are complete and the Release has been put into production
by the development team, you need to update you baseline count so it reflects the size
of the implemented software.
In order to Update your Baseline Count for the Application you need to locate your
cursor on the Latest Release in WIP (open green padlock), and then select the button
Update to Baseline. SCOPE will create a new Baseline Count under the Production
Release Branch under the Application. When you select to Update to Baseline, you will
be prompted to select to Hold Over or Exclude Counts from the Update.
In the new Baseline Count, SCOPE automatically
©Copyright Total Metrics Pty Ltd 2010
54
Managing your Function Point Counts
o
Removes any processes or Data Groups that have been identified as being
Deleted
o
Includes in the new Baseline size the New processes and Data Groups
o
Includes in the new Baseline size the final result of the Changed processes and
Data Groups.
During the updating process SCOPE removes all the history of the Count Sessions i.e.
which Count Sessions impacted which processes and Data Groups and just creates a
Baseline Count that represents the Net Result after all of the Count Sessions for the
selected WIP Release have been applied.
The new Baseline Count in Production now has a gold padlock and it is locked. This
indicates that it represents the very latest Production Release Count and that there are
no WIP Releases currently making changes to it.
Note: The Update to Baseline works in a similar way to MS WORD when the User
selects to "Accept all Changes", the resulting document now has the net result of all the
editing performed on the working draft.
Setting up the Model to Count
Counting Data
The Data Tree
Counting a Logical File Tutorial
(If the video does not fit on the screen please
adjust the resolution to the highest settings)
©Copyright Total Metrics Pty Ltd 2010
55
SCOPE 3.0 Help User Manual
Version 1.0
This tree represents the data storage and data retrieval functionality of your software
application.
Functional size derived from the data tree is based on the type of Data Group and the
combined effect of the number of Record Element Types (RETs) and Data Element
Types (DETs) it contains. Where a:
•
RET is a unique user recognisable sub-group of DETs within a data group.
•
DET is a unique user recognisable field.
The data tree is the only tree with Four types of nodes instead of two.
The Four node types are:
©Copyright Total Metrics Pty Ltd 2010
56
Managing your Function Point Counts
•
Data Group Folder, is the parent level 1 node, that can exist by itself (i.e.
without any nested child nodes), or can optionally contain a collection of Data
Groups, or DETs (but not a mixture of both). E.g. CRM System Reference Files =
Customer Discount Rules, Customer Billing Rules, Files from other Applications.
You can create a hierarchy of Data Group Folders to assist you in grouping your
Logical Files.
•
Data Group, is the parent level 2 node, that can exist by itself (i.e. without any
nested child nodes), or can optionally contain a collection of RETs, or a collection
of DETs (but not a mixture of both). E.g. Invoice File = Data Group.
•
RET, is a child node of a Data Group and may optionally contain a collection of
DETs. E.g. Invoice Header, Invoice Item Details are sub-groups of the Invoice
Data Group.
•
DET is the lowest level node and may be a child of a Data Group or RET. E.g.
Invoice Number, Invoice Date are fields within the Invoice File Data Group and
are child nodes of the Invoice Header RET.
As with the Function Tree, you can choose the level of detail you wish to enter.
HINT: It is good function point counting practice to map your Logical Data Groups listed
in the Data Tree to the name of their corresponding Physical File in the Notes Tree.
Create a Notes SET called “Physical Tables” and insert the name of each physical
table as a Note. Link each table to their corresponding Logical File. This assists with
impact analysis of future Change Requests and provides useful documentation for
anyone auditing your function point count.
Counting Transactions
The Function Tree
Counting an Elementary Process Tutorial
(If the video does not fit on the screen
please adjust the resolution to the highest settings)
©Copyright Total Metrics Pty Ltd 2010
57
SCOPE 3.0 Help User Manual
Version 1.0
This is where you build a representation of the software application’s functionality. The
name at the root node of the Function Tree is the name of the Release model
displayed. You can edit the Release name by selecting to Edit the Release from the
List of Software Applications.
As you understand more about your software application’s requirements, you construct
a more detailed hierarchical model of Functions and Processes within your software.
Functions can be nested within other Functions to any depth, like branches in a tree.
Processes are the leaves of the tree and represent the lowest level of Process
decomposition and cannot be nested.
©Copyright Total Metrics Pty Ltd 2010
58
Managing your Function Point Counts
Functions represent chunks of functionality. You choose to fill in as much detail as you
want by inserting nested functions, which are then divided into Processes at a finite
level. Examples of typical Functions would be: Maintain Customer Information, Manage
Invoicing.
A Process is considered by IFPUG 4.3 to be the smallest unit of work that is
meaningful to the end user and on completion leaves the application in a consistent
state.
Examples: Add a new Customer, Modify Customer Details, Delete a Customer, View
Customer Details, List Outstanding Invoices, Print Customer Invoice.
HINT: Processes are equivalent to the IFPUG Elementary Processes. For those users
not familiar with IFPUG CPM 4.3 rules, Elementary Processes roughly equate to ‘USE
CASES’ which have been decomposed to the level of a single user function.
Functional size derived from the Function tree is based on the type of Process (Input,
Output or Enquiry) and the combined effect of the number of Data Groups accessed
(File Types Referenced (FTRs)) and the number of fields (Data Element Types (DETs))
the Process needs to share with the User. Where a:
•
FTR is a Data Group listed on the Data Group Tree.
•
DET is a unique user recognisable field that may or may not be stored on a Data
Group.
•
You can choose the level of detail you to decompose your functional hierarchy. If
you do not want to go down to each individual process level then insert a number
into the Multiplier field within the Process Details screen and SCOPE will multiply
the function points for the identified process by the value of the multiplier. E.g. If
you know that there are 25 Sales Reports and they are all of Average Complexity
then put a 25 into the Multiplier field within the Process named Sales Reports.
The function points calculated will be 25 *5 = 125.
Note : If you have identified a user function that is not counted in IFPUG function
points e.g. Menu but you want to record that you have found it but not counted it,
©Copyright Total Metrics Pty Ltd 2010
59
SCOPE 3.0 Help User Manual
Version 1.0
then you can still include it in the Function Tree but assign it a Multiplier of zero so
that it does not contribute to functional size. We would recommend that you assign
a NOTE to provide your reasons for not counting it, or put the reasons in the
Description field. You may also want to create an Attribute called "Technical/Quality
Feature" and assign it to the node you do not want counted.
Managing Applications Projects and Counts
Applications
Applications - Overview
The List of Software Applications screen displays when you first open a SCOPE
database. It can also be selected from under the main menu option File - Project and
Application List. When selected it displays a dialog box listing the various software
applications for which you have function point counts stored in the SCOPE database file.
SCOPE can store the functional models of different versions of a software application
known as Releases. Releases are listed under each application in one of three
predefined groups depending on the status of the Release. See Releases - Overview
©Copyright Total Metrics Pty Ltd 2010
60
Managing your Function Point Counts
Set up a New Application
Set Up a New Application Tutorial
(If the video does not fit on the screen please
adjust the resolution to the highest settings)
Create a new Software Application
If the List of Software Applications is not displayed, then select Project and
Application List from the main menu and select the Application you want to modify.
Select Details button to modify its descriptive details or position the cursor at the top of
the Applications Tree List to create a new application (New Application button). Enter
the new software application name and descriptive details. Expand the Release trees
for your new application name by clicking on the [+] beside the application name.
Then Create a New Release and Create a new Count Session in order to start your
measurement
Releases
Release Status
Software Applications List Tutorial
(If the video does not fit on the screen please
adjust the resolution to the highest settings)
Release Status
A padlock icon beside each Release denotes the status of the Release. The colour
and state of the padlock identifies each type of Release and which Release is the Latest
Release of the software. The Latest Release is the one to select when changes to its
functionality need to be recorded. The Icon can be either Green or Gold and will be in
one of two possible states, Locked or Unlocked:
•
Gold Padlock Icon -
- Is only assigned to the "Latest" Production
Releases
•
Green Padlock Icon -
- Is only assigned to all other Releases
Release Status
A padlock icon beside each Release denotes the status of the Release. The colour
and state of the padlock identifies each type of Release and which Release is the Latest
Release of the software. The Latest Release is the one to select when changes to its
©Copyright Total Metrics Pty Ltd 2010
61
SCOPE 3.0 Help User Manual
Version 1.0
functionality need to be recorded. The Icon can be either Green or Gold and will be in
one of two possible states, Locked or Unlocked:
•
Gold Padlock Icon -
- Is only assigned to the "Latest" Production
Releases
•
Green Padlock Icon -
- Is only assigned to all other Releases
Unlocked
If the padlock is green then this indicates that the functional model for this Release has
the “Update Rights” to be used to update the baseline Production Release, i.e., this is
the functional model on which any changes to the functionality should be recorded.
Only an Unlocked Work in Progress Release can be used to update the baseline
Production Release. Once the update is complete the Work in Progress Release is
Locked and the update rights have been passed over to the new baseline Latest
Release (its icon is set as a gold unlocked padlock).
If the padlock is gold then this is the latest Release and holds the baseline count for the
application. This is the Master count which is used as the base for creating the next
Work in Progress Release to record future changes to the application.
Locked:
If the padlock is Gold
and locked it indicates that this Release has been copied to
create a Work in Progress Release and has most likely changed since it was copied.
If the padlock is Green
and locked it indicates that this Release will not be able to
update the baseline Production Release since it does not have 'update rights'.
NOTE: The User can override the status of a Release (i.e., colour and status of
padlock) by editing the fields called Update Rights and Latest Release when editing
the Release details. (See – Measuring a Software Project for more details.)
Releases - Overview
©Copyright Total Metrics Pty Ltd 2010
62
Managing your Function Point Counts
SCOPE records function point counts for both Baseline Counts and Projects Counts and
stores them under either:
Production Releases
This is the Baseline count of the version of the application that is currently in production.
Baseline Counts for past Production Releases are also stored in this group in the order
in which they were recorded in SCOPE. The very latest Baseline Count is the last on
the List and is called the "Latest Release" in SCOPE and is designated a (Gold Lock
Icon). It is this Release that provides the baseline release on which future modifications
are made.
Work In Progress Releases
This is a copy of a functional model of the version of the software that is being worked
on by the project team. If the software is new, then it may be the functional model of the
first version of the software during its development. If the software exists, i.e. the
application is in production, and then it may be a model copied from the Latest
Production Release and being worked on by the project team for an enhancement
project. If the software to be counted is a new development project then record the
count session by first setting up the Release as the first Release under Work in
Progress Releases. When the development project is complete use the Update to
Baseline option to create the new baseline count in the Production Releases. SCOPE
creates a copy of the functional model for the Development project as a Production
Release.
If you want to record the function point count for modifications (i.e., changes in
functionality) to the software application by the project, then set up a Count Session
under the Work In Progress Release.
If the Work in Progress Release is impacted by multiple change requests and each of
these need to be separately recorded and functionally sized, then select to Add a Count
©Copyright Total Metrics Pty Ltd 2010
63
SCOPE 3.0 Help User Manual
Version 1.0
Session for each Change Request. You can associate each Count Session with a
Project. Open the Count Session (‘calliper’ icon) to record the impact of the changes to
the Release specific to the Change Request. Each Work in Progress Release can have
multiple Count Sessions recording their impact concurrently. I.e., a Process or Data
Group can be recorded as being impacted (added, changed or deleted) by multiple
Count Sessions.
When all changes to the functionality from the projects within a Release have been
recorded on the Work in Progress Release model then it can be used to Update to
Baseline. If you Update to Baseline then all ‘impacts’ recorded on the work in progress
model are accepted and the net result is the new baseline version which is
automatically copied into the Production Releases. This is now the new Latest Release
and it has the Update Rights, where ‘update rights’ are assigned to the Release that
was the last to be changed. I.e. the current version of the model against which changes
can be made and these changes can be used to update the baseline.
Other Releases
This is an archive area for releases. Any version of the application stored here is also
editable, and can be based upon any other release version (including a Work In
Progress Release). Typical usage would be to store a ‘snapshot’ of a release at any
point in time. Versions within Other Releases cannot be used to update the baseline. If
you want to use a release in Other Releases to update the baseline then create a New
Work in Progress Release based on the selected Other Release, then ensure it has
Update Rights.
(See also Set Up a New Release)
Set up a New Release
Set up a New Release Tutorial
(If the video does not fit on the screen please
adjust the resolution to the highest settings)
©Copyright Total Metrics Pty Ltd 2010
64
Managing your Function Point Counts
In the Project and Application List screen (under File, Project and Application List in the
main menu), select the type of Release you want to measure.
•
If your software already exists and you want to develop a baseline model
(Application Baseline Count) then select Production Releases and Add a New
Release and its details. The Icon for this new release is an open gold padlock
indicating that it is the latest release and can be edited (has update rights),
(see Software Applications).
•
If the software application model is already recorded in SCOPE and you want to
measure the impact of a user Change Request on the software (Enhancement
Project Count) then select Work in Progress Releases branch under the
Application.
•
If any Work in Progress Release has the update rights (i.e. its Icon is an open
padlock) then this is the release that is currently being sized for different change
requests. Select this release to make your changes.
©Copyright Total Metrics Pty Ltd 2010
65
SCOPE 3.0 Help User Manual
Version 1.0
•
If there are no Work in Progress Releases or none of them has the update rights
then you will need to create a new release. Select New Release and when
prompted, base the new release on the Latest Production Release that has
update rights (gold open padlock icon). If there are no production releases just
select the option create New Release.
Only a Work in Progress Release with an Open Padlock can be selected to update the
Baseline in the Production Releases by selecting the button "Update to Baseline"
button in the Project and Application List. The default in SCOPE is to have the last
Release in the Release List as being the one that is being edited and therefore selected
as the 'Latest Release' with 'Update Rights'. If you want to transfer 'Update Rights' to
another Release then highlight the Release and select the Details Button. In the Details
screen de-select Update Rights. Highlight the Release you wish to transfer these rights
to and in the Details screen select to give it Update Rights.
Count Sessions
Count Sessions - Overview
An important concept of working with SCOPE is that of the Count Session (Session)
tracks the changes (impacts) of the User Requirements for the software within a
particular release. A Count Session would typically be set up for a Change Request or
a group of Change Requests. It corresponds to an Enhancement Count in the IFPUG
Terminology if the change is to an existing application. For a planned application, then
the Count Session would correspond to a Development Count. The Project
implementing the Change Requests can be created in the Project list along with the
type of project selected when entering the Count Session Details. As a special case a
Count Session can also be set up to record the background of a functional sizing
activity for a Baseline Production Release.
Hint: A Project can be linked to many different Count Sessions within many different
Applications. This enables you to size the scope of change of a Business Requirement
which has a project that impacts multiple applications. The total project size (sum of all
©Copyright Total Metrics Pty Ltd 2010
66
Managing your Function Point Counts
the counts for all the applications linked to the project) is reported in the Project Details
Report or online for each project in the Project List by selecting the radio button "Project
Impacted Size".
One Release may have many Count Sessions. The Releases are displayed in the list
in ‘bolded typeface’ with a padlock icon whilst the Count Sessions are displayed under
a Release as ‘regular typeface’ and have a calliper icon.
(See Create a new Count Session )
To start a new Count Session, to record the size of a Change Request, highlight the
name of the latest Work in Progress Release in the list of Software Applications.
(Under File-Software Applications on main menu), and click the Add button to add a
new Count Session. Enter details about the Count Session. To record functional
changes associated with the Count Session highlight the Count Session name under
the Release and double click or select Open. See Starting your First Function Point
Count
SCOPE keeps track of the modifications required by a Change Request by recording the
changes as ‘impacts’ on the Function Tree and Data Tree. Each impact is associated
with a Count Session. . To start your count, locate the Function Tree or Data Tree on
which you want to record the changes on the LHS window.
©Copyright Total Metrics Pty Ltd 2010
67
SCOPE 3.0 Help User Manual
Version 1.0
The impact on a Process or Data Group is recorded by highlighting the node on its tree
(on the LHS screen) and registering the Type of Impact using the radio button on the
status bar at the base of the LHS hierarchy. The Type of Impact options you have to
choose from are:
•
Add
•
Change
•
Delete
•
No Impact
Any new functions added whilst you are in a Count Session will be automatically
allocated an impact type of ‘Add’. SCOPE displays the ‘tracking’ of impact type within a
Session by highlighting the impacted Process and Data Group Icons with a different
colour depending on the impact type allocated.
Node Icons – Impact Type
- Green = Add
- Orange = Change
©Copyright Total Metrics Pty Ltd 2010
68
Managing your Function Point Counts
- Grey = Delete
- Black = No Impact
To view the name of the Count Session for which the impacts are being recorded, see
the drop-down list of Sessions for this release, which is displayed next to the Impact
Type on the status bar at the bottom of the screen. To record the impact for any other
Session for this release, first select that Session name from the list. If any single
Process or Data Group has been impacted by multiple Sessions then the names of
these multiple Sessions and their impact types are displayed in a window within the
‘details’ view for the Process or Data Group.
For example a new Process (Add impact type) may be changed during the
development life-cycle by two additional change requests. Each change request will be
associated with a Count Session and the impact type of ‘Change’ will be recorded.
The details screen will display the names of the three Sessions and their ‘Add’ and
‘Change’ impacts types. The ‘rework’ factor will record the three impacts and report the
cumulative effect in the Release Rework Report (i.e. multiply the function points for the
Process (=4) by the rework factor (=3) and give a total of (12).
NOTE : Tracking Impact Type for each Change Request (Session) with a colour is
similar to the Microsoft WORD ‘tracking option’ used in document editing sessions,
where a different colour is used to highlight new added words, or existing changed
words or deleted words. Whereas Microsoft WORD changes the font colour for the
different types of modifications and for different Users, SCOPE keeps the colour
allocated to the impact type, the same, but only displays one ‘‘User’s changes’, i.e., on
one Sessions modifications, at any one time and only the modifications for the selected
Session are indicated by the icon colour. However, as in Microsoft WORD, SCOPE
records all the impacts of all the Count Sessions on the same Release model so their
cumulative effect can be displayed and reported. Reporting the cumulative effect or
‘rework’ is similar to displaying all the current changes on the screen in Microsoft
WORD, whereas the Baseline Release Report is equivalent to Microsoft WORD’s
©Copyright Total Metrics Pty Ltd 2010
69
SCOPE 3.0 Help User Manual
Version 1.0
option of leaving Tracking on but ‘not displayed on the screen’. I.e., it gives the net
result and does not include the deleted functions. Updating to Baseline, is the same as
“Accepting all Changes” where the NET effect of the additions, changes and deletions is
the resultant model in the Production Release.
The ability to record concurrent impacts from more than one count Session facilitates
configuration control of change requests within a particular release. It ensures that
modifications from concurrent projects do not overwrite each other when the production
baseline release is updated with the result of the latest impact.
Set up a New Count Session
The following video tutorials explain in detail how to Set up New Count Sessions. If the
video display does not fit your screen, then please adjust the resolution to the
highest settings.
•
Set Up a New Baseline Count Tutorial
•
Setting up Multiple Counts on the Same Release Tutorial
•
Set Up an Enhancement Count Tutorial
©Copyright Total Metrics Pty Ltd 2010
70
Managing your Function Point Counts
Highlight the Release and select to Add a new Count Session. In the details screen
for the Count Session, if the Count Session is associated with a particular project then
select the project name from the list. (See Project List.) When you have completed the
details highlight the name of the Count Session and Open it.
Count Sessions are used to record:
•
the functions delivered by a new Development project, or
•
if the software exists to register the impact of an Enhancement project’s Change
Requests on a Release of your software application
The Function Tree displays on the main screen when you Open a Session.
©Copyright Total Metrics Pty Ltd 2010
71
SCOPE 3.0 Help User Manual
Version 1.0
You can display the main screen with the Function Tree at any time by selecting the
File-Project and Application List menu and then selecting the Release or Session.
HINT: If you want to track the impact of a Change Request (Development or
Enhancement Project Function Point Count) then highlight your selected Release and
Add a Count Session and its details. If you just want to make changes without the
changes being tracked then highlight the name of the Release to Open.
See Also Count Sessions
Projects
Link Projects to Count Sessions
Set Up an Enhancement Count Tutorial
(If the video does not fit on the screen
please adjust the resolution to the highest settings)
A project can be associated with one or more Count Sessions for one or more
Applications. Select to link a Count Session to a particular Project either by:
•
Selecting the Project List Tab on the Project and Application List Screen,
highlight the Project and select Add Count Session, the Applications List will
display all the available Count Sessions. Highlight the Count Session you want
associated with the Project and Select.
•
When editing the Details for a Count Session, in the Count Session Details
screen, select the Project from the Project List option
Project Metrics for ISBSG
The project characteristics and metrics data (effort, cost, duration etc) can be entered
into SCOPE for later use in productivity analysis. These characteristics and metrics are
consistent with those required by the International Software Benchmarking Standards
Group (ISBSG see WWW.ISBSG.org) for input into their repository.
©Copyright Total Metrics Pty Ltd 2010
72
Managing your Function Point Counts
To Print Project Details, open a Count Session that is associated with the project, select
“Report Selection’ under the File Menu and select ‘Project Details’ from under the
Description Report Group.
To export Project Details and all the function point metrics, use the Edit/Export/ Export
to Metrics Repository (XML) option under the main menu.
Note: ISBSG is planning to be able to accept XML input from 2010 onwards.
Projects - Overview
The Project List, lists the software development or enhancement projects that have had
User Requirements that change the functionality delivered by the software applications
in your SCOPE database.
See Link Projects to Count Sessions
©Copyright Total Metrics Pty Ltd 2010
73
SCOPE 3.0 Help User Manual
Version 1.0
The Project Details Report includes the size of each of the Count Sessions that are
linked to the Project and a total functional size for the project. It also reports the Project
Delivery Rate (PDR) in hours per function point and the dollar cost per function point for
the Project. This information is also reported online in the Project List by selecting
either Project Delivery Rate or Project Impact Size radio button.
.
Set up a New Project
Set up a New Project from under File / Project and Application List and selecting the
Project List Tab or when in the Count Session Details screen select the Project List
Button.
©Copyright Total Metrics Pty Ltd 2010
74
Managing your Function Point Counts
A Project Corresponds to a Business Initiative. As such it may have requirements that
impact many applications within an Organisations Software Portfolio.
A Project may be a New Development or a set of Requirements for Changes to existing
applications i.e. an Enhancement Project
SCOPE allows you to set up a Project and then link the project to the Count Sessions for
each Application Impacted. Total Project size and productivity can then be determined
by running the Project Details Report or online in the Project List screen.
HINT: To just have the counts relevant to your own Project, highlight a Project
and press the Snapshot Project Button on the Project List to select all the linked
Count Sessions for a Project to be exported to a new SCOPE database.
Value Adjustment Factor
Assessing the Value Adjustment Factor
NOTE: Assessing the VAF and using Adjusted function points is no longer
recommended in IFPUG CPM 4.3.
©Copyright Total Metrics Pty Ltd 2010
75
SCOPE 3.0 Help User Manual
Version 1.0
This can be optionally used to record the features of the software and adjusts the
Functional Size to a delivered product size.
When the main screen is displaying the hierarchy trees for a particular Release select
File – Adjustment Factor from the main menu. The General Characteristics (GSCs)
will display as defined in IFPUG 4.2. These have a default rating of ‘3’ (for average
influence) and the Rating check box will be empty. Highlight the General Systems
Characteristic that you want to rate and select the appropriate rating number from 0 to
5. As soon as you move the rating from 3 to another value the GSC is recorded as
having been rated and the check box will be ticked.
If you rate any single GSC then the VAF will be calculated assuming the other non-rated
GSCs to have a value of ‘3’.
©Copyright Total Metrics Pty Ltd 2010
76
Managing your Function Point Counts
If you do not select to rate any GSC then the VAF will default to the Industry average
default value of 1.00.
Value Adjustment Factor reports will highlight when the VAF or GSCs have assumed
a default value.
To Report the Value Adjustment Factor - From the main menu select File – Report
Selection – Others – Value Adjustment Factor. (sSee Other Reports).
The Value Adjustment Factor can be imported and exported between Releases within
the same or different Applications and/ or SCOPE databases.
Note: The Value Adjustment Factor is an optional step in the IFPUG 4.3 and the IFPUG
ISO standard for Functional Sizing. The Unadjusted function point count is the ISO/IEC
14143-1 compliant functional size.
Value Adjustment Factor - Overview
Select Value Adjustment Factor (VAF) to record the degree of influence a set (14) of
quality and technical characteristics General System Characteristics (GSCs) have on
the application.
The degrees of influence range on a scale of zero (being no influence) to five (being
strong influence).
The types of GSCs are listed, together with the IFPUG description. Select the
appropriate number to rate the GSC and optionally enter a descriptive note to support
your choice.
Any GSC that you have not rated will assume the average rating of ‘3’. If you do not
rate any of the GSCs, then the default Industry VAF (value =1.0) will be used in
©Copyright Total Metrics Pty Ltd 2010
77
SCOPE 3.0 Help User Manual
Version 1.0
calculations. The VAF is used to calculate the Product Size for the selected release in
Adjusted Function Points.
To Report the Value Adjustment Factor – from the main menu choose - File – Report
Selection Description - Release Value Adjustment Factor.
You can Import and Export the Value Adjustment Factor between Releases within the
same SCOPE database or different SCOPE databases. See Assessing the Value
Adjustment Factor
©Copyright Total Metrics Pty Ltd 2010
78
Managing your Function Point Counts
Managing the SCOPE Database
Export to SPR KnowledgePLAN® (CSV)
SCOPE exports a summary of the currently selected Release or Count Session's
Functional Size Results and Value Adjustment factor into a CSV format compatible for
import into SPR KnowledgePLAN®.
Open the selected Release or Count Session you want to estimate in KnowledgePLAN®
and select Export to SPR KnowledgePLAN® under Edit / Export.
SCOPE prompts the user to name the file and the directory to save the Exported *.CSV
file format.
This CSV format is a very generic layout and this function may also be used to create
Function Point Results for import into other software of your choice.
Export XML to a Metrics Repository
Select Export to Metrics Repository (XML) from under Edit / Export when you have a
Release open. SCOPE prompts you to name the directory and the exported XML file.
This export has been designed to export all the associated attributes and metrics
calculated and stored within SCOPE for example it exports all the fields identified as
being mandatory by the International Software Benchmarking Standards Group's
(ISBSGs) project data repository.
SCOPE exports all the fields that are in the SCOPE Description and Summary Reports for
the associated:
o
Application
o
Release
o
Project
o
Count Session(s)
If you are located at Release Level (i.e. No Sessions are Open), then Count Sessions'
Details will be exported.
If you have a Count Session Open within the Release then only that Count Session's
Details will be exported.
©Copyright Total Metrics Pty Ltd 2010
79
SCOPE 3.0 Help User Manual
Version 1.0
Import / Export Count Sessions
SCOPE will allow you to export a selected Count Session to be imported later into
another Release within either the same SCOPE database file or a different one. This is
essentially a 'merge' option where SCOPE merges the imported Count Session into the
Release, so the Release now reflects the latest impacts and the imported Count
Session becomes one of the Counts for the Release. Use this option to 'merge' counts
from one database to another, if you just want to 'extract' a count to work on it then to
merge it back into the original database, then use the Export Single Snapshot of Count
Session or Release option by selecting 'Snapshot' when highlighting the count.
This feature is useful under the following circumstances:
o
Administrative Control of Your Counts i.e. you have a 'master' database of
SCOPE counts which is controlled by an administrator, who wants to quality check
all counts prior to them being applied to the master version of the Release.
HINT: To do this Export the latest Release from Master into another
temporary SCOPE database where a counter can create and work on their
Count Session. When the administrator approves the count it is then
Exported from the temporary database and Imported back into the latest
Release within the Master database.
o
Multiple Counts to be completed Concurrently - you have many Change
Requests for Applications on the same database that need to be counted by
multiple counters at the same time.
HINT: To do this Export the latest Release from the Master Database to
one or many temporary SCOPE databases where each counter will then
create and work on their own Count Sessions. When each count is
approved, they are then individually Exported from their temporary
databases and Imported back into the latest Release in the Master
database.
©Copyright Total Metrics Pty Ltd 2010
80
Managing your Function Point Counts
o
A count on an Old baseline needs to be applied to the Latest Version - i.e.
You have completed a count for a project some time ago on an old version of the
baseline and now the user wants to go ahead with the project and you do not
want to have to spend the time to recount it based on the latest Release baseline
structure.
HINT: To do this Export the count from the older version of the baseline
and then Import it back into the latest Release in the Master database.
Note: Counts can be imported and exported between Releases for the same
application, different applications, or the same or different SCOPE databases.
Setting up a Count Session to be Imported / Exported
1. Set up the target Release Structure where you where you want to create your
new count session. This can be done several ways e.g.:
o
copy the whole SCOPE Master Database which has the Release count into
which you want to create your new Count Session. Leave any existing
counts in the Release
o
create a new SCOPE Database and create a new application node and
then export the selected Release from the source SCOPE Master
Database into the Work in Progress Releases branch under the new
application in the temporary database
o
create a new Release, based on an existing Release using the New
Release function on the Software Applications List
2. In the new target Release create your New Count Session. (See Create a new
Count Session )
3. Open the new Count Session and make your changes and Save.
©Copyright Total Metrics Pty Ltd 2010
81
SCOPE 3.0 Help User Manual
Version 1.0
Export Count Session
1. Select Export Count Session either :
o
under Edit / Export on the main menu while you have the Count Session
open
o
from the Software Applications List while you have the Count Session
highlighted
2. SCOPE prompts you to name the Count Session file (*.SCS) and select the target
directory for where it is saved.
Import Count Session
1. Open the SCOPE Master Database and Import the Count Session into the Latest
Release by selecting Import Count Session either :
o
under Edit / Import on the main menu while you have the Latest Release
open
o
from the Software Applications List while you have the Release
highlighted
2. SCOPE prompts you to select the Count Session file (*.SCS) and select the
directory where it is saved.
See also Import / Export Release and Export Single Snapshot of Count Session or
Release
Import / Export Release
Importing and Exporting Release Tutorial
(If the video does not fit on the screen
please adjust the resolution to the highest settings)
©Copyright Total Metrics Pty Ltd 2010
82
Managing your Function Point Counts
SCOPE will allow you to export a whole Release and all its counts and all their details or
just a node, branch or whole tree to an XML file of your choice. The XML file can then
be saved for later import. You can import into the same or different Count, Release or
Application within the same SCOPE database file or a different one. This option is useful
when you want to merge the Release counts into another SCOPE database. If you just
want to extract the Release to a clean empty SCOPE database then use the Snapshot
option.
Import /Export a Whole Release
This function allows you to merge Release counts performed off-line or stored in
another SCOPE database into a common master SCOPE Database.
To Import /Export a Release and all its count details, open the List of Applications
Dialogue box under File and select expand the Application node where you want to
Import /Export the Release.
Export Release
Highlight the Release name and select the Export Button. SCOPE will prompt you to
name the XML file where your exported count will be saved.
Import Release
Highlight the Release Group (i.e. Production Release, Work in Progress or Other
Releases) and select the Import Button. SCOPE will prompt you to select the XML file
where your count to be imported has been saved. It will be then imported and inserted
as the last Release in the Release Group.
©Copyright Total Metrics Pty Ltd 2010
83
SCOPE 3.0 Help User Manual
Version 1.0
Import / Export Trees and Parts of Trees
Importing and Exporting Trees and Parts of Trees Tutorial
(If the video does not
fit on the screen please adjust the resolution to the highest settings)
Import /Export Whole Trees or Parts of Trees
This feature allows you to import and export whole trees or parts of trees which make
up your functional model of your software. This is useful when you have:
•
counted similar functionality in another application and you want to copy it over to
this Release count to avoid re-typing
•
made a generic list of assumptions in another count and you want to have
access to them in this count
•
added in functionality in a previous Release but removed it as part of a descoping activity and you want to put it back in again
•
created a generic attribute list and you want the common set of attributes applied
to all your counts
•
had several different counters counting the same application and you want o
merge their counts into a single functional hierarchy and data list
Export a Whole Tree or Part of a Tree
Locate your cursor on the branch to be exported and select Export Tree from under the
Edit menu. SCOPE will prompt you with the XML file name where your exported branch
will be saved.
Import a Whole Tree or Part of a Tree
Locate your cursor on the branch where you want the imported nodes to be pasted and
select Import Tree from under Edit/Import on the main menu. SCOPE will prompt to
check if you want to import Count Session Impacts and / or links to other Trees.
If the nodes you are importing have been impacted by a Count Session then you will be
prompted to select to import a Count Session. In this case, SCOPE will add that Count
Session to the List of Sessions for the current target Release.
©Copyright Total Metrics Pty Ltd 2010
84
Managing your Function Point Counts
See also Using the Mouse to Copy and Move
Import Counts from MS Excel®
Importing a Count from Microsoft EXCEL Tutorial
(If the video does not fit on the
screen please adjust the resolution to the highest settings)
Your counts previously performed in Excel can be imported directly into SCOPE by
selecting the function Import from XCEL Template under Edit/Import on the main menu.
In order to import your counts you first need to extract all the count details into the
SCOPE EXCEL template. SCOPE will only import from this template.
You can import 4 different sets of size related information t. I.e. Transactions, Files,
Notes and Attributes from an MS EXCEL® file and saved in comma delimited file
format (*.CSV).
Steps:
1. Open the EXCEL® workbook “Master SCOPE EXCEL Import Template.XLS”
which was installed in the same Directory as SCOPE
2. Save a copy of the workbook under a working directory
3. If you already have your count stored in an EXCEL® spreadsheet then you will
need to copy it into the Transactions - Processes and Files - Data Groups
spreadsheets in the “Master SCOPE EXCEL Import Template” Workbook.
These worksheets have a specific content required for each column. You may
want to convert your existing spreadsheet data to that required by the “Master
SCOPE EXCEL Import Template” Workbook, before copying it.
4. Once you believe the data is in the correct format, select to copy the data from
your count. Use the Option "Paste Special”, and select to Paste "Values" to
paste your count data into your working copy of the “Master SCOPE EXCEL
Import Template” Workbook. The validation rules in the template will check your
data prior to importing it into SCOPE and highlight any errors in your content as
Red text.
©Copyright Total Metrics Pty Ltd 2010
85
SCOPE 3.0 Help User Manual
Version 1.0
5. If you are pasting text stored in software other than EXCEL, (e.g. MS WORD),
then copy the text into a temporary EXCEL spreadsheet. Select to copy the text
from the temporary sheet, and using the option "Paste Special”, and selecting to
Paste "Values", paste into the” Master SCOPE EXCEL Import Template”
Workbook. This ensures that the pasted values are validated prior to importing
into SCOPE.
6. Check the count spreadsheets (Transaction - Processes and Files -Data Groups)
for any invalid data which will be highlighted in Red. Check for any additional
error messages are in the column after the last input column. Correct any
erroneous data using the data entry input message as a guide for the correct
values required. Enter data directly into the template for any additional rows you
require to be imported into SCOPE.
7. The only mandatory column in any of the four spreadsheets is the first Column
A. If you want your function point count details transferred to SCOPE then you
will need to complete columns C and D and either E, F, G+H, to record the
complexity or alternatively use Column I to just record the FPs awarded to your
elementary processes or Data Groups and SCOPE will derive the complexity.
Use Column J to record the enhancement impact type (add, change, delete).
8. Do not leave any blank lines in your list to be imported. As soon as SCOPE
encounters a blank line it assumes the end of the list of data to be imported.
9. If you have a set of Notes or Attributes you would like recorded for the count in
SCOPE then insert the list in the Notes List or Categories / Attributes worksheets.
These items can be linked to their relevant functions once imported.
10. Once you have completed your data entry select to save your workbook as an
*.XLS file.
11. For each worksheet you want to import select to save as a Comma Delimited
File (CSV), using the SAVE AS option under Files and selecting CSV (Comma
delimited) (*.CSV) when selecting the "Save As Type". Select OK and YES
when prompted about saving and losing the formatting.
12. Save your file with relevant name and a CSV extension. You will need to save
each worksheet (Transactions, Data, Notes) you want imported as its own CSV
©Copyright Total Metrics Pty Ltd 2010
86
Managing your Function Point Counts
file name. For ease of importing, save related count files you want imported as a
set in the same directory. When you close MS EXCEL you will be asked again to
confirm to save the file. Only answer Yes if you have made changes since you
last saved.
13. Open SCOPE and select under Files on the main menu select to import your
function point count (Import from CSV) by selecting the relevant CSV for your
Transactions, Files and Notes.
14. If you want to import a list of Functions / Processes or Data Groups into an
existing SCOPE count then open the Release, highlight the tree you want to
import into. Highlight the node under which you want the list to be inserted and
select to Import Tree from SCOPE EXCEL template under Edit on the main
menu. From the browsed list select the relevant CSV file for that Tree Type.
Import from FPW™ All Versions
SCOPE imports all the detailed count data from function point counting tools such as
Function Point Workbench to the SCOPE format without losing any transaction, data,
labels or note details. It also imports all links. The IMPORT from FPW option enables
you to import your earlier counts created by Version 4 (1994) up to the Version 7 (2009)
of the Function Point WORKBENCH™ (FPW) software.
IMPORTANT - If you experience any difficulty with the import - With Microsoft
Explorer™ copy the FPW database directory (i.e. all .db and .px files) to a
directory under your local root directory or to your desktop. (Note: Reducing the
pathname of the source directory assists earlier operating systems (e.g. MS XP) to
access to the paradox files)
©Copyright Total Metrics Pty Ltd 2010
87
SCOPE 3.0 Help User Manual
Version 1.0
Converting FPW 4 to FPW 7 Databases
SCOPE will automatically convert FPW 4 to FPW 7 databases by first locating your
FPW database only one level from the Root node on your computer then selecting the
Import from FPW function on the main menu.
On selecting Import, SCOPE prompts you for the full pathname:
o
of the source directory currently storing all the FPW .db and .px files (e.g.
c:/FPW_Source_database)
o
of the destination directory for the SCOPE database. Requires you to input a
new file name for the SCOPE .FPA database in which to store the converted
FPW data
After you have input the new file name, press Import and SCOPE will display a
message asking you to be patient for very large databases as they may take several
minutes to import. SCOPE converts all the .db and .px files from the FPW database into
a single SCOPE *.FPA database file, saved under the new file name you input.
Export Single Snapshot of Count Session, Project or Release
SCOPE allows you ‘extract’:
o
a Release with all its Count Sessions
o
a Count Session for a Release - has all the nodes in the Release but with only
the selected Count Session impacts highlighted
o
a Project within a SCOPE database - exports ALL Count Sessions across all
Applications impacted by the Project. For each Count Session in the project it
exports all the nodes in the Release but with only the selected Count Session
impacts highlighted
All Snap Shot files include all the relevant details about the Application, Release,
Project and Count Session, SCOPE saves these details in a new SCOPE Database.
This provides an added level of security of your portfolio data in that it allows you to
extract only the Counts relevant to the counter or the person who is viewing the count
results. Once the extracted counts are updated or reviewed then the counts for the
©Copyright Total Metrics Pty Ltd 2010
88
Managing your Function Point Counts
whole Release or just the Count Session can then be exported and imported back into
the master Repository in SCOPE.
SCOPE “SNAPSHOT” allows the Count administrator to control access to sensitive
counts in the Master Repository, by extracting on the relevant count information for
counters to work on. It allows counters to count remotely on a small database for
additional speed and then merge their count back into the current baseline at a later
date. It also allows a counter to SNAPSHOT their count to distribute for review with
SCOPE Viewer™
Note: The 'snapshot' database created is a standard SCOPE database but only has one
Release and its Count Sessions stored.
To create a Snapshot database in the Project and Applications List, highlight the
Release, Project or the Count Session you want to be extracted to the new database
and select the Snapshot button. SCOPE will prompt you to name the new database.
This new database can be opened with either SCOPE or SCOPE Viewer™.
This feature is useful under the following circumstances:
o
Send a count to a non-SCOPE user for review - the administrator just 'snapshots'
the relevant count and sends the database to the user with instructions on how to
download SCOPE Viewer™. The user can view all aspects of the count, all links,
notes, attributes, details and descriptions without needing to have a licence for
SCOPE.
o
Extract all the Count Sessions for a Project into a single SCOPE database and
send these to a counter to complete the Project Count - the administrator just
'snapshots' the relevant Project in the Project List and sends the database to the
counter. When the counter has finished counting the Project they can 'export' the
Count Sessions for Import by the Administrator.
©Copyright Total Metrics Pty Ltd 2010
89
SCOPE 3.0 Help User Manual
Version 1.0
o
Administrative Control of Your Counts i.e. you have a 'master' database of
SCOPE counts which is controlled by an administrator, who wants to quality check all
counts prior to them being applied to the master version of the Release. Each time
a counter wants to count on the current Release, the Administrator takes a snapshot
of the current Release and sends it to the counter. When they have finished
counting they export their count for import into the Administrators master database
after it has been verified.
HINT: To do this select to Export the latest Release from the Master into
another temporary SCOPE database where a counter can create and work on
their Count Session. When the administrator approves the count it is then
Exported from the temporary database and Imported back into the latest
Release within the Master database.
o
Multiple Counts to be completed Concurrently - you have many Change
Requests for Applications on the same database that need to be counted by
multiple counters at the same time.
HINT: To do this select to Snapshot the latest Release from the Master
Database to one or many temporary SCOPE databases where each counter
will then create and work on their own Count Sessions. When each count is
approved, they are then individually Exported from their temporary
databases and Imported back into the latest Release in the Master
database.
o
Retain Security for highly sensitive counts - the administrator just 'snapshots'
the count that is relevant to the counter so that they cannot view other project
counts.
©Copyright Total Metrics Pty Ltd 2010
90
Managing your Function Point Counts
Auto Save Backup and Recovery
SCOPE will automatically save your database at prescribed time intervals. The default
interval is 15 minutes but it can be modified or disabled completely by the User
(View/User Options/ Auto Save). It is highly recommended that you do not disable Auto
Save, however if you are planning major changes to your data then we suggest that you
copy the database as a backup prior to making the changes, just in case you make a
mistake. If your SCOPE database is very large then it may be more efficient to just
'snap shot' the Release you are working on to a new database as your backup. Then if
you want to 'roll back' back your changes to the start then you can just import from the
backup snap shot version.
Be aware that if you are using the multi-user SCOPE Corporate version of SCOPE that
if another user selects to save the database then all your changes will automatically be
saved by their command.
If for some reason SCOPE is terminated unexpectedly while you have an open SCOPE
database, the next time you open SCOPE it will ask if you want to recover your unsaved
file. If you confirm then your previous set of changes will be saved and your database
re-instated.
Audit Trail of History of Changes to Counts
SCOPE will automatically record details of which Author who created or modified any
tree node (Functions, Data, Attributes or Notes), as well as when the change was made.
The information is displayed at the bottom of the Details screen for the Node. It tracks
all nodes for all trees.
By default the machine designated user name will be reported as the author of the
change, or you can input your own name as the author for your session (View- User
Options menu). When reviewing counts, you can search the trees for those nodes
created or modified by a particular user, on selected date ranges. The resulting
highlighted nodes are flagged on screen and can be reported selectively on any of the
SCOPE reports using the “Select Flagged Nodes” option in the Report Selection box.
This new audit option allows you to review any changes to a count and have a full
history of when those changes were made and by whom. This is particularly useful for
SCOPE Corporate multi-user environments when multiple users can maintain a count.
©Copyright Total Metrics Pty Ltd 2010
91
SCOPE 3.0 Help User Manual
Version 1.0
Use Find and Replace to search on Dates changes were made or Author's name. If
you are unsure of who made any changes then put an "
*
" in the search box all
changes by all Authors for the selected dates will be highlighted.
Multi-User - SCOPE Corporate
SCOPE Corporate License Type is designed for large organisations that require
concurrent access by multiple users to a SCOPE database. It enables storage of all
©Copyright Total Metrics Pty Ltd 2010
92
Managing your Function Point Counts
your function point counts in a central repository that can be updated and /or viewed
simultaneously by any number of SCOPE Corporate and SCOPE Viewer users.
To avoid the issues of two users working on the same hierarchy at the same time and
moving and changing components, SCOPE will lock a Release once it has been
opened. I.e. As soon as a User opens a Count for a Release, that Release is locked by
the User and no other Users will have access to it until the first User selects to exit the
count or opens another Release in the same database. SCOPE displays the name of
the User currently working on a count. Other Users can open and access any other
Release in the Database that is not specifically Locked.
•SCOPE Professional – has all the features of SCOPE Corporate but operates in the
same mode as previous versions of SCOPE and is ideal for organisations that prefer to
©Copyright Total Metrics Pty Ltd 2010
93
SCOPE 3.0 Help User Manual
Version 1.0
store their SCOPE counts locally and only need single user access at any one time to
the database.
Users can upgrade current licenses from SCOPE Professional to SCOPE
Corporate to take advantage of having global accessibility to your counts.
©Copyright Total Metrics Pty Ltd 2010
94
SCOPE Reporting
SCOPE Report List
Use the Menu Option Report Selection (or Ctrl P) to list the available reports for
printing or preview. Press + to expand the report group to select one or more
individual reports for sending to the printer or viewing all content online. Reports
displayed online can be saved as a PDF file using Acrobat Distiller (select to Print) or
sent as an email attachment via MSOutlook. Clicking on the top branch will select all
reports (select to Send). Reports can also be exported to HTML, MS EXCEL or MS
WORD.
NOTE: If the reports do not display in Preview Mode, Go to View, Screen Display
Options and insert the location of the Runtime Version of Microsoft Access. This has
been installed when SCOPE was installed but the directory location may not be the
default. Use MS Explorer to find the correct directory. Insert the full pathname e.g.
C:\Program Files\Microsoft Access Runtime\Office10.
To only include nodes from a selected branch in the report, first locate the cursor on the
appropriate tree branch in the main screen. Then in the report list ‘check’ the box
marked ‘from current position’.
If your report has fewer items than expected then
you need to check exactly where the cursor is located on every Tree, as it only reports
from that node downwards.
To further refine the selection of nodes to be included on reports, assign Flags to the
selected tree nodes and ‘check’ the box marked ‘select Flagged nodes’ or just locate
on the nodes you want to print and select the ‘Flag’ icon from the main menu. (See
Flags and Filters)
The main report groups are:
Description Reports
©Copyright Total Metrics Pty Ltd 2010
95
SCOPE 3.0 Help User Manual
Version 1.0
These reports, describe the background of the release models stored in SCOPE.
Reports include the Application Details, Project Details, Release Details, Release
Notes List, Count Session Details and the Value Adjustment Factor.
Hierarchy Tree Reports
Provide a diagrammatic outline-view of each of the four Hierarchy Trees. The
Function Hierarchy and Data Hierarchy Reports also provide an option to print the
Function Point Counting details next to each node i.e. type, and Fps awarded.
Linked Tree Lists
Provide a comprehensive list of the cross-referenced nodes Linking the Hierarchy
Trees to each other. For Data Group / Function Linked Lists it also reports the
type relationship between the Data Group and Process i.e. Update or Read Only.
Function Point Count Result Reports and All Counts for a Release
See also- Reporting the Functional Size in Function Points.
These reports provide both detailed and summary reports relevant to the
Functional Size of the currently selected Release Model. The different types of
Functional Size reports include and exclude different functionality as described in
Table below. The Functional Size result will include all functionality on both the
function and the data hierarchy unless you have selected to include only a branch
from the current position or only selected Flagged nodes within a branch using the
Filter Option. In that case the Functional Size reported will only be for the
selected Flagged nodes.
All Counts for a Release
Reports list a summary of all the Count Session Sizes both as a table and as a
comparative Bar Chart and Pie Chart, detailing the relative contribution of each
Count Session to the total Release Size.
Detail Reports
©Copyright Total Metrics Pty Ltd 2010
96
SCOPE Reporting
These reports include, Process and Data Group Detail reports. I.e. all linked items
and all functional size details each Process and Data Group that has been
selected.
Portfolio Size Reports
These reports list the size (baseline, impacted, reworked) of all Count Sessions,
all Releases for all Applications within the currently opened SCOPE database, in
either adjusted or unadjusted function points.
Attribute FP Size Profiles
These Reports profile your counts for the % that is linked to each attribute within a
Category. I.e. if you have identified processes as being mandatory to user or
optional to the user and created Attributes called Mandatory and Optional then
SCOPE will report the percentage of the count that has been allocated Mandatory
and Optional.
Hierarchy FP Size Attribute Summary
These reports are a combination of all the information available on the Hierarchy
FP Detail Reports, Function Attribute Lists and the SCOPE FP Count Result
Reports (Detail and Summary). However they are unique in that are in a hierarchy
format and they only display the nodes that are Relevant to the current selection.
They are the only SCOPE reports that uniquely identify for any single process
and or data group, the combination of attributes assigned to these nodes and to
total them by Attributes. They also identify the relevant impact types for the
Nodes. The single report includes both the Function Hierarchy and the Data
Hierarchy and the FP count summary reports.
The tables below describes the name , content and calculations behind each Report
Type.
©Copyright Total Metrics Pty Ltd 2010
97
SCOPE 3.0 Help User Manual
Version 1.0
Description
SCOPE
Measures
Processes and IFPUG
Data Included Terminology
Report Name
Baseline
Reports
Report the Net Baseline
Functional Size Application
of a Production
Release
Size of delivered All delivered
application
Application
Function Point
Count
Release
Reports
Report the
Baseline
Functional Size Release
of Work in
Progress
Releases and
Other Releases
Size of delivered All functionality Development
Release
delivered into
Project Function
production at
Point Count
completion of the
Release
(excludes any
‘deleted’ by a
Count Session)
Release Rework Cumulative size
of functionality
worked on by all
Change
Requests within
this Release
Selects all
Not available
impacted
(added, changed
and deleted)
functionality for
all Count
Sessions within
this Release
Release
Impacted
All functionality
delivered by this
Release.
Selects all
impacted
The size of
unique functions
worked on by all
Change
Requests within
Enhancement
Project Function
Point Count (for
more than one
Change
©Copyright Total Metrics Pty Ltd 2010
98
SCOPE Reporting
this Release
(added, changed Request)
and deleted) for
all Count
Sessions
Count Session Size of all
Selects all
Enhancement
Impact
functionality
impacted
Project Function
impacted by the (added, changed Point Count (for
currently
and deleted) by a single Change
the currently
selected
Request)
Change Request selected Count
Session
Linked Tree List Reports
Linked List
SCOPE
Nodes
Included
IFPUG
Terminology
Report Name
Reports the
Attribute Data
relationship of
the Links
Attribute Note
between each of
the four Trees
Attribute Function
Data Attribute
Data Notes
Selects all
Not Available
Nodes currently
linked. If
Flagged Nodes
or From Current
Position is
selected then
those nodes are
also included.
Data Function
Notes Attribute
Notes Data
Notes Function
Function Attribute
©Copyright Total Metrics Pty Ltd 2010
99
SCOPE 3.0 Help User Manual
Version 1.0
Function Data
Function Notes
Detail Reports for Processes and Data Groups
Process and Data
Detail Reports
SCOPE
Measures
Processes and IFPUG
Data Included Terminology
Report
Name
Report the
Functional Size
details of each
selected individual
Process or Data
Group. It also lists
the names of all the
Linked nodes
(Attributes and
Notes.)
Process
Detail
Report
Detailed
description of
each individual
Process or Data
Group and their
Linked Notes,
Data Group Attributes
Detail
Report
Selects all
Processes and
all data groups
for the Release
Reports the General
System
Characteristics and
their ratings. (See
Assessing the Value
Adjustment Factor)
Value
Adjustment
Factor
Report
Reports the VAF Value
value for current Adjustment
Release selected Factor
Not Available
©Copyright Total Metrics Pty Ltd 2010
100
SCOPE Reporting
Process and Data
Detail Reports
SCOPE
Measures
Processes and IFPUG
Data Included
Terminology
Report
Name
Report the
Functional Size
details of each
selected individual
Process or Data
Group. It also lists
the names of all the
Linked nodes
(Attributes
and Notes.)
Release
Impacted
Size – All
Sessions
Counts CHART
Release
Impacted
Size – All
Sessions
Counts CHART
For all Counts
Selects all
Enhancement
recorded under impacted
Project Function
(added, changed Point Count (for
the current
Release it
and deleted) by the Release –
reports the Size each Count
note this is an
of all functionality Session within aggregated
impacted by all the Release
count of all
Change
change
Requests for the
requests)
Release
All Counts for a Release - Reports
These tabular and graphical reports list the results of all counts for the currently
selected Release.
Portfolio Size - Reports
Reports the baseline impacted and reworked size for all Production, WIP Releases and
their Counts, in both adjusted and unadjusted function points.
Types of Functional Size Reporting
SCOPE reports the functional size in 4 different ways Each Type of report is used for a
different purpose and has a different scope of functions included in the Size. The types
of SCOPE reports are as follows:
1. Release Baseline Functional Size
2. Release Impacted Functional Size
©Copyright Total Metrics Pty Ltd 2010
101
SCOPE 3.0 Help User Manual
Version 1.0
3. Release Reworked Functional Size
4. Count Session Impacted Functional Size
The type of report can be selected at the time of reporting.
1. Release Baseline Functional Size
Reports the ‘Net’ size of the Release after all the impacts from the Count Sessions have
been applied. Although the functions marked as deleted are displayed on the screen,
these deleted functions will be excluded from the reports and the calculated net
reported size.
The Baseline Release Functional Size for a Work in Progress Release will be the same
as the size that will be reported in the Production Release after it is used to update the
Production Release.
This size measures the total amount of functionality that is delivered to the User by the
application and will be supported.
Note: In IFPUG CPM terminology this report would be equivalent to the Application
Baseline Size (Production Release) or the Development Project Size (WIP Release).
2.
Release Impacted Functional Size
Reports the aggregated size of the Count Sessions listed under the selected Release.
It is the total size of this Work in Progress Release and is the aggregated size of the
unique functions impacted by the Count Sessions listed for the Release. This is
different from a Release Reworked Report in that if more than one Count Session
impacts a Process or Data Group then the impacted function is only included once in
the total size. E.g.: if the WIP Release had two Change Requests (ie. separate Count
Sessions) that changed a process of 4 function points, then the impacted process would
©Copyright Total Metrics Pty Ltd 2010
102
SCOPE Reporting
only contribute 4 function points to the Release Impacted Functional Size. However the
impacted process would contribute 4 function points to the size of each Count Session
within the Release.
This size measures the total amount of unique functionality that is worked on during the
Release and ignores any rework. It is the net size of the Release irrespective of how
many times a function was impacted by Change Requests.
Note: In IFPUG CPM terminology this report would be equivalent to the sum of the
Enhancement Project Counts for a particular Release of an Application except that it
excludes duplicate counting of Enhancement Projects that impact the same function.
3.
Release Reworked Functional Size
Reports the cumulative size of the Count Sessions listed under the selected Release. It
is the total size of all the work done in this Work in Progress Release . This is different
from a Release Impacted Report in that if more than one Count Session impacts a
Process or Data Group then the impacted function is only included each time it is
impacted in the total size. E.g.: if the WIP Release had two Change Requests (ie.
separate Count Sessions) that changed a process of 4 function points, then the
impacted process would contribute 8 (i.e. 4 + 4) function points to the Release
Reworked Functional Size.
This size measures the total amount of functionality that is worked on during the
Release and includes any rework. It is the total aggregated size of the Release and
takes into account for the size if a function was impacted by more than one Change
Request. Many suppliers use this report for billing purposes as it actually reflects the
work they were asked to do.
Note: In IFPUG CPM terminology this report would be equivalent to the actual sum of
the Enhancement Project Counts for a particular Release of an Application.
©Copyright Total Metrics Pty Ltd 2010
103
SCOPE 3.0 Help User Manual
Version 1.0
4.
Count Session Impacted Functional Size
Reports the size of each Change Request (Enhancement Project) as a Count Session
within a Release. It is the total size of all impacted (added, changed, and deleted)
processes and data groups for the selected Count Session listed within the Work in
Progress Release.
This size measures the total amount of functionality that is worked on during by the
Change Request for the Count Session.
Note: In IFPUG CPM terminology this report would be equivalent to the size of an
Enhancement Project Count for a particular Release of an Application.
See also Report Selection
Reporting the Functional Size in Function Points
SCOPE conforms to the requirements of the ISO standard 14143-1 and the IFPUG ISO
standard 20926 and therefore reports the functional size as Unadjusted Function Points
unless stated otherwise.
SCOPE reports the functional size either:
•
Online
o
displaying the size for each Application, Release and Count in the Project
and Applications List Screen
o
for a currently displayed Release, and its Count Session in the Tree
Hierarchy Screen
o
for a currently displayed Release, Count from the Reports List by selecting
to Preview the Report or to send to HTML, MS Word® or MS Excel® and
then previewing using those applications.
©Copyright Total Metrics Pty Ltd 2010
104
SCOPE Reporting
•
Hardcopy
o
for a currently displayed Release, Count from the Reports Selection
Screen (Main Menu under File) by selecting to Print the Report
Online Dynamic Display of Functional Size
The Functional Size in Unadjusted function points is reported on the status bar below
the Main Screen. It reports the Release Baseline Functional Size, Release Impacted
Functional Size, Release Reworked Functional Size and the Count Session
Impacted Functional Size depending on which one is selected. It reports the size (in
unadjusted function points) for the function and Data Group nodes below those that are
currently selected on the Function Tree.
I.e., if you are located on the Root Node then the Baseline Functional Size reported will
be for all Processes and Data Groups in the Release.
E.g. Function = 100 UFPs, Data = 25 UFPs Total = 125 UFPs
If your cursor is positioned on a child node of the Function Tree then the Baseline
Functional Size reported would be for all Processes and the Data Groups linked to
those Processes from the current cursor position downwards.
Reporting Flagged Functions
If you have selected to flag four Processes worth 4 function points each, then the size of
the 'Flagged' nodes is reported in brackets. All the Data Linked to the Flagged
Functions is reported, irrespective of whether the Data Nodes have been Flagged. In
the following example 4 Processes were flagged of which 1 of them was linked to 2
Data Groups. Therefore Data reported to be linked is 15 FPs (10 + 5)
E.g. Functions= 100 (16) UFPs, Data = 25 (15) UFPs Total = 125 (31) UFPs.
However if you ONLY want to report the DATA NODES that are actually physically
Flagged, not all those actually linked, then go to the User Options under the Status Bar
©Copyright Total Metrics Pty Ltd 2010
105
SCOPE 3.0 Help User Manual
Version 1.0
Option in the dialogue box and check the box titled :"Only Flagged Data Nodes used for
FP Calculations"
When this option is checked, then for the case where only one of the above linked Data
Nodes (10fps) is Flagged then the reported Flagged count displayed in the Status Bar
will be:
E.g. Functions= 100 (16) UFPs, Data = 25 (10) UFPs Total = 125 (26) UFPs.
SCOPE Reports of Functional Size
SCOPE reports the functional size in 4 different ways which can be selected at the time
of reporting:
1. Release Baseline Functional Size
2. Release Impacted Functional Size
3. Release Reworked Functional Size
4. Count Session Impacted Functional Size
For more information refer SCOPE Types of Functional Size Reporting
Flags and Filters
Flagging Nodes on the trees allows SCOPE to selectively report,
only on those nodes currently Flagged by using the "Select
Flagged Nodes" option when reporting.
This gives tremendous
capability to the User to customize the reports to only list
those nodes that are required.
Nodes can be manually Flagged
(Highlight the Node and select - Flag-Toggle or ALT +F, or
select the Flag Icon on the menu).
However the most common way
of assigning Flags is to have SCOPE report on a particular
selection criteria and SCOPE will "Flag" the nodes that satisfy
the filters requirements. Using Flags, SCOPE allows you to filter your
function point count to selectively report the size. This filtering is performed by selecting
©Copyright Total Metrics Pty Ltd 2010
106
SCOPE Reporting
Filter Mode from the buttons on the top of the screen. The Filter button
is
located next Link Mode button. SCOPE is either in Link Mode OR Filter Mode. If the
small square boxes next to each node are not visible in the RHS, then you are in Filter
Mode.
In Filter Mode you can use the Boolean options (YES, NO or OR) to select nodes on
the opposite tree that satisfy the Link criteria you have selected, i.e, if you selected the
Boolean Option YES, to be tagged to some nodes on the RH tree, then SCOPE will
select all the nodes that are linked to all the tagged Nodes on the LH tree. Collections
within a tree can be Flagged and the result set of selected nodes can then be saved as
a Flag Set
for later display and use for that Release. Alternatively, you can assign
Flags using a Filter to highlight the existence of Links between nodes in different trees.
A particular selection of nodes and the conditions of selection are stored in a Filter Set.
The Filter Set
is equivalent to the ‘question’ being asked whilst the Flag Set is the
‘answer’ to that question. SCOPE enables you to save the question (Filter Set) and then
re-apply at a later date to display either the same Flagged answer (Flagged Nodes) or
different answers if you have made changes to the trees. Alternatively you can store
the answer, i.e. the Flagged set of nodes (Flag Set) and re-display it when required.
Flag Sets and Filter Sets are managed from the dialog box, displayed when you
choose Trees–Flag Set List or Trees–Filter Sets or the Flag icon or Filter icon from
the top menu.
Flag Sets and Filter Sets are saved for the specific tree highlighted at the time of
saving. To re-apply them you need to be located on the tree for which the set was
saved before selecting to view the dialogue box to retrieve them.
You can save many Flag Sets and apply them cumulatively so that the display
represents the net total of the selection Filters applied. You can also manually allocate
Flags to any node in addition to those Flags currently displayed. Manually allocate and
©Copyright Total Metrics Pty Ltd 2010
107
SCOPE 3.0 Help User Manual
Version 1.0
de-allocate flags by pressing Alt+F or selecting the Flag icon at the top of the screen
whilst located on a node. When you save the displayed Flag Set you can include the
new Flags or alternatively save as another set using the ‘save as’ option.
Filters allow you to highlight nodes (i.e. SCOPE attaches a Flag to the node to highlight
it) on the LH tree that are Linked to the node currently selected on the RH tree. The
conditions for the Filter are set on the right hand side and the Flags are displayed on
the LH tree.
To create a Filter:
•
Display two trees by clicking the appropriate tabs (they must be different trees,
you cannot filter Links within the same tree).
•
Choose Filter mode from the menu (Trees–Filter) or by selecting the Filter
Mode Icon from the top of the screen, and then selecting the Boolean conditions
(Yes, Or and No).
•
Set the criteria in the right hand tree by setting selection conditions (using either
the Node menu, or the toolbar buttons):
(Yes) Exclusive ‘AND’ Filter Sets a Flag for nodes on LH Tree that are Linked to
this node on RH tree. When additional nodes on RH tree are selected then any set
Flags are only retained on the LH tree if they are also Linked to the new selected
nodes.
(Or) Inclusive ‘OR’ Filter Sets a Flag for nodes on LH Tree that are Linked to this
node on RH tree. When additional nodes are selected using /\ then the previously set
Flags are retained on the LH tree and any additional Linked nodes are also Flagged.
(No) Exclusive ‘NOT’ Filter Sets a Flag for nodes on LH Tree that are NOT Linked
to this node on RH tree. When additional nodes on RH tree are selected then any
©Copyright Total Metrics Pty Ltd 2010
108
SCOPE Reporting
previously set Flags are only retained on the LH tree if they are also Linked to the new
selected nodes.
(Clear) Clears all currently set Flags for this node.
(Clear All) Clears all currently set Flags for nodes under this parent.
Nodes that match the filter criteria on the left hand tree are Flagged
save the Flagged nodes as a Flag set
. You can
for future reference and cumulatively apply
them to gain their aggregated impact.
For example if your question is display all the Process nodes Linked to three selected
Notes, then display the Function Tree on the left side and the Note tree on the right
side. Click on the ‘YES (And)’ Filter condition icon as you highlight each of the Notes.
The Flagged set of Processes Linked to all three Notes will be highlighted with a Flag
icon. These nodes selected with the Flag can then be reported using the “select Flag
nodes” option.
Flags can be assigned manually by highlighting the node you want to Flag then
selecting the Flag Icon. Additional Flags may be overlaid over those derived from the
Filter on the main menu or pressing Alt+F.
Flags can be assigned automatically using the Search and Replace function under the
Edit Menu. The results of the search will be flagged. This facilitates selective reporting
of all processes and data groups that satisfy specific search criteria.
©Copyright Total Metrics Pty Ltd 2010
109
SCOPE 3.0 Help User Manual
Version 1.0
Previewing Printing and Exporting Reports
All Functional Size Reports can be previewed online and/or printed.
The Functional Size can be reported in Summary or in Detail.
Detail reports list all the counting details for individual Processes and Data Groups.
Whilst the Summary reports summarise the results and group the totals in a variety of
ways to assist in comparison and analysis, The Functional Size of a Release can be
reported either as a total value for the whole release or by selecting the options in the
Report Selection Screen you can include and exclude functionality.
All of the following Functional Size reports will report on the whole Release or only
selected parts of the release if you select any or all of the following options:
•
From Current Position - the report only includes the Processes and Data nodes
linked to those Processes from that point on the selected branch downwards.
©Copyright Total Metrics Pty Ltd 2010
110
SCOPE Reporting
•
Select Flagged Nodes - the report only includes the Flagged Processes and
Flagged data nodes.
•
As Displayed - the report only reports the nodes currently displayed on the
selected Hierarchies. When reporting the Hierarchy Trees SCOPE reports the
branches only to the level they are currently expanded.
If you choose combinations of the above options then SCOPE combines the filter to
report the net result of these options.
You are able to annotate the purpose and content of your report by recording your own
Report Description in the Report Selection Screen. The description can be used to
provide extra information or instructions to the audience reading the report or to record
the filters used for the report. SCOPE will save a list of your report descriptions which
can be reselected at any time in the future. If you do not want the current displayed
description to print on your report header then just delete the text in the description box.
SCOPE allows you to preview and print your reports and export them to MS WORD or
MS EXCEL or HTML. You are also able to send the reports via email or in Adobe PDF
format (see Report Selection).
©Copyright Total Metrics Pty Ltd 2010
111
SCOPE 3.0 Help User Manual
Version 1.0
Exporting SCOPE reports into MS Office® WORD and EXCEL
documents
• Select <Report Selection> from under the Main Menu, select the report you want to
export and the format from the Report Selection dialogue box. SCOPE will launch the
selected MS application to enable you to view the report.
NOTE: Before selecting to export a report of the same name to the same target MS
Application a second time, you will need to save the previous report with another name
or close it. See also Convert SCOPE Reports to Text
©Copyright Total Metrics Pty Ltd 2010
112
SCOPE Reporting
Convert SCOPE Reports to Text
There are several ways that you can convert the SCOPE reports to text format to be
embedded in other documents. In the Report Selection Screen select the Output
Format as:
1. MS Word®, Ms Excel® or HTML, then saves the created document or
spreadsheet.
2. Preview the report using MS Snapshot Viewer® and select to save the report to
MS Office® Image Writer or as an Adobe® PDF format or send via Email ( you
can also save the .snp file using the save as option under Outlook)
©Copyright Total Metrics Pty Ltd 2010
113
SCOPE 3.0 Help User Manual
Version 1.0
Note: The conversion of SCOPE reports from Snapshot Viewer format to MS Word® and
MS Excel® uses a inbuilt MS Office Utility. This MS Office utilities conversion function is
outside the control of the SCOPE software, and sometimes changes the layout of the
report.
See also Report Selection and Sending SCOPE Reports via Email and Embedding
SCOPE Reports into a Client Report
Embedding SCOPE Reports into a Client Report
Embedding SCOPE Reports into a Client Report
If you want to have SCOPE reports embedded into another document then this can be
done by either creating the SCOPE report in WORD or EXCEL and then inserting into a
WORD document or alternatively creating the WORD report and saving it as a PDF file
and then merging SCOPE reports into the PDF file.
See also Convert SCOPE Reports to Text
Merging a SCOPE PDF file into another PDF File
1. Select to preview your report in SCOPE or if the SnapShot Viewer File has been
saved, double click to open the (*.snp) file.
2. From “File” in the main menu, select Print and select the printer as Adobe (Note:
you need to have the Adobe Distiller software previously loaded).
3. Check Adobe PDF settings and ensure that ‘Do not send fonts to Adobe PDF’ is
unselected.
4. Select Print and select the directory for the location of the saved PDF file.
5. Open Adobe and from main menu and select “Create PDF”.
6. Select from the option for “Multiple files”.
©Copyright Total Metrics Pty Ltd 2010
114
SCOPE Reporting
7. Select to “Add” files using the “browse” option - select one file at a time if a
particular order is required in the finished PDF file.
8. Select “OK” to create the aggregated PDF file.
9. The SCOPE Count Reports have now been appended to the client report as a
PDF file.
10. Client report is now ready to be created as a PDF file
Merging Annotating and Searching SCOPE Reports
If you have MS Office® 2003 or later you can select to Preview the Report in the Report
Selection screen and then when it displays in Snapshot Viewer select to Print the
Report to the printer called MS Office® Image Writer.
MS Office® Image Writer will open and then allow you to:
•
Annotate the Report
•
Insert text boxes
•
Merge this report with other SCOPE reports or other documents
•
Search for specific text (select Tools, Recognize Text for OCR)
See also Convert SCOPE Reports to Text and Exporting SCOPE Reports to MS
WORD® and MS EXCEL®
Sending SCOPE Reports via Email
If you want to enable someone else to view the output from your function point count
you can do this several ways:
1. Send all the Count Information and Instructs to download SCOPE Viewer
Use the Snapshot Release or Count function to extract the count data to a clean
SCOPE database. Email the database as an attachment with instructions to the person
©Copyright Total Metrics Pty Ltd 2010
115
SCOPE 3.0 Help User Manual
Version 1.0
receiving it, to download SCOPE Viewer and install so they can view all the count
details and run any extra reports.
2. Email the Reports as you View them Online
SCOPE uses a MS product Snapshot Viewer® to preview reports.
You can right click on the attachment and select Save As to save the Snapshot Viewer
Report or send to another user.
For other users to view a Snapshot viewer file they need to double click on the file
name, to display or print the report. If their Windows system does not already have
Snapviewer installed then they can download the Snapshot Viewer application free from
the Microsoft website. :
http://www.microsoft.com/downloads/details.aspx?FamilyID=b73df33f-6d74-423d-82748b7e6313edfb&displaylang=en
Click on the link, save the file on your PC and then run the install program. This will
install Snapshot viewer on your PC. Then just click on the files and they can be
previewed, printed and saved.
3. Email the Reports extracted into MS WORD®
Select to print the reports as an MS WORD® document and then save the report and
email as an attachment.
SCOPE Viewer
SCOPE Viewer™ enables Function point counters to share all details of the Count
Results as a softcopy with personnel who may not have a SCOPE license. SCOPE
Viewer™ works the same way as SCOPE but only has limited functionality.
It allows the user to view all aspects of a Count that has been recorded in a SCOPE
database. Function point counters can select to ‘snapshot’ just one count for Users to
review or they can select all counts for a Release or provide the users with access to all
counts in the SCOPE database.
©Copyright Total Metrics Pty Ltd 2010
116
SCOPE Reporting
The Users can then make comments on the count results and return the data to the
counter to incorporate into the master version of the count. SCOPE Viewer™ is free and
can be downloaded from the Total Metrics website.
http://www.totalmetrics.com/function-points-forms/SCOPE-Viewer-Request-Form
Whilst SCOPE Viewer™ will not allow the users to modify the count by adding, or
deleting Nodes, it will allow user to:
•
link nodes and to change node names and descriptions
•
run all count reports
•
Assign notes or attributes you have previously set up. We would recommend
that you set up an Attribute Category with Attributes that allow the Users to
assign relevant attributes to the nodes they have made changes to or aspects of
the count they want to highlight. E.g. Attributes could be Agree, Disagree made
changes, Incorrect see notes, etc.
©Copyright Total Metrics Pty Ltd 2010
117
Screens and Layout and Navigation
Main Screen Layout
SCOPE displays the Main Screen after the User selects to Open a Release or Count
Session when in the Applications List. The Main Screen is divided into several parts,
each of which has a separate role.
The central area of the main screen is divided into two parts, which will be referred to as
the left-hand (LHS) and right-hand (RHS) sides from this point onwards.
The two sides are identical and can be resized by dragging the centre dividing bar to the
left or right. They are interchangeable by clicking the ‘flip’ icon (looks like a bent paper
clip) located at the top of the screen. You can flip to focus the hierarchy on the left hand
side for Linking to other trees and re-size it to find the layout that suits you best.
Each side can contain one of five views, which you can choose using the row of tabs at
the bottom of the screen, above the status line. The only restriction is that you cannot
display the same view in both sides at the same time.
The views are grouped into two types: Hierarchy Trees and Details.
Hierarchy Tree views display one of the four trees:
1. Function
2. Data
3. Attribute
4. Notes
The views are selected using the Tabs above the main windows. When you display a
tree on one side and select the Detail
tab on the other, a data entry form appears
showing the details that correspond to the selected tree node. The Tab for the currently
displayed Tree is ‘raised’ and the other tree tabs appear as ‘depressed’.
©Copyright Total Metrics Pty Ltd 2010
119
SCOPE 3.0 Help User Manual
Version 1.0
NOTE: Some of the features within SCOPE can only be invoked when a hierarchy is
located on the LHS of the screen.
The two sides of the screen can show either two trees at the same time or one tree and
its associated details.
HINT: For very large counts, speed up the tree display turn off the dynamic calculation
of function points (select F5 or Main Menu, View, Options).
HINT: To speed up saving your database, use the Compact Database option under
Files in the Main Menu, then select Save.
In any of the tree views, you can:
•
Insert and Delete tree nodes
•
Edit node names
•
Copy nodes
•
Move nodes
•
Flag nodes
•
Record node impact type (Function and Data Group Trees only)
©Copyright Total Metrics Pty Ltd 2010
120
Screens and Layout and Navigation
If you display two trees at the same time, you can:
•
Link a node in one tree with a node or nodes in the other. To globally link
multiple nodes, right click on the parent node and select Link, Set All from the
pop-up menu.
•
Flag selected nodes by using the Filter feature on the top row of buttons, and
then using the boolean options on the button menu for your filter, or the short
cuts (Alt1=YES, Alt2=OR Alt3=NO, Alt4=CLEAR). You can also manually flag
nodes by selecting the Flag Icon or Alt F. To globally flag multiple nodes , right
click on the parent node and select Flag, Set All from the pop-up menu.
In the Details view, you can:
©Copyright Total Metrics Pty Ltd 2010
121
SCOPE 3.0 Help User Manual
Version 1.0
•
See expanded details for the node you have selected in the tree view (on the
opposite side of the screen). The fields displayed in the details will vary
according to the type of node you have selected.
•
Edit these node details.
Keyboard Shortcuts
Keyboard navigation shortcuts
Key(s)
Action
Left Arrow Select the node at the next highest level and collapse the current branch
of the tree
right Arrow Expand the current branch of the tree and select the node at the next level
down the tree
Up Arrow
Select the next node up within the current branch of the tree
Down
Arrow
Select the previous node down within the current branch of the tree
Ctrl+N
Create a new SCOPE file, Application, Release or Count Session
Ctrl+O
Open an existing SCOPE file
Ctrl+S
Save all changes to the current SCOPE file
Ctrl+P
Go to Report Selection List
©Copyright Total Metrics Pty Ltd 2010
122
Screens and Layout and Navigation
Double
Click Left
Mouse
Opens a Release or Count Session when in the Applications List.
Opens the Details Screen for the current node in the opposite window
when in Hierarchy Window.
Keyboard Function Key shortcuts
Key(s) Action
F2
Rename currently highlighted text
F5
Refresh Function Point calculation on Status Line. This option can be turned
on and off using Menu, View, Options, Dynamic FP Calculation
F1
Online Help
Utility shortcuts
Key(s)
Action
Alt+Ins
Insert a level 1 parent node
Alt+Ins+Shift
Insert a level 2 parent node (Data Tree only)
Insert
Insert a lowest level child node
Esc
Undo changes made to the current node name
©Copyright Total Metrics Pty Ltd 2010
123
SCOPE 3.0 Help User Manual
Version 1.0
Shift Up Arrow
Move the current node up the tree
Shift Down Arrow Move the current node down the tree
Delete
Delete the current node
Ctrl+C
Copy the current selection to the Windows clipboard
Ctrl+X
Cut the current selection to the Windows clipboard
Ctrl+V
Paste the contents of the Windows clipboard at the current position
Ctrl+T
Insert Template Function Group
Alt+F
Toggles to Flag/unFlag the current node
Space bar
Toggle a Link on or off in Link mode
Alt+1
Set Filter Condition to “Yes” in Filter mode
Alt+2
Set Filter Condition to “Or” in Filter mode
Alt+3
Set Filter Condition to “No” in Filter mode
Alt+4
Clear Filter condition in Filter mode
©Copyright Total Metrics Pty Ltd 2010
124
Screens and Layout and Navigation
Change the Count Session in the Display
Above the status line at the bottom of the screen is a pull-down list of available Count
Sessions for the displayed Release. If you select “No Session” then the Release
model will not allow Impact Types to be displayed or recorded.
HINT: If you need to fix up a baseline count for missing functionality, then select
No Session and make your changes so that they will not be recorded as part of a
count session and add to the size of your current projects.
If you have opened the Release model by selecting to open a Count Session then you
can display and record Impact Types for that particular Session. You can open a
particular Count Session at any time by selecting the name of the Session from the
pull-down menu list. If you are located on a node that has been impacted by another
Session for this Release then SCOPE will display the list of Sessions that impacted the
node with Impact Type for each session in the Node’s Details view.
An alternative way to change the Count Session currently displayed is to select File /
Project and Applications List and select to Open another Count Session.
Building Trees
Building the Hierarchical Trees Tutorial
(If the video does not fit on the screen
please adjust the resolution to the highest settings)
To build a tree of any type, you generate nodes and rename them. The type of nodes
that you can enter at any point depends on the tree, and the level within the tree. The
root node is Level 0; the Hierarchy Tree can be decomposed to ‘n’ levels.
•
High level nodes (Levels 1 or 2 etc) can contain child nodes of the same level or
lower.
©Copyright Total Metrics Pty Ltd 2010
125
SCOPE 3.0 Help User Manual
Version 1.0
•
Level ‘n’ nodes cannot contain any other child nodes. They represent the lowest
level.
•
Level ‘n’ nodes can be inserted directly within the root node. However we
recommend that you insert a level 1 or 2 node first.
•
For certain trees, nodes of different types (i.e. RETs and DETs) cannot mix on
the same Level of a branch of a tree.
To insert or edit tree nodes, use either:
•
Node menu at the top of the screen select
•
Alt Insert (parent nodes) and Insert keys (child nodes)
•
Mouse right click pop-up menu.
For very fast insertion of multiple standard sets of process nodes use the Insert
Template Function Group feature.
Expanding and Collapsing Trees
There are several sets of commands for expanding trees to show additional levels and
collapsing them to show only the higher levels. These work in the same way as
Windows Explorer™ and many other standard tree based applications:
•
Mouse commands – click the + and – signs next to nodes.
•
Keyboard commands - expand or collapse the tree based on the currently
selected node. SCOPE remembers which nodes were expanded previously after
the branch of the tree is collapsed (i.e. if the branch is expanded again, it will be
restored to its previous condition).
©Copyright Total Metrics Pty Ltd 2010
126
Screens and Layout and Navigation
The expand tree Buttons across the top of the screen allow you to select the degree of
expansion from 1 level to 4 levels.
The Expand Groups button (g) will expand the tree to just the Function Level of each
branch. Expand (n) levels allows you to choose the level of expansion.
Moving and Copying Nodes
(If the video does not fit on the screen
Building the Hierarchical Trees Tutorial
please adjust the resolution to the highest settings)
SCOPE makes it easy to expand and collapse trees, and to insert, delete, move, copy
and paste nodes in a tree.
Nodes can only be moved within the same Release and within the same tree. To move
a node or a branch of nodes use the Windows Drag and Drop feature i.e. highlight and
hold down the left hand mouse key and drag the node(s) to their target destination.
Nodes can be copied within the same Release, or into any other Release that is in a
currently open SCOPE database. However they may only be pasted into the same tree
type that they were copied from.
To copy a node or a branch of nodes, use the Windows copy / paste commands i.e.
highlight and hold down the left hand mouse key and the Ctrl key and drag the copied
node(s) to their target destination.
All Copy / Paste commands are available from the Edit menu, Right Click Mouse menu
or the shortcut keys.
©Copyright Total Metrics Pty Ltd 2010
127
SCOPE 3.0 Help User Manual
Version 1.0
If you only want to copy the 'links' associated with a node, then highlight the node you
want to select Links from and select 'Copy Links' from the Edit Menu (Ctrl+L), highlight
the target node that will receive the links and select Paste Links (Alt+L). This function
leaves the target node unchanged and only 'adds' the copied links to any existing links.
Note: you can also use the SCOPE Export Tree option under Edit to export a node ,
branch or whole tree. SCOPE saves the exported Tree Nodes into an XML file that can
be later imported back into a SCOPE Release using the Import Tree function. See also
Import / Export Within SCOPE database
See also Using the Mouse to Copy and Move and Keyboard Shortcuts
Using the Mouse to Copy and Move
Building the Hierarchical Trees Tutorial
(If the video does not fit on the screen
please adjust the resolution to the highest settings)
You can use the mouse to copy and move nodes in the tree in a similar way to Windows
Explorer TM.
•
Click on the node you wish to move, drag it to the new location, and release the
mouse to drop it. By default, dragging a node moves it.
•
If you want to copy a node, hold down the Ctrl key when you release the mouse
button.
•
To move a node up or down a branch in the tree press Shift Key and UP or
DOWN Arrow.
©Copyright Total Metrics Pty Ltd 2010
128
Screens and Layout and Navigation
When you move or copy a node you will be prompted to respond if you also want to
move or copy the Session impact types and Links for the node. If you answer No then
only the node details will be transferred.
Search and Find and Replace
SCOPE will allow you to search for any item by name on any tree and replace it with
alternative text. By selecting the MORE>> option, the search can be further customised
to search for:
o
Node Name and / or Description text.
o
Author's Name who Created or Modified the Node
o
Dates Ranges to search for when the Node was Created or Modified.
To use the search function go to Edit on the main menu and select Find and Replace.
You can select to search up or down the tree. By selecting the More>> button you can
further refine your search options.
All the nodes that satisfy the search criteria are highlighted and flagged. Since the
nodes are Flagged they can now be used to as a filter to:
•
Selectively report just the flagged nodes
•
Selectively link to just the flagged nodes
You can “accumulate” the flagged, highlighted nodes by selecting to search on other
criteria. The new search results will “add onto” the previous search results, so the
flagged nodes accumulate. To clear the flagged nodes select Clear All Flags from
either the Search and Replace Dialogue box, under Node on the Main Menu, or
selecting the “Unflag Nested” Icon on the tools menu.
©Copyright Total Metrics Pty Ltd 2010
129
SCOPE 3.0 Help User Manual
Version 1.0
Sorting Tree Nodes
Building the Hierarchical Trees Tutorial
(If the video does not fit on the screen
please adjust the resolution to the highest settings)
SCOPE allows you to sort the nodes on any of the trees. You can SORT the whole tree
or just from a selected branch downwards on the following fields:
•
Names of nodes of any Branch of any Tree - This is very useful for
documenting your counts so that you can easily locate an item within a list. For
example you may insert your Data Groups as you identify them and then select
to sort the list when you finish, enabling easy checking for completeness.
•
Links for any Branch of any Tree - This is very useful when you have long lists
of Data Groups or Notes and need to know exactly which ones are linked to the
currently highlighted process, without navigating the length of the tree.
©Copyright Total Metrics Pty Ltd 2010
130
Screens and Layout and Navigation
•
Type for any Function and Data Trees - This standardises the documentation
of your counts and facilitates locating processes, by sorting all your processes
under each branch into Inputs, Outputs and Enquiries and your Data Groups into
Internal Logical Files and External Interface Files.
Locate your cursor on the branch node you want sorted and right click the mouse. If
you want all Levels below this level sorted then select (Sort Branch – All Levels) or if
you just want to sort the direct descendent children of the current node select (Sort Next
Child Level Only).
Status Line
The status line (at the bottom of the Main Screen) provides the following information.
•
Help text at the left of the status line shows warnings and other messages. It
also describes buttons when you move the mouse over a toolbar button.
•
Functional Size - When the Function Tree is displayed, the numeric value in the
middle of the status bar shows the Functional Size for the Release, or the
selected node in unadjusted function points. See - Types of Functional Size
Reporting for more details. If you have selected (i.e. flagged) particular
processes or data groups using the Filter option or by manually Flagging. Then
the functional size of the selected items is displayed in brackets on the status
bar. SCOPE reports the Type of Functional Size (Baseline, Impacted, and
Reworked) depending on which option is selected on the status bar.
HINT: To update/refresh the displayed value in the count, select F5. The
functional size value updates dynamically as you move around the function tree.
For very large counts you can speed up navigation by turning off the display of
the functional size by selecting View, Screen Display Options from the Main Menu.
Turn off the check box titled “Dynamic FP Calculation”. To re-calculate the FP
size at any time press F5.
©Copyright Total Metrics Pty Ltd 2010
131
SCOPE 3.0 Help User Manual
Version 1.0
•
Nodes Dynamic Address at the right of the status line displays the position of
the currently selected node in outline numbered format. This address changes
you move around the hierarchy and the highlighted node changes. The dynamic
node address, automatically updates as nodes are inserted and deleted from the
tree.
•
Count Session List - lists all the Count Sessions within the current Release.
Select the Count Session you want to display from the Combo Box.
Toolbars
There are several predefined toolbars and buttons to simplify common tasks. To see a
description of a toolbar button, move your mouse over the button (without clicking it)
and a short hint will be displayed. Some of the buttons also have longer help text, which
is displayed in the status line at the bottom of the screen.
Toolbars are normally displayed in a single row underneath the menus at the top of the
screen. If you wish, you can drag any of the toolbars to any side of the screen, where it
will dock automatically. Toolbars can also be made to ‘float’ by dragging them from their
current location and releasing the mouse without being near a window edge.
You can control which toolbars are displayed using View–Toolbars from the menu.
Compact Database
©Copyright Total Metrics Pty Ltd 2010
132
Screens and Layout and Navigation
This option which is found under FILE on the Menu is used to compress an existing
SCOPE database. Run this option on a regular basis to reduce the overall size of your
SCOPE database and to speed up saving and response times.
Basic SCOPE Commands
Exit
This menu option will close any open files and exit SCOPE, returning you to MS
Windows. SCOPE prompts you to save data before exiting but does NOT save
automatically. SCOPE does NOT save as you edit, to save during editing use the
Save/Save As option.
New
Use this option to start a new SCOPE database. You will be asked for a new File Name,
and a location (on your hard drive or network) to save the file.
Open
This option is used to open an existing SCOPE database. The result is a standard
Windows dialog box, asking for the location of the database to be opened. SCOPE
databases have the extension .fpa.
Import from FPW
This option allows you to import all the data from Function Point Workbench™ into a
SCOPE database without losing any information. The import takes less than a minute
for an average sized FPW data repository. As soon as the import complete you can
start counting in SCOPE.
Close / Close Current
CLOSE will close your current .fpa database and all the counts. CLOSE CURRENT
only closes the currently displayed count.
©Copyright Total Metrics Pty Ltd 2010
133
SCOPE 3.0 Help User Manual
Version 1.0
Save/SaveAs
Use this to either Save the file you have been working on, or to save it in a different
location and/or with a different File Name. SCOPE saves automatically at user
controllable time intervals; you can adjust the time interval or disable the Auto Save.
However if you are in a multi-user environment using SCOPE Corporate then other
concurrent users may elect to save the database (including your data).
Compact Database
Use this housekeeping function to manage the efficiency of SCOPE. We recommend
you compact the database routinely to ensure that the indexes to all SCOPE records
are working efficiently.
SCOPE Online HELP
Press F1 in any screen to access Help on any topic. In order to view HELP your
computer needs to connect to the Total Metrics WWW site. SCOPE Help additionally
provides search capability on Table of Contents, Index, and Glossary. For more
advanced help also view the SCOPE online Tutorials (see
http://www.totalmetrics.com/products/scope/SCOPE_Help) and the Function Point
Counting Expert System FP Decision Maker™
Starting Up SCOPE
When you first run SCOPE, the options of which SCOPE database is to be opened can be
found under the File Menu.
In addition, the File menu also contains a list of the most recently opened databases.
These are listed in reverse order, above the Exit option. Other options in the File menu
are listed below.
©Copyright Total Metrics Pty Ltd 2010
134
Screens and Layout and Navigation
Setup Template Function Groups
Template Setup Options can be modified by selecting Setup button on the Insert
Template Group Dialogue box, or from under View on the Main Menu.
In this dialogue box you can set up your own customised Template Function Groups,
suitable for your organisation, and add the appropriate verbs to be assigned to the
processes, that are standard for your own naming conventions.
Create a new Template Function Group
Steps:
•
selecting New Group and give it a Name
©Copyright Total Metrics Pty Ltd 2010
135
SCOPE 3.0 Help User Manual
Version 1.0
•
The Prefix is the word that will be inserted in front of the "noun' name in the
Function Branch e.g. in the Standard (one) template Group in the example it is
the word 'Manage' prefixing the "Manage Loyalty Member Information" function.
•
The Suffix is the word that will be inserted in front of the "noun' name in the
Function Branch e.g. in the Standard (one) template Group in the example it is
the word 'Information' in the suffix of the "Manage Loyalty Member Information"
function
•
Select Update to update the Template Function Groups with your new Group.
•
However you will need to create some appropriate Process/Transaction verbs for
your new Template Function Group.
•
To change details for a Template Function Group just make changes then select
Update
Process/Transaction Verbs
SCOPE has a list of predefined Verbs that are currently used to describe elementary
processes e.g. add, modify, delete, cancel, transfer, report, list , browse, view, enquire
etc. These verbs have been pre-assigned the most common default ‘type’ and
'complexity'. For example the verb 'Add' in the following screen has been defaulted to
an External Input with Average complexity and would update a logical File. If you want
to Change Verbs then make your changes and select to Update.
Create a new Process/Transaction Verb by:
•
selecting New Verb and give it a Name
•
the Complexity is the complexity that will be assigned to the elementary process
when the function group is generated (Low, Average or High)
•
the Type is the type that will be assigned to the elementary process when the
function group is generated (Input, Output or Enquiry)
•
the Link Type is the access type that will be assigned to the elementary process
if the Function Group is generated from a Data Group. i.e. see Generating A
Function Group from a Data Group
©Copyright Total Metrics Pty Ltd 2010
136
Screens and Layout and Navigation
•
select Update to save the Template Function Group so it will now have your
new Verb
•
see the Preview Example to see how you Function Group will look when
generated by SCOPE using the Insert Template Function Group option
•
to change details for a Process/Transaction Verbs just make changes then
select Update
Reversing the Order of the Verb and Nouns in Template Function
Groups
The syntax of some Languages (e.g. German) requires the Verb to be located after the
Object name. Select the 'Reverse Option' at the bottom right hand side of this screen to
change the order of the noun and verb.
©Copyright Total Metrics Pty Ltd 2010
137
SCOPE 3.0 Help User Manual
Version 1.0
Importing and Exporting Template Function Groups
Export your Template Function Groups to save as a file that can be later Imported into
another SCOPE database and merged with any existing Template Function Groups.
Changing Language Screen Display and Reports
SCOPE is multi-lingual and provides the User with the option to change the Language
for the screen displays, messages, menus and reports.
©Copyright Total Metrics Pty Ltd 2010
138
Screens and Layout and Navigation
When you install SCOPE it automatically defaults to the Language pre-set by the
operating system of your computer. To change this language at any time after
installation:
Open View on the Main Menu and select User Options. The last Option is Language.
If you click Manual then SCOPE allows you to select from the list of available
languages. The default language is English. If SCOPE does not display your language
then please contact us at www.totalmetrics.com.
Languages include:
•
Dutch
•
Portuguese
•
French
•
German
•
Japanese
•
Chinese
•
Korean
•
English
•
etc.
©Copyright Total Metrics Pty Ltd 2010
139
SCOPE 3.0 Help User Manual
Version 1.0
©Copyright Total Metrics Pty Ltd 2010
140
Features in Versions of Scope
Overview of SCOPE 1.9 Features
1. Export Reports - SCOPE enables you to send and save any of the tabular or text
reports to:
•
Microsoft EXCEL®
•
Microsoft WORD®
•
HTML
Making it easy to embed SCOPE reports into your management reports or manipulate
the data in an EXCEL® spreadsheet.
2. Across Release Reporting – additional tabular and graphical reports that enable
you to compare counts across a Release.
You can now easily compare sizes of individual Change Requests within a Release.
3. Automatic Counting of Processes and Data Groups – SCOPE will automatically
derive the complexity of a process based on the number of Data Groups and DETs
linked to it.
You can now easily import the attributes of your Data Groups from an external source.
You can then select which Data Groups are referenced (FTRs) and which DETs are
used by the Process. SCOPE then derives the complexity of the linked processes and
data groups automatically. This is particularly useful for automatically calculating the
number of Data Groups you have linked to your processes.
4. Enhanced Searching and Flagging Capability – SCOPE allows you to select to:
•
Search and find text in any node of any tree and ‘highlight and flag’ the search
results
•
Flag all impacted processes and data groups for an entire Release or just a
Count Session so that you can selectively report or link them
©Copyright Total Metrics Pty Ltd 2010
141
SCOPE 3.0 Help User Manual
Version 1.0
•
Select to link / unlink to either flagged nodes only or to un-flagged nodes only
SCOPE has advanced reporting features that can be applied selectively to flagged
functions. The capability to ‘automate’ the flagging means that you can select functions
for reporting or to be linked to another node with a minimum of key strokes. The
highlighting of all functions impacted within this Release allows you to see the effect of
all the Change Requests that have been applied within this Release period.
The ability to Link just to Flagged nodes facilitates linking between trees. E.g. search
for “Customer” on the Process tree will highlight and Flag all “Customer” related
processes, then select the “Customer” Data Group and Link to Flagged Nodes. You
can choose to link as Update or Read Only.
5. Clone Links – You can now select to copy only the links on a source node and paste
the links to a target node and optionally to all of its descendents.
This feature speeds up your documentation by cloning the links you have previously
created on a node to be copied and assigned to any other nodes and/or their children.
6. Set Links for Data Groups – You can now select to link to a set of dependents and
choose whether the link access type is Read Only or Update. SCOPE also allows you to
select to leave existing links or overwrite.
This feature speeds up linking of Processes to Data Groups particularly when you want
to document how the DETs and FTRs are accessed.
7. Cursor position ‘jumps’ to last inserted node – When positioned at a parent node
and inserting a child node, the cursor will focus on the child node enabling immediate
editing of the name.
This feature speeds up data entry enabling immediate editing of the last inserted node.
©Copyright Total Metrics Pty Ltd 2010
142
Features in Versions of Scope
8. SCOPE retains name of last inserted node – When inserting a node under any tree,
SCOPE retains the name of the last tree node entered and allows you to then modify the
name. (You can optionally toggle this feature on or off via View/Preferences/Auto Fill
Name”)
This feature speeds up data entry of nodes with similar names
9. Report Comments in Descriptions saved – SCOPE saves your customised text in
the report description in a drop down list so you can reuse it for multiple reports.
This feature speeds up the customisation of your report headings, enabling you to
record specific comments on a set of reports.
10. Set defaults for data entry of Function and Data Nodes – SCOPE previously
defaulted the inserted processes to the industry default values of ‘Average complexity
Inputs’ and the inserted data groups to ‘Low complexity of an undefined type’. You can
now select your own defaults for Type and Complexity under “View /Preferences”
This feature speeds up data entry of similar nodes eg. A long list of high complexity
reports can be entered by just pressing the Ins Key..
11. Convert a ‘RET to a Data Group’ and a ‘Data Group to a RET’ – SCOPE allows
you to correct any errors in data entry by allowing you to convert an incorrectly grouped
Data Group to a RET and vice versa.
This feature enables you to easily correct your counts when you have grouped your
RETS and Data Groups incorrectly. It is particularly useful when you import a list of
physical tables with their attributes from EXCEL® and you want to regroup them into
FTRs and RETs.
12. User Preferences to select defaults – SCOPE allows you to save time counting by
setting the default for the following options when you select to Insert a new node:
•
Type of Process or Data Group e.g. Input, Output, Enquiry
©Copyright Total Metrics Pty Ltd 2010
143
SCOPE 3.0 Help User Manual
Version 1.0
•
Complexity of Process or Data Group e.g. Low , Average or High
•
Result Source – i.e. Range, Derived, User Input, Default, Assessment (see View
- Preferences)
13. Speeded up display - SCOPE has significantly speeded up any functions that
require searching and displaying the hierarchy. Remember to select to turn off the
Dynamic FP Calculation to make SCOPE work even faster (see View – Options under
main menu).
14. Autofill Name Inserts- SCOPE will autofill the name of a new node with the name
last used for that type of node. This speeds up documenting your count when you have
consecutive nodes with similar names. To use this feature select autofill Name under
View - Preferences.
Overview of SCOPE 2.0 Features
1. Multiple counters simultaneously count the same Baseline – SCOPE enables
you to count your Change Requests off-line and then merge your count back into
the master copy of the Work in Progress Release so other counters’ changes are
retained when your changes are recorded. Alternatively you can merge a
previous count for a project that you put on hold into your latest Baseline.
You can now easily have multiple counters counting multiple change requests
concurrently on the same baseline. If you have counted a project based on an old
baseline that was put on hold, you can export it from the old Release count and
import it to apply to the current Release hierarchy. See Import / Export Count
Sessions
2. Count what you want when you want – SCOPE allows you to count projects
against a current Work in Progress Release baseline, then if the Project is not
completed in time for the Production Release to be updated, or if the Project did
not go ahead as planned, just select to hold it over for the next Release. SCOPE
will not update the baseline with the count and will create a new Work in
Progress Release which will include the delayed count.
©Copyright Total Metrics Pty Ltd 2010
144
Features in Versions of Scope
SCOPE responds to the needs of a busy IT shop that require ‘what-if’ counts for
planning purposes but do not want to lose the information or have it become out of
date before the project is actually implemented. SCOPE will retain the information
of the count over time and exclude it from updating the Baseline until you decide
to do so. See Excluding Counts from Baseline Update
3. Count Conversion Functionality and select to exclude it from the Baseline
Update – SCOPE allows you to create a Count Session within a project
specifically to count conversion functionality. It will be counted as part of the
Release size for the project but can be selectively not applied when updating the
Production Baseline count.
SCOPE lets you decide which counts within a Release will be applied to the
Baseline. See Excluding Counts from Baseline Update
4. Reporting the Project aggregated size and Productivity Rate – SCOPE
reports the size of a project’s Count Sessions in each Application impacted by
the project. It aggregates the sizes and determines the total project size and the
project delivery rate (PDR) for the project in the Project Details Report.
This feature enables reporting and comparison of project productivity rates. See
SCOPE Report List and Project Metrics for ISBSG
5. Application Portfolio Metrics Reports – SCOPE reports all sizes of all
Releases and Count Sessions for all Applications in the Applications Portfolio.
This feature is available online and in hard copy.
This feature enables you to view and compare Release sizes and Baseline
Growth over time for all applications in unadjusted or adjusted function points. See
SCOPE Report List
6. New features in SCOPE Release 2 that will increase your productivity
o
Online Dynamic Reporting of Count Sizes – Select the option on the
status bar to dynamically report Baseline Size, Reworked Size or
Impacted Size for the Release or Session SCOPE displays at the bottom of
the hierarchy screens.
©Copyright Total Metrics Pty Ltd 2010
145
SCOPE 3.0 Help User Manual
Version 1.0
Saves time running online reports by reporting the latest size value
dynamically as you count. See Types of Functional Size Reporting
o
Export Metrics for Import into other Products – Select to export :
•
All Metrics Results - for a Release, Project or a single count to an
XML file for easy import into your own metrics repository or an
industry database. See Export XML to a Metrics Repository
•
Functional Size Results into a CSV format compatible for import
into SPR Knowledge Plan®. See Export to SPR KnowledgePlan
(CSV)
Seamless integration of SCOPE results into your estimation and metrics
repositories.
7. Listing of Notes, Attributes and Data in the Detail Screens – See at a glance
a list of the linked notes, data and attributes when viewing the details of each
Process or Data Group, double click on the list to take you to the selected link.
Speeds up counting and count reviews, as everything is on a single screen.
See Viewing Linked Processes, Data , Notes and Attributes
8. Online Reporting of the Size of All Releases, Count Sessions in the
Applications List Screen – You can see at a glance the size of all Count Sessions
and all Releases for all Applications in the Application List Screen. Size can be
optionally reported as Baseline Size, Reworked Size or Impacted Size for
Release or Session.
This feature saves creating reports on individual Count Sessions and Releases to
compare values.
9. Group Data Groups into Folders on the Data Hierarchy – SCOPE enables you
to group related Data Groups under a Data Group on the data hierarchy for ease
of documentation and understanding. For example Folders could be for
Accounts, or Customer related Data Groups or alternatively a folder for your
Reference Files, Configuration Files, Rule Tables and your External Interface
files, grouped by the applications where they reside.
This feature facilitates easier understanding, completeness of documentation and
easier maintenance of your counts. See The Data Tree
©Copyright Total Metrics Pty Ltd 2010
146
Features in Versions of Scope
10. Reporting Function and Data Type and their size on the Hierarchy Reports
– SCOPE now also reports the type and size of each process and data group on
the hierarchy report. At group level it reports the aggregated size of the child
nodes.
This feature enables easier checking of the count completeness and accuracy as
all processes and data groups are positioned where they occur in the functional
model. See SCOPE Report List
Overview of SCOPE 2.1 Features
1. Project Productivity and Size Reporting – The Project List is now available as a
tab on the Project and Applications List Screen. The Project List displays all Projects
with their associated Count Sessions and count sizes along with the Project aggregated
size. If a project’s effort is recorded within the Project Details, then the Project Delivery
Rate (PDR) of the project is also displayed and reported. Highlight the count and it will
display its associated Release and Application, double click it to open it.
Easy aggregation and reporting of a Projects’ counts across multiple Applications.
2. Everyone can now have free access to view all Count Details with SCOPE
Viewer™. SCOPE counts can now be viewed by the user or count reviewer using the
free downloadable reader SCOPE Viewer™. This free publicly available SCOPE reader
is downloadable from the Total Metrics WWW site allows viewing and reporting on all
aspects of the count.
SCOPE ensures that you can easily share your count results with anyone; they can run
their own reports and review all your counting decisions. Saves you time by not
needing to run multiple reports to distribute.
3. Selectively extract “SnapShots” of Releases or Counts – SCOPE allows you
‘extract’ a Release with all its counts or just a Count Session for a Release and all their
details and save them in a new SCOPE Database. This provides an added level of
security of your portfolio data in that it allows you to extract only the Counts relevant to
the counter. Once they have made their changes to the count then the whole Release
or just the Count Session can be exported and imported back into the master
Repository in SCOPE.
©Copyright Total Metrics Pty Ltd 2010
147
SCOPE 3.0 Help User Manual
Version 1.0
SCOPE “SNAPSHOT” allows the Count administrator to control access to sensitive
counts in the Master Repository, by extracting on the relevant count information for
counters to work on. Allows counters to count remotely on a small database for
additional speed, then merge their count back into the current baseline at a later date. It
also allows a counter to SNAPSHOT their count to distribute for review with SCOPE
Viewer™
4. Automatic Recovery – If your operating system crashes or your network fails, while
you have an open SCOPE database, the next time you open SCOPE it will ask if you
want to recover your unsaved file. If you confirm then your previous set of changes will
be saved and your database re-instated.
SCOPE now ensures that you will never again lose data due to untimely system
interrupts.
5. Reporting all Trees ‘As Displayed’ – SCOPE allows extra refinement to all
reporting so that only the nodes ‘expanded’ on the trees as they are currently displayed
on screen, will print on the reports. The selection can be further narrowed by using the
existing report filters of only reporting from the branch downwards, flagged nodes or
only the nodes impacted by the Count Session or Release
This feature further enables customised reporting so you only report what you need to
see.
6. Reporting Count Values filtered by Attributes – SCOPE will report the actual
number of function points, and their percentage contribution for the processes and data
groups assigned to the different attributes. These percentages are reported with
respect to the entire Baseline Count or can be further refined to only report for the
particular Release or Count Session. (See “Reports – “Attribute FP Size Profiles”).
This new report allows you to interactively report the percentage of functionality that
satisfies different attributes. E.g. The percentage of ‘High Priority’ functionality
compared to ‘Optional’ or percentage of a package that needs’ reconfiguring’ rather
than be ‘coded’. Customise your attributes so you can report on your own profiles to
support your decision making.
©Copyright Total Metrics Pty Ltd 2010
148
Features in Versions of Scope
7. Process and Data Groups assigned a ‘zero’ multiplier are now display
highlighted ‘blue’.
Immediately highlights if a process or data group has been ‘turned off’ and is not
contributing to the count.
8. The Notes Icon now shows when it includes a description – if a Note has
additional text in the description field, the Notes Icon changes from
to
Allows you to quickly discern if there is additional information about the Note in the
description that may be of interest.
Overview of SCOPE 2.2 Features
1. SCOPE now speaks your language
SCOPE 2.2 and SCOPE Viewer™ are now multi-lingual. You can choose the
language for your screen displays, messages and reports. When installed
SCOPE defaults to the language set by your operating system. When you are
running SCOPE you can change the language to the language of your choice
including:
•
English
•
Portuguese
•
French
•
German
•
Italian
•
Chinese
•
Japanese
•
Korean
•
Dutch
©Copyright Total Metrics Pty Ltd 2010
149
SCOPE 3.0 Help User Manual
Version 1.0
•
Spanish
•
etc
Now you can function point count in your language and report to your users in
their language.
2. Automated Counting - SCOPE Function Block Templates
SCOPE 2.2 allows you to quickly count ‘standard’ functionality by generating function
blocks of transactions that have their name type and complexity automatically assigned
to previously defined default values. This is particularly useful in early counting.
For example: Often a logical file will have one or all of the following transactions Create, Modify, Delete, View, Browse/List and, or Report. To generate all of these
transactions and their file links, just locate your cursor on the logical file and select to
insert a ‘Template Function Group’ and SCOPE will automatically generate all the
transactions for you. You can create multiple Template Function Groups and set up
default name, type and complexity and whether they update or only read a file.
Once you have set up your default templates SCOPE allows you to import and export
them for future use by yourself or your colleagues.
©Copyright Total Metrics Pty Ltd 2010
150
Features in Versions of Scope
Overview of New SCOPE 3.0 Features
1. SCOPE 3.0 has Flexible License Options – Single User or Multiuser?
• SCOPE 3.0 Corporate - is the new multi-user license type designed for large
organisations that require concurrent access by multiple users to a SCOPE
database. It enables storage of all your function point counts in a central
repository that can be updated and /or viewed simultaneously by any number of
SCOPE Corporate 3.0 and SCOPE Viewer users.
• SCOPE 3.0 Professional – has all the features of SCOPE 3.0 Corporate but
operates in the same mode as previous versions of SCOPE and is ideal for
organisations that prefer to store their SCOPE counts locally and only need single
user access at any one time to the database.
Contact us now to upgrade your current licenses from SCOPE Professional to
SCOPE Corporate to take advantage of having global accessibility to your counts.
©Copyright Total Metrics Pty Ltd 2010
151
SCOPE 3.0 Help User Manual
Version 1.0
2.
Complete Audit trail of all Count Updates
SCOPE 3.0 will automatically record details of which User created or modified any
tree node as well as when the change was made. By default the machine
designated user name will be reported as the author of the change, or you can
input your own name as the author for your session (View- User Options menu).
When reviewing counts, you can search the trees for those nodes created or
modified by a particular user, on selected date ranges. The resulting highlighted
nodes are flagged on screen and can be reported selectively on any of the
SCOPE reports using the “Select Flagged Nodes” option in the Report Selection
box.
This new audit option allows you to review any changes to a count and have a full
history of when those changes were made and by whom. This is particularly useful
for SCOPE Corporate multi-user environments when multiple users can maintain
a count.
3.
Snapshot a Project and all its Count Sessions
SCOPE 3.0 allows you to select a Project on the Project List to ‘Snapshot’ into its
own database. The new database will only include the Project’s related Count
Sessions, for all the Applications impacted by the project. This new function is
similar to the existing ‘Snapshot Count’ function but it exports all the counts
assigned to the Project into a single new database.
Allows a counter to create a single database with just their projects impacted counts so
they can be worked on as a project group. Other users reviewing the project count can
be shown only the Count Sessions relevant to their project.
©Copyright Total Metrics Pty Ltd 2010
152
Features in Versions of Scope
4.
Automatically Saves your data at user defined intervals
SCOPE will automatically save your data at prescribed time intervals to avoid you losing
critical changes when experiencing power or network failures. If you would like to
manually control the save option then just select to change the frequency of the ‘save’
or disable it under ‘User Options’
5.
New Hierarchy Style Function Point Count Details – all on a single
Report
The new “Hierarchy FP Size Attribute Summary Reports” combines the Process
Hierarchy and Data Hierarchy into a single report that only includes those lower level
nodes relevant to the Count Session or Release currently selected. Each displayed
node reports the function point count details such as Process Type and FPs but
additionally identifies which nodes are assigned to the currently flagged Attributes. It
also reports impacts to DETs and RETs. You can selectively ‘flag’ up to 5 different
Attributes from the same or different Categories to be highlighted and summed on the
report.
We developed this report at the request of our users and believe it will soon be
SCOPE’s most popular report.
©Copyright Total Metrics Pty Ltd 2010
153
SCOPE 3.0 Help User Manual
Version 1.0
6.
Other Features and updates - SCOPE 3.0 responds to your at your
requests.
•
Hierarchy Details Report - Function and Data - The functional size of each
process and data group are now right justified and totalled for each Hierarchy
report.
•
Import Count Sessions – now as additional inbuilt intelligence that automatically
determines the correct location of imported nodes
•
Online report - ‘flagged’ data FPs - User Options, choose either
o
report all the data which is linked to flagged functions, OR
o
only report flagged data which is linked to flagged functions.
©Copyright Total Metrics Pty Ltd 2010
154
Features in Versions of Scope
•
Imports directly ALL FPW Versions - imports all FPW FP detailed data - Most
counts in less than a minute for all FPW versions 4 to 7
•
Template Set Up Options - Allows the user to select the order of the noun and
verb to suit the grammar requirements of the language they are operating in (see
“Reverse” option)
©Copyright Total Metrics Pty Ltd 2010
155
Moving from FPW to SCOPE
Background of Comparison of SCOPE and FPW
SCOPE Project Sizing Software ™ is recognised by the metrics industry as the
most advanced function point counting tool available on the market today and was
designed by industry expert Pam Morris (CFPS), who specified and project
managed the original development of Charismateks Function Point Workbench™
software (FPW) from 1991 to 1994.
SCOPE was built specifically to address all the limitations that the Total Metrics
team of CFPS function point specialists , had experienced when using FPW;
particularly with respect to ongoing management of counts in a corporate
environment and tracking software changes in outsourcing Contracts.
SCOPE has extended all the great functions and features, originally designed into
FPW, to take them to a new level of sophistication. In bringing function point
counting up to date with the latest software technology and methods of
development, it has also added many new features to take your function point
counting into the future.
Function point counting is now:
o Easier
o More reliable
o More accurate
o More cost effective
o More accessible
o Less exposed to risk of losing data
o Less exposed to risk of data corruption
©Copyright Total Metrics Pty Ltd 2010
157
SCOPE 3.0 Help User Manual
Version 1.0
SCOPE imports all the detailed count data from all current versions of FPW so
you can upgrade to using SCOPE in minutes and continue counting without any
loss of historical data.
SCOPE has been implemented in major corporations in over 15 countries, to
become today’s function point counting tool of choice for people who are serious
about counting.
Join all the other previous FPW users and upgrade to SCOPE today.
Ask us about our discounts for previous FPW Licensed users.
Total Metrics will be pleased to assist you in building your business case to
upgrade to SCOPE.
Please contact us at:
[email protected]
Summary Gap Analysis - SCOPE 3.0 and FPW7
SCOPE'S FEATURE
SCOPE
Interface designed after Windows
XP® by Microsoft Partner to work
like MS Explorer®
YES
Selectable multilingual interface
(includes all screens, messages
and reports)
YES
Synchronisation capability allows users to count off-site and
later merge the changes they
have made into the baseline
count without overwriting changes
YES
BENEFITS OF SCOPE
Modern familiar interface
means minimal training
required to learn all SCOPE
features
SCOPE is available in 10
Languages: English - Japanese
- German - Chinese - Korean Portuguese - Dutch - Spanish Italian - French
SCOPE allows counts to be
done remotely without the
worry of overwriting changes
made by others when the count
results are merged back into the
©Copyright Total Metrics Pty Ltd 2010
158
Moving from FPW to SCOPE
SCOPE'S FEATURE
SCOPE
made in the meantime, by other
counters.
Single SCOPE database file to
simplify data storage and
transmission of counts
BENEFITS OF SCOPE
same or an updated baseline.
YES
Makes transferring data from
different storage media simple
and easy
Enables Project Managers to
quantitatively track and
interactively display the size of
project rework displaying the
history of changes online. Tracks
when a process or data group is
changed multiple times for the
same project or removed from the
project scope.
YES
Enables suppliers to easily
charge back for project scopecreep and changes to User
requirements
Imports historical count data
from other industry FP counting
software e.g. FPW
YES
Easy to upgrade from other
tools without losing historical
count data
Allows Projects to be mapped to
multiple applications so that
counts are automatically
aggregated at Project level as
well as at Application Release
level to display online interactively
YES
Allows multiple separate counts
to be applied concurrently to the
same baseline that can add,
change and delete processes and
data groups without overwriting
other counts changes.
YES
Inbuilt expert assistance in
IFPUG counting rules enhances
ability to record and report
accurate and detailed count
information
YES
Maps the structure of your
counts to the real-world
structure of your applications
development and maintenance
environment for easy reporting
and communication
Allows multiple counts to be
done for multiple change
requests that impact the same
Release of an application –
avoids separate counts
corrupting the master
baseline with counts
overwriting each other
Reduces risk of giving incorrect
sizing for decision making by
ensuring more accurate and
consistent counting
Saves time and costs of
©Copyright Total Metrics Pty Ltd 2010
159
SCOPE 3.0 Help User Manual
Version 1.0
SCOPE'S FEATURE
SCOPE
BENEFITS OF SCOPE
audits and recounts by
providing an online mentor on
counting queries
All data entry and linking can be
done on a single split screen
without trekking through layers of
stacked windows
Field lengths are virtually
unrestricted to allow actual
specification names to be used in
documenting the count and
display without truncation
Data groups can be
hierarchically structured to
individually document names of
RETs and DETs which can be
linked to Elementary Processes
Allows easy hierarchical
cataloguing of Notes and
Attributes with long field length
or no field length restriction for
complete count documentation
Full Audit capability of all
changes to counts
YES
YES
Saves significant time
(therefore dollar costs) for a
counter to record count results.
Also assists in reviewing counts
as all information is available on
a single split screen and names
are fully readable
YES
YES
YES
Saves significant time
(therefore dollar costs) for an
auditor to review a count and for
another counter to maintain a
count since count decisions are
easy to record, view and
maintain
Tracks Author and date when
all count details were
modified including comments.
Fully searchable so you know
what changed and when and
who made the change.
©Copyright Total Metrics Pty Ltd 2010
160
Moving from FPW to SCOPE
Detailed Comparison SCOPE 3.0 and FPW7
1 SCOPE maintains the Integrity of the Count Repository
SCOPE’s unique configuration control capability enables it to manage the
individual functional sizing of concurrent Change Request Projects (Enhancement
Counts) ensuring other counts are not overwritten when updating the master
Application counts (Production Releases). This feature enables a project
manager to ‘size’ multiple change requests on the work in progress release and
track the impact of each individual CR’s count on the overall release baseline. The
aggregated collection of counts can then be automatically combined to update the
Production Baseline Release. This reflects ‘real life’ where many different
business initiatives make changes to an Application within the same time frame.
SCOPE also allows flexibility with how and when you apply your counts to the
baseline e.g.:
• ‘Cancelled Projects’ - If a change request is already counted on the
baseline but the project was not approved then the cancelled Count Session
can be deleted in a key stroke. All impacts from the count session are
removed and the integrity of the Release is retained. All other counts
recorded on the same baseline will not be affected, even if they made
changes to the same elementary processes or data groups.
• ‘Postponed Projects’ - If a change request needs to be counted but will
not be implemented in the current Release, then it can be counted on the
current Release baseline and selectively ‘held over’ and not incorporated
into to the Production baseline when it is updated. However, it is
automatically retained in the baseline count used for counting and kept up to
date until a decision is made to re-instate it or get rid of it. This saves having
to recount at a later date and the count in the meantime has been
©Copyright Total Metrics Pty Ltd 2010
161
SCOPE 3.0 Help User Manual
Version 1.0
maintained such that it will reflect the ‘latest’ complexity status and the links
between processes or data groups in its scope.
• ‘Conversion Projects’ If a change request is not to be recorded in the
Production count. This would occur for changes to the functionality required
to be recorded at Project level but not to be implemented into the production
version of an application (e.g. conversion functionality). The size of the CR
can be retained in the Release project count and automatically ‘not applied’
to the Production baseline count. This saves having to selectively ‘trim’ your
count prior to update.
Automatic Synchronization of the Baseline - The ‘impacts’ from a Change
Request can also be imported and exported from a baseline. The need for this
would occur when someone had updated the baseline on a copy of the database,
but in the meantime the original baseline had been revised. The counter can then
synchronize their ‘count’ with the latest revised version of the Baseline by
selecting to ‘import’ a count. SCOPE applies its intelligence to apply the impacts
of the count on the revised baseline. I.e. if a process in the count is deleted it will
find the process on the revised baseline count and mark it as deleted. If the
process has been changed then it will be updated and marked as ‘changed’. If a
new process is added then SCOPE will find the correct parent in the revised
baseline count and insert the process under its correct parent.
If you have multiple counters counting on the same baseline at the same time,
they can do their counts on their own version of the database, then export them
and import them into a master SCOPE database and SCOPE will manage them so
the integrity of the master version is maintained.
©Copyright Total Metrics Pty Ltd 2010
162
Moving from FPW to SCOPE
2 SCOPE maintains the Security and Confidentiality of the Data
SCOPE’s unique capability to synchronise and extract counts allows the Metrics
Manager to select to ‘Snapshot’ the Release Model to a separate database
enabling counts to be:
• Validated before they are merged into the current baseline so as to avoid
corrupting the master data repository
• Private – counts are only provided to other counters on a ‘needs to know’
basis. I.e. it allows the repository manager to keep the project size data of
other business areas private and only accessible to the Repository Manager
in the master database
• Secure - Commercially sensitive projects can be counted ‘offline’ and only
if and when they are approved for public knowledge, then they can be
merged back into the current baseline
3 SCOPE reduces risk of database corruption
SCOPE databases are easily identified and saved as a single *.FPA file that is
Microsoft ACCESS® compatible. Users can use Microsoft ACCESS® to
customise and create their own SCOPE reports.
4 SCOPE provides the evidence for Project Managers to charge for
Rework
SCOPE enables multiple counts to be performed on the same functional model
throughout the development lifecycle. Projects often impact the same functions
multiple times in project lifecycle. I.e. new functions or data groups may be added
by the project then changed several times or even deleted at the users’ request.
©Copyright Total Metrics Pty Ltd 2010
163
SCOPE 3.0 Help User Manual
Version 1.0
SCOPE has the unique capability to track this rework. It is able to report
cumulative size of the rework in addition to the net functionality delivered (the net
result of the delivered software). SCOPE also records the counters name, date
and time of the creation and modification of all the count processes and data
groups and allows changes to be searched on name, or date of change.
5 SCOPE makes it easy to upgrade from other tools
SCOPE can be downloaded from the Total Metrics WWW site and installed in
minutes. You can import your historical count data into the SCOPE structure from:
• EXCEL spreadsheets
• Function Point WORKBENCHTM (all count details [transactions, data
groups, links, notes and labels] as well as project and application details) imports ALL versions of FPW
6 SCOPE can be used by Novices
SCOPE has a modern Windows 7 standard intuitive interface which optimises the
use of Windows ‘shortcuts’ and function keys. All the key components of a count
(Processes, Data, Notes and Attributes) have been modelled to behave identically
so that once the User learns to maintain, link and report one component (which is
similar to the way MS Explorer® works), they can effectively use all SCOPE
functionality.
SCOPE Viewer™ has proven that Users who have no function point knowledge or
FP tool experience can effectively review counts and run reports in SCOPE.
7 SCOPE is more cost effective when recording counts
SCOPE was designed by function point counters for function point counters, to
make counting fast, effective, auditable and well documented. The key
©Copyright Total Metrics Pty Ltd 2010
164
Moving from FPW to SCOPE
component to this objective was to have all features in SCOPE performed on the
single main screen avoiding the time wasting tasks of navigating through
overlapping multiple windows.
SCOPE displays all four count components (Processes, Data, Notes and
Attributes) as Hierarchy trees such that the majority of any tree’s nodes are
visible AND readable on a single screen, thus avoiding time wasted in scrolling
vertically and horizontally to understand a functional breakdown.
The split screen display allows linking of all count components to be completed
with a single mouse click without changing windows.
Data, Notes and Attributes can all be hierarchically modelled and catalogued into
folders to facilitate locating them and understanding their relationships when
linking to a Logical Data Group or Note to a Process. All branches within any tree
can be automatically sorted in a sequence of the user’s choice.
SCOPE has an MS Windows standard ‘search and replace’ function enabling quick
up and down searches to find any text in the name or description of any count
component (Process, Data, Note or Attribute)
SCOPE allows the counter freedom to use meaningful names and descriptions that
best describes any of the count components and always displays the full name
without truncation.
SCOPE provides further flexibility for ease of searching and linking by allowing the
user to flip the dominant components from the left hand or right hand tree. I.e.
unlike FPW it is not driven from a fixed single directional left to right ‘transaction
tree' view. You can put the focus of the main window on any one of the Process,
Data, Notes or Attribute Trees and then drive the count and the links from that
view for ease of linking, filtering and reporting.
©Copyright Total Metrics Pty Ltd 2010
165
SCOPE 3.0 Help User Manual
Version 1.0
8 SCOPE is more cost effective when Maintaining and Auditing Counts
SCOPE was designed with the concept of making it quick and easy to maintain
counts of each new change request and making it easy to document and report
count decisions to assist in auditing.
SCOPE does this by providing the capability to:
o Provide an audit trail of who changed which tree node when that if fully
searchable
o Quickly record project changes (new functions, changed functions and
deleted functions) with a single mouse click on pre-existing counts
o Detailed Count Reports that list exactly how a process was counted, not
just its type and complexity (i.e. Ranges selected, numbers entered by the
user or just defaulted)
o Detailed Documentation in Reports that list for each process which
Data Groups, RETs and DETs it accesses and the type of access. (SCOPE
will actually automatically derive process and data group complexity from
these links to significantly reduce counting time and increase accuracy)
o Hierarchal modelling of Data, Notes and Attributes in addition to
Functions and Elementary processes
•
Data - SCOPE enables you to group your related data into
Folders, then within a folder sort them in any order you choose
and decompose them and name them at Data Group (ICF/EIF),
RET and DET level and to link Processes, Notes or Attributes at
any level. SCOPE models the Data hierarchically into its RETs
and DETs. Processes can be optionally linked to DETs, RETs
and Logical Data Groups for greater accuracy of recording and
easy auditing
•
Notes – SCOPE allows any comments or Notes to be grouped
into SETS which can in turn be decomposed in a similar way to
a Table of Contents. Notes can be of any length and arranged
©Copyright Total Metrics Pty Ltd 2010
166
Moving from FPW to SCOPE
and re-arranged and sorted in any order. For importing your
specification just copy the list and import directly from an
EXCEL spreadsheet
•
Attributes – SCOPE also models Attributes (key words / labels)
into Categories as hierarchical trees. Attributes are not mutually
exclusive i.e. Processes can be assigned more than one
Attribute within a Category. Data can also be linked to
Attributes.
o One step (one mouse click) linking of any Process, Data Group, Note or
Attribute (label) without swapping windows.
9 SCOPE facilitates more Accurate and Consistent Counting
SCOPE has an inbuilt expert system (FP Decision Maker™), designed by authors
and reviewers of the IFPUG Counting Practices Manual, that steps counters
through the IFPUG CPM decision logic when trying to determine the type or
complexity of a function. This ensures that counters are reminded of the IFPUG
guidelines and make count decisions via a consistent and auditable process.
SCOPE has a fully indexed ROBOHELP Help system for all functionality. This help
accesses the Total Metrics www site to give the user the very latest HELP for all
functionality and embedded Flash Tutorials on most counting activities. Both
HELP and the Tutorials are updated every SCOPE Release and because it is
online is updated dynamically whenever we identify another area where it can
provide assistance.
SCOPE allows individual users to customise SCOPE to operate with their own user
counting and display options and defaults. This flexibility in customisation includes
being able to dynamically switch between 10 languages (e.g. French, Italian,
©Copyright Total Metrics Pty Ltd 2010
167
SCOPE 3.0 Help User Manual
Version 1.0
German, Japanese, Portuguese, Dutch, Chinese etc) which dynamically changes
the language in which the screens and messages will display.
10 SCOPE counts are more understandable by the Business Users
SCOPE ‘s way of recording functional size takes into account the way we develop
software today i.e. It recognises the way it structures its Applications, Release,
Projects and Counts such that :
• A users business initiative (Project) may have many change requests that
impact one or many different software applications and sometimes have
more than one CR that impacts a single Release of one of the applications
• Software tends to be developed on a Release based approach rather than
an approach where each Change Request resulting in a new production
version of the software
• Each Release may have one or more Change Requests belonging to either
same or different projects. These Change Requests need to be individually
sized since they contribute to different projects and are often run by different
teams and approved independently
SCOPE enables a Project to record multiple Impacts across multiple Applications
and aggregate Function Point size, at Change Request, Application Level,
Release Level and at Project Level.
SCOPE can record multiple Impacts from multiple projects on an Application
concurrently and be able to maintain and report the different Project Impacts
independently.
SCOPE’s flexibility allows it to respond to changing project implementation
decisions by being able to record the Project Impact on an Application AND be
©Copyright Total Metrics Pty Ltd 2010
168
Moving from FPW to SCOPE
able to decide to not apply it, or to remove it or to hold it over to be applied again
at a later date when the project is approved or restarted.
11 SCOPE makes Count Results freely accessible
SCOPE has advanced cross-referencing and reporting functionality to enable you
to easily do online ‘what-if’ analysis and produce up to 40 different reports
instantly.
SCOPE central repository of counts is able to be accessed concurrently by multiple
SCOPE users. Previewed reports, if accepted, can be printed or saved to a file or
emailed.
SCOPE allows you to select to export the report to MSWORD or MSEXCEL or
HTML, print or preview.
SCOPE reports, Baseline Size, Reworked Size and Current Count Size
dynamically at the bottom of the screen as you move through the functional
model.
Full Detailed Management Reports are generated online within seconds in print
preview mode. The Count Detail Reports actually report the level of detail that a
process or data group was counted. E.g. displays the ranges, or actual number of
RETs or DETS. This is useful for auditing count results.
SCOPE allows you to extract your count using the SnapShot option to send the full
count details to a client. The client can then download SCOPE Viewer ™ free
from the Total Metrics WWW site and install it so they can investigate all aspects
of the count, print all reports or provide comments and send it back in softcopy to
the counter.
©Copyright Total Metrics Pty Ltd 2010
169
SCOPE 3.0 Help User Manual
Version 1.0
Download your evaluation copy of SCOPE today and
start counting and see the differences for yourself!
Moving from FPW to SCOPE - Types of Counts
The following Commands in FPW are mapped to the similar commands in
SCOPE.
Application Baseline / Project Function Point Counts
©Copyright Total Metrics Pty Ltd 2010
170
Moving from FPW to SCOPE
FUNCTION
Production
Application
Baseline
Count
Development
Project Count
Enhancement
Project Count
Function Point
TM
WORKBENCH
File > Browse for
Counts and select
count (Double-click) or
Open in the Count List.
Type is App for
Application
File > Browse for
Counts and select
count (Double-click) or
Open from the Count
List. Type is Dev for
Development Project.
File > Browse for
Counts and select
count (Double-click) or
Open from the Count
List. Type is Enh for
Enhancement Project.
SCOPE Project
TM
Sizing Software
File - Project and
Applications ListExplode tree - Select
Application,
Production Release
(Open, Release with
Gold Padlock)
File - Project and
Applications ListExplode tree - Select
Application- Work in
Progress Release
(Open Green
Padlock), Open the
Count Session
See above. Highlight
a Count Session and
select Open. Link
the count session to
the Enhancement
Project in the Project
List Screen
COMMENTS SCOPE Features
SCOPE highlights the latest
Production Release with a Gold
Padlock ICON. If that count is the
latest i.e. There are no current
Count Sessions then it has an
Opened padlock Icon.
SCOPE highlights the latest release
being counted for a project with an
open green padlock. Counts
measured at different stages of the
life cycle are recorded as Count
Sessions but are individually
tracked on the same Release model
to retain configuration control.
Record Project Details for each
Count Session in the Project List
If your make changes to the
Release when a Count Session is
open then all changes for the
Enhancement Project can be
tracked by assigning an impact type
to the elementary processes and
data groups (impact type = add,
change, delete) . This is similar to
using Tracking in Microsoft WORD.
Record Project Details in the Project
List.
SCOPE allows you to record
multiple counts for a Project across
many different Applications or within
the same application and aggregate
the counts to a Project Total
©Copyright Total Metrics Pty Ltd 2010
171
SCOPE 3.0 Help User Manual
Version 1.0
FUNCTION
Recording
Rework during
a Project
Updating the
Baseline
Application
count
Function Point
TM
WORKBENCH
Not available to record
rework (a/c/d) on the
same process in the
same Release count.
A work around is to
use Labels
File > Maintain
Application Baseline or
use File > Browse for
Counts, select count
and press [Maintain
Application Baseline]
SCOPE Project
TM
Sizing Software
Use a Count
Session to record
your new changes.
Impacts across the
life cycle can be
tracked cumulatively
File Project and
Applications List
Select a work in
progress Release
with the Open
Padlock (has update
rights), select
Update to Baseline.
COMMENTS SCOPE Features
Report the total functionality
impacted using the Release Rework
Functional Size Report Option
The Baseline Application Count is
protected from being mistakenly
updated by an earlier count that
overwrites later changes. You are
given the option to' hold over' a
count if it is not to be applied to this
baseline or to exclude a count in
which case it is not used to update
the baseline (useful for conversion
counts).
Moving from FPW to SCOPE - File Complexity
The following Commands in FPW are mapped to the similar commands in
SCOPE.
Assessing Complexity of Logical Data Groups
©Copyright Total Metrics Pty Ltd 2010
172
Moving from FPW to SCOPE
FUNCTION
Function Point
TM
WORKBENCH
SCOPE
Project
Sizing
TM
Software
COMMENTS - SCOPE Features
SCOPE Default is Low - Type undefined
Using Ranges of
RETS and DETs
Complexity Rating
Method - Rapid
Result
SourceRange
Input numbers
of DETs and
RETs
Complexity Rating
Method - Record
DETs/FTRs ; can be
derived from the
numbers entered
Result
Source Enter Value
Derive from
names of DETs
and RETs listed
for Data Group
Not Available
Result
Source Derived
SCOPE automatically derives BOTH the number of
RETs and the DETs recorded for the Data Group
in the Data Tree structure. This provides the
most accurate counting capability of any tool
currently on the market. Ensures traceability and
auditability of your counts. Note: DETs and RETs
can be imported from any list recorded in a column
in a spreadsheet using the EXCEL Import option
Only available using
range selections
Result
SourceAssessment
SCOPE allows you just to select low average or
high, default is LOW
Guess Low/
Average/High
©Copyright Total Metrics Pty Ltd 2010
173
SCOPE 3.0 Help User Manual
Version 1.0
Moving from FPW to SCOPE - Transaction Complexity
The following Commands in Function Point WorkbenchTM are mapped to the
similar commands in SCOPE.
Assess Complexity of Elementary Processes
©Copyright Total Metrics Pty Ltd 2010
174
Moving from FPW to SCOPE
FUNCTION
Function Point
TM
WORKBENCH
SCOPE Project
TM
Sizing Software
COMMENTS - SCOPE Features
SCOPE Default is Average Input
Using
Ranges of
DETs and
FTRs
Complexity Rating
Method - Rapid
Result Source Range
Input values
of FTRs and
RETs
Complexity Rating
Method - Record
DETs/FTRs
Result Source - Enter
Value, Range
Derive from
number of
DETs and
FTRs linked
to the
process
Not available
Result Source Derive - Complexity
and type
automatically derived
from RETs and DETs
linked and access
type
SCOPE automatically derives
BOTH the number of FTRs and
the DETs from the links. This
provides the most accurate
counting capability of any tool
currently on the market. Ensures
traceability and auditability of your
counts.
Guess Low
/Average
/High
Only available
using range
selections
Result Source Assessment and
select Low/Ave/High
SCOPE - select low, average or
high
©Copyright Total Metrics Pty Ltd 2010
175
SCOPE 3.0 Help User Manual
Version 1.0
Moving from FPW to SCOPE - Adding Transactions and Data
The following Commands in FPW are mapped to the similar commands in
SCOPE.
Record Processes and Data Groups on Functional Model
©Copyright Total Metrics Pty Ltd 2010
176
Moving from FPW to SCOPE
FUNCTION
Modify Data
Group
Details
Create a
new Data
Group
SCOPE Project
TM
Sizing Software
COMMENTS - SCOPE Features
Double click Data
Group. Or Select
Detail TAB opposite
window to Data Tree
SCOPE displays all Data details
on the same screen, dynamically
as you move around the data
tree
Select Data Tree
TAB ( ALT/INS) for
Data Group or set up
Folders for Related
Data Groups (Right
Click and select to
Insert a Data Group
Folder)
SCOPE allows you to create Data
Groups on the same screen as
you view your hierarchy. If you
need add a new file press
ALT/INS. Data can be modelled
for easy sorting, searching and
grouped from a User
perspective. Related Data
Groups can be catalogued and
stored under a Data Folder for
ease of use.
Not available
ALT/INS/Shift,
SCOPE allows you to record
details of the RETs and link them
to Processes that Read or
Update them
Not available
INS
Function Point
TM
WORKBENCH
File > Count Files or
directly using Count
File List from the
context menu in
Transaction Hierarchy
workspace. Modify File
Details directly in this
list or Open File Details
dialog.
Tables > System
Tables > System Files
and [Add]
There is no way to
model, 'group'
Data Groups in FPW
Create a
RET for a
Data Group
Create a
DET for a
SCOPE allows you to record
details of the DETs and link
©Copyright Total Metrics Pty Ltd 2010
177
SCOPE 3.0 Help User Manual
Version 1.0
FUNCTION
Function Point
TM
WORKBENCH
SCOPE Project
TM
Sizing Software
Data Group
Insert a
higher level
Function
Node
Insert an
Elementary
Process
View
Process
Details
COMMENTS - SCOPE Features
them to Processes that Read or
Update them
INS /OK Component
Select Function Tree
TAB - ALT/INS
INS- Transaction - OK
INS
Highlight for Flyover or
Double Click Mouse
Select Detail TAB on
the opposite window
to the Function Tree
SCOPE uses all the Windows
standard commands for copying,
moving , shifting nodes.
SCOPE uses Windows Explorer
format and by not having boxes
around functions and processes
it allows over 40 to be displayed
in a single screen.
SCOPE displays all Process
details on the same screen, as
you move around the tree. You
can view all its links, Data, Notes
and Attributes, how it was
counted, defaults used and the
Change Request (Count
Sessions) that impacted it.
Moving from FPW to SCOPE - Enhancement Counts
The following Commands in FPW are mapped to the similar commands in
SCOPE.
Enhancement Counts - Recording and Reporting
©Copyright Total Metrics Pty Ltd 2010
178
Moving from FPW to SCOPE
FUNCTION
Identify which
Processes or
data groups are
impacted by a
change request
to the software
Function Point
TM
WORKBENCH
SCOPE Project Sizing COMMENTS - SCOPE
TM
Software
Features
Create an
Enhancement Project
Count - the command
to set the value of the
Enhancement Type
depends on whether a
Transaction or File is
selected
Highlight Work in
SCOPE records work in a Count
Progress Release Session by awarding an impact
open Count Session - type to the new, changed or
To assign change type deleted Processes or data
select Enhancement
groups. In the Details screen,
Type (see above status view cumulative session
bar) The Icon next to
impacts recorded in multiple
the Data Groups and sessions across the Release
Processes, immediately Project Cycle. The size of the
change colour
current Enhancement Count
Session is automatically
Green = add,
displayed above the status bar
in FP Size and Count Session
Orange = change
Impacted
Grey = Delete
Black = No Impact
Reporting a
Function Summary with Reports -Count
selected Function Files
Session Impacted
Point Counting
Functional Size
Session
SCOPE allows you to report the
impact recorded just for this
selected count session for the
Release.
OR view result online
at the just above the
status bar
All reports are viewable online
OR view result online in or a summary value is
dynamically calculated on the
Project and
screen and in the Project and
Applications List
Applications List. All reports
can be exported to MS WORD,
MS EXCEL or HTML
Reporting All
Function Point
Counting
Sessions for a
Not available
Reports - Release
Impacted Functional
Size
SCOPE Reports the impacted
functions for all count sessions
for this release
©Copyright Total Metrics Pty Ltd 2010
179
SCOPE 3.0 Help User Manual
Version 1.0
FUNCTION
Function Point
TM
WORKBENCH
Release
SCOPE Project Sizing COMMENTS - SCOPE
TM
Software
Features
OR view result online
at the just above the
status bar
OR view result online in
Project and
Applications List
Reporting the Net Only available in printed Reports - Release
Result of the
or published reports
Baseline Functional
Enhancement
Size
Counts
Reports the net effect of the
Adds and Changes, removes
the Deleted functions
OR view interactively
online (Release
Baseline) as you make
changes (see above)
Moving from FPW to SCOPE - Profiling Results using Labels
The following Commands in FPW are mapped to the similar commands in
SCOPE.
Profiling the Functionality for Analysis and Reporting using Labels
©Copyright Total Metrics Pty Ltd 2010
180
Moving from FPW to SCOPE
FUNCTION
Function Point
TM
WORKBENCH
SCOPE Project
TM
Sizing Software
(Create Categories
of Attributes)
(Create Labels) Select
Create Labels
Tables - Global Tables Global List - System
Use, Add
Linking Labels
View
Combinations of
Labelled
Processes
Select Link Labels whilst
in a Transaction. Only
links to Transactions
and links to related
Label Options are not
allowed.
View Options, Search
and Highlight, Complex
Labels etc.
Select - Attribute
Tree TAB ALT/INS to create
CATEGORY.
Highlight Category
- INS and Attribute
Select Link Mode
and view Attribute
tree. Link to Data or
Processes or
Notes.
Select Filter Mode
Icon, Highlight the
attribute and click
the Boolean Icons
(And/Or/Not) on
Main Menu
COMMENTS - SCOPE
Features
SCOPE has Categories
instead of Labels and
Attributes instead of Label
Options. SCOPE allows you
to Label Data as well as
processes.
SCOPEs attributes are nonexclusive so it allows you to
link more than one option of
an attribute to a single
process.
SCOPE allows you to create
new Categories and
Attributes whilst still viewing
the Process, Data or Notes
Tree. You can link related
Attributes to the same
Process or Data Node. They
are not mutually exclusive.
SCOPE allows you to view the
flagged result of your filter
selection immediately on the
screen. Allows you to save
the question selection criteria
(Filter) or the results (Flags)
©Copyright Total Metrics Pty Ltd 2010
181
SCOPE 3.0 Help User Manual
Version 1.0
FUNCTION
Save a selection
Filter
Load a selection
filter
Save the results
of your
selection Filter
Cumulatively
Load the results
of many
selections
Function Point
TM
WORKBENCH
Save / Load Complex
Label
Load Complex Label
-
Load Complex Label,
Add to Complex Label
SCOPE Project
TM
Sizing Software
Filter Set Icon,
Save
Filter Set Icon,
Apply
Highlight the root
node for the
Flagged Tree, Flag
Set Icon, Save
COMMENTS - SCOPE
Features
SCOPE allows you to use a
selection filter for any of the
Trees (Process, Data , Notes
and Attributes) and save this
filter. It is not restricted to just
the Attributes Tree
If you want to see the
cumulative result of
selecting, using a Data
Group plus selected Notes,
plus selected Attributes, then
save each Flag Set result
and then apply them
cumulatively
SCOPE allows you to save
the results of a selection, and
then re-apply them
cumulatively.
Flag Set Icon,
Apply Flags
Cumulatively, Apply
©Copyright Total Metrics Pty Ltd 2010
182
Moving from FPW to SCOPE
Key Advances of SCOPE over FPW
Advanced Ease of Use and Time Saving Data Entry
Counting an Elementary Process Tutorial
(If the video does not fit on the screen
please adjust the resolution to the highest settings)
Counting a Logical File Tutorial
(If the video does not fit on the screen please
adjust the resolution to the highest settings)
All features in SCOPE are performed and displayed on the single main screen avoiding
the time consuming tasks of navigating through overlapping multiple windows. All
features and short-cuts are typical of those set by Microsoft Windows products.
The Explorer like Trees in SCOPE enable you to intuitively view a significant proportion
of the functionality of your software application in a single screen.
See also how to insert multiple transactions for a data group with a just a mouse click Template Function Groups
Advanced Configuration Control
Setting up Multiple Counts on the Same Release Tutorial
(If the video does not fit
on the screen please adjust the resolution to the highest settings)
Import Multiple Count Sessions from other databases or Releases into a Master Release Count
(If the video does not fit on the screen please adjust the resolution to the
Tutorial
highest settings)
SCOPE’s unique configuration capability enables it to manage concurrent Enhancement
counts ensuring other counts are not overwritten when updating the master Application
counts (Production Releases). This feature enables a project manager to ‘scope’
©Copyright Total Metrics Pty Ltd 2010
183
SCOPE 3.0 Help User Manual
Version 1.0
multiple change requests on the work in progress release and track the impact of
each individual count on the overall release.
SCOPE’s allows a user to record multiple function point counts for the same Release of
an application and to selectively report and edit them. If the count is no longer required
then it can be deleted (select Delete Count Session from the Software Applications
List when located on the count). Once the Count Session is deleted, the Release
Baseline will be left as it was before the count was recorded. When you select to delete
a count you will be prompted to select if you want to Delete Added and/or Delete
Deleted processes and data groups that were impacted for the count.
If you select the box to delete the Added processes and data groups SCOPE will delete
all the nodes that were added new as part of the count. You can use this feature to 'fix
up' a baseline. ie. Create a count called 'Fix up Baseline' then add in the processes and
data groups that you believe should have been included. Have your new nodes
checked then delete the Count Session but un-select to Delete Added, these nodes will
remain in your Baseline but not be recorded as part of the Release.
If you select to delete the Deleted processes and data groups then SCOPE will remove
all nodes marked as deleted. This is a useful way to 'clean up a hierarchy'. ie. create a
Count Session called 'Clean up' then mark all processes and data groups that need to
be removed to make the count correct. Have someone validate your decision, then
select to delete the Count Session called "Clean up". All the nodes marked as deleted
will be removed from the hierarchy.
See also Import / Export Count Sessions
©Copyright Total Metrics Pty Ltd 2010
184
Moving from FPW to SCOPE
Merging Count Sessions into a Release
SCOPE will allow you to export a selected Count Session to be imported later into
another Release within either the same SCOPE database file or a different one. This is
essentially a 'merge' option where SCOPE merges the imported Count Session into the
Release, so the Release now reflects the latest impacts and the imported Count
Session becomes one of the Counts for the Release. See Import / Export Count
Sessions
Tracks Rework for Enhancement and Development Projects
Setting up Multiple Counts on the Same Release Tutorial
(If the video does not fit
on the screen please adjust the resolution to the highest settings)
SCOPE also enables multiple counts to be performed on the same functional model
throughout the development lifecycle. As a new function is added, and subsequently
changed several times at different stages of the lifecycle, SCOPE tracks the rework. It is
able to report the net impact, the net result of the delivered software and the cumulative
size of the rework.
See also Types of Functional Size Reporting
Detailed Recording of Data Groups
Counting a Logical File Tutorial
(If the video does not fit on the screen please
adjust the resolution to the highest settings)
©Copyright Total Metrics Pty Ltd 2010
185
SCOPE 3.0 Help User Manual
Version 1.0
SCOPE allows you to create a detailed model of your data as well as your functional
processes.
For Data SCOPE allows you to model your data hierarchically so you can:
•
group your related Data Groups (ILFs and EIFs) into Data Group Folders
•
record the of Record Element Types (RET) for each Data Group
•
record each individual Data Element Types (DET) for each RET
This hierarchical model aids in:
•
more easily understood documentation of your count
•
faster counting when you need to quickly find a particular Data Group
•
enabling you to document any Tables in your application that have been
excluded from being counted because they are physical tables not Logical Data
Groups e.g. create a Folder called "Physical Tables" and list the Code tables
and Technical tables that are part of the application but not counted under
IFPUG 4.2 Rules. Then set the multiplier to '0' for these tables. Attach a Note to
the tables listing the reasons why they have been excluded from the count
•
enabling you to list DETs that are used by processes and cross the boundary,
but are not stored on Logical Data Groups. These DETs can be linked to the
processes that use them and used to automatically derive the size of the
Process. e.g. create a Data Group Folder called "Transient DETs", then record
the DETs that cross the boundary but are not stored on an ILF or EIF e.g.
Message DETs, Control DETs, Totals, Derived fields etc
SCOPE also allows you to derive the complexity of a process automatically using the
number of FTRs (Logical Data Groups) and DETs linked to the process, so the more
completely you are able to document your count then the more accurately it can be
sized.
Hint: If you already have a softcopy list of the names of your Data Groups, RETs and
DETs, in a data dictionary then cut and paste the list into the
©Copyright Total Metrics Pty Ltd 2010
186
Moving from FPW to SCOPE
Master_SCOPE_Excel_Import_Template spreadsheet. (located under the
directory where you installed SCOPE) Follow the instructions in the ReadMe sheet and
then import the list into your SCOPE count. See Import Existing Counts from CSV
Extended Length for Names and Descriptions
SCOPE allows you to enter up to 255 characters for all names of all your Processes,
Data Groups, Notes and Attributes etc. Description field lengths are almost unlimited.
You can enter and report a full description for all types of Tree Nodes.
Online Reporting of over 40 Different Reports
SCOPE has advanced cross-referencing and reporting functionality to enable you to
easily do online ‘what-if’ analysis and produce over 40 different reports instantly.
Previewed reports if accepted can be printed or saved to a file, sent directly from the
Preview via email as Snapshot Viewer files or saved as PDF files if you have a copy of
Adobe Distiller. Users with MSOffice 2003 or later can also save the Reports as
Images, or sent them to WORD. Users with MSAccess 2000 or later can generate
reports and export them to MS EXCEL or MS WORD.
Single Database File for Ease of Administration
SCOPE Database – single Microsoft Access® Compatible File
SCOPE databases are easily identified and saved as a single *.FPA file that is Microsoft
Access® compatible.
©Copyright Total Metrics Pty Ltd 2010
187
Background and Articles on Functional Size
Introduction to Function Point Analysis
Background
Function Point Analysis (FPA) is a technique used to size the software work product.
This work product is the output of software new development and enhancement
projects. It is the software which is migrated to the production application at project
implementation.
Function Point Analysis (FPA) has been used since the late 1970s to assess the
functionality delivered to the user based on the user’s external business view of the
functional requirements. It measures the logical view of an application as compared to
measuring the physically implemented view or the internal technical view.
FPA measures these functional requirements in terms of the:
•
Business transactions (e.g., Enquire on Fault Record) that the user can perform
using the software,
•
Business data (e.g., FAULT File) that the software can store and access.
The process of performing Function Point Analysis is called a ‘Function Point Count’
and it involves the identification, classification and weighting of each of these
transactions and data components. The weightings are combined to give the functional
size as an Unadjusted Function Point Count. Older versions of IFPUG CPM
methodology required an additional step of assessing the technical and quality features
embedded in the software product and adjusting the functional size accordingly. The
result was referred to as the Adjusted Function Point Count.
NOTE: The latest IFPUG CPM 4.3 Methodology records Functional Size WITHOUT
adjustment. SCOPE reports Functional Size results in function points as per the new
IFPUG 4.3 recommendations which are unadjusted. However if your organisation still
requires an Adjusted function point count then record the details required under the
©Copyright Total Metrics Pty Ltd 2010
189
SCOPE 3.0 Help User Manual
Version 1.0
Value Adjustment Factor, General System Characteristics and see the SCOPE
summary function point count reports for the adjusted values.
The Function Point Analysis technique is used to assess the functionality delivered by
software (often called a 'function point count’) and a ‘function point’ is the unit of
measurement for the software functional size.
Classification of Functional Components
Once all the functional components have been identified they are classified into types
depending on the type of activity they perform for the user.
Transactions can be classified into three types:
•
Inputs: enable the user to input data into the software to be stored,
•
e.g. Create Fault Record = Input
•
Outputs: enable the user to extract derived information from the software,
•
e.g. Aged Faults Report = Output
•
Enquiries: enable the user to query stored data
•
e.g. Display Fault Details = Inquiry
Data Groups can be classified into two types:
•
Internal Files store data input by the user transactions
•
•
e.g. Fault File = Internal File
External Files store data accessed by the user transactions but not maintained
by the users’ transactions
•
e.g. Account File = External File (where this file is maintained by another
system)
Identification of Functional Components
The technique of functional modelling (functional analysis/ functional decomposition) is
used to model the relationship between the transactions and the application as a whole.
©Copyright Total Metrics Pty Ltd 2010
190
Background and Articles on Functional Size
The transactions are mapped onto a functional hierarchy of the application under the
business activity to which they contribute.
The following criteria is used, where possible, to check each task to determine if it is a
unique elementary process (logical business transaction). It is counted as a unique
logical transaction when:
•
it has processing logic (editing, validation etc) different from other similar
transactions,
•
it accesses a unique combination of fields and files,
•
on completion, it leaves the business in a consistent, predictable state,
•
it is user recognisable and definable,
•
it is created by business requirements and not the technical requirements of the
chosen solution,
•
it is logically independent of other transactions (although it may in some cases be
triggered by another transaction),
•
it is logically triggered by an external event,
•
it achieves a business objective, not a technical objective.
The technique of data modelling (information engineering, entity relationship
diagramming) is used to identify the data and the relationship between the data. The
data files are then mapped to the transactions on the hierarchy which access them.
Data files are logical master groups of data from a business user perspective. They are
a group of data that tends to be created as a ‘set’ although parts of the data may be
modified independently. They may be a business reference file e.g. Currency Details
which are referenced by transactions or business entities maintained by the business
transactions.
Data Files do NOT include files created for quality, technical, performance, security,
navigation reasons. Data Files are permanent groups of data, they are not stores for
temporary data.
©Copyright Total Metrics Pty Ltd 2010
191
SCOPE 3.0 Help User Manual
Version 1.0
Weighting of Functional Components
Once the functional components have been identified and classified they are evaluated
for their functional complexity using a set of prescribed attributes. The functions are
categorised into low, average or high complexity.
Functional components are awarded Function Points according to their classification of
type and categorisation of complexity.
E.g.:
Create Fault record
=
External Input = High Complexity =
6 Function Points
Currency Conversion File
= Internal Logical File =
Low Complexity
=
7 Function Points
Once all functional components are identified, classified into type, assessed for
complexity and awarded ‘points’ these points are accumulated into a total Function
Point Count. NOTE: IFPUG 4.3 records this size as the Functional Size. Any further
adjustment is not recommended.
Previous versions of the IFPUG Methodology had a final step is to adjust this count for
quality and technical characteristics by using the value adjustment factor (range 0.65 –
1.35) for the Adjusted Function Point Count. This step is now an optional add-on for
IFPUG and not recommended.
What is Function Point Analysis (FPA)?
FPA was originally developed by Allan Albrecht in the late 1970s at IBM, and has been
further developed by the International Function Point Users Group (IFPUG).
FPA provides a set of rules to functionally size the software work product. This work
product is the output of software new development and enhancement projects for
©Copyright Total Metrics Pty Ltd 2010
192
Background and Articles on Functional Size
subsequent releases. It is the software which is migrated to the production application
at project implementation.
Function Point Analysis (FPA) is a method of Functional Size Measurement. It
assesses the functionality delivered to its users, based on the user’s external view of
the functional requirements. It measures the logical view of an application as compared
to measuring the physically implemented view or the internal technical view.
FPA measures these functional requirements in terms of the:
•
Business transactions (Processes) (e.g. Enquire on Customer Record) that the
user can perform using the software,
•
Business data (Data Groups) (e.g. Customer File) that the software can store
and access.
The activity of performing Function Point Analysis is frequently referred to as a ‘Function
Point Count’ and it involves the identification, classification and weighting of each of
these Process and Data Group components. The weighting's are combined to give the
Functional Size as an Unadjusted Function Point Count (UFP). This is the
Functional Size as defined by the ISO/IEC standard 20926, the IFPUG CPM 4.3 and
ISO/IEC 14143-1.
Before IFPUG 4.3 FPA included an additional optional step that involves assessing the
technical and quality features embedded in the software product and adjusting the
Functional Size accordingly. The result is referred to as the Adjusted Function Point
Count (AFP) or the Product Size. IFPUG no longer recommends this adjustment to
measure functional size.
The Function Point Analysis technique is used to assess the functionality delivered by
software and an ‘unadjusted function point’ (UFP) is the unit of measurement
©Copyright Total Metrics Pty Ltd 2010
193
SCOPE 3.0 Help User Manual
Version 1.0
Once you have a Function Point count, you can use the resultant measure of the
software product, either on its own or combine it with other measures to develop the
following project performance indicators:
•
The scope of the software development product (e.g. software units to be
delivered or worked on).
•
Quality indicators (e.g. the number of defects per software unit).
•
Productivity (e.g. the cost per software unit).
•
Performance (e.g. staff resources per software unit).
SCOPE facilitates a better understanding of a software application by displaying each
functional area to be sized in a hierarchical tree display, thus providing an easy to
interpret map of the application itself.
What is Functional Size Measurement?
Functional Size Measurement (FSM) is a technique for measuring software in terms of
the functionality it delivers. The ISO/IEC standard for Functional Size Measurement
14143-1:2006 defines FSM as a means of quantifying the Functional User
Requirements i.e. functions that the user has required to be delivered. (For more
information on the IFPUG Method for counting function points see - Introduction to
Function Point Analysis.)
Functional Size can be used for many purposes (See - Uses & Benefits of Sizing)
however; it is primarily used at the planning stage for input into project resource
estimation calculations for cost, effort and schedule. At the completion of a project it is
used to compare performance in terms of the cost effectiveness and efficiency of the
development and support teams.
FSM measures the functional requirements of the software. This means that it can be
applied before development commences, rather than retrospectively as is the case with
other forms of software measurement, such as counting lines of code and/or other
physical objects. This capability to measure early enables accurate estimates to be
©Copyright Total Metrics Pty Ltd 2010
194
Background and Articles on Functional Size
made, risks to be evaluated, and project scope to be negotiated, before final
commitments are made.
FSM also enables comparison of applications and projects based on their size.
Productivity rates for applications of a similar attribute profile can be compared for
benchmarking support ratios and improvement purposes. Productivity rates from past
projects can also be used to predict effort, once a project’s Functional Size has been
determined.
SCOPE supports the rules of the Functional Size Measurement method, ISO/IEC
20926:2008 standard IFPUG Unadjusted and the IFPUG Function Point Analysis
Method CPM 4.3. This technique is often referred to as IFPUG Function Point Analysis
or “FPA”.
Function Point Counting Expert System
FP Decision Maker™ is a free online tool within SCOPE that helps you answer your
function point counting problems by prompting you with the IFPUG Rules and asking
you to confirm if it is applicable to the current case. This tool was developed by Pam
Morris who was an IFPUG CPC member for 7 years and co-author and reviewer of
IFPUG 4.0 to 4.3.
We recommend that you use the FP Decision Maker™ any time that you are unsure
how to count a process or data group or if it should be counted or not.
For the www link to FP Decision Maker™ see http://www.totalmetrics.com/functionpoints/Scope-Counting-59.swf
©Copyright Total Metrics Pty Ltd 2010
195
SCOPE 3.0 Help User Manual
Version 1.0
Levels of Function Point Counting
Introduction
A function point count can be conducted at a number of ‘levels’, each of which provides
a count which has its:
•
Decisions documented to different levels of detail
•
Results within different bounds of accuracy.
The level of detail for a particular count will depend on the purpose for which the count
will be used. Different purposes will require different degrees of accuracy and detail in
the documentation and consequently different counting rates. The most optimal level
of counting may not always be able to be achieved in a particular situation since the
level actually selected may be constrained by:
•
the quality of project or application documentation available,
•
the time in which the count must be completed,
This document defines a number of levels of function point counting that are available
from Total Metrics. We will normally recommend a particular level to you based on how
the results will be used and your description of the quality of the information available to
provide background on the count. However the final decision will rest with the client and
the quality of the information available.
A particular application count may be conducted at one of the following levels detail:
Level Name
1. Detailed Linked and Flagged Count
2. Detailed Linked Count
3. Detailed Count
4. Default Complexity Count
5. Rough Count
6. Size Approximation
©Copyright Total Metrics Pty Ltd 2010
196
Background and Articles on Functional Size
Level 1: Detailed Linked and Flagged Count
Level 1 Count Description
A Detailed Linked and Flagged Count includes the following:
•
application boundary is defined
•
full functional decomposition to transaction level (transaction level is considered
the lowest level function available to the business user)
•
all files and transactions within scope are uniquely identified
•
all files and transactions are classified according to type
•
all files and transactions are accurately categorised according to complexity
(actual numbers of DETs and FTRs are identified where possible and provided
the necessary source information is available)
•
all related files and transactions are linked (aids in assessing impact of change
requests)
•
explanatory notes are attached to files and transactions as necessary (aids in
future maintenance of the counts)
•
where possible a cross-reference between the physical files and the logical files
is documented
•
explanatory notes also link files and transactions to relevant documentation
•
all agreed attributes are attached to relevant transactions (aids in selective count
reporting for management purposes)
•
count is recorded and reported using the SCOPE Project Sizing Software™
software repository tool
Level 1 Count Attributes
Detailed Linked and Flagged Count are:
•
very detailed
•
easily auditable
•
accurate (within the limits of the FPA technique +/- 10%)
•
very well documented
•
easily maintained
©Copyright Total Metrics Pty Ltd 2010
197
SCOPE 3.0 Help User Manual
Version 1.0
Best suited for following count purposes:
•
benchmarking projects (new development and enhancement)
•
detailed estimates
•
project tracking
•
as detailed baseline model for future detailed enhancement project counting
•
input into Metrics reporting for Strategic and Tactical Level reporting
Issues:
•
very time intensive – counting rates up to 200 fps per day
•
requires very skilled counters
•
rarely cost effective for large, legacy application baseline counts
Pre-requisites:
•
good to high quality system documentation
•
data model
•
full access to system experts
SCOPE and Level 1 Counts
Use the Enter Values Option and enter the number of DETs and FTR and RETs when
determining the complexity of Processes and Data Groups in SCOPE and link Processes
and Data Groups. More accurate Level 1 counting can be done by actually listing all the
DETs used by a process on the data tree and linking to them. The complexity of the
Data Group can be derived from these values.
Level 2: Detailed Linked Count
Level 2 Detailed Linked Count Description
A detailed linked count includes the following:
•
application boundary is defined
•
full functional decomposition to transaction level
•
all files and transactions within scope are uniquely identified
•
all files and transactions are classified according to type
©Copyright Total Metrics Pty Ltd 2010
198
Background and Articles on Functional Size
•
all files and transactions are accurately categorised according to complexity
(DETs and FTRs are identified within IFPUG ranges where possible)
•
all related files and transactions are linked (aids in assessing impact of change
requests)
•
explanatory notes are attached to files and transactions where necessary
•
count is recorded and reported using the SCOPE Project Sizing Software™
software repository tool
Level 2 Count Attributes
Detailed Linked Counts are:
•
very detailed
•
easily auditable
•
accurate (within the limits of the FPA technique +/- 10%)
•
very well documented
•
easily maintained
Best suited for the following count purposes:
•
benchmarking projects (new development and enhancement)
•
detailed estimates
•
project tracking
•
as detailed baseline model for future detailed enhancement project counting
Issues:
•
time intensive – counting rates up to 250 fps per day
•
rarely cost effective for large, legacy application baseline counts
Pre-requisites:
•
good to high quality system documentation
•
data model
•
full access to system experts
©Copyright Total Metrics Pty Ltd 2010
199
SCOPE 3.0 Help User Manual
Version 1.0
SCOPE and Level 2 Counts
Use the Range option when selecting the complexity of Processes and Data Groups in
SCOPE and link Processes and Data Groups.
Level 3: Detailed Count
Level 3 Detailed Count Description
A detailed count includes the following:
•
application boundary is defined
•
full functional decomposition to transaction level
•
all files and transactions within scope are identified
•
all files and transactions are classified according to type
•
all files and transactions are accurately categorised according to complexity
(DETs and FTRs are identified within IFPUG ranges where possible)
•
explanatory notes are attached to files and transactions where necessary
•
count is recorded and reported using the SCOPE Project Sizing Software™
software repository tool
Level 3 Detailed Count Attributes
Detailed Counts are:
•
detailed
•
auditable
•
accurate (with limits of the FPA technique +/- 10%)
•
well documented
•
very maintainable
Best suited for following count purposes:
•
benchmarking projects (new development and enhancement)
•
detailed estimates
©Copyright Total Metrics Pty Ltd 2010
200
Background and Articles on Functional Size
•
•
baseline application counts for portfolio sizing
as detailed baseline model for future detailed enhancement project counting
SCOPE and Level 3 Counts
Use the Range option when selecting the complexity of Processes and Data Groups in
SCOPE
Level 4: Default Complexity Count
Level 4 Default Complexity Count Description
A default complexity count includes the following:
•
application boundary is defined
•
full functional decomposition to transaction level
•
all files and transactions within scope are identified
•
all files and transactions are classified according to type
•
all files are defaulted to low complexity
•
all transactions are defaulted to average complexity
•
count is recorded and reported using the SCOPE Project Sizing Software™
software repository tool
Level 4 Default Complexity Count Attributes
Default Complexity Counts are:
•
less detailed
•
auditable
•
reasonably accurate (within the limits of the FPA technique +/- 15%)
•
documented
©Copyright Total Metrics Pty Ltd 2010
201
SCOPE 3.0 Help User Manual
Version 1.0
•
maintainable
Best suited for the following count purposes:
•
portfolio baseline assessment
•
benchmarking development or support ratios
•
quality metrics
•
high level estimates
•
as a baseline model for future enhancement project counting
•
can be cost effective for large, legacy application baseline counts
Issues:
•
efficient – counting rates up to 400 fps per day
•
cost effective for large, legacy application baseline counts
Pre-requisites:
•
average system documentation
•
data model if possible
•
access to system experts
SCOPE and Level 4 Counts
Use the Industry Default option when selecting the complexity of Processes and Data
Groups in SCOPE
Level 5: Rough Count
A rough count includes the following:
•
application boundary is defined
•
functional decomposition (3-4 levels only)
•
transactions and data functions ‘tallied’ from menus, menu access paths, file
lists, screen lists, report lists, application boundary
•
diagrams, system interface documentation
•
assumptions documented in count report
•
count is recorded and reported using the SCOPE Project Sizing Software™
software repository tool
©Copyright Total Metrics Pty Ltd 2010
202
Background and Articles on Functional Size
Level 5 Rough Count Attributes
Counts are:
•
low detail
•
less accurate (+/- 20 - 25%)
•
documented (issues and assumptions)
•
‘Skeleton’ on which enhancement counts can be built
•
needs to be refined over time
Best suited for following count purposes:
•
portfolio baseline assessment
•
benchmarking support ratios
•
as a baseline model for future enhancement project counting
•
cost effective for large, legacy application baseline counts
Issues:
•
very efficient – counting rates can exceed 750 fps per day
•
cost effective for large, legacy application baseline counts which have very little
enhancement
Pre-requisites:
•
summarised system documentation
•
full-time access to system experts (for the duration of count)
SCOPE and Level 5 Counts
Level 5 counts are done in SCOPE using the Multiplier in the Process Details and Data
Group Details screen.
Level 6: Size Approximation
©Copyright Total Metrics Pty Ltd 2010
203
SCOPE 3.0 Help User Manual
Version 1.0
There are various methods of approximating the functional size without counting all files
and transactions. Such methods are often used for portfolio estimation, or as a basis
for scheduling more detailed counts. They are based on characteristics of the
application, which have been proven to have a strong correlation to size. E.g. numbers
of reports, number of 3rd normal form tables, number of support staff etc. The size is
estimated based on the answers to about 30 questions in a questionnaire.
Level 6 Size Approximation Description
A size Approximation includes the following:
•
size estimate reported in unadjusted and / or adjusted function points
•
assumptions documented in report
Level 6 Size Approximation Attributes
Size Approximation provides a result that:
•
has very little detail –size results only
•
accuracy historically has been demonstrated to be within (+/- 20%)
•
is not documented other than the completed questionnaire and a very brief
report on the result
•
is not maintainable, they are snapshot of size only. They need to be redone if
anything changes
Best suited for following count purposes:
•
portfolio baseline assessment
•
software asset valuation
•
project scoping
•
estimating count durations
•
benchmarking support ratios
•
most cost effective for large, legacy applications, which do not need their counts
maintained
©Copyright Total Metrics Pty Ltd 2010
204
Background and Articles on Functional Size
Issues:
•
very efficient – most applications can have their size estimated within half a day
•
very cost effective for large, legacy application baseline counts which have very
little enhancement
Pre-requisites:
•
accurate completion of a questionnaire (usually takes 2 hrs, but may take up to 2
days if the software is poorly documented or applications knowledge is limited)
•
access to system experts (1 – 2 hour interview)
SCOPE and Level 6 Counts
Level 6 counts are available online using FP OutlineTM (see
http://www.totalmetrics.com/function-point-software/software-size-estimation)
What is FP Outline?
Background
Many organizations have a need for quick easy software sizing and have neither the
time nor the skills to do a detailed Function Point Count.
FP Outline™ provides the expertise to quickly determine the approximate size of a
project or an application in minutes rather than the days, weeks or months consumed
using traditional IFPUG counting methods. Learn how you could use FP Outline™ to
save significant time and money in implementing functional sizing in your organization.
To gain access to FP Outline™ online see: http://www.totalmetrics.com/function-pointsoftware/software-size-estimation
©Copyright Total Metrics Pty Ltd 2010
205
SCOPE 3.0 Help User Manual
Version 1.0
When could you use quick sizing methods?
•
Early project estimation - quickly determine the project's functional size, even
before specifications are completed, then apply the productivity coefficients to
estimate effort, cost and duration.
•
Outsourcing Contract Negotiation - establish the functional size of the client
organisations software to be maintained by the supplier at due diligence stage
•
Valuing your software assets -establish the functional size of an organisation' s
software to determine its replacement cost for asset valuation and accounting
purposes
•
Budget approvals - use the functional size and projected productivity rates to
verify your estimates for management budget approvals.
•
Benchmarking -establish the functional size of an organisations projects and
applications for quick determination of product quality and development and
support efficiency and effectiveness.
•
Release Management - establish the functional size of a change request to
determine if it is possible to include in the planned release.
How does FP Outline™ work?
FP Outline™ uses a series of algorithms derived from thousands of projects and
applications counted over the last 14 years by IFPUG certified counters. The algorithms
are based on over 40 relationships derived between known project and application
attributes and the measured functional size. Many of these relationships are between
the physical aspects of the project that are easily measured, and the logical functional
size.
All you have to be able to provide is data on the 'physical measures' which in most
cases are easy to collect, and then FP Outline™ does the rest.
For example, there is a very predictive relationship between the number of pages of a
functional specification and the function point count for a project. This makes sense
when you consider the more functionality delivered by the project the more pages of
specification. Just count the pages of specification!
This is just one relationship that forms the basis for the 20 questions asked by FP
Outline™ to ‘predict’ the size of your project or application.
©Copyright Total Metrics Pty Ltd 2010
206
Background and Articles on Functional Size
FP Outline™ reports the approximate size in function points with an appraisal of the
level of confidence that FP Outline™ had in determining the answer. The accuracy of
the predicted size will depend on which questions you answer, and the accuracy to
which you answer them. Our users are amazed at its predictive ability when they
compare the size calculated by FP Outline™ the actual measured size using the IFPUG
methodology.
How accurate are the size predictions?
Total Metrics has been using the methodology underpinning FP Outline™ for over 14
years and has been able to demonstrate its accuracy, in both project (new development
and enhancement) and application baseline counts for over 2000 applications and
projects worldwide.
Client Case Study
A large Telecommunications company planning to outsource the maintenance of a set
of 45 applications needed to urgently provide the functional size of their portfolio to the
prospective supplier. Total Metrics took 6 effort days using the FP Outline™
methodology to establish the applications portfolio size at 30,710 UFPs. The predicted
size was later verified using the IFPUG methodology and consumed 122 effort days to
count. The actual measured size (25,326 ufps) was only -17.53% different to the
predicted size. FP Outline™ predictions tend to typically lie within a +/- 20% range.
©Copyright Total Metrics Pty Ltd 2010
207
SCOPE 3.0 Help User Manual
Version 1.0
Comparison of Estimated Size Using FP Outline™ to actual detailed counting
results using IFPUG 4.3 Rules 20 times faster and only 17.5% different
Metrics for Project Governance
Background
Our experience as Software Measurement consultants has taught us that knowledge
gained in the act of measurement can be as valuable to project managers, as their use
of our measurement results.
For example, as part of our measurement role we are often asked to functionally size a
project early in its lifecycle for input into estimation models. In order to perform the
functional size measurement we need to dissect the functional requirements for the
project, model them and individually catalogue and quantify each base functional
component. In doing so we make observations about the status of the project and the
quality of both the requirements and the specifications and based on our experience
©Copyright Total Metrics Pty Ltd 2010
208
Background and Articles on Functional Size
with similar projects, we are able to make predictions on the likelihood of the project’s
success.
With time, as our predictions have become reality, we have begun to recognise that our
observations, if reported, could have provided valuable input into the overall
management of the project and if heeded could have prevented numerous project
failures. The act of measuring provides quantitative assessments of the quality and
status of a project that is rarely seen by others and the measures we take give insights
that can provide real benefits to the project team beyond just monitoring their
productivity.
This realisation has caused us to change our approach and to focus on using the role of
measuring to provide ongoing advice to the project whilst it is progressing. We use the
measurements to quantify our observations so our recommendations are now a critical
part of the project decision making. Metrics experts observe and measure without any
vested interest and as such provide unbiased and independent assessment of the
project risk, quality and status. The measurement results support these observations.
As metrics consultants we had been confusing the measure with the goal. Key
objectives should not be the measurement results but successful software development
projects. Delivery on time and on budget with the right functionality is the true measure
of the worth of ‘metrics’ to a project. To make measurement an integral part of the
software development process we first have to make it relevant to the project’s success.
This change of emphasis has meant that we are now perceived by our clients as
providing project governance through the act of measurement and called “Scope
Managers” not “Metrics Consultants”. We have shifted the perception of the project
team from seeing us as just another project overheard, to being someone that can
assist project teams to better manage and control their risk and optimise their chances
of success.
©Copyright Total Metrics Pty Ltd 2010
209
SCOPE 3.0 Help User Manual
Version 1.0
To download the full paper please go to : http://www.totalmetrics.com/function-pointresources/downloads/Software-Measurement-Project-Governance.pdf
Role of Scope Manager During Project Life Cycle
Business Planning / Feasibility
The Scope manager can be involved in the project as early as the business case stage
where they assess the high-level business requirements to provide an estimated
functional size of the proposed project. The functional size combined with a productivity
rate for the planned development environment can be used to establish a ballpark range
of predicted project effort, cost and likely duration.
If the organisation has its own internal productivity data then this can be used for the
estimates. Alternatively, industry data for productivity rates are available from the
International Software Benchmarking Standards Group (ISBSG) [1]. The ISBSG’s data
provides industry productivity data for a wide range of development platforms,
languages and environments.
The project estimates can be used as a ‘reality check’ against the planned budget and
required delivery dates. If delivery time is constrained, then the Scope Manager can use
ISBSG’s regression equations to demonstrate the trade-offs between compressing the
schedule and the cost of adding more people on the project. For example, doubling the
speed of project delivery requires up to four times the number of people [5]. Large
teams have a significant negative impact on an individual’s productivity rate and
consequently an overall increased cost of the project to deliver the same product.
©Copyright Total Metrics Pty Ltd 2010
210
Background and Articles on Functional Size
If the estimated cost and duration exceeds the planned budget or schedule then the
functionality may need to be reduced. Other governance processes need to be in place
to ensure that the reduced functionality still delivers the planned business benefits.
Project risk of failure increases exponentially with project size. Early quantification of
the size of the proposed software product enables evaluation of potential risk. The
Scope Manager provides quantitative input for the business to make objective decisions
as to the development strategy to minimise risk, whether to proceed to the next step of
building a requirements specification or to cancel the project.
Requirements Specification Stage
As part of the functional sizing process, the User’s Requirements need to be
decomposed into individual functions within a functional model. Each function (process
and data group) is identified, catalogued and sized. The cataloguing and modelling
process often highlights gaps in the Requirements Specification i.e., where functions
©Copyright Total Metrics Pty Ltd 2010
211
SCOPE 3.0 Help User Manual
Version 1.0
have failed to be specified, or have been specified inadequately, inconsistently or
ambiguously. The Scope Manager is in a unique independent position to view the
project how the external developers may see it. The Scope Manager’s experience with
sizing functional specifications enables them to identify areas that may have been
overlooked by the project team and provide objective feedback on the quality of the
specification. For example, they can mark up the functional model for functionality that
has been explicitly specified or only implicitly specified and quantify the percentage of
each. The functional size is still only an estimated ‘range’ as the complexity of many
functions can often not be evaluated at this stage; it is usually anticipated that the
project will grow further. The Users may also prioritise their Requirements as those that
they consider to be Core functionality and mandatory to be delivered versus those that
they consider to be extended or for future consideration. The Scope Manager can
determine the size and estimate of each alternative.
High-level project resource estimates are revised based on the selected platform and
the predicted size range. Once the project team have updated the specification to fix
ambiguities, inconsistencies and missing functionality, the refined Requirements
Specification is ready to be used as the basis for input into the Functional Specification.
In an outsourcing situation the Requirements Specification would be provided as part of
the Request for Tender (RFT). The functional sizing model along with its list of individual
identified quantified functions and their associated priority for delivery is distributed as
part of the RFT. This becomes the baseline Requirements document with which the
business can evaluate whether the completed project has delivered their required
functionality.
If the method of quotation by the suppliers is to be via a ‘fixed $ price per function point’
as identified within the SouthernSCOPE [5] methodology, then the tendering suppliers
need a clear indication of which of the Users Requirements would be considered to be
included or excluded from the fixed price.
The Scope Manager identifies which of the User’s Requirements will consume effort
(and therefore costs) that are proportional to the overall functional size and which will
©Copyright Total Metrics Pty Ltd 2010
212
Background and Articles on Functional Size
not, and thus be excluded from the fixed price. For example, documentation of Project
Deliverables is proportional to functional size and would be included within the fixed
price per function point. In comparison, research and acquisition of hardware is not, and
should be quoted separately.
Supplier Selection Stage
The early ballpark estimates of projected effort, duration and cost based on functional
size enable the client to objectively evaluate the ‘reasonableness’ of the supplier’s
proposed quotation and solution. This mitigates the risk of selecting the supplier based
on the lowest price and promised fastest delivery who would potentially have the
greatest risk of failing to deliver the project
The Scope Manager uses the functional size model to quantify the ‘fit’ of each supplier’s
proposed solution to the original requirements enabling full objective evaluation of the
supplier’s solution by the quantification of the proportion of extra functionality,
©Copyright Total Metrics Pty Ltd 2010
213
SCOPE 3.0 Help User Manual
Version 1.0
functionality omitted, functionality delivered by a package or functionality that needs to
be customised or built.
Stage
The Scope Manager revises the functional size based on the Functional Specification
and quantitatively maps the functional requirements to the original RFT Requirement’s
Specification to provide a percentage match of the RFT to the proposed solution. Any
omissions, ambiguities or inconsistencies in the Functional Specification are highlighted
for revision before proceeding with the build. If at this stage the functional size indicates
that the project will cost more, or be delivered later than planned, then non-core
functionality is selectively removed from the project until the project size indicates that it
can be delivered within the allocated budget and delivery dates.\
If the project-charging model is based on dollars per function point delivered, the Scope
Manager will work with the client and supplier to finalise the price variation model for
©Copyright Total Metrics Pty Ltd 2010
214
Background and Articles on Functional Size
changes that are approved during the remaining development. Ie, typically penalties are
paid for any function points added, modified or deleted from this stage forwards. The
dollar amount charged is usually scaled to increase as the project progresses. The
outcome from the functional sizing and mapping exercise is a traceable, auditable,
quantified list of agreed functional requirements to act as a baseline for ongoing scope
management.
Changes introduced during the Project Build to Implementation
The Scope Manager is tasked with the quantification of Client Change Requests based
on functional size of impact. This is used as a basis for pricing negotiations, enabling
©Copyright Total Metrics Pty Ltd 2010
215
SCOPE 3.0 Help User Manual
Version 1.0
the client to assess the price of Change Requests prior to submission to the supplier
and know they are being fairly charged for their required changes.
The Scope Manager uses the size of the change to establish the revised project scope
as a means of evaluating the supplier’s revised project delivery date.
Ongoing Project Monitoring
The Functional Size Model provides input into the quantitative monitoring of project
status using an ‘earned’ value type of reporting [2], [3]. I.e., the Scope Manager
provides independent project status reports based on the amount of functionality
delivered, versus functionality planned to be delivered, within each reporting period.
This is an ‘output based’ metric for project reporting that is more meaningful to the
©Copyright Total Metrics Pty Ltd 2010
216
Background and Articles on Functional Size
business client rather than an input based metrics of budget or effort consumed. I.e.,
status reporting is based on the amount of product delivered (function points) to each
stage of completeness. This contrasts with traditional approaches of monitoring status
based on resources and schedule consumed.
The status report provides the client with detailed objective independent assessment
about which functions of their software have been developed to what stage. The
increased visibility of project status gives early warning of project slippage.
Project Implementation
On project completion the Scope Manager quantifies and maps the functionality
implemented versus functionality contracted to be delivered, for input into final payment
negotiations. This enables the client to verify, against the traceable list of requirements,
which functions have been satisfactorily delivered. The quantification of the delivered
functionality enables objective discussions on payments due.
©Copyright Total Metrics Pty Ltd 2010
217
SCOPE 3.0 Help User Manual
Version 1.0
The Scope Manager provides advice on the project metrics to collect, analyse and
report, and ensures that they are consistent with the organisations internal standards or
those of ISBSGs. The Scope Manager can assist with the submission of the project
data to the ISBSG repository and provide an independent assessment of the
developer’s productivity and product quality.
Conclusion
The Scope Manager focuses on the effective management and control of the project
and uses their metrics skills to provide objective evidence of their observations, shifting
the focus from measurement to project governance.
The Role of the Scope Manager in Project Governance
The role of Project Governance is to balance the risk of the organisation’s investment
against the opportunities and benefits that the outcomes will provide the business. It
addresses the risks to ensure that the software provides value to the organisation and
that the risks are properly mitigated.
©Copyright Total Metrics Pty Ltd 2010
218
Background and Articles on Functional Size
For IT projects it is about providing the client with the capability to monitor the project
status and control the risk of the project not delivering the business value they require
within the time and budget available. Project governance is about understanding the
business opportunities that the project can deliver, but also appreciating the
consequences of failure and putting in place strategies to minimise the risk and optimise
the investment so that business goals are achieved.
The Scope Manager provides metrics based project governance. We have found this
approach to be very successful in objectively quantifying key project attributes to enable
informed decision making with respect to project estimates and project risk. The Scope
Manager is typically a metrics specialist who has excellent skills in business analysis,
project estimation and functional size measurement. They need to be independent of
the project team and not be connected to either the IT developers or the business client.
They have to be able to report the status of the project objectively without bias, to a
management level that has the authority to proceed, change direction or cancel the
project.
©Copyright Total Metrics Pty Ltd 2010
219
SCOPE 3.0 Help User Manual
Version 1.0
The Scope Manager provides a key role in that their reports can provide early warning
of project failure. In the past it was often not until major project milestones were missed
that senior management had an indication that their investment was at risk. The
following sections describe the role of the Scope Manager over the life cycle of the
project and how they use metrics as a basis for their recommendations.
Uses and Benefits of Sizing
Introduction
Industry experience has shown that an emphasis on project management and control
offsets much of the risk associated with software projects. One of the major
components of better management and control of both in-house development and a
package implementation is measurement.
This includes measurement of:
•
The SCOPE of the project e.g.:
•
•
•
software units to be delivered
-performance indicators of efficiency and cost effectiveness e.g.:
•
cost per unit of software delivered
•
staff resources per unit of software delivered
•
elapsed time to deliver a unit of software
quality indicators e.g.:
•
number of defects found per unit of software delivered
The outcome of a Function Point count provides the metric ‘unit of software delivered’
and can be used to assist in the management and control of software development,
customisation or major enhancements from early project planning phases through to the
ongoing support of the application.
Knowing the software size facilitates the creation of more accurate estimates of project
resources and delivery dates and facilitates project tracking to monitor any unforeseen
©Copyright Total Metrics Pty Ltd 2010
220
Background and Articles on Functional Size
increases in scope. The measurement of the performance indicators enables
benchmarking against other development teams and facilitates better estimating of
future projects. These are only some of the ways in which Function Point Analysis
(FPA) can assist IT management. These and other lesser known ways in which FPA
can assist IT to move towards ‘best practice’ in the management of their software
products and Processes are discussed in the following sections.
The benefits of using measurement to support management decision-making can only
be achieved if the information supporting these decisions is relevant, accurate and
timely. In order to ensure the quality of their measurement data, organisations need to
implement a ‘measurement Process’. The cost of implementing the activities,
procedures and standards to support the function point counting Process will depend on
the size and structure of the organisation and their measurement needs. These
considerations are discussed in the last section Costs of Implementing Function
Point Analysis.
Customising Packaged Software
Background
For selected MIS applications, implementing a packaged ‘off the shelf’ solution is the
most cost effective and time efficient strategy to deliver necessary functionality to the
business.
All of the benefits and uses of Function Point Analysis which applied to in-house
development projects as described in the previous section can also apply to projects
which tailor a vendor supplied package to an organisations specific business needs.
Experience shows that Function Point Counting of packages is not always as
straightforward as sizing software developed in-house, for the following reasons:
©Copyright Total Metrics Pty Ltd 2010
221
SCOPE 3.0 Help User Manual
Version 1.0
•
Only the physical and technical functions are visible to the counter. The logical
user view is often masked by the physical implementation of the original logical
user requirements.
•
In most cases the functional requirements, functional specifications, and logical
design documentation are not delivered with the software. The counter may have
to rely on the User Manual or on-line help to assist in interpreting the user view.
The modelling of the logical business transactions often requires the function point
counter to work with the client to identify the logical transactions. They do this by
investigating the users functional requirements and interpreting the logical transactions
from the package’s physical implementation.
• In most cases the names of the logical files accessed by the application’s
transactions are not supplied by the package vendor.
The function point counter will need to develop the data model by
analysing the data items Processed by the application.
However, with sufficient care a reasonably accurate function point count of packaged
applications can usually be obtained.
Estimating Package Implementations
The project estimates for a package solution need to be refined for each implementation
depending on the percentage of the project functionality which is:
•
native to the package and implemented without change
•
functionality within the package which needs to be customised for this installation
•
functionality contained with the organisations existing applications which needs
to be converted to adapt to the constraints of the package
•
to be built as new functions in addition to the package functions
•
to be built to as new functions to enable interfacing to other in-house applications
•
not to be delivered in this release
©Copyright Total Metrics Pty Ltd 2010
222
Background and Articles on Functional Size
The productivity rates for each of these different development activities (to implement,
customise, enhance or build) are usually different. This complexity of assigning an
appropriate productivity factor can be compounded when the package provides utilities
which enable quick delivery based on changes to rule tables. Change Requests,
which can be implemented by changing values in rule-based tables, can be
implemented very efficiently compared to a similar user change request that requires
source code modification. It is recommended that these different types of activities are
identified and effort collected against them accordingly so that productivity rates for the
different activity types can be determined.
The functions can be Flagged for their development activity type and their relative
contributions to the Functional Size calculated. This will enable fine-tuning of the project
estimates.
Another area of concern when developing estimates for package integration is the need
to determine the extent that the application module needs to interface with existing
functionality. The function point count measures the External Files accessed by
transactions within this application. A high percentage of interface files (>10%) suggests
a high degree of coupling between this application and existing applications. A high
degree of interfacing tends to have a significant negative impact on productivity rates
and needs to be considered when developing estimates.
Summary
Function Point Analysis is a technique that until now has been restricted within many
organisations to only be used for better estimating or input into benchmarking
productivity rates. The above examples illustrate a wider range of uses where it can
contribute to the better management and control of the whole software production
environment.
•
International Software Benchmarking Standards Group (ISBSG) is an international group of
representatives from international metrics organizations who collect project data from countries
©Copyright Total Metrics Pty Ltd 2010
223
SCOPE 3.0 Help User Manual
Version 1.0
including Australia, Austria, Canada, Denmark, Germany, Hong Kong, India, Japan, New
Zealand, Norway, Poland, United Kingdom and the United States.
•
Data within the ISBSG Repository Release 11 supports the premise that smaller projects are
successful. Over 65% of the projects in the repository are less than 500 function points and 93%
of the projects are less than 2000 function points. The repository is populated by industry
projects, voluntarily submitted by organizations that want to benchmark their project’s
performance against industry projects with a similar profile. Consequently organizations tend to
submit successfully completed projects which have better than average performance i.e. the ones
which did not ‘fail’.
•
Software Productivity Research
•
At a median industry cost of $716/fp delivered, a 5000 function point project is risking $3.5 million
dollars.
•
Industry experience suggests that the best managed projects which deliver quality software on
time and within budget tend to less than 700 function points and up to 1500 function points.
•
The Victorian State Government in Australia has adopted a recommended policy for Government
departments to manage and control government out-sourced development projects using
Function Points. Suppliers tender for the development based on a fixed price in dollars per
function point. Scope changes are automatically charged by the supplier at a pre-determined
contracted charge-rate based on the number of function points impacted and the stage at the life
cycle when the change was introduced. The government policy underpinning this approach is
called ‘Southern Scope'. More information is available at: http://www.egov.vic.gov.au/victoriangovernment-resources/e-government-strategies-victoria/southernscope/southernscope-avoiding-software-budgetblowouts.html
•
Where maintenance and support includes defect repairs and very minor enhancements.
•
Capers Jones – Applied Software Measurement – Assuring Productivity and Quality – McGraw
Hill – Software Engineering series 1991 – Chapter 3 Page180.
FPA Uses and Benefits after Software Implementation
Planning Support Resources and Budgets
The number of personnel required to maintain and support an application is strongly
related to the application’s size. Knowing the Functional Size of the application’s
portfolio allows management to confidently budget for the deployment of support
resources. The following figure demonstrates this relationship as demonstrated within
©Copyright Total Metrics Pty Ltd 2010
224
Background and Articles on Functional Size
an Australian financial organisation. The average maintenance assignment scope
(number of function points supported per person) for this organisation is 833 function
points per person. The assignment scope has been found to be negatively influenced
by the age of the application and the number of users, i.e. as both these parameters
increase the assignment scope decreases. 12Capers Jones figures show similar
assignment scopes where for ageing, unstructured applications with high complexity an
assignment scope of 500 function points per person is not unusual whereas newer,
structured applications, skilled staff can support around 1500 – 2000 function
Figure 8-2 Relationship between the Size of an Application and the Number of Support
staff (Source - Total Metrics 1999)
©Copyright Total Metrics Pty Ltd 2010
225
SCOPE 3.0 Help User Manual
Version 1.0
Once implemented, applications typically need constant enhancement in order to
respond to changes in direction of an organisation’s business activities. Function points
can be used to estimate the impact of these enhancements. The baseline function point
count of the existing application will facilitate these estimates. As the application size
grows with time the increasing assignment scope will provide the justification to assign
more support staff.
Benchmarking
The function point count of delivered functionality provides input into productivity and
quality performance indicators. These can then be compared to those of other in-house
development teams and implementation environments. Benchmarking internally and
externally with industry data enables identification of best practice. External
benchmarking data is readily available in the ISBSG Repository
(International Software Benchmarking Standards Group).
Identifying Best Practice
Project managers seeking ‘best practice’ in their software development and support
areas recognise the need to adopt new tools, techniques and technologies to improve
the productivity of the Process and quality of the products they produce. Baselining
current practice enables management to establish current status and set realistic
targets for improvement. Ongoing measurement of productivity and quality key
performance indicators enable management to assess the impact of their implemented
changes and identify where further improvements can be made. Function points are the
most universally accepted method to measure the output from the software Process.
They are a key metric within any Process improvement program because of their ability
to normalise data from various software development environments combined with their
ability to measure output from a business perspective as compared to a technical
perspective.
©Copyright Total Metrics Pty Ltd 2010
226
Background and Articles on Functional Size
Planning New Releases
The functional hierarchy of the functionality delivered by an application can also assist
the support manager in planning and grouping change requests for each new release of
the application. The hierarchy illustrates closely related functions and their relative size.
If the impact of change is focused on a group of related functions then development
effort will be reduced particularly in the design, testing and documentation stages of the
project. This strategy of evaluating the scope of impact of a change request also
reduces project risk by restricting projects to a manageable size and focusing change
on a restricted set of related business functions.
Software Asset Valuation
Function Point Analysis is being used increasingly by organisations to support the
‘valuation of their software assets’. In the past, software has been considered an
expense rather than a capital asset and as such was not included in an organisations
asset register. The most commonly used software valuation method is based on the
‘deprival method’. This method values the software based on what it would cost to
replace in today’s technical environment rather than what it cost originally to build. The
industry build rate (dollar cost per function point) is determined and the total
replacement value is calculated based on the current Functional Size of the application.
Since FPA provides a means of reliably measuring software, some organisations have
implemented accrual budgeting and accounting in their business units. Under this
directive, all assets must be valued based on deprival value and brought to account,
thus ensuring better accountability of the organisations financial spending. Funding via
budget allocation is based on assets listed in their financial accounts and their
depreciation. In the past, the purchase price of the software recorded as an expense
within an accounting year. These more recent accounting practices mean that it can
now be valued as an asset and depreciated.
Publicly listed organisations have found that by using this accrual accounting method of
measuring software as an asset rather than an expense they can amortise the
©Copyright Total Metrics Pty Ltd 2010
227
SCOPE 3.0 Help User Manual
Version 1.0
depreciation over five years rather than artificially decrease the current year’s profit by
the total cost of the software. This strategy has a dramatic effect on their share price
since once their software is listed as a capital asset it contributes to the overall worth of
the company and the total cost of that asset has a reduced impact on the current year’s
reported profit.
Outsourcing Software Production and Support
The benefits of Functional size measurement in outsourcing contracts, is that Functional
Size enables suppliers to measure the cost of a unit of output from the IT Process to the
business and enables them to negotiate on agreed outcomes with their client.
Specifically these output based metrics based on function point analysis has enabled
suppliers to:
•
Quantitatively and objectively differentiate themselves from their competitors.
•
Quantify extent of annual improvement and achievement of contractual targets.
•
Negotiate price variations with clients based on an agreed metric.
•
measure financial performance of the contract based on unit cost of output.
•
At contract renewal be in a stronger bargaining position supported by an
established set of metrics.
Conversely these output based metrics based on function point analysis has enabled
clients to:
•
Objectively assess supplier performance based on performance outputs
delivered rather than concentrating on inputs consumed.
•
Establish quantitative performance targets and implement supplier penalties and
bonuses based on achievement of these targets.
•
Measure the difference between internal IT costs compared to the cost of
outsourcing based on similar output.
•
Quantitatively compare competing suppliers at contract tender evaluation stage.
Most of the international outsourcing companies use function point based metrics as
part of their client service level agreements. Whilst this method of contract
management is relatively new its proponents are strong supporters of the usefulness of
©Copyright Total Metrics Pty Ltd 2010
228
Background and Articles on Functional Size
the technique. In our experience once an outsourcing contract has been based on
Function Point metrics subsequent contract renewals expand on their use.
Metrics initiatives have a high cost and need substantial investment, which is often
overlooked at contract price negotiation. Both the supplier and the client typically incur
costs. However, given the size of the penalties and bonuses associated with these
contracts it soon becomes obvious that this investment is necessary.
FPA Uses and Benefits in Project Construction
Monitoring Functional Creep
Function point analysis provides project management with an objective tool by which
project size can be monitored for change, over the project’s lifecycle.
As new functions are identified, functions are removed or changed during the project the
function point count is updated and the impacted functions appropriately Flagged. The
10project scope can be easily tracked and reported at each of the major milestones.
If the project size exceeds the limits allowed in the initial estimates then this will provide
an early warning that new estimates may be necessary or alternatively highlight a need
to review the functionality to be delivered by this release.
Assessing and Prioritizing Rework
Function Point Analysis allows the project manager to objectively and quantitatively
measure the scope of impact of a change request and estimate the resulting impact on
project schedule and costs. This immediate feedback to the user on the impact of the
rework allows them to evaluate and prioritise change requests.
The cost of rework is often hidden in the overall project costs and users and developers
have no means to quantify its impact on the overall project productivity rates. Function
point analysis enables the project manager to measure the functions that have been
©Copyright Total Metrics Pty Ltd 2010
229
SCOPE 3.0 Help User Manual
Version 1.0
reworked due to user-initiated change requests. The results provide valuable feedback
to the business on the potential cost savings of committing user resources early in the
project to establish an agreed set of requirements and minimising change during the
project lifecycle.
Managing Project Development
FPA Uses and Benefits in Project Planning
Project Scoping
A recommended approach for developing function point counts is to first functionally
decompose the software into its elementary functional components (base functional
components). This decomposition may be illustrated graphically on a Functional
Hierarchy. The hierarchy provides a pictorial ‘table of contents’ or ‘map’ of the
functionality of the application to be delivered. This approach has the advantage of
being able to easily convey the scope of the application to the user, not only by
illustrating the number of functions delivered by each functional area, but also a
comparative size of each functional area measured in function points.
Assessing Replacement Impact
If the software to be developed is planned to replace existing production applications it
is useful to asses if the business is going to be delivered more, less or the same
functionality. The replacement system’s functionality can be mapped against the
functionality in the existing system. A quantitative assessment of the difference can be
measured in function points. Note, this comparison can only be done if the existing
applications have already been sized in Function Points.
Assessing Replacement Cost
Multiplying the size of the application to be replaced by an estimate of the $ dollar cost
per function point to develop, enables project sponsors to develop quick estimates of
replacement costs. Industry derived costs are available and provide a ballpark figure for
©Copyright Total Metrics Pty Ltd 2010
230
Background and Articles on Functional Size
the likely cost. Industry figures are a particularly useful reference if the re-development
is for a new software or hardware platform not previously experienced by the
organisation. Ideally organisations should establish their own ‘cost per function point’
metrics for their own particular environment based on project history.
If you are considering implementing a ‘customised off the shelf’ package solution then
this provides a quick comparison of the estimated package implementation costs to
compare with an in-house build. Package costs typically need to include the cost of reengineering the business to adapt the current business Processes to those delivered by
the package. These costs are usually not a consideration for in-house developed
software.
Negotiating Scope
Initial project estimates often exceed the sponsors planned delivery date and budgeted
cost. A reduction in the scope of the functionality to be delivered is often needed so that
it is delivered within a predetermined time or budget constraints. The functional
hierarchy provides the ‘sketch-pad’ to do scope negotiation. I.e. it enables the project
manager and the user to work together to identify and Flag (label) those functions which
are:
•
mandatory for the first release of the application,
•
essential but not mandatory,
•
optional and could be held over to a subsequent release
The scope of the different scenarios can then be quickly determined by measuring the
Functional Size of the different scenarios. E.g., the project size can be objectively
measured to determine what the size (and cost and duration) would be if:
•
all functions are implemented
•
only Mandatory functions are implemented
•
only Mandatory and Essential functions are implemented
©Copyright Total Metrics Pty Ltd 2010
231
SCOPE 3.0 Help User Manual
Version 1.0
This allows the user to make more informed decisions on which functions will be
included in each release of the application based on their relative priority compared to
what is possible given the time, cost and resource constraints of the project.
Evaluating Requirements
Functionally sizing the requirements for the application quantifies the different types of
functionality delivered by an application. The function point count assigns function
points to each of the function types, External Inputs, Outputs and Inquiries and
Internal and External Files.
Industry figures available from ISBSG Repository for projects measured with IFPUG
function points indicates that ‘complete’ applications tend to have consistent and
predictable ratios of each of the function types. The profile of functionality delivered by
each of the function types in a planned application can be compared to that of the
typical profile from implemented applications, to highlight areas where the specifications
may be incomplete or there may be anomalies.
The following pie chart illustrates the function point count profile for a planned Accounts
Receivable application compared to that from the ISBGS data. The reporting functions
(outputs) are lower than predicted by industry comparisons. Incomplete specification of
reporting functions is a common phenomena early in a project’s lifecycle and highlights
the potential for substantial growth creep later in the project as the user identifies all
their reporting needs.
©Copyright Total Metrics Pty Ltd 2010
232
Background and Articles on Functional Size
The quantitative comparison below shows that the reporting requirements were lower
than expected by about half (14% compared to the expected 23% of the total function
points). The project manager in this case verified with the user that the first release of
the software would require all reporting requirements and the user indicated that more
reports were likely to be specified. The project manager increased the original count to
allow for the extra 9% and based his early project estimates on the higher figure that
was more likely to reflect the size of the delivered product. The function point
measurement activity enabled the project manager to quantify the potential missing
functionality and justify his higher, more realistic estimate.
©Copyright Total Metrics Pty Ltd 2010
233
SCOPE 3.0 Help User Manual
Version 1.0
Estimating Project Resource Requirements
Once the scope of the project is agreed the estimates for effort, staff resources, costs
and schedules need to be developed. If productivity rates (hours per function point,
$cost per function point) from previous projects are known, then the project manager
can use the function point count to develop the appropriate estimates. If your
organisation has only just begun collecting these metrics and does not have sufficient
data to establish its own productivity rates then the ISBGS industry data can be used in
the interim.
Allocating Testing Resources
The functional hierarchy developed as part of the function point count during project
development can assist the testing manager to identify high complexity functional areas
which may need extra attention during the testing phase. Dividing the total function
points for each functional area by the total number of functions allocated to that group of
functions, enables the assessment of the relative complexity of each of the functional
areas.
The effort to perform acceptance testing and the number of test cases required is
related to the number and complexity of the user functions within a functional area.
Quantifying the relative size of each functional area will enable the project manager to
allocate appropriate testing staff and check relative number of test cases assigned.
Risk Assessment
Many organisations have large legacy software applications, that due to their age, are
unable to be quickly enhanced to respond to the needs of their rapidly changing
business environments. Over time these applications have been patched and expanded
until they have grown to monstrous proportions. Frustrated by long delays in
implementing changes, lack of support for their technical platform and expensive
support costs, management will often decide to redevelop the entire application. For
©Copyright Total Metrics Pty Ltd 2010
234
Background and Articles on Functional Size
many organisations this strategy of rebuilding their super-large applications has proved
to be a disaster resulting in cancellation of the project mid-development. Industry
figures show that the risk of project failure rapidly increases with project size. Projects
less than 6500 function points have a risk of failure of less than 20% in comparison with
projects over 5000 function points which have a probability of cancellation close to
40%7. This level of risk8 is unacceptable for most organisations.
Assessing planned projects for their delivered size in function points enables
management to make informed decisions about the risk involved in developing large
highly integrated applications or adopting a lower risk phased approach described
below.
Phasing Development
If the project manager decides on a phased approach to the project development then
related modules may be relegated to different releases. This strategy may require
temporary interfacing functionality to be built in the first release to be later
decommissioned when the next module is integrated. The function point count allows
project managers to develop ‘what if scenarios’ and quantify the project scope of each
phase as a means of making objective decisions. Questions to which quantitative
answers can be provided are:
•
How much of the interfacing functionality can be avoided by implementing all of
the related modules in release one?
•
What is the best combination of potential modules to group within a release to
minimise the development of temporary interfacing functions?
If it is decided to implement the application as a phased development then the size of
each release can be optimised to that which is known to be manageable9. This can be
easily done by labelling functions with the appropriate Release and performing ‘what-if’
scenarios by including and excluding functions from the scope of the count for the
release.
©Copyright Total Metrics Pty Ltd 2010
235
SCOPE 3.0 Help User Manual
Version 1.0
References and Recommended Reading
1. ISBSG data Benchmark Industry Reports - http://www.isbsg.org/
2. Morris P. M - Case Study of a Successful Measurement Program 2007 - http
://www.totalmetrics.com/total-metrics-articles/Software-Measurement-CaseStudy.pdf
3. Morris P.M - Metrics for Project Governance 2004 http://www.totalmetrics.com/function-point-resources/downloads/SoftwareMeasurement-Project-Governance.pdf
4. Software Productivity Research (Capers Jones) - Softwares Chronic Crisis W.
Gibbs Scientific American September 1994
5. SouthernSCOPE Project Management Methodology developed by the Australian
Government (State of Victoria). - http://www.mmv.vic.gov.au/
6. American Programmer, Cutter Information Corp, vol. 8, no. 7, July 1995, 37 pp.
7. DeMarco, T., and Lister, T., Peopleware, Dorset House Press, New York, 1987,
189 pp.
8. Garmus, D., and Herron, D., Measuring the Software Process: A Practical Guide
to Functional Measurements, Prentice Hall PTR, 1996.
9. Garmus, D., and Herron, D., Function Point Analysis: Measurement Practices for
Successful Software Projects, http://www.aw.com/cseng/
10. Goodman, P., Practical Implementation of Software Metrics (International
Software Quality Assurance Series) McGraw Hill, London, 1992.
11. Humphrey, Watts, Measuring the Software Process, Addison-Wesley, Reading,
Mass, 1989, 489 pp.
12. IEEE Recommended Practice for Software Requirements Specifications, IEEE
Computer Society, Institute of Electrical and Electronics Engineers, Inc., New
York, April 1994, 26 pp.
13. International Function Point Users Group, IT Measurement, Pearson Education
Corporate Sales Division, ISBN 0-201-74158-x (pbk.)
©Copyright Total Metrics Pty Ltd 2010
236
Background and Articles on Functional Size
14. Jones, Capers, Applied Software Measurement - Assuring Productivity and
Quality, Software Productivity Research, Inc., Burlington, Mass, 1991, ISBN 007032813-7.
15. Jones, Capers, Programming Productivity, McGraw-Hill, New York, 1968, 280
pp.
16. Jones, Capers, ”Measuring Software Productivity,” CASE Trends, vol. 2, no. 1,
Jan/Feb 1990, pp. 17-24.
17. Jones, Capers, Table of Programming Languages and Levels, Software
Productivity Research, Inc., Burlington, Mass, 1988, 35 pp.
18. Jones, Capers, A Short History of Function Points and Feature Points, Software
Productivity Research, Inc., Burlington, Mass, 1988, 45 pp.
19. Symons, Charles, Software, Sizing and Estimating, Mk II FPA, John Wiley, New
York.
20. System Development, Function Points Applied Computer Research, Inc.,
Phoenix, August 1989, 20 pp.
21. ‘American Programmer’ – vol.10, no. 11: Adapting Function Points to Real-time
Software:
22. Stephen Treble & Neil Douglas, Sizing and Estimating Software in Practice:
Making Mk11 Function Points Work, McGraw-Hill Book Company, 1995, IBSN: 007-70762023. Morris, P M Forgotten Aspects of Function Point Analysis: Digest Magazine
"Project and Profits" April 2003 Issue
24. Morris, P. M Using Function Points to get Projects Back on Track: Proceedings
of the International Function Point Users Group Conference, April 1994.
25. Morris, P.M, IFPUG’s Involvement in ISO Function Point Standards:
Proceedings of the International Function Point Users Group Conference, April
1995.
26. Morris, P.M, Desharnais, Jean-Marc, Validating Function Points: Proceedings of
the International Function Point Users Group Conference, April 1996.
©Copyright Total Metrics Pty Ltd 2010
237
SCOPE 3.0 Help User Manual
Version 1.0
27. Desharnais, Jean-Marc, Morris, P.M., Validation Process in Software
Engineering: An example with Function Point. Software Metrics: Research and
practice is Software Measurement 3-8244-6518-3 (1997).
28. Desharnais J.-M., Morris P., Post Measurement Validation Procedure for
Function Point Counts, Position Paper Forum on Software Engineering
Standards Issues, October, 1996.
29. Wittig GE Morris PM Finnie GR Rudolph EE Formal Methodology to Establish
Function Point Coefficients: Proceedings of the International Function Point
Users Group Conference, September 1998.
30. Oligny, Serge, Abran, Alain, Desharnais, Jean-Marc, Morris, PM, Functional Size
of Real Time Software: Overview of Field Tests 13th International Forum on
COCOMO and Software Cost Modeling – Los Angeles, October 1998.
31. E.E. Rudolph, G.E. Wittig, G.R. Finnie, P.M. Morris Verifying Function Point
Values IFPUG International Function Point Users Group Conference - Arizona
USA, September, 1997.
32. Desharnais J.M., Morris P, Measuring ALL the Software not just what the
Business UKSMA Software Measurement in Practice Conference - London
October 1998.
33. IT Measurement: Practical Advice from the Experts (Pam Morris contributed a
Chapter on Benefits and Uses of Function Point Analysis and the infrastructure
required to implement Function Point Analysis within an organisation. (
International Function Point Users Group) Addison Wesley 2002 ISBN:
020174158X
©Copyright Total Metrics Pty Ltd 2010
238
About SCOPE
Installation
To Install SCOPE
Download SCOPE from the Total Metrics WWW site using the User ID and Password
provided by Total Metrics.
Before you can install SCOPE you must save the downloaded files to your hard drive.
Before you use SCOPE, you must install the SCOPE program. If you have received
SCOPE on a CD then it must first be saved to your computer’s hard drive, it cannot be
executed from the CD-ROM.
Instructions for Installation from Hard Drive
1. If the program does not start automatically, go to the drive where you saved
SCOPE and select setup.exe.
2. Follow the prompts.
Instructions for Installation from CD
1. Place SCOPE Installation CD in the CD-ROM drive.
2. If the program does not start automatically, go to Start / Run and type
“x:\setup.exe” (where x is the letter of your CD-ROM).
3. Follow the prompts.
Changes to your Computer
SCOPE installs a run-time version of Microsoft ACCESS XP®. If you decide to move the
location of the ACCESS XP® runtime program then you need to enter the new
pathname in SCOPE under View, Screen Display Options in the Main Menu.
©Copyright Total Metrics Pty Ltd 2010
239
SCOPE 3.0 Help User Manual
Version 1.0
SCOPE utilises the MS product Snapshot Viewer® to display its reports online. In some
instances when MS Office is re-installed on a computer, the Microsoft install process
overwrites the link between SCOPE and Snapshot Viewer®, so the reports will no longer
display. Just uninstall and re-install SCOPE and the problem is fixed.
See also SCOPE License Registration
Machine Requirements
Intel-based personal computer
•
Windows 95/98®
•
Windows NT4 Service Pack 3®
•
Windows 2000®
•
Windows XP®
•
Windows Vista ®
•
Windows 7 ®
25 Mb of hard disk space
16 Mb of RAM
Intended Audience
This User’s Guide is intended to be read by software project managers, business
analysts, software developers or anyone who intends to use SCOPE to:
•
Quantitatively size their software using ISO/IEC 20926 IFPUG 4.3
unadjusted or IFPUG CPM 4.3 functional sizing Methodology.
•
Quantitatively size their software project for input into project effort, cost
and schedule estimates.
•
Manage their software application portfolio by recording a quantitative audit
trail of functional changes for each release, mapping changes to a specific
change request, release or project.
©Copyright Total Metrics Pty Ltd 2010
240
About SCOPE
•
Graphically model the functionality of their software projects or applications
for documentation and SCOPE negotiation purposes.
Familiarity with Microsoft Windows® and some familiarity with functional decomposition
techniques is assumed. For quantitative sizing some knowledge of the IFPUG
Functional Size Methodology is required. See www.ifpug.org
Versions Published
SCOPE Project Sizing Software ™ (SCOPE) Version 1.6 First Published January 2004.
Upgrades Published:
o
Version 1.7 June 2005
o
Version 1.8 December 2005
o
Version 1.9 May 2006
o
Version 2.0 August 2007
o
Version 2.1 August 2008
o
Version 2.2 June 2009
o
Version 3.0 April 2010 - SCOPE Corporate™ (Multi-User database) and SCOPE
Professional™ (Single User database)
©Copyright Total Metrics Pty Ltd 2010
241
SCOPE 3.0 Help User Manual
Version 1.0
Copyright Notice
This User Manual and SCOPE Project Sizing Software™ (SCOPE Corporate™
and SCOPE Professional™) are copyright © April 2003 to 2010 to Total Metrics
Proprietary Limited Australia
Note: Total Metrics has taken all appropriate steps to ensure the accuracy of its
published material. Some of the contents of the material may require detailed technical
explanation to gain a complete understanding. If you have any concerns you are
welcome to advise Total Metrics and Total Metrics will make any necessary
explanations, review or changes.
All other Trademarks belong to their respective owners.
©Copyright Total Metrics Pty Ltd 2010
242
Flash Tutorials
Most of the major functions and features within SCOPE are fully explained via a Flash
Tutorial on the topic. Please go to
http://www.totalmetrics.com/function-point-software/scope-project-sizing-software/flashtutorials
For Tutorials on how to do the following functions:
•
Set Up a New Application
•
Set Up a New Release
•
Set Up a New Baseline Count
•
Set Up an Enhancement Count
•
Set Up Multiple Counts on the Same Release
•
Import Export Release Counts
•
Building Hierarchical Trees
•
Counting An Elementary Process
•
Counting a Logical File
•
Import Count Sessions from other Databases into a Release
•
Import a Count from EXCEL
•
Import and Export Trees or Parts of Trees
©Copyright Total Metrics Pty Ltd 2010
243
Glossary
A
Application: Is used synonymously for ‘software system’, e.g. AMS System. Each set
of activities that impacts the application is called a project. Application Counts
measure the size of the implemented software product.
Attributes: Attributes are used to Flag functions within the scope of the Function Point
Count so that these functions may be selectively reported as a group. They
enable different size profiles of the software to be measured.
B
Boundary: The application boundary is the conceptual interface between the software
under study and its users. A user is any person or anything that communicates or
interacts with the software.
D
Data Element Type: A Data Element Type (DET) is a unique user recognisable field,
from a business perspective, that participates in a transaction and/or is stored on
a logical data file.
Development Project: Set of activities that build one or more software applications.
These activities primarily ‘add’ new functionality.
E
Enhancement Project: Set of activities that change one or more existing software
applications. These activities change or delete existing functionality or add new
functionality to existing applications.
F
Files: Represent the ‘Data Business Functions’ or ‘Data Groups’ described in the
IFPUG documentation. They are logical groups of data from an external business
perspective. They are closely related to, but do not exactly correspond to, entities
on a normalised data model that is the logical view of the data from an
information technology perspective.
Function Point: A unit of measurement of software product and project functional size.
Function Point Analysis: A technique used to measure the Functional Size of software
products and projects.
Function Point Count (Noun): The result of applying the Function Point Analysis
technique to software. It is a measure of the Functional Size of the software.
©Copyright Total Metrics Pty Ltd 2010
245
SCOPE 3.0 Help User Manual
Version 1.0
Function Point Count (Verb):: An activity that applies the Function Point Analysis
technique to size software projects or applications.
Functional Hierarchy: A diagrammatic representation of the functional decomposition
of the business functionality of an application. This representation assists a
function point counter in conducting, and validating the completeness of, a
Function Point Count.
G
General Systems Characteristics: Fourteen quality and technical features identified to
be delivered with the functions of the software. The 14 characteristics (GSCs) or
features are assessed for their degree of influence on the software application as
a whole and for their impact on the development and maintenance activities for
the software. Albrecht’s algorithm (VAF = 0.65 + [0.01 * Sum GSCs]) is used to
calculate the Value Adjustment Factor for the software.
I
IFPUG: International Function Point Users Group - a US based organisation, with
international affiliates, which maintains standards and guidelines for the use of
the Function Point Analysis technique.
R
Record Element Type: A Record Element Type (RET) is a user recognisable subgroup of a logical data file. It usually corresponds to the relational tables on the
data model, which were grouped together to make up the logical group of data
from a business view.
S
System: Is used synonymously for ‘application’, (see ‘application’).
T
Transactions: These correspond to ‘elementary Processes’ in IFPUG terminology.
They are the lowest level on a functional hierarchy and represent a discrete
event in the users’ business Processes. They complete a unit of work and leave
the business in a consistent state. E.g. Update Property Details.
V
Value Adjustment Factor: This represents the quality and technical features of the
application delivered to the user. Whereas ‘functions’ on the hierarchy represent
‘what’ the user can do with the software the ‘features’ represent ‘how’ these
©Copyright Total Metrics Pty Ltd 2010
246
Glossary
functions are implemented and ‘how well’ they operate. The Value Adjustment
Factor (VAF) is calculated from the General Systems Characteristics.
©Copyright Total Metrics Pty Ltd 2010
247
Index
A
approximate size .............................. 223
A Process ........................................... 67
As Displayed .................................... 124
ACCESS .......................................... 263
Asset Valuation ................................ 245
Access Type ......................................... 4
Attribute .......................................... 4, 24
ACCESS XP® runtime ..................... 263
Attribute Data ................................... 109
Adjusted Function Point Count ......... 210
Attribute FP Size Profiles ................. 109
Adjusted Function Points.................... 25
Attribute Function ............................. 109
Adjustment Factor .............................. 87
Attribute Hierarchy Tree ..................... 16
AFP .................................................. 210
Attribute Note ................................... 109
All Counts for a Release................... 109
Attribute Tree ..................................... 55
Allocating Testing Resources ........... 252
Attributes ................................ 16, 38, 41
ALT L................................................ 136
Audit ................................................. 131
Alt+1 ................................................. 136
author ............................................... 103
Alt+2 ................................................. 136
Author............................................... 131
Alt+3 ................................................. 136
Author Name .................................... 143
Alt+4 ................................................. 136
Author's name. ................................. 103
Alt+F ................................................. 136
B
Alt+Ins .............................................. 136
Baseline Application ......................... 109
Alt+Ins+Shift ..................................... 136
Baseline Count ................................... 62
Annotating ........................................ 129
Baseline Counts ................................... 2
Application Baseline Size ................. 115
Baseline Release ............................. 109
Application Function Point Count ..... 109
Baseline Release Functional Size .... 118
©Copyright Total Metrics Pty Ltd 2010
249
SCOPE 3.0 Help User Manual
Version 1.0
Baseline Release Report.................... 77
Convert......................................... 2, 128
Benchmarking .................................. 245
converted database ............................ 99
Black .................................................. 77
Copy ................................................. 142
Budget .............................................. 245
Copy ‘Links Only’ ............................... 45
Business Area .................................... 38
Copyright .......................................... 265
Business Planning / Feasibility ......... 228
Copyright Notice ............................... 265
C
Cost .................................................. 252
Categories .......................................... 16
Count Session .......... 18, 25, 77, 81, 139
Category............................................... 4
Count Session Impacted Functional
Size....................................... 115, 118
Change Registration Details................. 1
Count Sessions .................................. 77
Change Request ................................ 77
Change Requests ............................ 242
Changes introduced during the Project
Build to Implementation ................ 228
Create a new Template Function Group
........................................................ 33
Created ............................................ 143
CSV .................................................... 96
Changes to your Computer .............. 263
Ctrl+C ............................................... 136
Chinese ............................................ 153
Ctrl+N ............................................... 136
Clear All.............................................. 45
Ctrl+O ............................................... 136
CLOSE CURRENT........................... 147
Ctrl+P ............................................... 136
CNTR L .............................................. 45
Ctrl+S ............................................... 136
Compact ........................................... 147
Ctrl+V ............................................... 136
Compact Database........................... 147
Ctrl+X ............................................... 136
compress.......................................... 147
D
Configuration Control ....................... 201
Data.................................................... 24
Conversion ....................................... 201
©Copyright Total Metrics Pty Ltd 2010
250
Index
Data Attribute ................................... 109
DETs .................................................. 16
Data Element Types ........................... 16
Development Environment ................. 38
Data Function ................................... 109
Development Project Function Point
Count ............................................ 109
Data Group................................... 25, 64
Development Project Size ................ 115
Data Group Folder...................... 16, 203
Display Links ...................................... 58
Data Groups ....................................... 16
Down Arrow...................................... 136
Data Hierarchy Tree ........................... 16
Dutch ................................................ 153
Data Notes ....................................... 109
E
Data Tree ............................... 25, 27, 64
Early project estimation .................... 223
Default Complexity Count................. 219
Ease of Use...................................... 200
Defect Severity Level ......................... 38
edit tree nodes ................................. 139
Delete ........................................... 4, 136
EIF...................................................... 25
Delete Count Session....................... 201
Email ........................................ 109, 130
Derived ............................................... 27
English ............................................. 153
Description Reports .......................... 109
Enhancement Counts ........................... 2
DET .......................... 16, 24, 64, 67, 139
Enhancement Project Counts........... 115
Detail .................................................... 4
Detail Reports .................................. 109
Detailed Analysis and Tracking using
Notes and Attributes ....................... 41
Enhancement Project Function Point
Count ............................................ 109
Enquiries .......................................... 208
Esc ................................................... 136
Detailed Count ................................. 218
Estimating ........................................ 242
Detailed Linked and Flagged Count . 215
Detailed Linked Count ...................... 216
Estimating Project Resource
Requirements ............................... 252
Detailed Recording of Data Groups . 203
Evaluating Requirements ................. 252
©Copyright Total Metrics Pty Ltd 2010
251
SCOPE 3.0 Help User Manual
Version 1.0
Example Software Project .................... 4
Filter Set ........................................... 120
Excel .................................. 96, 109, 126
Find .................................................. 143
EXCEL template ................................. 96
First Function Point Count .................... 2
Exclusive ‘AND’ Filter ....................... 120
Flags and Filters ............................... 120
Expand ............................................. 140
FP Decision Maker ........................... 213
Export ................................... 89, 94, 126
FPA .................................................. 207
Export a Release ................................ 94
FPW ........................................... 99, 188
Export a Whole Tree or Part of a Tree 94
FPW 4 ................................................ 99
Export Count Session......................... 92
FPW 5 ................................................ 99
Export Release ................................... 94
FPW 6 ................................................ 99
Export to Metrics Repository .............. 91
FPW database ................................... 99
Export to SPR Knowledge Plan .......... 91
French .............................................. 153
Export Tree ................................ 94, 141
From Current Position .............. 109, 124
Export your Template Function Groups
...................................................... 149
FSM.................................................. 212
FTR .................................................... 67
Extended Length for Names and
Descriptions .................................. 204
Function ................................. 24, 27, 67
External File ....................................... 25
Function and Data Trees .................... 27
External Files ................................... 208
Function Attribute ............................. 109
F
Function Data ................................... 109
F2 ..................................................... 136
Function Hierarchy Tree ..................... 16
F5 ..................................................... 136
Function Notes ................................. 109
Filter ................................................. 120
Function Point Analysis .................... 207
Filter Mode ....................................... 120
Function Point Count Result Reports 109
©Copyright Total Metrics Pty Ltd 2010
252
Index
Function Point WORKBENCH ............ 99
ILF ...................................................... 25
Function Tree ..................................... 67
impact type ......................................... 77
Functional Components ................... 208
Impact Types.................................... 139
Functional Size Measurement .......... 212
Import ............................... 89, 94, 96, 99
Functions...................................... 16, 67
Import /Export a Whole Release ........ 94
G
Import /Export Whole Trees or Parts of
Trees .............................................. 94
General Characteristics ...................... 87
Import a Release ................................ 94
German ............................................ 153
Import a Whole Tree or Part of a Tree 94
Gold Padlock Icon .............................. 73
Import Count Session ......................... 92
Green ................................................. 77
Import from FPW ................................ 99
Green Padlock Icon ............................ 73
Import Release ................................... 94
Grey ................................................... 77
Import Tree................................. 94, 141
GSC ................................................... 89
GSCs.................................................. 87
Importing and Exporting Template
Function Groups ........................... 149
H
Input ................................................... 25
Hierarchies ......................................... 12
Inputs ............................................... 208
Hierarchy Tree ................................. 139
Inquiry ................................................ 25
Hierarchy Tree Reports .................... 109
Insert ........................................ 136, 139
Hierarchy Trees .................................. 16
Insert Template Function Group ......... 33
Hold .................................................. 201
Install ................................................ 263
I
Install SCOPE .................................. 263
IFPUG 4.2 Function Point Analysis .... 11
Installation ........................................ 263
IFPUG Terminology.......................... 109
Intended Audience ........................... 264
©Copyright Total Metrics Pty Ltd 2010
253
SCOPE 3.0 Help User Manual
Version 1.0
Internal File ........................................ 25
Link..................................................... 45
Internal Files ..................................... 208
Link Mode......................................... 120
ISBSG .......................................... 85, 91
Link Projects to Count Sessions......... 85
ISO standard 20926 and 14143-1 .... 210
Link Type............................................ 33
ISO/IEC 20926 IFPUG 4.1 unadjusted
...................................................... 264
Linked Tree List Reports .................. 109
Linked Tree Lists .............................. 109
ISO/IEC standard for Functional Size
Measurement 14143-1
Links ................................................... 45
1998................................................. 212
List of Applications ............................... 4
J
List of Software Applications .............. 70
Japanese.......................................... 153
lock a Release.................................... 13
K
Locked................................................ 73
Korean.............................................. 153
M
L
Machine............................................ 264
latest release ................................ 23, 73
Machine Requirements .................... 264
Left Arrow ......................................... 136
Main Screen ..................................... 133
Level 1.............................................. 215
mandatory column .............................. 96
Level 2.............................................. 216
Master SCOPE EXCEL Import Template
........................................................ 96
Level 3.............................................. 218
Level 4.............................................. 219
Master_SCOPE_Excel_Import_Templat
e.................................................... 203
Level 5.............................................. 220
Merging ............................................ 129
Level 6.............................................. 221
Metrics experts ................................. 226
License Registration ......................... 263
Microsoft ACCESS XP ..................... 263
lifecycle ............................................ 226
Modified............................................ 143
©Copyright Total Metrics Pty Ltd 2010
254
Index
MS Excel ............................................ 96
OR’ Filter .......................................... 120
MS Office® Image Writer ................. 129
Orange ............................................... 77
Multi-Lingual ............................... 13, 153
Other Releases .................................. 73
Multiplier ............................................. 27
Output ................................................ 25
N
Outputs............................................. 208
Negotiating Scope ............................ 252
P
new Measurement .............................. 23
Paradox .............................................. 99
New Project ........................................ 86
Paste Special ..................................... 96
new Release ...................................... 75
PDF .................................................. 129
NOT Apply........................................ 201
Phasing Development ...................... 252
NOT’ Filter ........................................ 120
Portfolio Size .................................... 109
Note Sets ........................................... 16
Portuguese ....................................... 153
Notes .................................. 4, 16, 24, 41
Preview .................................... 109, 124
Notes Attribute ................................. 109
Previewing and Printing Reports ...... 124
Notes Data ....................................... 109
printing ............................................. 109
Notes Function ................................. 109
Process/Transaction Verbs ................ 33
Notes Hierarchy Tree ......................... 16
Processes .......................................... 16
Notes Tree ......................................... 57
Production Release ............................ 18
nstall SCOPE ................................... 263
Production Releases ...................... 4, 73
O
Project ................................................ 85
Office ................................................ 126
Project and Applications List ............ 118
Ongoing Project Monitoring .............. 228
Project Delivery Rate.......................... 85
Online Reporting .............................. 205
Project Details .................................... 85
©Copyright Total Metrics Pty Ltd 2010
255
SCOPE 3.0 Help User Manual
Version 1.0
Project Details Report ........................ 85
Reporting the Functional Size in
Function Points ............................. 118
Project Details Report. ....................... 86
Reports..................................... 130, 205
Project Development Count ................. 2
Requirements Specification Stage ... 228
Project Implementation..................... 228
response times ................................. 147
Project List ......................................... 85
Restructuring ...................................... 38
Project Team ...................................... 38
R
RET ................................ 16, 24, 64, 139
RETs .................................................. 16
Rating ................................................. 87
Reverse ............................................ 149
READ ONLY .................................. 4, 45
Record Element Types ....................... 16
Reversing the Order of the Verb and
Nouns in Template Function Group
...................................................... 149
References ....................................... 258
Rework ....................................... 77, 251
Release Baseline Functional Size ... 115,
118
Release Impacted Functional Size .. 115,
118
rework factor ...................................... 77
right Arrow ........................................ 136
Risk Assessment .............................. 252
Release Rework ............................... 109
Rough Count .................................... 220
Release Rework Repor ...................... 77
S
Release Reworked Functional Size. 115,
118
Save As Type ..................................... 96
Release Status ................................... 73
SCOPE Corporate .............................. 13
Replace ............................................ 143
SCOPE EXCEL template ................... 96
Report ...................................... 109, 128
Scope Manager ........................ 228, 239
Report Selection ....................... 109, 126
Scope Managers .............................. 226
Reporting Selection ............................ 25
SCOPE Professional .......................... 13
SCOPE ProxyTM ............................. 221
©Copyright Total Metrics Pty Ltd 2010
256
Index
SCOPE Viewer ................................. 100
T
Search .............................................. 143
Template Function Groups ................. 33
Select Flagged Nodes .............. 109, 124
Template Setup Options............. 33, 149
Serial Number .................................. 1, 9
To Flagged Nodes .............................. 45
Session .............................................. 77
Toolbar ............................................. 146
Set All ................................................. 45
Tracks Rework for Enhancement ..... 203
Shift Down Arrow ............................. 136
Training .............................................. 19
Shift Up Arrow .................................. 136
Tutorials ........................................... 147
Shortcuts .......................................... 136
Type of Impact ................................... 77
Size Approximation .......................... 221
U
Snapshot ............................................ 94
UFP .................................................. 210
SnapShot Viewer ............................. 129
Unadjusted Function Point Count ..... 210
Snapviewer ...................................... 130
Unflagged Nodes ............................... 45
Software Application........................... 70
Unlocked ............................................ 73
Software Applications List .................... 4
Up Arrow .......................................... 136
SORT ............................................... 144
Update.................................................. 4
Space bar ......................................... 136
update rights ................................ 23, 73
Specification Quality ........................... 38
UPDATED .......................................... 45
SPR Knowledge Plan ......................... 91
V
Start.................................................. 1, 2
VAF .................................................... 89
Start Scope .......................................... 1
Value Adjustment Factor ........ 25, 87, 89
Status Line ....................................... 145
Verbs .................................................. 33
Supplier Selection Stage .................. 228
Version ............................................. 265
©Copyright Total Metrics Pty Ltd 2010
257
SCOPE 3.0 Help User Manual
Version 1.0
W
Weighting of Functional Components
...................................................... 210
Windows Vista .................................. 264
Windows XP ..................................... 264
WORD ...................................... 109, 126
Work In Progress Release ............. 2, 73
Work in Progress Releases ...... 4, 18, 73
WORKBENCH ........................... 99, 172
SCOPE Viewer ................................ 131
©Copyright Total Metrics Pty Ltd 2010
258
©Copyright Total Metrics Pty Ltd 2010
259