1
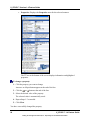
Using Context Menus
Chapter 4
Using Context Menus
There are several different areas of the X_STUDY™ screen that have context menus:
•
Chart area context menu: Right-click an open area on the graph or data.
•
Chart context menu: Right-click the bar, line, candlestick or dot representing
the contract data.
•
Daily Value box context men: Right-click the Daily Value box in the upper
left corner.
•
Titlebar context menu: Right-click the top of the window where the title is
displayed.
•
Execution Control Panel context menu: Right-click an empty area.
•
Execution Grid context menu: Right-click the Price column.
•
Price axis context menu: Right-click the vertical axis.
•
Technical Indicator context menu: Right-click the technical indicator data
lines.
•
Time axis context menu: Right-click the horizontal axis.
•
Trendline context menu: Right-click the drawn trendline.
•
Price Distribution context menu: Right-click the Price Distribution graph or
data.
Trading Technologies
Trading Technologies International, Inc. Proprietary and Confidential Information
57