1
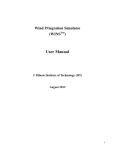
User’s Manual F2 Calculator A metering component for thermal energy applications Rev 08.24.2007 1 Installation 1.1 At delivery F2 calculators are delivered in the Transport Mode. Only the clock is active and no measurements can take place in this mode. The Transport Mode is indicated by a "no" in the upper left hand corner of the display screen. Before beginning installation, the meter needs to be set to operating mode. To move the F2 out of transport mode, simply press and hold the display button for approximately five seconds. Depending on the factory settings of the calculator, it will then enter either Service Mode, or go directly into Operation Mode. You can tell which mode the calculator has entered by looking at the upper left hand portion of the display window – “no” will have been replaced by “00” when entered into Service Mode, or “10” if entered into Operation Mode. If your calculator goes into Service mode, please refer to section 4 for further details. Note: In order to complete the installation the F2 must be set to “Operation Mode”. Fig. 1.1a, Transport Mode 1.2 Connections The screw terminal blocks are located under the plastic cover on the rear side of the calculator. Note: a seal protects the cover’s retaining screws. Fig. 1, Connection terminal F2 3V Kt 0 F F R R P1 0 P2 A A1 B1 11 5 6 7 8 16 17/19 18 50 60 61 9 MBus MBus 24 25 This Calc ulator is equppped with pulse outputs Fig. 6, Numbering according to EN1434 9 10 11 5 6 7 8 16 17/19 18 60 61 24 25 4 Labels on the on the backside of the F2 cover. Terminal Block Marking 3V Kt 0 F F R R P1 0 P2 A1 B1 MBUS MBUS Description Flow sensor power supply (+) Flow sensor (+) Flow sensor (-) High temperature sensor (H) High temperature sensor (H) Low temperature sensor (L) Low temperature sensor (L) Pulse input/output 1 (+) Pulse input/output 1 and 2 (-) Pulse input/output 2 (+) Siox input (option) Siox input (option) M-Bus input M-Bus input 2 Mounting The F2 can be mounted either on a wall, or on the flow meter itself. 2.1 Mounting on a flow sensor The adapter allows the calculator to be mounted vertically or horizontally, see fig 2.1. Attach the calculator to the adapter with the provided retaining screw. 1. Screw for attaching the adapter 2. Guide rails 3. Adapter 2.2 Wiring 1. 2. 3. Fig 2.1 The F2 has six holes for connecting cables. To ensure proper sealing, it is vital that the diameters of cables are of the following gauges: 2 1 1. Flow sensor and temperature sensor: 16-18 gauge. 2. Spare (communication) 16-18 gauge. Fig. 2.2 2.3 Dimensions All dimensions are in [mm]. Fig. 2.3b, Wall Adapter 5 2.4 Installation test When installation has been completed, a simple test can be done to verify that the calculator has been installed correctly. Watch the very lower left hand corner of the main display. If the flow sensor is supplying a pulse, it will result in a blinking square. If the F2 is receiving a pulse from the flow meter, then installation has been a success. Now is also a good time to become familiar with recognizing and cycling through the display sequences provided by the F2. Simply press and hold the “Display” button on the front of the calculator. 2.5 Instantaneous values Calculations for instantaneous power (display sequence ”20”) and instantaneous flow (display sequence ”21”) follow these rules: As long as the time between the flow sensor pulses is longer than five seconds, flow and power are calculated and displayed for each flow sensor pulse. When the time between pulses is less than five seconds, the pulses are added together for approximately five seconds and then displayed. 6 3 Handling 3.1 Display Every F2 is equipped with an LCD (Liquid Crystal Display). The data retrieved by the calculator is organized and accessible through display “sequences” visible on the LCD. The left-most digits indicate the current selected sequence. The right-hand digits show the relevant value for the currently selected sequence. A tap of the display button results in a move to the next value in the your current sequence. To change to a new sequence, press and hold the Display button until the left-hand digits starts to increment. Release the button at the desired sequence. The right-hand digits will now display the values and readings related to your newly selected sequence. If you wish to return the display to the original sequence, simply do not press the display button for ~60 seconds. The display is configured as below: 1. Sequence digits 2. Flow sensor pulse indicator 3. Relevant value shown here, maximum 7 digits 4. Arrow that indicates unit for displayed value m³ °C m³/h kW OPTO interface F2 Made in Sweden Nr: 000433 Display button HOLD 10 11 xx 16 20 xx xx 70 xx PUSH Fig. 3.6.1.1, Tap to toggle to next value. Press and hold to enter next sequence. 3.2 10 11 12 13 14 15 16 20 21 22 23 24 30 31 32 33 34 35 36 37 40 41 42 43 44 45 46 47 4x 50 51 52 53 60 A0 bx 63 64 70 73 74 75 1 8 Display sequence table Accumulated energy (Default position) Accumulated volume according to flow sensor1 Display test, see fig.3.2 Accumulated volume for pulse input 1 Accumulated volume for pulse input 2 Error code, see Error code Error time, [Minutes] Momentary power Momentary flow High temperature, 0 decimals Low temperature, 0 decimals Temperature difference, 1 decimal Account days, when values are stored, [YYMMDD] Account days, Accumulated energy Account days, Accumulated volume according to flow sensor Account days, Accumulated volume according to energy calculation Account days, Accumulated volume pulse input 1, [gal] Account days, Accumulated volume pulse input 2, [gal] Possible error code, at time of storage of account days Possible accumulated error time, at the time of storage account days, [Minutes] Monthly registers, date when values are stored, [YYMMDD] Monthly registers, Accumulated energy Monthly registers, Accumulated volume according to flow sensor Monthly registers, Accumulated volume according to energy calculation Monthly registers, Accumulated volume pulse input 1, [m3] Monthly registers, Accumulated volume pulse input 2, [m3] Possible error code, at time of storage of monthly register Possible accumulated error time, at the time of storage, [Minutes] Following monthly registers (loop back) Operating time, [Hours] Relevant date, [YYMMDD] Relevant time, [HH.MM] Recommended date for battery replacement, [YYMMDD] Communication address, Primary address Communication address, Secondary address (normally same as meter S/N) Calculator serial number (S/N) Pulse value [l/p] Placing of flow sensor, [H/L], L = Low, H = High Accumulated volume corresponding to accumulated energy Last remote reading of accumulated energy Time since latest remote reading of accumulated energy, [Hours] Accumulated total error time, [Minutes] The calculator has two values for accumulated volume. Sequence 11 is calculated relative to flow pulses. Value 70 is incremented in conjunction with energy calculation. Error codes Error codes are shown in display sequence ”15”. Code 0001 0002 0004 0008 0005 000A 0040 0100 Description Break in low temperature sensor (L) Short circuit in low temperature sensor (L) Break in high temperature sensor (H) Short circuit in high temperature sensor (H) Error code combination 0001 + 0004 Error code combination 0002 + 0008 Low flow Battery replacement recommended Display sequence “15” - error codes 9 4 Service Note: Do not attempt to change any values until you have read and understand all sections of this manual. If you have any questions, please contact TCT before attempting to access or alter any values in this mode. After installing the F2, please bypass this mode by skipping through to the exit sequence as shown below in table 4.1 As mentioned in section 1, most calculators will enter the Service Mode upon installation and exit of the Transport Mode. The Service Mode allows for changes to certain parameters of the calculator. If you wish to re-enter the Service Mode, use the following steps: 1. Break the seal to the Service button (fig 3.2) on the rear side of the calculator with a small screwdriver. 2. Press and hold down the Display button on the front of the calculator. 3. While holding the Display button pressed, use the screwdriver to press and hold the Service button. 4. Keep the Service button and Display button pressed for ~5 seconds. 5. First release the Display button, then release the Service button. The calculator is now in the Service mode, and the display will show ”00” in the upper left-hand corner as confirmation. To leave the Service mode follows the same procedure described above. Navigating through the Service sequence and changing values This is similar to cycling through the F2’s main LCD sequences as discussed in section 3. Tapping the Display button alters the value for the blinking digit. To change to the next digit, hold the Display button pressed until next digit starts to blink. To change to the Service sequence hold, the Display button pressed until next service sequence is reached (indicated by the left-hand digits). Note: The changed values are not saved until the next sequence is displayed. Service Sequences 2.1.0 Time ”00” is the real time clock, with the right hand digits representing the format HHMM. 2.2.1 Date ”01” the relevant date in the format YYMMDD 2.2.2 Pulse value ”02” and ”03” indicate pulse values. ”02” is the sequence for the pulse value itself and ”03” denotes the number of decimals applied for the pulse value. Example 1 The pulse value shall be 2.5 [l/p]. “02” shall be 2500, and ”03” shall be 3. E.g. 2500 with 3 decimals = 2.5 [l/p]. Example 2 The pulse value shall be 10 [l/p]. “02” = 1000, ”03” = 2. E.g. 10 [l/p]. 2.2.3 Account days ”04” and ”05” are account days with the format MMDD. F2 calculators can store up to two. To deactivate the account days set MMDD to “0000”. For most applications, this sequence can be skipped. 2.2.4 Communication address ”06” is the communication address. The address is set with four digits. Skip this sequence unless intending to implement a remote reading device, such as Mcomm. 2.2.5 Flow sensor placing ”08” sets flow sensor placing, format ”0” or ”1”. 0 = Flow sensor installed in low (cold) 1 = Flow sensor installed in high (hot) 2.2.6 Reset the accumulated error time ”07” is the reset value for accumulated error time. Format “0 or “1”. 0 = Reset error time 1 = Do not reset error time 2.2.7 Recommended date for battery replacement ”09” sets the battery replacement date, format YYMMDD. 2.2.A Exit service mode ”0A” allows you to exit the service mode depending on which value is set: 0 = Return to sequence “00” 1 = Exit Service Sequence 4.1 Service sequence table Service sequence 00 01 02 03 04 05 06 Description Table 4.1, Service sequence, Servic e Time [hhmm] Date [YYYMMDD] Pulse value for flow meter, without decimal placing, 4 digits Service button Pulse value decimal placing, 0-4 Account days 1, MMDD Test Account days 2, MMDD Primary communication address, set with 3 digits, e.g. ”5” is set ”005”. Reset stored error time 0 = Reset stored error time (default) Fig. 3.2a, Service button 1 = Do not reset error time Flow sensor placing, 0 = Installed at low end (L / cold) 1 = Installed at high end (H / hot) Recommended battery replacement date. Do not change without consulting with TCT Solar. Exit service sequence, 1 = EXIT 2 = return to service sequence ”00” Save data 07 08 09 0A 12 5 Seals 1. 2. 3. 4. Service seal Test seal Electronic seals Installation seals 1 SV SV SV SV 3 SV 4 13 6 Technical data 6.1 Power supply Battery 3V – 2.2Ah Maximum operation time: 10 yrs Table 7.1, Power supply 6.2 Temperature sensors Approved and matching pairs of temperature sensors of the type Pt 100 or Pt 500 are to be used, with a maximum current of 4 A for PT100. Cable area [gauge] Maximum cable length for PT100 sensors [ft] 24 20 18 15 Table 7.2, Cable areas for PT100 6.3 8.2 16.4 24.6 49.2 Flow sensors Flow sensor with pulse output. Max. frequency [Hz] 12 Pulse value range [l/p] 0.0001-9999 Min. pulse length [ms] 40 Max. voltage [V] 3 Max. cable length [ft] 49.2 Table 7.2, Technical specifications 6.4 Temperature range Temperature range Temperature difference Table 7.4, Temperature range 6.5 0 - 374°F 2 – 120K Ambient temperature & temperature class F2 complies with the prerequisites for Environmental Class C according to EN1434. Ambient temperature storage/transport -4°F to 158°F Ambient temperature operation 41°F to 131°F Table 7.5, Ambient temperature ranges 6.6 Flow sensor placing F2 can be configured for flow sensor placement in high or low end of the pipe (supply or return pipe). This is marked H = high (hot) or L = low (cold) in display sequence “64”. 6.7 Maximum values for power The values below represent MWh and standard decimal setting Pulse value [l/p] Maximum power [ MW ] 1.0 3.3 10.0 33.0 100.0 330.0 2.5 3.3 25.0 33.0 250.0 330.0 Table 7.7, maximum power displays relative to pulse values 6.8 Dynamic behavior Instantaneous measurements are calculated for each flow sensor pulse, when the time between the pulses is five (5) seconds or longer. If the time between pulses is less than five seconds, measurements takes place every pulse and are added for 5 seconds. When the period between the flow sensor pulses exceeds 60 seconds, a measurement takes place every 60th second. For this kind of measurement, only the temperature is updated. 6.9 Data output interface M-Bus acc. to Via OPTO-interface (EN60870-5) EN1434-3 bus connection (terminals) Table 7.9, data output interfaces 16 6.10 Pulse outputs F2 can be equipped with two pulse outputs for Energy (pulse output 1) and Volumetric values (pulse output 2). The last digit and unit of energy will determine pulse weight. Example: sequence “10” (energy) on display is shown “1001.01” MWh => pulse weight = 0.01 MWh/pulse. Pulse output 1 Energy - one pulse per display update in the energy register (sequence “10”). Pulse output 2 Volume - one pulse per display update in the flow register (sequence “11”). Pulse value [ms] Voltage [V] Maximum current [µA] Table 7.10, Pulse output data 250 3 – 30 20 + 3V 6.11 Pulse inputs Standard F2s are equipped with two pulse inputs. The pulse inputs can be used for measuring another meter equipped with pulse outputs. The pulse inputs can be set as volume registers. These registers accumulate the pulses into two volume registers with the value [gal]. Frequency Min. pulse duration Max. Voltage Table 7.11, Pulse inputs [Hz] [ms] [V] 12 40 3 6.12 Alarm output The F2 is equipped with one alarm output. The alarm output sends a pulse every hour as long as an error code exists. The pulse duration 250 [ms] can be altered using the “Service program” version 2 or higher in 125 [ms] increments. Alarm frequency when an error exists Pulse [ms] Once every hour 250 17 7 Appendix Displayed values on the F2 calculator will vary depending on the set pulse value, and follow the diagram below. Smaller pulse values result in readings to more decimal places than larger pulse values. 7.1 Decimal placing F2 The decimal setting for F2 follows utility standards. Pulse value [l/p] MWh GJ m³ KWh MBTU kW m³/h 1.0 0.001 0.001 0.001 0.1 0.001 0.01 0.001 10 0.01 0.01 0.01 1 0.01 0.1 0.01 100 0.1 0.1 0.1 - 0.1 1 0.1 1000 1 1 1 - 1 1 1 2.5 0.001 0.01 0.01 0.1 0.01 0.01 0.001 25 0.01 0.1 0.1 1 0.1 0.1 0.01 250 0.1 1 1 - 1 1 0.1 2500 1 1 1 - 1 1 1 Table A1 7.1.1 Decimal placing Pulse value [l/p] m³ 1.0 0.001 10 0.01 100 0.1 1000 1 2.5 0.01 25 0.1 250 1 2500 1 7.2 Ordering Key F2 ABCDEFGHIJ KLM A A A A B B 1 2 5 6 1 2 Pt100 2-wire measurement, flow in low temperature Pt100 2-wire measurement, flow in high temperature Pt500 2-wire measurement, flow in low temperature Pt500 2-wire measurement, flow in high temperature Battery supply Bus supply B C C C C C C C C C D C C D D D D E E F F F F F F F F G G G G H H H H H I J K L M 5 0 1 2 3 4 5 6 7 8 A B C 0 1 2 3 S 1 2 3 5 6 7 8 9 0 1 4 5 0 1 2 3 4 1 1 0 0 24 VAC Kt Input 2.5 l/p Kt Input 25 l/p Kt Input 250 l/p Kt Input 2500 l/p Kt Input 1 l/p Kt Input 10 l/p Kt Input 100 l/p Kt Input 1000 l/p KWh MWh GJ MBTU Standard order Special, Extra information at the order, e.g. customer information Pulse Inputs, 2.5 l/p, dec. 2 Pulse Inputs, 25 l/p, dec. 1 Pulse Inputs, 250 l/p, dec. 0 Pulse Inputs, 1 l/p, dec. 3 Pulse Inputs, 10 l/p, dec. 2 Pulse Inputs, 100 l/p, dec. 1 Pulse Inputs, 1000 l/p, dec. 0 Pulse Outputs Backlight on display (not recommended on battery supplied meters) No Backlight For wall mounting, with adapter incl. Compact mounted with Hydrometer BR431 Compact mounted with other flow sensor, with adapter incl. With adapter for BR471 With out adapter Standard Standard Country code, 3 = Standard English Standard Standard Pt100 2-wire measurement, flow in low temperature Pt100 2-wire measurement, flow in high temperature Pt500 2-wire measurement, flow in low temperature Pt500 2-wire measurement, flow in high temperature Battery supply Bus supply 19 www.tctsolar.com [email protected] 101 Copeland Street Jacksonville, Florida 32204 Phone: 904.358.3720 | Fax: 904.358.3728