1
LabVIEW
TM
PID Control Toolkit User Manual
PID Control Toolkit User Manual
June 2008
372192C-01
Support
Worldwide Technical Support and Product Information
ni.com
National Instruments Corporate Headquarters
11500 North Mopac Expressway
Austin, Texas 78759-3504
USA Tel: 512 683 0100
Worldwide Offices
Australia 1800 300 800, Austria 43 662 457990-0, Belgium 32 (0) 2 757 0020, Brazil 55 11 3262 3599,
Canada 800 433 3488, China 86 21 5050 9800, Czech Republic 420 224 235 774, Denmark 45 45 76 26 00,
Finland 358 (0) 9 725 72511, France 01 57 66 24 24, Germany 49 89 7413130, India 91 80 41190000,
Israel 972 3 6393737, Italy 39 02 41309277, Japan 0120-527196, Korea 82 02 3451 3400,
Lebanon 961 (0) 1 33 28 28, Malaysia 1800 887710, Mexico 01 800 010 0793, Netherlands 31 (0) 348 433 466,
New Zealand 0800 553 322, Norway 47 (0) 66 90 76 60, Poland 48 22 3390150, Portugal 351 210 311 210,
Russia 7 495 783 6851, Singapore 1800 226 5886, Slovenia 386 3 425 42 00, South Africa 27 0 11 805 8197,
Spain 34 91 640 0085, Sweden 46 (0) 8 587 895 00, Switzerland 41 56 2005151, Taiwan 886 02 2377 2222,
Thailand 662 278 6777, Turkey 90 212 279 3031, United Kingdom 44 (0) 1635 523545
For further support information, refer to the Technical Support and Professional Services appendix. To comment
on National Instruments documentation, refer to the National Instruments Web site at ni.com/info and enter
the info code feedback.
© 1996–2008 National Instruments Corporation. All rights reserved.
Important Information
Warranty
The media on which you receive National Instruments software are warranted not to fail to execute programming instructions, due to defects
in materials and workmanship, for a period of 90 days from date of shipment, as evidenced by receipts or other documentation. National
Instruments will, at its option, repair or replace software media that do not execute programming instructions if National Instruments receives
notice of such defects during the warranty period. National Instruments does not warrant that the operation of the software shall be
uninterrupted or error free.
A Return Material Authorization (RMA) number must be obtained from the factory and clearly marked on the outside of the package before any
equipment will be accepted for warranty work. National Instruments will pay the shipping costs of returning to the owner parts which are covered by
warranty.
National Instruments believes that the information in this document is accurate. The document has been carefully reviewed for technical accuracy. In
the event that technical or typographical errors exist, National Instruments reserves the right to make changes to subsequent editions of this document
without prior notice to holders of this edition. The reader should consult National Instruments if errors are suspected. In no event shall National
Instruments be liable for any damages arising out of or related to this document or the information contained in it.
EXCEPT AS SPECIFIED HEREIN, NATIONAL INSTRUMENTS MAKES NO WARRANTIES, EXPRESS OR IMPLIED, AND SPECIFICALLY DISCLAIMS ANY WARRANTY OF
MERCHANTABILITY OR FITNESS FOR A PARTICULAR PURPOSE. CUSTOMER’S RIGHT TO RECOVER DAMAGES CAUSED BY FAULT OR NEGLIGENCE ON THE PART OF NATIONAL
INSTRUMENTS SHALL BE LIMITED TO THE AMOUNT THERETOFORE PAID BY THE CUSTOMER. NATIONAL INSTRUMENTS WILL NOT BE LIABLE FOR DAMAGES RESULTING
FROM LOSS OF DATA, PROFITS, USE OF PRODUCTS, OR INCIDENTAL OR CONSEQUENTIAL DAMAGES, EVEN IF ADVISED OF THE POSSIBILITY THEREOF. This limitation of
the liability of National Instruments will apply regardless of the form of action, whether in contract or tort, including negligence. Any action against
National Instruments must be brought within one year after the cause of action accrues. National Instruments shall not be liable for any delay in
performance due to causes beyond its reasonable control. The warranty provided herein does not cover damages, defects, malfunctions, or service
failures caused by owner’s failure to follow the National Instruments installation, operation, or maintenance instructions; owner’s modification of the
product; owner’s abuse, misuse, or negligent acts; and power failure or surges, fire, flood, accident, actions of third parties, or other events outside
reasonable control.
Copyright
Under the copyright laws, this publication may not be reproduced or transmitted in any form, electronic or mechanical, including photocopying,
recording, storing in an information retrieval system, or translating, in whole or in part, without the prior written consent of National
Instruments Corporation.
National Instruments respects the intellectual property of others, and we ask our users to do the same. NI software is protected by copyright and other
intellectual property laws. Where NI software may be used to reproduce software or other materials belonging to others, you may use NI software only
to reproduce materials that you may reproduce in accordance with the terms of any applicable license or other legal restriction.
Trademarks
National Instruments, NI, ni.com, and LabVIEW are trademarks of National Instruments Corporation. Refer to the Terms of Use section
on ni.com/legal for more information about National Instruments trademarks.
Members of the National Instruments Alliance Partner Program are business entities independent from National Instruments and have no agency,
partnership, or joint-venture relationship with National Instruments.
Patents
For patents covering National Instruments products, refer to the appropriate location: Help»Patents in your software, the patents.txt file
on your media, or ni.com/patents.
WARNING REGARDING USE OF NATIONAL INSTRUMENTS PRODUCTS
(1) NATIONAL INSTRUMENTS PRODUCTS ARE NOT DESIGNED WITH COMPONENTS AND TESTING FOR A LEVEL OF
RELIABILITY SUITABLE FOR USE IN OR IN CONNECTION WITH SURGICAL IMPLANTS OR AS CRITICAL COMPONENTS IN
ANY LIFE SUPPORT SYSTEMS WHOSE FAILURE TO PERFORM CAN REASONABLY BE EXPECTED TO CAUSE SIGNIFICANT
INJURY TO A HUMAN.
(2) IN ANY APPLICATION, INCLUDING THE ABOVE, RELIABILITY OF OPERATION OF THE SOFTWARE PRODUCTS CAN BE
IMPAIRED BY ADVERSE FACTORS, INCLUDING BUT NOT LIMITED TO FLUCTUATIONS IN ELECTRICAL POWER SUPPLY,
COMPUTER HARDWARE MALFUNCTIONS, COMPUTER OPERATING SYSTEM SOFTWARE FITNESS, FITNESS OF COMPILERS
AND DEVELOPMENT SOFTWARE USED TO DEVELOP AN APPLICATION, INSTALLATION ERRORS, SOFTWARE AND HARDWARE
COMPATIBILITY PROBLEMS, MALFUNCTIONS OR FAILURES OF ELECTRONIC MONITORING OR CONTROL DEVICES,
TRANSIENT FAILURES OF ELECTRONIC SYSTEMS (HARDWARE AND/OR SOFTWARE), UNANTICIPATED USES OR MISUSES, OR
ERRORS ON THE PART OF THE USER OR APPLICATIONS DESIGNER (ADVERSE FACTORS SUCH AS THESE ARE HEREAFTER
COLLECTIVELY TERMED “SYSTEM FAILURES”). ANY APPLICATION WHERE A SYSTEM FAILURE WOULD CREATE A RISK OF
HARM TO PROPERTY OR PERSONS (INCLUDING THE RISK OF BODILY INJURY AND DEATH) SHOULD NOT BE RELIANT SOLELY
UPON ONE FORM OF ELECTRONIC SYSTEM DUE TO THE RISK OF SYSTEM FAILURE. TO AVOID DAMAGE, INJURY, OR DEATH,
THE USER OR APPLICATION DESIGNER MUST TAKE REASONABLY PRUDENT STEPS TO PROTECT AGAINST SYSTEM FAILURES,
INCLUDING BUT NOT LIMITED TO BACK-UP OR SHUT DOWN MECHANISMS. BECAUSE EACH END-USER SYSTEM IS
CUSTOMIZED AND DIFFERS FROM NATIONAL INSTRUMENTS' TESTING PLATFORMS AND BECAUSE A USER OR APPLICATION
DESIGNER MAY USE NATIONAL INSTRUMENTS PRODUCTS IN COMBINATION WITH OTHER PRODUCTS IN A MANNER NOT
EVALUATED OR CONTEMPLATED BY NATIONAL INSTRUMENTS, THE USER OR APPLICATION DESIGNER IS ULTIMATELY
RESPONSIBLE FOR VERIFYING AND VALIDATING THE SUITABILITY OF NATIONAL INSTRUMENTS PRODUCTS WHENEVER
NATIONAL INSTRUMENTS PRODUCTS ARE INCORPORATED IN A SYSTEM OR APPLICATION, INCLUDING, WITHOUT
LIMITATION, THE APPROPRIATE DESIGN, PROCESS AND SAFETY LEVEL OF SUCH SYSTEM OR APPLICATION.
Contents
About This Manual
Conventions ...................................................................................................................ix
Related Documentation..................................................................................................x
Chapter 1
Overview of the PID Control Toolkit
PID Control....................................................................................................................1-1
Fuzzy Logic ...................................................................................................................1-2
How Do the Fuzzy Logic VIs Work?..............................................................1-2
Chapter 2
PID Algorithms
The PID Algorithm ........................................................................................................2-1
Implementing the PID Algorithm with the PID VIs .......................................2-2
Error Calculation...............................................................................2-2
Proportional Action...........................................................................2-2
Trapezoidal Integration .....................................................................2-2
Partial Derivative Action ..................................................................2-2
Controller Output ..............................................................................2-3
Output Limiting.................................................................................2-3
Gain Scheduling ..............................................................................................2-4
The Advanced PID Algorithm .......................................................................................2-4
Error Calculation .............................................................................................2-4
Proportional Action .........................................................................................2-5
Trapezoidal Integration ...................................................................................2-6
The Autotuning Algorithm ............................................................................................2-7
Tuning Formulas .............................................................................................2-8
Chapter 3
Using the PID Software
Designing a Control Strategy.........................................................................................3-1
Setting Timing .................................................................................................3-2
Tuning Controllers Manually ..........................................................................3-4
Closed-Loop (Ultimate Gain) Tuning Procedure..............................3-4
Open-Loop (Step Test) Tuning Procedure........................................3-5
© National Instruments Corporation
v
PID Control Toolkit User Manual
Contents
Using the PID VIs ......................................................................................................... 3-7
The PID VI...................................................................................................... 3-7
Fault Protection................................................................................. 3-8
The PID Advanced VI..................................................................................... 3-8
Bumpless Automatic-to-Manual Transfer ........................................ 3-9
Multi-Loop PID Control ................................................................................. 3-9
Setpoint Ramp Generation .............................................................................. 3-10
Filtering Control Inputs................................................................................... 3-12
Gain Scheduling .............................................................................................. 3-12
Control Output Rate Limiting ......................................................................... 3-14
The PID Lead-Lag VI ..................................................................................... 3-14
Converting Between Percentage of Full Scale and Engineering Units........... 3-15
Using the PID Autotuning VI and the Autotuning Wizard............................. 3-15
Using PID on FPGA Targets......................................................................................... 3-18
Implementing a Single-Channel PID on FPGA Targets ................................. 3-19
Implementing a Multi-Channel PID on FPGA Targets .................................. 3-19
Initialization Loop on the Host VI.................................................... 3-20
Processing Loop on the Host VI....................................................... 3-20
Using PID with DAQ Devices ...................................................................................... 3-21
Software-Timed DAQ Control Loop .............................................................. 3-22
Implementing Advanced DAQ VIs in Software-Timed DAQ Control
Loops ........................................................................................................... 3-23
Hardware-Timed DAQ Control Loop ............................................................ 3-24
Chapter 4
Overview of Fuzzy Logic
What is Fuzzy Logic?.................................................................................................... 4-1
Types of Uncertainty ..................................................................................................... 4-2
Modeling Linguistic Uncertainty with Fuzzy Sets........................................................ 4-2
Linguistic Variables and Terms..................................................................................... 4-5
Rule-Based Systems ...................................................................................................... 4-6
Implementing a Linguistic Control Strategy ................................................................. 4-7
Structure of the Fuzzy Logic Vehicle Controller .......................................................... 4-12
Fuzzification Using Linguistic Variables ....................................................... 4-13
Using IF-THEN Rules in Fuzzy Inference ..................................................... 4-15
Using Linguistic Variables in Defuzzification................................................ 4-17
Chapter 5
Fuzzy Controllers
Structure of a Fuzzy Controller ..................................................................................... 5-1
Closed-Loop Control Structures with Fuzzy Controllers.............................................. 5-2
I/O Characteristics of Fuzzy Controllers....................................................................... 5-6
PID Control Toolkit User Manual
vi
ni.com
Contents
Chapter 6
Design Methodology
Design and Implementation Process Overview .............................................................6-1
Acquiring Knowledge .....................................................................................6-1
Optimizing Offline ..........................................................................................6-1
Optimizing Online ...........................................................................................6-2
Implementing...................................................................................................6-2
Defining Linguistic Variables........................................................................................6-2
Number of Linguistic Terms ...........................................................................6-2
Standard Membership Functions.....................................................................6-3
Defining a Fuzzy Logic Rule Base ................................................................................6-6
Operators, Inference Mechanism, and the Defuzzification Method ..............................6-8
Chapter 7
Using the Fuzzy Logic Controller Design VI
Overview........................................................................................................................7-1
Project Manager .............................................................................................................7-2
Fuzzy-Set-Editor ............................................................................................................7-3
Rulebase Editor..............................................................................................................7-14
Documenting Fuzzy Control Projects............................................................................7-15
Test Facilities .................................................................................................................7-15
Chapter 8
Implementing a Fuzzy Controller
Pattern Recognition Application Example ....................................................................8-1
Fuzzy Controller Implementation ..................................................................................8-8
Loading Fuzzy Controller Data .....................................................................................8-9
Saving Controller Data with the Fuzzy Controller ........................................................8-11
Testing the Fuzzy Controller .........................................................................................8-13
Appendix A
Technical Support and Professional Services
Glossary
Index
© National Instruments Corporation
vii
PID Control Toolkit User Manual
About This Manual
This manual describes the LabVIEW PID Control Toolkit. The
PID Control Toolkit includes VIs for Proportional-Integral-Derivative
(PID) and Fuzzy Logic control. You can use these VIs with input/output
(I/O) functions such as data acquisition (DAQ) to implement control of
physical processes.
Conventions
The following conventions appear in this manual:
»
The » symbol leads you through nested menu items and dialog box options
to a final action. The sequence File»Page Setup»Options directs you to
pull down the File menu, select the Page Setup item, and select Options
from the last dialog box.
This icon denotes a note, which alerts you to important information.
bold
Bold text denotes items that you must select or click in the software, such
as menu items and dialog box options. Bold text also denotes parameter
names, controls and buttons on the front panel, dialog boxes, sections of
dialog boxes, menu names, and palette names.
italic
Italic text denotes variables, linguistic terms, emphasis, a cross-reference,
or an introduction to a key concept. Italic text also denotes text that is a
placeholder for a word or value that you must supply.
monospace
Text in this font denotes text or characters that you should enter from the
keyboard, sections of code, programming examples, and syntax examples.
This font is also used for the proper names of disk drives, paths, directories,
programs, subprograms, subroutines, device names, functions, operations,
filenames, and extensions.
© National Instruments Corporation
ix
PID Control Toolkit User Manual
About This Manual
Related Documentation
The following documents contain information you might find helpful as
you read this manual:
•
LabVIEW Help, availably by launching LabVIEW and selecting
Help»Search the LabVIEW Help.
•
LabVIEW FPGA Module documentation.
•
LabVIEW Real-Time Module documentation.
•
LabVIEW Control Design and Simulation Module documentation.
Note The following resources offer useful background information on the general
concepts discussed in this documentation. These resources are provided for general
informational purposes only and are not affiliated, sponsored, or endorsed by National
Instruments. The content of these resources is not a representation of, may not correspond
to, and does not imply current or future functionality in the PID Control Toolkit or any
other National Instruments product.
Aström, K. J. and T. Hagglund. 1984. Automatic tuning of simple
regulators. In Proceedings of IFAC 9th World Congress,
Budapest: 1867–72.
Aström, K. J., T. Hagglund, C. C. Hang, and W. K. Ho. 1993.
Automatic tuning and adaption for PID controllers: a survey.
Control Engineering Practice 1:669–714.
Corripio, A. B. 2000. Tuning of Industrial Control Systems. 2d ed.
Raleigh, North Carolina: ISA.
Shinskey, F. G. 1988. Process Control Systems: Applicaton, Design and
Tuning. 3d ed. New York: McGraw-Hill.
Yen, J., R. Langari, and L. Zadeh, eds. 1995. Industrial Applications of
Fuzzy Logic and Intelligent Systems. Piscataway, NJ: IEEE Press.
Ziegler, J. G. and N. B. Nichols. 1942. Optimum settings for automatic
controllers. Trans. ASME 64:759–68.
Zimmerman, H.-J. 1991. Fuzzy Set Theory – and Its Applications. 2d ed.
Boston, MA: Kluwer Academic Publishers.
Zimmerman, H.-J. 1987. Fuzzy Sets, Decision Making, and Expert
Systems. Boston, Dordrecht, London: Kluwer Academic Publishers.
PID Control Toolkit User Manual
x
ni.com
1
Overview of the
PID Control Toolkit
This chapter describes the PID control applications.
PID Control
Currently, the Proportional-Integral-Derivative (PID) algorithm is the most
common control algorithm used in industry. Often, people use PID to
control processes that include heating and cooling systems, fluid level
monitoring, flow control, and pressure control. In PID control, you must
specify a process variable and a setpoint. The process variable is the system
parameter you want to control, such as temperature, pressure, or flow rate,
and the setpoint is the desired value for the parameter you are controlling.
A PID controller determines a controller output value, such as the heater
power or valve position. The controller applies the controller output value
to the system, which in turn drives the process variable toward the setpoint
value.
You can use the PID VIs with National Instruments hardware to develop
LabVIEW control applications. Use I/O hardware, like a DAQ device,
FieldPoint I/O modules, or a GPIB board, to connect your PC to the system
you want to control. You can use the I/O VIs provided in LabVIEW with
the LabVIEW PID Control Toolkit to develop a control application or
modify the examples provided with the toolkit.
Use the PID VIs to develop the following control applications based on PID
controllers:
•
Proportional (P); proportional-integral (PI); proportional-derivative
(PD); and proportional-integral-derivative (PID) algorithms
•
Gain-scheduled PID
•
PID autotuning
•
Error-squared PID
•
Lead-Lag compensation
•
Setpoint profile generation
© National Instruments Corporation
1-1
PID Control Toolkit User Manual
Chapter 1
Overview of the PID Control Toolkit
•
Multi-loop cascade control
•
Feedforward control
•
Override (minimum/maximum selector) control
•
Ratio/bias control
You can combine these PID VIs with LabVIEW math and logic functions
to create block diagrams for real control strategies. The PID VIs use
LabVIEW functions and library subVIs, without any Code Interface Nodes
(CINs), to implement the algorithms. You can modify the VIs for your
applications in LabVIEW, without writing any text-based code.
Refer to the LabVIEW Help, available by selecting Help»Search the
LabVIEW Help, for more information about the VIs.
Fuzzy Logic
Fuzzy logic is a method of rule-based decision making used for expert
systems and process control that emulates the rule-of-thumb thought
process that human beings use.
You can use fuzzy logic to control processes that a person manually
controls, based on expertise gained from experience. A human operator
who is an expert in a specific process often uses a set of linguistic control
rules, based on experience, that he can describe generally and intuitively.
Fuzzy logic provides a way to translate these linguistic descriptions to the
rule base of a fuzzy logic controller. Refer to Chapter 4, Overview of Fuzzy
Logic, for more information.
How Do the Fuzzy Logic VIs Work?
With the Fuzzy Logic VIs, you can design a fuzzy logic controller, an
expert system for decision making, and implement the controller in your
LabVIEW applications. The Fuzzy Logic Controller Design VI, available
by selecting Tools»Control Design and Simulation»Fuzzy Logic
Controller Design, defines the fuzzy membership functions and controller
rule base. The Fuzzy Logic Controller Design VI is a stand-alone VI with
a user interface you can use to define all controller and expert system
components completely and save all of the parameters of the defined
controller to one controller data file.
PID Control Toolkit User Manual
1-2
ni.com
Chapter 1
Overview of the PID Control Toolkit
You use two additional VIs to implement the fuzzy controller in your
LabVIEW application. The Load Fuzzy Controller VI loads all the
parameters of the fuzzy controller previously saved by the Fuzzy Logic
Controller Design VI. The Fuzzy Controller VI implements the fuzzy logic
inference engine and returns the controller outputs. To implement real-time
decision making or control of your physical system, you can wire the data
acquired by your data acquisition device to the fuzzy controller. You also
can use outputs of the fuzzy controller with your DAQ analog output
hardware to implement real-time process control.
© National Instruments Corporation
1-3
PID Control Toolkit User Manual
2
PID Algorithms
This chapter explains the PID, advanced PID, and autotuning algorithms.
The PID Algorithm
The PID controller compares the setpoint (SP) to the process variable (PV)
to obtain the error (e).
e = SP – PV
Then the PID controller calculates the controller action, u(t), where Kc is
controller gain.
⎛
1
u ( t ) = K c⎜ e + ---Ti
⎝
t
de ⎞
-⎟
∫ e dt + T ----dt ⎠
d
0
If the error and the controller output have the same range, –100% to 100%,
controller gain is the reciprocal of proportional band. Ti is the integral time
in minutes, also called the reset time, and Td is the derivative time in
minutes, also called the rate time. The following formula represents the
proportional action.
up ( t ) = Kc e
The following formula represents the integral action.
Kc
u I ( t ) = ------Ti
t
∫ e dt
0
The following formula represents the derivative action.
de
u D ( t ) = K c Td ------dt
© National Instruments Corporation
2-1
PID Control Toolkit User Manual
Chapter 2
PID Algorithms
Implementing the PID Algorithm with the PID VIs
This section describes how the PID VIs implement the positional PID
algorithm. The subVIs used in these VIs are labelled so you can modify any
of these features as necessary.
Error Calculation
The following formula represents the current error used in calculating
proportional, integral, and derivative action.
e(k) = (SP – PV f )
Proportional Action
Proportional action is the controller gain times the error, as shown in the
following formula.
u P ( k )= ( K c * e ( k ) )
Trapezoidal Integration
Trapezoidal integration is used to avoid sharp changes in integral action
when there is a sudden change in PV or SP. Use nonlinear adjustment of
integral action to counteract overshoot. The larger the error, the smaller the
integral action, as shown in the following formula.
Kc
u I ( k )= -----Ti
k
∑
e--------------------------------( i ) + e ( i – 1 -)
Δt
2
i=1
Partial Derivative Action
Because of abrupt changes in SP, only apply derivative action to the PV,
not to the error e, to avoid derivative kick. The following formula
represents the partial derivative action.
Td
u D ( k ) = – K c ----- ( PVf ( k ) – PVf ( k – 1 ) )
Δt
PID Control Toolkit User Manual
2-2
ni.com
Chapter 2
PID Algorithms
Controller Output
Controller output is the summation of the proportional, integral, and
derivative action, as shown in the following formula.
u ( k ) = uP ( k ) + uI ( k ) + uD ( k )
Output Limiting
The actual controller output is limited to the range specified for control
output.
If u ( k ) ≥ u max then u ( k ) = u max
and
if u ( k ) ≤ u min then u ( k ) = u min
The following formula shows the practical model of the PID controller.
1
u ( t ) = K c ( SP – PV ) + ---Ti
t
∫ (SP – PV)dt – T
0
d
dPV
------------f
dt
The PID VIs use an integral sum correction algorithm that facilitates
anti-windup and bumpless manual to automatic transfers. Windup occurs at
the upper limit of the controller output, for example, 100%. When the error
e decreases, the controller output decreases, moving out of the windup area.
The integral sum correction algorithm prevents abrupt controller output
changes when you switch from manual to automatic mode or change any
other parameters.
The default ranges for the parameters SP, PV, and output correspond to
percentage values; however, you can use actual engineering units. Adjust
corresponding ranges accordingly. The parameters Ti and Td are specified
in minutes. In the manual mode, you can change the manual input to
increase or decrease the output.
You can call these PID VIs from inside a While Loop with a fixed cycle
time. All the PID Control VIs are reentrant. Multiple calls from high-level
VIs use separate and distinct data.
As a general rule, manually drive the process variable until it meets or comes close
to the setpoint before you perform the manual to automatic transfer.
Note
© National Instruments Corporation
2-3
PID Control Toolkit User Manual
Chapter 2
PID Algorithms
Gain Scheduling
Gain scheduling refers to a system where you change controller parameters
based on measured operating conditions. For example, the scheduling
variable can be the setpoint, the process variable, a controller output, or an
external signal. For historical reasons, the term gain scheduling is used
even if other parameters such as derivative time or integral time change.
Gain scheduling effectively controls a system whose dynamics change with
the operating conditions.
With the PID Control VIs, you can define unlimited sets of PID parameters
for gain scheduling. For each schedule, you can run autotuning to update
the PID parameters.
The Advanced PID Algorithm
Error Calculation
The following formula represents the current error used in calculating
proportional, integral, and derivative action.
SP – PVf
-)
e(k) = (SP – PV f )(L+ ( 1 – L )* -----------------------SP range
The error for calculating proportional action is shown in the following
formula.
βSP – PV
eb ( k ) = (β* SP – PV f )(L+ ( 1 – L )* ---------------------------f - )
SP range
where SPrange is the range of the setpoint, β is the setpoint factor for the
two degree-of-freedom PID algorithm described in the Proportional Action
section of this chapter, and L is the linearity factor that produces a nonlinear
gain term in which the controller gain increases with the magnitude of the
error. If L is 1, the controller is linear. A value of 0.1 makes the minimum
gain of the controller 10% Kc. Use of a nonlinear gain term is referred to as
an error-squared PID algorithm.
PID Control Toolkit User Manual
2-4
ni.com
Chapter 2
PID Algorithms
Proportional Action
In applications, SP changes are usually larger and faster than load
disturbances, while load disturbances appear as a slow departure of the
controlled variable from the SP. PID tuning for good load-disturbance
responses often results in SP responses with unacceptable oscillation.
However, tuning for good SP responses often yields sluggish
load-disturbance responses. The factor β, when set to less than one, reduces
the SP-response overshoot without affecting the load-disturbance response,
indicating the use of a two degree-of-freedom PID algorithm. Intuitively, β
is an index of the SP response importance, from zero to one. For example,
if you consider load response the most important loop performance, set β
to 0.0. Conversely, if you want the process variable to quickly follow the
SP change, set β to 1.0.
u P ( k )= ( K c * eb ( k ) )
© National Instruments Corporation
2-5
PID Control Toolkit User Manual
Chapter 2
PID Algorithms
Trapezoidal Integration
Trapezoidal integration is used to avoid sharp changes in integral action
when there is a sudden change in PV or SP. Use nonlinear adjustment of
integral action to counteract overshoot. The larger the error, the smaller the
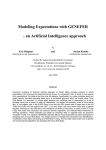
integral action, as shown in the following formula and in Figure 2-1.
Kc
u I ( k )= -----Ti
k
∑
i=1
e(i) + e(i – 1)
1
---------------------------------- Δt ------------------------------2
2
10*e ( i )
1 + --------------------2
SP rng
Figure 2-1. Nonlinear Multiple for Integral Action (SPrng = 100)
PID Control Toolkit User Manual
2-6
ni.com
Chapter 2
PID Algorithms
The Autotuning Algorithm
Use autotuning to improve performance. Often, many controllers are
poorly tuned. As a result, some controllers are too aggressive and some
controllers are too sluggish. PID controllers are difficult to tune when
you do not know the process dynamics or disturbances. In this case, use
autotuning. Before you begin autotuning, you must establish a stable
controller, even if you cannot properly tune the controller on your own.
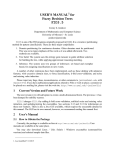
Figure 2-2 illustrates the autotuning procedure excited by the setpoint relay
experiment, which connects a relay and an extra feedback signal with the
setpoint. Notice that the PID Autotuning VI directly implements this
process. The existing controller remains in the loop.
SP
+
–
+
–
e
PV
P(I) Controller
Process
Relay
Figure 2-2. Process under PID Control with Setpoint Relay
For most systems, the nonlinear relay characteristic generates a limiting
cycle, from which the autotuning algorithm identifies the relevant
information needed for PID tuning. If the existing controller is proportional
only, the autotuning algorithm identifies the ultimate gain Ku and ultimate
period Tu. If the existing model is PI or PID, the autotuning algorithm
identifies the dead time τ and time constant Tp, which are two parameters
in the integral-plus-deadtime model.
– τs
e
G P ( s ) = -------Tp s
© National Instruments Corporation
2-7
PID Control Toolkit User Manual
Chapter 2
PID Algorithms
Tuning Formulas
The LabVIEW PID Control Toolkit uses Ziegler and Nichols’ heuristic
methods for determining the parameters of a PID controller. When you
autotune, select one of the following three types of loop performance: fast
(1/4 damping ratio), normal (some overshoot), and slow (little overshoot).
Refer to the following tuning formula tables for each type of loop
performance.
Table 2-1. Tuning Formula under P-Only Control (Fast)
Controller
Kc
Ti
Td
P
0.5Ku
—
—
PI
0.4Ku
0.8Tu
—
PID
0.6Ku
0.5Tu
0.12Tu
Table 2-2. Tuning Formula under P-Only Control (Normal)
Controller
Kc
Ti
Td
P
0.2Ku
—
—
PI
0.18Ku
0.8Tu
—
PID
0.25Ku
0.5Tu
0.12Tu
Table 2-3. Tuning Formula under P-Only Control (Slow)
PID Control Toolkit User Manual
Controller
Kc
Ti
Td
P
0.13Ku
—
—
PI
0.13Ku
0.8Tu
—
PID
0.15Ku
0.5Tu
0.12Tu
2-8
ni.com
Chapter 2
PID Algorithms
Table 2-4. Tuning Formula under PI or PID Control (Fast)
Controller
Kc
Ti
Td
—
—
P
Tp /τ
PI
0.9Tp /τ
3.33τ
—
PID
1.1Tp /τ
2.0τ
0.5τ
Table 2-5. Tuning Formula under PI or PID Control (Normal)
Controller
Kc
Ti
Td
P
0.44Tp /τ
—
—
PI
0.4Tp /τ
5.33τ
—
PID
0.53Tp /τ
4.0τ
0.8τ
Table 2-6. Tuning Formula under PI or PID Control (Slow)
Controller
Kc
Ti
Td
P
0.26Tp /τ
—
—
PI
0.24Tp /τ
5.33τ
—
PID
0.32Tp /τ
4.0τ
0.8τ
During tuning, the process remains under closed-loop PID control. You do not
need to switch off the existing controller and perform the experiment under open-loop
conditions. In the setpoint relay experiment, the SP signal mirrors the SP for the PID
controller.
Note
© National Instruments Corporation
2-9
PID Control Toolkit User Manual
Using the PID Software
3
This chapter contains the basic information you need to begin using the PID
Control VIs.
Designing a Control Strategy
When you design a control strategy, sketch a flowchart that includes the
physical process and control elements such as valves and measurements.
Add feedback from the process and any required computations. Then use
the VIs in this toolkit, combined with the math and logic VIs and functions
in LabVIEW, to translate the flowchart into a block diagram. Figure 3-1
is an example of a control flowchart, and Figure 3-2 is the equivalent
LabVIEW block diagram. The only elements missing from this simplified
VI are the loop-tuning parameters and the automatic-to-manual switching.
Figure 3-1. Block Diagram Representation of the PID Control Flowchart.
FT = Flow Transmitter. LT = Level Transmitter. LC = Level Control. SP = Setpoint.
© National Instruments Corporation
3-1
PID Control Toolkit User Manual
Chapter 3
Using the PID Software
Figure 3-2. LabVIEW Block Diagram
You can handle the inputs and outputs through DAQ devices, FieldPoint I/O
modules, GPIB instruments, or serial I/O ports. You can adjust polling rates
in real time. Potential polling rates are limited only by your hardware and
by the number and graphical complexity of your VIs.
Setting Timing
The PID VI and the PID Lead-Lag VI in the LabVIEW PID Control
Toolkit are time dependent. A VI can acquire timing information either
from a value you supply to the cycle time control, dt, or from a time keeper
such as those built into the PID VIs. If dt is less than or equal to zero, the
VI calculates new timing information each time LabVIEW calls it. At each
call, the VI measures the time since the last call and uses that difference in
its calculations. If you call a VI from a While Loop that uses one of the
LabVIEW timing VIs, located on the Time & Dialog palette, you can
achieve fairly regular timing, and the internal time keeper compensates for
variations. However, the resolution of the Tick Count (ms) function is
limited to 1 ms.
If dt is a positive value in seconds, the VI uses that value in the calculations,
regardless of the elapsed time. National Instruments recommends you use
this method for fast loops, such as when you use acquisition hardware to
time the controller input or real-time applications. Refer to the example VIs
located in the labview\examples\control\pid\prctrlex.llb
directory for examples of using timing with the PID VIs. If you
installed NI-DAQmx, you also can view relevant examples in the
labview\examples\daqmx\control\control.llb directory.
According to control theory, a control system must sample a physical
process at a rate about 10 times faster than the fastest time constant in the
physical process. For example, a time constant of 60 s is typical for a
PID Control Toolkit User Manual
3-2
ni.com
Chapter 3
Using the PID Software
temperature control loop in a small system. In this case, a cycle time of
about 6 s is sufficient. Faster cycling offers no improvement in performance
(Corripio 1990). In fact, running all your control VIs too fast degrades the
response time of your LabVIEW application.
All VIs within a loop execute once per iteration at the same cycle time. To
run several control VIs at different cycle times and still share data between
them, as for example in a cascade, you must separate the VIs into
independently timed While Loops. Figure 3-3 shows an example of a
cascade with two independently timed While Loops.
Figure 3-3. Cascaded Control Functions
A global variable passes the output of Loop A to the PV input of Loop B.
You can place both While Loops on the same diagram. In this case, they are
in separate VIs. Use additional global or local variables to pass any other
necessary data between the two While Loops.
If the front panel does not contain graphics that LabVIEW must update
frequently, the PID Control VIs can execute at kilohertz (kHz) rates.
Remember that actions such as mouse activity and window scrolling
interfere with these rates.
© National Instruments Corporation
3-3
PID Control Toolkit User Manual
Chapter 3
Using the PID Software
Tuning Controllers Manually
The following controller tuning procedures are based on the work of
Ziegler and Nichols, the developers of the quarter-decay ratio tuning
techniques derived from a combination of theory and empirical
observations (Corripio 1990). Experiment with these techniques and with
one of the process control simulation VIs to compare them. For different
processes, one method might be easier or more accurate than another. For
example, some techniques that work best when used with online controllers
cannot stand the large upsets described here.
To perform these tests with LabVIEW, set up your control strategy with the
PV, SP, and output displayed on a large strip chart with the axes showing
the values versus time. Refer to the Closed-Loop (Ultimate Gain) Tuning
Procedure and Open-Loop (Step Test) Tuning Procedure sections of this
chapter for more information about disturbing the loop and determining the
response from the graph. Refer to Corripio (1990), as listed in the Related
Documentation section of this manual, for more information about these
procedures.
Closed-Loop (Ultimate Gain) Tuning Procedure
Although the closed-loop (ultimate gain) tuning procedure is very accurate,
you must put your process in steady-state oscillation and observe the PV on
a strip chart. Complete the following steps to perform the closed-loop
tuning procedure.
PID Control Toolkit User Manual
1.
Set both the derivative time and the integral time on your PID
controller to 0.
2.
With the controller in automatic mode, carefully increase the
proportional gain (Kc) in small increments. Make a small change in
SP to disturb the loop after each increment. As you increase Kc, the
value of PV should begin to oscillate. Keep making changes until the
oscillation is sustained, neither growing nor decaying over time.
3.
Record the controller proportional band (PBu) as a percent, where
PBu = 100/Kc.
4.
Record the period of oscillation (Tu) in minutes.
3-4
ni.com
Chapter 3
5.
Using the PID Software
Multiply the measured values by the factors shown in Table 3-1 and
enter the new tuning parameters into your controller. Table 3-1
provides the proper values for a quarter-decay ratio.
If you want less overshoot, increase the gain Kc.
Table 3-1. Closed-Loop–Quarter-Decay Ratio Values
Note
Controller
PB
(percent)
Reset
(minutes)
Rate
(minutes)
P
2.00PBu
—
—
PI
2.22PBu
0.83Tu
—
PID
1.67PBu
0.50TTu
0.125Tu
Proportional gain (Kc) is related to proportional band (PB) as Kc = 100/PB.
Open-Loop (Step Test) Tuning Procedure
The open-loop (step test) tuning procedure assumes that you can model any
process as a first-order lag and a pure deadtime. This method requires more
analysis than the closed-loop tuning procedure, but your process does not
need to reach sustained oscillation. Therefore, the open-loop tuning
procedure might be quicker and more reliable for many processes. Observe
the output and the PV on a strip chart that shows time on the x-axis.
Complete the following steps to perform the open-loop tuning procedure.
1.
Put the controller in manual mode, set the output to a nominal
operating value, and allow the PV to settle completely. Record the PV
and output values.
2.
Make a step change in the output. Record the new output value.
© National Instruments Corporation
3-5
PID Control Toolkit User Manual
Chapter 3
Using the PID Software
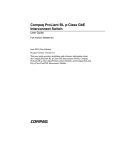
3.
Wait for the PV to settle. From the chart, determine the values as
derived from the sample displayed in Figure 3-4.
The variables represent the following values:
•
Td —Deadtime in minutes
•
T—Time constant in minutes
•
K—Process gain = (change in PV) / (change in output)
Max
63.2% (Max-Min)
PV
Min
Output
Td
T
Figure 3-4. Output and Process Variable Strip Chart
4.
Multiply the measured values by the factors shown in Table 3-2 and
enter the new tuning parameters into your controller. The table
provides the proper values for a quarter-decay ratio. If you want less
overshoot, reduce the gain, Kc.
Table 3-2. Open-Loop–Quarter-Decay Ratio Values
PB
(percent)
Reset
(minutes)
Rate
(minutes)
P
KT d
100 ---------T
—
—
PI
KT d
110 ---------T
3.33Td
—
PID
KT
80 ---------dT
2.00Td
0.50Td
Controller
PID Control Toolkit User Manual
3-6
ni.com
Chapter 3
Using the PID Software
Using the PID VIs
Although there are several variations of the PID VI, they all use the
algorithms described in Chapter 2, PID Algorithms. The PID VI
implements the basic PID algorithm. Other variations provide additional
functionality as described in the following sections. You can use these VIs
interchangeably because they all use consistent inputs and outputs where
possible.
The PID VI
The PID VI has inputs for setpoint, process variable, PID gains, dt,
output range, and reinitialize?. The PID gains input is a cluster of
three values—proportional gain, integral time, and derivative time.
You can use output range to specify the range of the controller output. The
default range of the controller output is –100 to 100, which corresponds to
values specified in terms of percentage of full scale. However, you can
change this range to one that is appropriate for your control system, so that
the controller gain relates engineering units to engineering units instead of
percentage to percentage. The PID VI coerces the controller output to the
specified range. In addition, the PID VI implements integrator anti-windup
when the controller output is saturated at the specified minimum or
maximum values. Refer to Chapter 2, PID Algorithms, for more
information about anti-windup.
You can use dt to specify the control-loop cycle time. The default value
is –1, so by default the PID VI uses the operating system clock for
calculations involving the loop cycle time. If the loop cycle time is
deterministic, you can provide this input to the PID VI. Note that the
operating system clock has a resolution of 1 ms, so specify a dt value
explicitly if the loop cycle time is less than 1 ms.
The PID VI will initialize all internal states on the first call to the VI. All
subsequent calls to the VI will make use of state information from previous
calls. However, you can reinitialize the PID VI to its initial state at any time
by passing a value of TRUE to the reinitialize? input. Use this function if
your application must stop and restart the control loop without restarting
the entire application.
© National Instruments Corporation
3-7
PID Control Toolkit User Manual
Chapter 3
Using the PID Software
Fault Protection
If the PID VI receives an invalid input, such as NaN (Not a Number), the
VI outputs NaN until you pass a value of TRUE to the reinitialize? input.
You can use the Not A Number/Path/Refnum? VI to check for invalid
inputs and respond in a way that is appropriate to the application.
For example, the following block diagram uses the Not A
Number/Path/Refnum? VI with a Select function and a Feedback Node
to reuse the last valid input when the VI receives an invalid input.
Figure 3-5. Fault Protection
Refer to the General PID with Fault Protection VI in the
labview\examples\control\pid\prctrlex.llb directory for an
example of a single-channel PID implementation that includes fault
protection.
The PID Advanced VI
The PID Advanced VI has the same inputs as the PID VI, with the addition
of inputs for setpoint range, beta, linearity, auto?, and manual control.
You can specify the range of the setpoint using the setpoint range input,
which also establishes the range for the process variable. The default
setpoint range is 0 to 100, which corresponds to values specified in terms
of percentage of full scale. However, you can change this range to one that
is appropriate for your control system, so that the controller gain relates
engineering units to engineering units instead of percentage to percentage.
The PID Advanced VI uses the setpoint range in the nonlinear integral
action calculation and, with the linearity input, in the nonlinear error
calculation. The VI uses the beta input in the two degree-of-freedom
algorithm, and the linearity input in the nonlinear gain factor calculation.
Refer to Chapter 2, PID Algorithms, for more information about these
calculations.
PID Control Toolkit User Manual
3-8
ni.com
Chapter 3
Using the PID Software
You can use the auto? and manual control inputs to switch between
manual and automatic control modes. The default value of auto? is TRUE,
which means the VI uses the PID algorithm to calculate the controller
output. You can implement manual control by changing the value of auto?
to FALSE so that the VI passes the value of manual control through to the
output.
Bumpless Automatic-to-Manual Transfer
The PID Advanced VI cannot implement bumpless automatic-to-manual
transfer. In order to ensure a smooth transition from automatic to manual
control mode, you must design your application so that the manual output
value matches the control output value at the time that the control mode is
switched from automatic to manual. You can do this by using a local
variable for the manual control control, as shown in Figure 3-6.
Figure 3-6. Bumpless Automatic-to-Manual Transfer
Although this VI does not support automatic-to-manual transfer, it does
support bumpless manual-to-automatic transfer, which ensures a smooth
controller output during the transition from manual to automatic control
mode.
Multi-Loop PID Control
Most of the PID VIs are polymorphic VIs for use in multiple control-loop
applications. For example, you can design a multi-loop PID control
application using the PID VI and DAQ functions for input and output. A
DAQ analog input function returns an array of data when you configure it
for multiple channels. You can wire this array directly into the process
variable input of the PID VI. The polymorphic type of the PID VI
automatically switches from DBL to DBL Array, which calculates and
© National Instruments Corporation
3-9
PID Control Toolkit User Manual
Chapter 3
Using the PID Software
returns an array of output values corresponding to the number of values in
the process variable array. Note that you also can switch the type of the
polymorphic VI manually by right-clicking the VI icon and selecting Select
Type from the shortcut menu.
When the polymorphic type is set to DBL Array, other inputs change
automatically to array inputs as well. For example, the PID VI inputs
setpoint, PID gains, and output range all become array inputs. Each of
these inputs can have an array length ranging from 1 to the array length of
the process variable input. If the array length of any of these inputs is less
than the array length of the process variable input, the PID VI reuses the
last value in the array for other calculations. For example, if you specify
only one set of PID gains in the PID gains array, the PID VI uses these
gains to calculate each output value corresponding to each process
variable input value. Other polymorphic VIs included with the
PID Control Toolkit operate in the same manner.
Setpoint Ramp Generation
The PID Setpoint Profile VI can generate a profile of setpoint values over
time for a “ramp and soak” type PID application. For example, you might
want to ramp the setpoint temperature of an oven control system over time,
and then hold, or soak, the setpoint at a certain temperature for another
period of time. You can use the PID Setpoint Profile VI to implement any
arbitrary combination of ramp, hold, and step functions.
Specify the setpoint profile as an array of pairs of time and setpoint values
with the time values in ascending order. For example, a ramp setpoint
profile can be specified with two setpoint profile array values, as shown
in Figure 3-7.
Figure 3-7. Ramp Setpoint Profile
PID Control Toolkit User Manual
3-10
ni.com
Chapter 3
Using the PID Software
A ramp and hold setpoint profile also can have two successive array values
with the same setpoint value, as shown in Figure 3-8.
Figure 3-8. Ramp and Hold Setpoint Profile
Alternatively, a step setpoint profile can have two successive array
values with the same time value but different setpoint values, as shown
in Figure 3-9.
Figure 3-9. Step Setpoint Profile
The PID Setpoint Profile VI outputs a single setpoint value determined
from the current elapsed time. Therefore, you should use this VI inside
the control loop. The first call to the VI initializes the current time in the
setpoint profile to 0. On subsequent calls, the VI, determines the current
time from the previous time and the dt input value. If you reinitialize the
current time to 0 by passing a value of TRUE to the reinitialize? input, you
can repeat the specified setpoint profile.
© National Instruments Corporation
3-11
PID Control Toolkit User Manual
Chapter 3
Using the PID Software
If the loop cycle time is deterministic, you can use the input dt to specify
its value. The default value of dt is –1, so by default the VI uses the
operating system clock for calculations involving the loop cycle time.
The operating system clock has a resolution of 1 ms, so specify a dt value
explicitly if the loop cycle time is less than 1 ms.
Filtering Control Inputs
You can use the PID Control Input Filter VI to filter high-frequency noise
from measured values in a control application, for example, if you are
measuring process variable values using a DAQ device.
As discussed in the Setting Timing section of this chapter, the sampling
rate of the control system should be at least 10 times faster than the fastest
time constant of the physical system. Therefore, if correctly sampled, any
frequency components of the measured signal greater than one-tenth of the
sampling frequency are a result of noise in the measured signal. Gains in
the PID controller can amplify this noise and produce unnecessary wear on
actuators and other system components.
The PID Control Input Filter VI filters out unwanted noise from input
signals. The algorithm it uses is a lowpass fifth-order finite impulse
response (FIR) filter. The cutoff frequency of the lowpass filter is one-tenth
of the sampling frequency, regardless of the actual sampling frequency
value. You can use the PID Control Input Filter VI to filter noise from input
values in the control loop before the values pass to control functions such
as the PID VI.
Gain Scheduling
With the PID Gain Schedule VI, you can apply different sets of PID
parameters for different regions of operation of your controller. Because
most processes are nonlinear, PID parameters that produce a desired
response at one operating point might not produce a satisfactory response
at another operating point. The PID Gain Schedule VI selects and outputs
one set of PID gains from a gain schedule based on the current value of the
gain scheduling value input. For example, to implement a gain schedule
based on the value of the process variable, wire the process variable value
to the gain scheduling value input and wire the PID gains out output to
the PID gains input of the PID VI.
The PID gain schedule input is an array of clusters of PID gains and
corresponding max values. Each set of PID gains corresponds to the range
of input values from the max value of the previous element of the array to
PID Control Toolkit User Manual
3-12
ni.com
Chapter 3
Using the PID Software
the max value of the same element of the array. The input range of the PID
gains of the first element of the PID gain schedule is all values less than
or equal to the corresponding max value.
In Figure 3-10, the Gain Scheduling Input example uses the setpoint value
as the gain scheduling variable with a default range of 0 to 100. Table 3-3
summarizes PID parameters.
Figure 3-10. Gain Scheduling Input Example
Table 3-3. PID Parameter Ranges
Range
© National Instruments Corporation
Parameters
0 ≤ SP ≤ 30
Kc = 10, Ti = 0.02, Td = 0.02
30 < SP ≤ 70
Kc = 12, Ti = 0.02, Td = 0.01
70 < SP ≤ 100
Kc = 15, Ti = 0.02, Td = 0.005
3-13
PID Control Toolkit User Manual
Chapter 3
Using the PID Software
Control Output Rate Limiting
Sudden changes in control output are often undesirable or even dangerous
for many control applications. For example, a sudden large change in
setpoint can cause a very large change in controller output. Although in
theory this large change in controller output results in fast response of the
system, it may also cause unnecessary wear on actuators or sudden large
power demands. In addition, the PID controller can amplify noise in the
system and result in a constantly changing controller output.
You can use the PID Output Rate Limiter VI to avoid the problem of sudden
changes in controller output. Wire the output value from the PID VI to the
input (controller output) input of the PID Output Rate Limiter VI. This
limits the slew, or rate of change, of the output to the value of the output
rate (EGU/min).
Assign a value to initial output to specify the output value on the first call
to the VI. You can reinitialize the output to the initial value by passing a
value of TRUE to the reinitialize? input.
You can use dt to specify the control-loop cycle time. The default value is
–1, so that by default the VI uses the operating system clock for calculations
involving the loop cycle time. If the loop cycle time is deterministic, you
can provide this input to the PID Output Rate Limiter VI. Note that the
operating system clock has a resolution of 1 ms; therefore, you should
specify a dt value explicitly if the loop cycle time is less than 1 ms.
The PID Lead-Lag VI
The PID Lead-Lag VI uses a positional algorithm that approximates a true
exponential lead/lag. Feedforward control schemes often use this kind of
algorithm as a dynamic compensator.
You can specify the range of the output using the output range input. The
default range is –100 to 100, which corresponds to values specified in terms
of percentage of full scale. However, you can change this range to one that
is appropriate for your control system, so that the controller gain relates
engineering units to engineering units instead of percentage to percentage.
The PID Lead-Lag VI coerces the controller output to the specified range.
The output value on the first call to the VI is the same as the input value.
You can reinitialize the output to the current input value by passing a value
of TRUE to the reinitialize? input.
PID Control Toolkit User Manual
3-14
ni.com
Chapter 3
Using the PID Software
You can use dt to specify the control-loop cycle time. The default value is
–1, so that by default the VI uses the operating system clock for calculations
involving the loop cycle time. If the loop cycle time is deterministic, you
can provide this input to the PID Lead-Lag VI. Note that the operating
system clock has a resolution of 1 ms; therefore you should specify dt
explicitly if the loop cycle time is less than 1 ms.
Converting Between Percentage of Full Scale and Engineering Units
As described above, the default setpoint, process variable, and output
ranges for the PID VIs correspond to percentage of full scale. In other
words, proportional gain (Kc) relates percentage of full scale output to
percentage of full scale input. This is the default behavior of many PID
controllers used for process control applications. To implement PID in this
way, you must scale all inputs to percentage of full scale and all controller
outputs to actual engineering units, for example, volts for analog output.
You can use the PID EGU to % VI to convert any input from real
engineering units to percentage of full scale, and you can use the PID %
to EGU function to convert the controller output from percentage to real
engineering units. The PID % to EGU VI has an additional input, coerce
output to range?. The default value of the coerce output to range? input
is TRUE.
The PID VIs do not use the setpoint range and output range information to convert
values to percentages in the PID algorithm. The controller gain relates the output in
engineering units to the input in engineering units. For example, a gain value of 1 produces
an output of 10 for a difference between setpoint and process variable of 10, regardless of
the output range and setpoint range.
Note
Using the PID Autotuning VI and the Autotuning Wizard
To use the Autotuning Wizard to improve your controller performance, you
must first create your control application and determine PID parameters
that produce stable control of the system. You can develop the control
application using either the PID VI, the PID Gain Schedule VI, or the PID
Autotuning VI. Because the PID Autotuning VI has input and output
consistent with the other PID VIs, you can replace any PID VI with it. The
PID Autotuning VI has several additional input and output values to
specify the autotuning procedure. The two additional input values are
autotuning parameters and autotune?. The autotuning parameters
input is a cluster of parameters that the VI uses for the autotuning process.
Because the Autotuning Wizard allows you to specify all of these
parameters manually, you can leave the autotuning parameters input
© National Instruments Corporation
3-15
PID Control Toolkit User Manual
Chapter 3
Using the PID Software
unwired. The autotune? input takes a Boolean value supplied by a user
control. Wire a Boolean control on the front panel of your application to
this input. When the user presses the Boolean control, the Autotuning
Wizard opens automatically. Set the Boolean control mechanical action to
Latch When Released so that the Autotuning Wizard does not open
repeatedly when the user presses the control. The Autotuning Wizard steps
the user through the autotuning process. Refer to Chapter 2, PID
Algorithms, for more information about the autotuning algorithm. The PID
Autotuning VI also has two additional output values—tuning completed?
and PID gains out. The tuning completed? output is a Boolean value. It
is usually FALSE and becomes TRUE only on the iteration during which the
autotuning finishes. The autotuning procedure updates the PID parameters
in PID gains out. Normally, PID gains out passes through PID gains and
outputs PID gains out only when the autotuning procedure completes. You
have several ways to use these outputs in your applications.
Figure 3-11 shows one possible implementation of the PID Autotuning VI.
The shift register on the left stores the initial value of the PID gains. PID
gains out then passes to the right-hand shift register terminal when each
control loop iteration completes. Although this method is simple, it suffers
from one limitation. The user cannot change PID gains manually while the
control loop is running.
Figure 3-11. Updating PID Parameters Using a Shift Register
Figure 3-12 shows a second method, which uses a local variable to store
the updated PID gains. In this example, the VI reads the PID gains control
on each iteration, and a local variable updates the control only when tuning
complete? is TRUE. This method allows for manual control of the PID
gains while the control loop executes. In both examples, you must save
PID gains so that you can use the PID gains out values for the next control
application run. To do this, ensure that the PID gains control shows the
current updated parameters, then choose Make Current Values Default
from the Operate menu, and then save the VI.
PID Control Toolkit User Manual
3-16
ni.com
Chapter 3
Using the PID Software
Figure 3-12. Updating PID Parameters Using a Local Variable
To avoid having to manually save the VI each time it runs, you can use
a datalog file to save the PID gains, as shown in Figure 3-13.
Figure 3-13. Storing PID Parameters in a Datalog File
Before the control loop begins, the File I/O VIs read a datalog file to obtain
the PID gains parameters. When the autotuning procedure runs, a local
variable updates the PID gains control. After the control loop is complete,
the VI writes the current PID gains cluster to the datalog file and saves it.
Each time it runs, the VI uses updated parameters.
© National Instruments Corporation
3-17
PID Control Toolkit User Manual
Chapter 3
Using the PID Software
Using PID on FPGA Targets
Use the PID (FPGA) Express VI to implement single-channel or
multi-channel PID on a LabVIEW FPGA target.
The PID (FPGA) Express VI is available only if you install both the
PID Control Toolkit and the LabVIEW FPGA Module.
Note
The PID (FPGA) Express VI implements a fixed-point PID algorithm on
FPGA targets. The PID algorithm features control output range and uses an
integrator anti-windup calculation to limit the effect of the integral action
during transients. The PID algorithm also features bumpless controller
output for PID gain changes.
The PID (FPGA) Express VI represents the PID proportional, integral, and
derivative gains as signed fixed-point numbers with word length 16 and
integer word length 8. Given the proportional gain (Kc), integral time
(Ti [minutes]), and derivative time (Td [minutes]), respectively, this Express
VI normalizes the gains according to the following formulas:
Kp = Kc
Kc × Ts
K i = ---------------T i × 60
K c × T d × 60
K d = ----------------------------Ts
where Ts is the sampling period, in seconds, at which the PID loop runs.
The PID controller compares the setpoint SP to the process variable PV at
a given sample instant k and produces the error e, which is defined as the
following:
e ( k ) = SP ( k ) – PV ( k )
The PID controller operates on this error and tries to drive it to zero. The
PID controller produces an output u(k), also known as a control action,
according to the following formula:
u ( k ) = up ( k ) + ui ( k ) + ud ( k )
PID Control Toolkit User Manual
3-18
ni.com
Chapter 3
Using the PID Software
where up(k) is the control output due to the proportional term, ui(k) is the
control output due to the integral term, and ud(k) is the control output due
to the derivative term. The PID controller calculates these control outputs
according to the following formulas:
up ( k ) = Kp e ( k )
k
ui ( k ) = Kp Ki
∑
e(i) + e( i – 1)
---------------------------------2
i=1
u d ( k ) = – K p K d [ PV ( k ) – PV ( k – 1 ) ]
Finally, the PID controller limits the output within an output range that you
specify.
⎧ If u ( k ) ≥ u max, u ( k ) = u max
⎨
⎩ If u ( k ) ≤ u min, u ( k ) = u min
Implementing a Single-Channel PID on FPGA Targets
To configure the PID (FPGA) Express VI for a single-channel
implementation, enter 1 in the Number of channels control on the
configuration dialog box. For single-channel PID implementations, any
changes you make to the PID parameters on the host VI take effect
immediately on the FPGA target.
Refer to the Using Discrete PID - cRIO.lvproj in the labview\
examples\control\pid\fpga.llb\CompactRIO directory for an
example of a single-channel PID implementation on an FPGA target. You
also can refer to the Using Discrete PID - R Series.lvproj in the
labview\examples\control\pid\fpga.llb\R Series directory.
Implementing a Multi-Channel PID on FPGA Targets
To configure the PID (FPGA) Express VI for a multi-channel
implementation, enter a number greater than 1 in the Number of channels
control on the configuration dialog box. To handle the values for each
channel, the host VI can include an initialization loop and processing loop,
which you can use to modify parameters or reset channels. The following
sections provide information about these loops.
© National Instruments Corporation
3-19
PID Control Toolkit User Manual
Chapter 3
Using the PID Software
Initialization Loop on the Host VI
The initial parameter values you enter on the configuration dialog box
for the PID (FPGA) Express VI set the initial values for all channels.
To specify unique values for individual channels, you must create an
initialization loop on the host VI.
In the initialization loop, you might update the parameter values of some
channels while other channels retain the initial values you specified in the
configuration dialog box. In Figure 3-14, the initialization loop initializes
the parameters of all channels.
Figure 3-14. Initializing PID Parameters on the Host VI
Processing Loop on the Host VI
After initializing the PID parameters and while running the VI on the
FPGA target, you might want to modify parameters or reset channels on a
per-channel basis, without affecting the execution of other channels. Create
a processing loop on the host VI to modify parameters or reset channels
asynchronously during execution of the FPGA VI.
Resetting a PID channel resets the internal channel states to 0 and restarts
the PID algorithm while using either the parameter values stored in
memory or the parameter values from the host VI. To modify different
parameters, you must specify the channel index, which tells the PID
algorithm the channel number to which to apply the new parameter values.
Figure 3-15 shows an example of a processing loop.
PID Control Toolkit User Manual
3-20
ni.com
Chapter 3
Using the PID Software
Figure 3-15. Processing PID Parameters on the Host VI
Refer to the Template Multichannel PID.lvproj in the labview\
examples\control\pid\fpga.llb\Template\Multichannel
directory for an example of a multi-channel PID implementation on an
FPGA target.
Using PID with DAQ Devices
The remaining sections in this chapter address several important issues you
might encounter when you use the DAQ VIs to implement control of an
actual process. The following examples illustrate the differences between
using easy-level DAQ VIs and using advanced DAQ VIs, as well as the
differences between hardware timing and software timing.
Note Refer to the labview\examples\daq\solution\control.llb directory for
additional examples of control with DAQ VIs.
© National Instruments Corporation
3-21
PID Control Toolkit User Manual
Chapter 3
Using the PID Software
Software-Timed DAQ Control Loop
Figure 3-16 illustrates the basic elements of software control. The model
assumes you have a plant, or a real process, to control. A basic analog input
VI reads process variables from sensors that monitor the process. In actual
applications, you might need to scale values to engineering units instead of
voltages.
Figure 3-16. Software-Timed DAQ Control Loop
The Control VI represents the algorithm that implements software control.
The Control VI can be a subVI you write in LabVIEW, a PID controller, or
the Fuzzy Controller VI. An analog output VI updates the analog voltages
that serve as your controller outputs to the process.
The Wait Until Next ms Multiple function that controls the loop timing
in this example specifies only a minimum time for the loop to execute.
Other operations in LabVIEW can increase the execution time of the loop
functions. The time for the first loop iteration is not deterministic. Refer to
the LabVIEW Help, available by selecting Help»Search the LabVIEW
Help, for more information about timing control loops.
PID Control Toolkit User Manual
3-22
ni.com
Chapter 3
Using the PID Software
Implementing Advanced DAQ VIs in Software-Timed DAQ Control Loops
For faster I/O and loop speeds, use the advanced-level DAQ VIs for analog
input and output. The easy-level VIs shown in Figure 3-16 actually use the
advanced-level DAQ VIs shown in this example. However, the easy-level
VIs configure the analog input and output with each loop iteration, which
creates unnecessary overhead that can slow your control loops.
You can use the advanced-level DAQ VIs to configure the analog input and
output only once instead of on each loop iteration. Be sure to place the
configuration functions outside the loop and pass the task ID to the I/O
functions inside the loop. The AI SingleScan and AO Single Update VIs
call the DAQ driver directly instead of through other subVI calls,
minimizing overhead for DAQ functions.
This example does not use a timing function to specify the loop speed.
Thus, the control loop runs as fast as possible, and LabVIEW maximizes
the control loop rates. However, any other operation in LabVIEW can slow
down the loop and vary the speed from iteration to iteration. Because
Windows is a preemptive multitasking operating system, other running
applications can affect the loop speed.
Figure 3-17. Software-Timed DAQ Control Loop with Advanced Features
© National Instruments Corporation
3-23
PID Control Toolkit User Manual
Chapter 3
Using the PID Software
Hardware-Timed DAQ Control Loop
Figure 3-18 demonstrates hardware timing. In this example, a continuous
analog input operation controls the loop speed. Notice that the
intermediate- and advanced-level DAQ VIs specify the acquisition rate for
the analog input scanning operation. The analog output VIs are identical to
those in the previous example.
Figure 3-18. Hardware-Timed DAQ Control Loop
With each loop iteration, the AI SingleScan VI returns one scan of data.
The Control VI processes data, and LabVIEW updates the analog output
channels as quickly as the VI can execute.
If the processing time of the loop subdiagram remains less than the scan
interval, the scan rate dictates the control rate. If the processing of the
analog input, control algorithm, and analog output takes longer than the
specified scan interval, which is 1 ms in this example, the software falls
behind the hardware acquisition rate and does not maintain real time. If you
monitor data remaining when you call AI SingleScan, you can determine
whether the VI has missed any scans. If data remaining remains zero, the
control is real time.
PID Control Toolkit User Manual
3-24
ni.com
Overview of Fuzzy Logic
4
This chapter introduces fuzzy set theory and provides an overview of fuzzy
logic control.
What is Fuzzy Logic?
Fuzzy logic is a method of rule-based decision making used for expert
systems and process control that emulates the rule-of-thumb thought
process human beings use. Lotfi Zadeh developed fuzzy set theory, the
basis of fuzzy logic, in the 1960s. Fuzzy set theory differs from traditional
Boolean set theory in that fuzzy set theory allows for partial membership
in a set.
Traditional Boolean set theory is two-valued in the sense that a member
either belongs to a set or does not, which is represented by a one or zero,
respectively. Fuzzy set theory allows for partial membership, or a degree of
membership, which might be any value along the continuum of zero to one.
You can use a a type of fuzzy set called a membership function to
quantitatively define a linguistic term. A membership function specifically
defines degrees of membership based on a property such as temperature or
pressure. With membership functions defined for controller or expert
system inputs and outputs, you can formulate a rule base of IF-THEN type
conditional rules. Then, with fuzzy logic inference, you can use the rule
base and corresponding membership functions to analyze controller inputs
and determine controller outputs.
After you define a fuzzy controller, you can quickly and easily implement
process control. Most traditional control algorithms require a mathematical
model to work on, but many physical systems are difficult or impossible to
model mathematically. In addition, many processes are either nonlinear or
too complex for you to control with traditional strategies. However, if an
expert can qualitatively describe a control strategy, you can use fuzzy logic
to define a controller that emulates the heuristic rule-of-thumb strategies of
the expert. Therefore, you can use fuzzy logic to control a process that a
human manually controls with knowledge he gains from experience. You
can directly translate from the linguistic control rules developed by a
human expert to a rule base for a fuzzy logic controller.
© National Instruments Corporation
4-1
PID Control Toolkit User Manual
Chapter 4
Overview of Fuzzy Logic
Types of Uncertainty
Real world situations are often too uncertain or vague for you to describe
them precisely. Thoroughly describing a complex situation requires more
detailed data than a human being can recognize, process, and understand.
When you apply fuzzy logic concepts, there are the following different
types of uncertainty: stochastic, informal, and linguistic.
Stochastic uncertainty is the degree of uncertainty that a certain event will
occur. The event itself is well-defined, and the stochastic uncertainty is not
related to when the event occurs. This type of uncertainty is used to
describe only large-numbered phenomena.
Informal uncertainty results from a lack of information and knowledge
about a situation.
Linguistic uncertainty results from the imprecision of language. Much
greater, too high, and high fever describe subjective categories with
meanings that depend on the context in which you use them.
Modeling Linguistic Uncertainty with Fuzzy Sets
One of the basic concepts in fuzzy logic is the use of fuzzy sets to
mathematically describe linguistic uncertainty. People often must make
decisions based on imprecise, subjective information. Even when the
information does not contain precise quantitative elements, people can
use fuzzy sets to successfully manage complex situations.
You do not need to have well-defined rules to make decisions. Most often,
you can use rules that cover only a few distinct cases to approximate similar
rules that apply them to a given situation. The flexibility of the rules makes
this approximation possible.
For example, if the family doctor agrees to make a house call if a sick child
has a high fever of 102 °F, you would definitely summon the doctor when
the thermometer reads 101.5 °F.
PID Control Toolkit User Manual
4-2
ni.com
Chapter 4
Overview of Fuzzy Logic
However, you cannot use conventional dual logic to satisfactorily model
this situation because the patient with a body temperature of 101.5 °F
does not fulfill the criterion for suffering from a high fever, and thus
conventional dual logic tells you not to call the doctor. Figure 4-1 shows
a graphical representation of the set.
μ[T]
Membership (patients with a high fever)
1.0
0.8
0.6
0.4
0.2
0.0
95.0
96.8
98.6
100.4
102.2
104.0
105.8
107.6
109.4
T[°F]
Body Temperature
Figure 4-1. Modeling Uncertainty by Conventional Set Membership
Even if you measured the body temperature with an accuracy of up to
five decimal places, the situation remains the same. The higher precision
does not change the fact that patients with a body temperature below 102 °F
do not fit into the category of patients with a high fever, while all patients
with a body temperature of 102 °F and higher fully belong to that category.
Modeling uncertain facts, such as high fever, sets aside the strict distinction
between the two membership values one, TRUE, and zero, FALSE, and
instead allows arbitrary intermediate membership degrees. With respect to
conventional set theory, you can generalize the set notion by allowing
elements to be more-or-less members of a certain set. This type of set is
known as a fuzzy set. Figure 4-2 shows a graphical representation of
the set.
© National Instruments Corporation
4-3
PID Control Toolkit User Manual
Chapter 4
Overview of Fuzzy Logic
μ[T]
Membership (patients with a high fever)
1.0
0.8
0.6
0.4
0.2
0.0
95.0
96.8
98.6
100.4
102.2
104.0
105.8
107.6
109.4
T[°F]
Body Temperature
Figure 4-2. Modeling Uncertainty by Fuzzy Set Membership
In Figure 4-2, the graph associates each body temperature with a certain
degree of membership (μ(T)) to the high fever set. The function μ(T) is
called the degree of membership of the element (T ∈ BT) to the fuzzy set
high fever. The body temperature is called the characteristic quantity or
base variable T of the universe BT. Notice that μ ranges from zero to one,
the values representing absolutely no membership to the set and complete
membership, respectively.
You also can interpret the degree of membership to the fuzzy set high fever
as the degree of truth given to the statement that the patient suffers from
high fever. Thus, using fuzzy sets defined by membership functions within
logical expressions leads to the notion of fuzzy logic.
As shown in Figure 4-2, a continuous function μ(T), often called a fuzzy
set, represents the degree of membership. Refer to the Defining Linguistic
Variables section of Chapter 6, Design Methodology, for more information
about how to define membership functions for certain applications.
Notice that a body temperature of 102 °F is considered only slightly
different from a body temperature of 101.5 °F, and not considered a
threshold.
PID Control Toolkit User Manual
4-4
ni.com
Chapter 4
Overview of Fuzzy Logic
Linguistic Variables and Terms
The primary building block of fuzzy logic systems is the linguistic variable.
A linguistic variable is used to combine multiple subjective categories that
describe the same context. In the previous example, there is high fever and
raised temperature as well as normal and low temperature in order to
specify the uncertain and subjective category body temperature. These
terms are called linguistic terms and represent the possible values of
a linguistic variable. A fuzzy set defined by a membership function
represents each linguistic term.
μ[T]
Low
Normal Raised
High Fever
1.0
0.8
0.6
0.4
0.2
0.0
95.0
96.8
98.6
100.4
102.2
Linguistic Variable:
104.0
105.8
107.6
109.4
T[°F]
Body Temperature
Figure 4-3. A Linguistic Variable Translates Real Values into Linguistic Values
The linguistic variable shown in Figure 4-3 allows for the translation of
a crisp measured body temperature, given in degrees Fahrenheit, into its
linguistic description. A doctor might evaluate a body temperature of
100.5 °F, for example, as a raised temperature, or a slightly high fever.
The overlapping regions of neighboring linguistic terms are important
when you use linguistic variables to model engineering systems.
© National Instruments Corporation
4-5
PID Control Toolkit User Manual
Chapter 4
Overview of Fuzzy Logic
Rule-Based Systems
Another basic fuzzy logic concept involves rule-based decision-making
processes. You do not always need a detailed and precise mathematical
description to optimize operation of an engineering process. In other words,
human operators are often capable of managing complex plant situations
without knowing anything about differential equations. Their engineering
knowledge is perhaps available in a linguistic form such as “if the liquid
temperature is correct, and the pH value is too high, adjust the water feed
to a higher level.”
Because of fully-developed nonlinearities, distributed parameters, and time
constants that are difficult to determine, it is often impossible for a control
engineer to develop a mathematical system model. Fuzzy logic uses
linguistic representation of engineering knowledge to implement a control
strategy.
Suppose you must automate the maneuvering process that leads a truck
from an arbitrary starting point to a loading ramp. The truck should run at
a constant low speed and stop immediately when it docks at the loading
ramp. A human driver is capable of controlling the truck by constantly
evaluating the current drive situation, mainly defined by the distance from
the target position and the orientation of the truck, to derive the correct
steering angle. This is shown in Figure 4-4.
y[m]
2.0
Start
Position
1.0
Target
Position
0.0
Ramp
2.0
3.0
4.0
5.0
6.0
x[m]
Figure 4-4. Automation of a Maneuvering Process Example
PID Control Toolkit User Manual
4-6
ni.com
Chapter 4
Overview of Fuzzy Logic
Implementing a Linguistic Control Strategy
To automate the truck control, an ultrasonic distance sensor monitors the
truck position in x-direction, and an electronic compass monitors the truck
orientation. Each drive situation is identified by at least two conditions. The
first condition describes the vehicle position x from the loading ramp, and
the second condition describes the vehicle orientation β. The conditions
are combined with the word AND, which represents the fact that both
conditions must be valid for the respective situation.
Figure 4-5 shows a description of a vehicle position left from the target
center with a left-hand orientation β, and a large negative steering angle ϕ
with the steering wheel turned all the way to the left.
y[m]
2.0
β
ϕ
Current
Position
1.0
x
0.0
Ramp
3.0
2.0
4.0
5.0
6.0
x[m]
Figure 4-5. Condition: Vehicle Position x and Orientation β, Action: Steering Angle ϕ
You can then use IF-THEN rules, such as
IF <situation> THEN <action>
to define a control strategy.
The above rule format describes the necessary reaction, or conclusion,
to a certain situation, or condition.
© National Instruments Corporation
4-7
PID Control Toolkit User Manual
Chapter 4
Overview of Fuzzy Logic
An expert driver could tell you the rules of thumb he uses to maneuver the
vehicle to the target position. Then you can describe those rules with
IF-THEN rules.
IF vehicle position x is left center AND vehicle orientation β is left up
THEN adjust steering angle ϕ to positive small,
or
IF vehicle position x is center AND vehicle orientation β is left up
THEN adjust steering angle ϕ to negative small,
or
IF vehicle position x is left center AND vehicle orientation β is up
THEN adjust steering angle ϕ to positive medium,
or
IF vehicle position x is center AND vehicle orientation β is up
THEN adjust steering angle ϕ to zero.
Uncertain linguistic terms like left center, left up, and so on, compose the conditions
of each rule. Even the conclusion of each rule contains vague and imprecise facts such as
negative small. Because there are no precise definitions of the words used in the rules
above, there is no way to use a text-based programming language to directly implement the
rules with IF-THEN statements.
Note
You can use fuzzy logic to implement a linguistic control strategy that is
capable of using fuzzy sets to model uncertain linguistic facts like left
center or high fever.
First, you must define a linguistic variable for each characteristic quantity
of the maneuvering process. For example, vehicle position x and vehicle
orientation β are process or input variables, and steering angle ϕ is an
output variable.
A linguistic variable consists of a number of linguistic terms that describe
the different linguistic interpretations of the characteristic quantity you are
modeling. The appropriate membership function defines each linguistic
term.
PID Control Toolkit User Manual
4-8
ni.com
Chapter 4
Overview of Fuzzy Logic
Figures 4-6, 4-7, and 4-8 show membership functions for the inputs and
output of the truck controller.
μ[x]
Left
Center
Left
Right
Center
Center
Right
1.0
0.8
0.6
0.4
0.2
0.0
0.0
1.0
2.0
3.0
4.0
5.0
6.0
7.0
8.0
9.0
10.0 x [m]
Vehicle Position
Figure 4-6. Linguistic Variable Vehicle Position x and Its Linguistic Terms
μ [β]
Up
Left
Left Down
Left Up
Right
Right Up
Right Down
1.0
0.8
0.6
0.4
0.2
0.0
–100
–50
0.0
50
100
150
200
250
β[°]
Vehicle Orientation
Figure 4-7. Linguistic Variable Vehicle Orientation β and Its Linguistic Terms
© National Instruments Corporation
4-9
PID Control Toolkit User Manual
Chapter 4
μ[ϕ]
Overview of Fuzzy Logic
Negative
Large
Negative
Medium
Negative
Small
Zero
Positive
Small
Positive
Medium
Positive
Large
1.0
0.8
0.6
0.4
0.2
0.0
–30.0
–25.0 –20.0
–15.0 –10.0
–5.0
0.0
5.0
10.0
15.0
20.0
25.0
30.0 ϕ[°]
Steering Angle
Figure 4-8. Linguistic Variable Steering Angle ϕ and Its Linguistic Terms
IF vehicle position x is center AND vehicle orientation β is up
THEN adjust steering angle ϕ to zero.
In the above rule of the linguistic control strategy, the condition is
composed of the linguistic term center from the linguistic variable vehicle
position x, and the linguistic term up from the linguistic variable vehicle
orientation β, combined by the AND operator.
Because there are five terms for vehicle position x and seven terms for
vehicle orientation β, there are at most N = 35 different rules available to
form a consistent rule base. Because there are only two input variables in
this case, you can document the complete rule base in matrix form, as
shown in Figure 4-9.
PID Control Toolkit User Manual
4-10
ni.com
Chapter 4
Overview of Fuzzy Logic
Vehicle Position x [m]
Vehicle Orientation β[°]
AND
Left
Left Center
Center
Right Center
Right
Left Down
Negative
Small
Negative
Medium
Negative
Medium
Negative
Large
Negative
Large
Left
Positive
Small
Negative
Small
Negative
Medium
Negative
Large
Negative
Large
Left Up
Positive
Medium
Positive
Small
Negative
Small
Negative
Medium
Negative
Large
Up
Positive
Medium
Positive
Medium
Zero
Negative
Medium
Negative
Medium
Right Up
Positive
Large
Positive
Medium
Positive
Small
Negative
Small
Negative
Medium
Right
Positive
Large
Positive
Large
Positive
Medium
Positive
Small
Negative
Small
Right Down
Positive
Large
Positive
Large
Positive
Medium
Positive
Medium
Negative
Small
Figure 4-9. Complete Linguistic Rule Base
Each combination of a column and a row describes a specific maneuvering
situation, the condition of a certain rule. The term at the intersection of the
column and row is the conclusion.
As an example, the following rule is highlighted in Figure 4-9.
IF vehicle position x is left center AND vehicle orientation β is left
THEN adjust steering angle ϕ to negative small.
© National Instruments Corporation
4-11
PID Control Toolkit User Manual
Chapter 4
Overview of Fuzzy Logic
Structure of the Fuzzy Logic Vehicle Controller
The complete structure of a fuzzy logic controller is shown in Figure 4-10.
Fuzzy Inference
IF...
THEN
facts
Linguistic Level
Technical Level
Linguistic Variables
and Terms
steering angle ϕ = zero
Defuzzification
Fuzzification
Linguistic Variables
and Terms
vehicle position x = center
vehicle orientation β = up
conclusions
Control Variable
steering angle ϕ = 0°
Real Variables
(measured quantities)
vehicle position x = 5 m
vehicle orientation β = 90°
Figure 4-10. Complete Structure of a Fuzzy Controller
In the first step, you must translate all sensor signals into linguistic
variables. For example, you must translate a measured vehicle position x of
4.8 m to the linguistic value almost center, just slightly left center. This step
is called fuzzification because it uses fuzzy sets to translate real variables
into linguistic variables.
Once you translate all input variable values into their corresponding
linguistic variable values, use the fuzzy inference step to derive a
conclusion from the rule base that represents the control strategy. The
step results in a linguistic value for the output variable. For example, the
linguistic result for steering angle adjustment might be steering angle ϕ
a little less than zero.
PID Control Toolkit User Manual
4-12
ni.com
Chapter 4
Overview of Fuzzy Logic
The defuzzification step translates the linguistic result back into a real value
that represents the current value of the control variable.
Fuzzification Using Linguistic Variables
For a more detailed look at the fuzzification process, consider a
maneuvering situation in which the vehicle position x is 5.1 m and the
vehicle orientation β is 70°.
μ[x]
Left
Center
Left
Center
Right
Center
Right
1.0
0.8
0.6
0.4
0.2
0.0
0.0
1.0
2.0
3.0
4.0
5.0
6.0
7.0
8.0
9.0
10.0 [m]
Current Vehicle Position x = 5.1 m
Figure 4-11. Fuzzification of the Vehicle Position x = 5.1 m
The current vehicle position x = 5.1 m belongs to the following linguistic
terms, which are defined by fuzzy sets:
left
left center
center
right center
right
with a degree of
with a degree of
with a degree of
with a degree of
with a degree of
0.0
0.0
0.8
0.1
0.0
The current vehicle position of 5.1 m is translated into the linguistic value
{0.0, 0.0, 0.8, 0.1, 0.0}, which you can interpret as still center, just slightly
right center.
© National Instruments Corporation
4-13
PID Control Toolkit User Manual
Chapter 4
Overview of Fuzzy Logic
μ[β]
Up
Left
Left Down
Left Up
Right
Right Up
Right Down
1.0
0.8
0.6
0.4
0.2
0.0
–100
–50
0.0
50
100
150
200
250
β[°]
Current Vehicle Orientation ϕ = 70°
Vehicle Orientation
Figure 4-12. Fuzzification of the Vehicle Orientation ϕ = 70°
The current vehicle orientation ϕ = 70° belongs to the following linguistic
terms (fuzzy sets):
left down
left
left up
up
right up
right
right down
with a degree of
with a degree of
with a degree of
with a degree of
with a degree of
with a degree of
with a degree of
0.0
0.0
1.0
0.0
0.0
0.0
0.0
The current vehicle orientation of 70° is translated into the linguistic value
{0.0, 0.0, 1.0, 0.0, 0.0, 0.0, 0.0}, which you can interpret as left up.
Refer to Chapter 6, Design Methodology, for more information about
defining linguistic terms and memberships.
PID Control Toolkit User Manual
4-14
ni.com
Chapter 4
Overview of Fuzzy Logic
Using IF-THEN Rules in Fuzzy Inference
After you convert all physical input values into linguistic values, identify
all rules from the rule base that apply to the current maneuvering situation.
Identify these rules so you can calculate the values of the linguistic
output variable. The fuzzy inference step consists of two components.
Aggregation involves the evaluation of the IF part, condition, of each rule.
Composition involves the valuation of the THEN part, conclusion, of
each rule.
In the following example, notice that the IF part of each rule logically
combines two linguistic terms from different linguistic variables with the
conjunction AND. Because the linguistic terms represent conditions that
are partially true, the Boolean AND from conventional dual logic is not an
appropriate choice to model the conjunction AND. You must define new
operators that represent logical connections such as AND, OR, and NOT.
The three operators used in the majority of fuzzy logic applications are
defined as follows:
AND:
μ A • B = min ( μ A, μ B )
OR:
μ A + B = max ( μ A, μ B )
NOT:
μ ¬A = 1 – μ A
Notice that these definitions agree with the logical operators used in
Boolean logic. A truth table uses conventional operators to yield equivalent
results.
The minimum operator represents the word AND. Apply AND in the
aggregation step to calculate a degree of truth for the IF condition of each
rule in the rule base that indicates how adequately each rule describes the
current situation.
© National Instruments Corporation
4-15
PID Control Toolkit User Manual
Chapter 4
Overview of Fuzzy Logic
In the example situation, only the following two rules are valid descriptions
of the current situation. These rules are usually called the active rules. All
the other rules are called inactive.
(1) IF vehicle position x is center
(degree of truth = 0.8)
AND
minimum
vehicle orientation b is left up
(degree of truth = 1.0) = 0.8
THEN adjust steering angle ϕ to negative small
(2) IF vehicle position x is right center
(degree of truth = 0.1)
AND
minimum
vehicle orientation β is left up
(degree of truth = 1.0) = 0.1
THEN adjust steering angle ϕ to negative small
Each rule defines an action to take in the THEN condition. The
applicability of the rule to the current situation determines the degree to
which the action is valid. The aggregation step calculates this adequacy
as the degree of truth of the IF condition.
In this case, the first rule results in the action “adjust steering angle ϕ to
negative small” with a degree of 0.8. The second rule results in the action
“adjust steering angle ϕ to negative medium” with a degree of 0.1.
The composition step ensures that the resulting action is composed of the
differently weighted THEN conclusions of the active rules.
The rules of this rule base are defined alternatively, which means that they
are logically linked by the word OR. Because the resulting conclusions
of the rules are partially true, you cannot use the OR operator from
conventional dual logic to calculate the resulting conclusion. In fuzzy
logic, you must use the maximum operator instead.
For example, assume that two rules assert different degrees of truth for the
linguistic term positive medium. One rule asserts positive medium with a
degree of truth of 0.2, while another asserts positive medium with a degree
of truth of 0.7. Because the OR operator relates two rules to each other, the
output of the fuzzy inference for the linguistic term is the maximum value
of 0.7. Because the truck example has only one rule asserting a nonzero
degree of truth for both negative medium and negative small, those values
become the maximum values you use.
PID Control Toolkit User Manual
4-16
ni.com
Chapter 4
Overview of Fuzzy Logic
The final result of the fuzzy inference for the linguistic variable steering
angle ϕ includes the following linguistic terms and their corresponding
values:
negative large
negative medium
negative small
zero
positive small
positive medium
positive large
to a degree of
to a degree of
to a degree of
to a degree of
to a degree of
to a degree of
to a degree of
0.0
0.1
0.8
0.0
0.0
0.0
0.0
This type of fuzzy inference is called Max-Min inference. Because of
certain optimization procedures of fuzzy systems, sometimes it is necessary
to associate individual weights with each rule.
Using Linguistic Variables in Defuzzification
The fuzzy inference process results in a linguistic value for the output
variable. In this case, you can interpret the linguistic value {0.0, 0.1, 0.8,
0.0, 0.0, 0.0,0.0} as still negative small or just slightly negative medium.
To use this linguistic value to adjust the steering wheel, you must translate
it into a real, physical value. This step is called defuzzification. Refer to
Figure 4-10 for a diagram of the different steps.
The membership functions that describe the terms of the linguistic output
variable always define the relationship between the linguistic values and
the corresponding real values. Refer to Figure 4-8 for more information
about membership functions. In the example, you obtain a fuzzy inference
result that is both fuzzy and ambiguous because you acquire the nonzero
truth degree of two different actions at the same time. You must combine
two conflicting actions, defined as fuzzy sets, to form a crisp real value.
A solution to this problem is to find the best compromise between the
two different goals. This compromise represents the best final conclusion
received from the fuzzy inference process.
One of the two most common methods for calculating the best compromise
is the Center-of-Area (CoA) method, also called the Center-of-Gravity
(CoG) method.
© National Instruments Corporation
4-17
PID Control Toolkit User Manual
Chapter 4
Overview of Fuzzy Logic
Following this defuzzification method, truncate all membership functions
that represent the conclusion terms at the degree of validity of the rule to
which the conclusion term belongs. The areas under the resulting function
of all truncated terms make up the grey area of Figure 4-13. Find the
geometric center of this area to determine the crisp compromise value.
μ[ϕ]
1.0
Negative
Large
0.8
Negative
Medium
Negative
Small
Zero
Positive
Small
Positive
Medium
Positive
Large
Validity
of Rule (1)
0.6
0.4
0.2
0.0
–30.0
Validity
of Rule (2)
–25.0 –20.0
–15.0 –10.0
Defuzzified Result: ϕ = –9.3°
–5.0
0.0
5.0
10.0
15.0
20.0
25.0
30.0 ϕ[°]
Steering Angle
Figure 4-13. Defuzzification According to Center-of-Area (CoA)
The numerical integration necessary to calculate the center-of-area in this
defuzzification method requires a lot of computation.
The second defuzzification method is called the Center-of-Maximum
(CoM) method. In the first step of this method, determine the typical value
of each term in the linguistic output variable. In the second step, calculate
the best compromise with a weighted average of typical values of the terms.
The most common approach to determining the typical value of each term
is to find the maximum of the corresponding membership function. In the
case of trapezoidal membership functions, choose the median of the
maximizing interval.
Weight each typical value by the degree to which the action term,
conclusion, is true. Then, calculate the crisp output value with a weighted
average as shown in Figure 4-14.
PID Control Toolkit User Manual
4-18
ni.com
Chapter 4
μ[ϕ]
1.0
Negative
Large
0.8
Negative
Medium
Negative
Small
Zero
Positive
Small
Overview of Fuzzy Logic
Positive
Medium
Positive
Large
Validity
of Rule (1)
0.6
0.4
0.2
0.0
–30.0
Validity
of Rule (2)
–25.0 –20.0
–15.0 –10.0
–5.0
Defuzzified Result: ϕ = –6.1°
0.0
5.0
10.0
15.0
20.0
25.0
30.0
Steering Angle ϕ[°]
Figure 4-14. Defuzzification According to Center-of-Maximum (CoM)
With ϕ (negative medium) = –15° and ϕ (negative small) = –5° as typical
values of the linguistic terms negative medium and negative small, and with
the validity values V (rule 1) = 0.8 and V (rule 2) = 0.1 for the active rules,
the possible defuzzification results are:
( negative medium ) • V(rule 2) + ϕ ( negative small ) • V(rule 1)
ϕ ( out ) = ϕ
--------------------------------------------------------------------------------------------------------------------------------------------------------------------V(rule 2) + V(rule 1)
ϕ(out) = – 6.1 °
The defuzzification method CoM is identical to using the CoG method with
singleton membership functions.
© National Instruments Corporation
4-19
PID Control Toolkit User Manual
Chapter 4
Overview of Fuzzy Logic
Figure 4-15 summarizes the fuzzy inference process for the maneuvering
situation described above using the CoA method of defuzzification.
(1) IF vehicle position x = center
AND vehicle orientation β = left up
THEN steering angle ϕ = negative small
center
left up
1
1.0
0.8
1
negative
medium
negative
small
1
min
0
0
–90
10.0
5.0
0.0
vehicle position x[m]
0
–30
0 90 180 270
vehicle orientation β[°]
(2) IF vehicle position x = right center
AND vehicle orientation β = left up
THEN steering angle ϕ = negative medium
right center
left up
1
–15
0
15
30
steering angle ϕ[°]
Fuzzy
Inference
negative
medium
negative
small
–30
0
15
30
steering angle ?ϕ[°]
1
max
0
negative
medium
1.0
1
–15
negative
small
1
0.1
0
0
–90
10.0
5.0
0.0
vehicle position x[m]
0 90 180 270
vehicle orientation β[°]
min
0
–30
–15
0
15
30
steering angle ϕ[°]
Linguistic Level
Fuzzification
Defuzzification
Technical Level
vehicle orientation β = 70°
steering angle ϕ = –9.3
vehicle position x = 5.1 m
Figure 4-15. Fuzzification, Fuzzy Inference, and Defuzzification
for a Specific Maneuvering Situation
PID Control Toolkit User Manual
4-20
ni.com
Chapter 4
Overview of Fuzzy Logic
Without modification, the CoA defuzzification method limits the range of
the output value compared to the possible range. To solve this problem, add
a fictitious extension of the left and right side border terms when you
compute the center of area. With this extension, the output variable can
realize the complete value range, shown in Figure 4-16. In this case the
defuzzification method is called modified CoA.
1.0
1.0
0.5
0.5
0.0
0.0
0.0
0.0
100
1.0
1.0
0.5
0.5
0.0
0.0
0.0
0.0
100
1.0
1.0
0.5
0.5
0.0
0.0
0.0
100
100
0.0
1.0
1.0
0.5
0.5
0.0
0.0
0.0
100
100
0.0
100
CoA
100
Modified CoA
Figure 4-16. Modified CoA for Complete Output Value Range
The CoM and CoA defuzzification methods are usually applied to
closed-loop control applications of fuzzy logic. These methods usually lead
to continuous output signals because the best compromise can never jump
to a different value with a small change to the inputs.
© National Instruments Corporation
4-21
PID Control Toolkit User Manual
Chapter 4
Overview of Fuzzy Logic
For pattern recognition applications, you must apply the
Mean-of-Maximum (MoM) defuzzification method. This defuzzification
method calculates the most plausible result. Rather than averaging the
different inference results, MoM selects the typical value of the most valid
output term.
In the example situation, the output term negative small is the most valid
term. Refer to Figures 4-13 and 4-14 for more information. The typical
value of the term is ϕ (negative small) = 5°, which is the immediate
defuzzification result. If you want to classify a sensor signal to identify
objects, for example, you are interested in the most plausible result.
In decision support systems, the choice of the defuzzification method
depends on the context of the decision you want to calculate with the fuzzy
system. For quantitative decisions like project prioritization, apply the
CoM method. For qualitative decisions, such as an evaluation of credit
worthiness, MoM is the correct method.
PID Control Toolkit User Manual
4-22
ni.com
5
Fuzzy Controllers
This chapter describes various implementations and I/O characteristics of
fuzzy controllers.
Structure of a Fuzzy Controller
A fuzzy controller is composed of the following three calculation steps:
fuzzification, fuzzy inference, and defuzzification. Linguistic rules
integrated into the rule base of the controller implement the control strategy
that you base on engineering experience with respect to a closed-loop
control application.
A fuzzy controller has a static and deterministic structure, as shown in
Figure 5-1, which you can describe with an I/O characteristic curve.
e1
Rule Base
IF ... AND ... THEN ...
IF ... AND ... THEN ...
e2
u
IF ... AND ... THEN ...
en
IF ... AND ... THEN ...
Fuzzification
Fuzzy Inference
Defuzzification
Figure 5-1. Internal Structure of a Fuzzy Controller
In principle, there are two different implementation forms. With the
first type of implementation, the offline fuzzy controller, you transform the
three-step calculation scheme into a reference table from which you can
derive the command values. You can use interpolation to calculate
© National Instruments Corporation
5-1
PID Control Toolkit User Manual
Chapter 5
Fuzzy Controllers
intermediate command values. In the second type of implementation, the
online fuzzy controller, you evaluate the three-step calculation scheme
online. This is the standard implementation form of the fuzzy logic
controls.
Closed-Loop Control Structures with Fuzzy Controllers
There are many different ways to use fuzzy controllers in closed-loop
control applications. The most basic structure uses the sensor signals from
the process as input signals for the fuzzy controller and the outputs as
command values to drive the actuators of the process. A corresponding
control loop structure is shown in Figure 5-2.
Fuzzy Controller
Process
Set Point
Values
Command
Variables
Rule Base
IF ... AND ... THEN ...
IF ... AND ... THEN ...
IF ... AND ... THEN ...
Fuzzification
Fuzzy Inference
Defuzzification
Measured Values
Figure 5-2. Simple Closed-Loop Control Structure with Fuzzy Controller
Pure fuzzy control applications are more the exception than the rule. In
most cases the fuzzy controller output serves as reference parameters, such
as gains, that you provide to a conventional controller instead of to driving
actuators in the process directly.
Because you can regard a fuzzy controller as a nonlinear characteristic field
controller, it has no internal dynamic aspects. Thus, any dynamic property
must be implemented by an appropriate preprocessing of the measured
input data.
PID Control Toolkit User Manual
5-2
ni.com
Chapter 5
Fuzzy Controllers
The fuzzy-PI controller, shown in Figure 5-3, uses the error signal e(t) and
its derivative de(t)/dt from the measured data preprocessing step as inputs.
If the output signal describes the necessary difference toward the current
output value, you need a subsequent integrator device to build up the
command variable value.
Process
Fuzzy Controller
Set Point
Value
Rule Base
IF ... AND ... THEN ...
Command
Variable
IF ... AND ... THEN ...
error(t)
∫dx
IF ... AND ... THEN ...
Inc./Dec.
d error (t)/dt
d/dt
Fuzzification
Fuzzy Inference
Defuzzification
1
dy(t )/dt = K (d error(t)/dt + T error(t))
N
Measured Value
Figure 5-3. Closed-Loop Control Structure with Fuzzy-PI Controller
A fuzzy-PI controller is a fuzzy controller with two inputs and one output.
The output value increases when the input values increase. If you use an
error signal and its derivative as input signals, the fuzzy-PI controller is
essentially a generalization of the conventional PI controller.
The benefit of the fuzzy-PI controller is that it does not have a special
operating point. The rules evaluate the difference between the measured
value and the set value, which is the error signal. The rules also evaluate the
tendency of the error signal to determine whether to increase or decrease
the control variable. The absolute value of the command variable has no
influence.
The advantage of a fuzzy-PI controller over a conventional PI controller is
that it can implement nonlinear control strategies and that it uses linguistic
rules. It is possible to consider only the error tendency when the error
becomes small.
Chemical industry and process technology often use the fuzzy controller
with underlying PID control loops. This application uses PID controllers to
control single process parameters. Usually, human operators supervise the
operating point of the entire process.
© National Instruments Corporation
5-3
PID Control Toolkit User Manual
Chapter 5
Fuzzy Controllers
For automatic operation of such multivariable control problems, you must
build a model-based controller. However, for most applications, either the
process is too complex to model adequately, or the mathematical modeling
task requires too much time.
With fuzzy controllers, you often can use the experience and the knowledge
gained by the supervising operators to form a linguistic rule base with much
less effort. Figure 5-4 shows the controller structure of the fuzzy controller
with underlying PID control loops.
Fuzzy Controller
Set Point
Values
Process
Reference
Magnitude
Signals
Rule Base
IF ... AND ... THEN ...
PID
IF ... AND ... THEN ...
IF ... AND ... THEN ...
PID
PID
Fuzzification
Fuzzy Inference
Defuzzification
Measured Values
Figure 5-4. Fuzzy Controller with Underlying PID Control Loops
The next example structure shows how to use a fuzzy controller to
automatically tune the parameters of a conventional PID controller. For
this, the fuzzy controller constantly interprets the process reaction and
calculates the optimal P, I, and D gains. You can apply this control structure
to processes that change their characteristics over time. Figures 5-5 and 5-6
show this control structure.
PID Control Toolkit User Manual
5-4
ni.com
Chapter 5
Fuzzy Controller
Fuzzy Controllers
Process
Set Point
Values
Rule Base
P
I
D
IF ... AND ... THEN ...
IF ... AND ... THEN ...
Command
Variable
PID
IF ... AND ... THEN ...
Fuzzification
Fuzzy Inference
Defuzzification
Measured Values
Figure 5-5. Fuzzy Controller for Parameter Adaptation of a PID Controller
Both the fuzzy controller and the PID controller work in parallel. The
process adds the output signals from both controllers, but the output signal
from the fuzzy controller is zero under normal operating conditions. The
PID controller output leads the process. The fuzzy controller intervenes
only when it detects abnormal operating conditions, such as strong
disturbances.
Fuzzy Controller
Process
Set Point
Values
Command
Variable
Rule Base
IF ... AND ... THEN ...
IF ... AND ... THEN ...
IF ... AND ... THEN ...
Fuzzification
Fuzzy Inference
PID
Defuzzification
Measured Values
Figure 5-6. Fuzzy Controller for Correction of a PID Controller Output
© National Instruments Corporation
5-5
PID Control Toolkit User Manual
Chapter 5
Fuzzy Controllers
I/O Characteristics of Fuzzy Controllers
You can consider a fuzzy controller to be a nonlinear characteristic field
controller. The rule base and membership functions that model the terms
of the linguistic input and output variables for the controller determine the
behavior of the controller. Because the controller has no internal dynamic
aspects, the I/O characteristics can entirely describe the transient response
of the controller.
To illustrate how the I/O characteristics of a fuzzy controller depend
on design parameters such as rule base and membership function
specification, you must first restrict yourself to a single-input fuzzy
controller. Most of these ideas apply directly to fuzzy controllers with
two or more inputs.
Figure 5-7 shows the I/O characteristic of a fuzzy controller that has only
three linguistic terms for the input variable x and the output variable y. The
rule base consists of three rules, which indicate that the increasing input
values cause the output to increase.
PID Control Toolkit User Manual
5-6
ni.com
Chapter 5
Negative
Zero
Negative
Positive
1.0
1.0
μ(x) 0.8
μ(y) 0.8
0.6
0.6
0.4
0.4
0.2
0.2
0.0
–1.0
Rule
Base
0.0
–0.5
0.5
x
0.0
–1.0
1.0
Fuzzy Controllers
Zero
–0.5
Positive
0.0
0.5
y
1.0
Max-MinInference
Rule 1: IF x = Negative THEN y = Negative
Rule 2: IF x = Zero
THEN y = Zero
Rule 3: IF x = Positive THEN y = Positive
Modified
CoA
1.0
0.8
Rule 1
Active
Rule 2
Active
Rules 1 and
2 Active
Rule 3
Active
Rules 2 and
3 Active
0.6
y
0.4
0.2
0.0
–0.2
–0.4
–0.6
–0.8
–1.0
–1.0
–0.8
–0.6
–0.4
0.0
–0.2
0.2
0.4
0.6
0.8
1.0
x
Figure 5-7. I/O Characteristic of a Fuzzy Controller
(Partially Overlapping Input Terms)
© National Instruments Corporation
5-7
PID Control Toolkit User Manual
Chapter 5
Fuzzy Controllers
The resulting controller characteristic shows nonlinear behavior. You
obtain different intervals within the controller characteristic because the
input terms partially overlap. There is only one valid rule outside of the
overlapping regions, so the output has a constant value determined by the
output term of the output variable, which is independent of the degree of
truth for that rule.
The overlapping sections of the antecedence terms lead to the rising
intervals of the controller characteristic. Within these parts, two rules are
simultaneously active. The different conclusion terms, weighted by the
degree of truth of the different active rules, determine the output value.
Notice that the overlapping triangular conclusion terms cause the rising
edges of the controller characteristic to be nonlinear.
Figure 5-8 shows the resulting controller characteristic for antecedence
terms that overlap entirely. The conclusion term distribution and the rule
base remain unchanged for this case.
PID Control Toolkit User Manual
5-8
ni.com
Chapter 5
Negative
Zero
Negative
Positive
Zero
Positive
1.0
1.0
μ(x)
Fuzzy Controllers
0.8
μ(y)
0.8
0.6
0.6
0.4
0.4
0.2
0.2
0.0
–1.0
0.0
–0.5
0.5
x
0.0
–1.0
1.0
–0.5
0.0
0.5
y
Max-MinInference
Rule 1: IF x = Negative THEN y = Negative
Rule 2: IF x = Zero
THEN y = Zero
Rule 3: IF x = Positive THEN y = Positive
Rule
Base
1.0
Modified
CoA
1.0
Rules 1 and
2 Active
0.8
Rules 2 and
3 Active
0.6
y
0.4
0.2
0.0
–0.2
–0.4
–0.6
–0.8
–1.0
–1.0
–0.8
–0.6
–0.4
–0.2
0.0
0.2
0.4
0.6
0.8
1.0
x
Figure 5-8. I/O Characteristic of a Fuzzy Controller (Entirely Overlapping Input Terms)
Because the antecedence terms completely overlap, there are always
two active rules. The different conclusion terms, weighted by the degree of
truth for the different active rules, that lead to the nonlinear pass of the
controller characteristic, determine the output value.
© National Instruments Corporation
5-9
PID Control Toolkit User Manual
Chapter 5
Fuzzy Controllers
Figure 5-9 shows the controller characteristic that results when
nonoverlapping antecedence terms describe the input variable.
Negative
Zero
Negative
Positive
1.0
1.0
μ(x) 0.8
μ(y) 0.8
0.6
0.6
0.4
0.4
0.2
0.2
0.0
–1.0
Rule
Base
–0.5
0.0
0.5
x
0.0
–1.0
1.0
Zero
–0.5
Positive
0.0
0.5
y
1.0
Max-MinInference
Rule 1: IF x = Negative THEN y = Negative
Rule 2: IF x = Zero
THEN y = Zero
Rule 3: IF x = Positive THEN y = Positive
Modified
CoA
1.0
0.8
0.6
y
0.4
Rule 1
Active
Rule 2
Active
Rule 3
Active
0.2
0.0
–0.2
–0.4
–0.6
–0.8
–1.0
–1.0
–0.8
–0.6
–0.4
0.0
–0.2
0.2
0.4
0.6
0.8
1.0
x
Figure 5-9. I/O Characteristic of a Fuzzy Controller (Nonoverlapping Input Terms)
PID Control Toolkit User Manual
5-10
ni.com
Chapter 5
Fuzzy Controllers
In this case, only one rule is active for each input situation that leads to the
stepped controller characteristic shown in Figure 5-9.
If there are undefined intervals within input and output terms, or the rule
base is incomplete, you must tell the fuzzy controller what to do. If there is
no rule available for a certain situation, the output value remains undefined.
One way to avoid this problem is to leave the current output value
unchanged until the controller encounters a situation that is covered by the
rules. Figure 5-10 shows the resulting effect on the controller characteristic.
© National Instruments Corporation
5-11
PID Control Toolkit User Manual
Chapter 5
Fuzzy Controllers
Negative
Zero
Negative
Positive
1.0
1.0
μ(x) 0.8
μ(y) 0.8
0.6
0.6
0.4
0.4
0.2
0.2
0.0
–1.0
–0.5
Undefined
Rule
Base
0.0
0.5
x
Interval
0.0
–1.0
1.0
Zero
–0.5
Positive
0.0
0.5
y
1.0
Max-MinInference
Rule 1: IF x = Negative THEN y = Negative
Rule 2: IF x = Zero
THEN y = Zero
Rule 3: IF x = Positive THEN y = Positive
Modified
CoA
1.0
0.8
0.6
y
0.4
0.2
0.0
–0.2
–0.4
–0.6
–0.8
–1.0
–1.0
–0.8
–0.6
–0.4
– 0.2
0.0
0.2
0.4
0.6
0.8
1.0
x
Figure 5-10. I/O Characteristic of a Fuzzy Controller (Undefined Input Term Interval)
PID Control Toolkit User Manual
5-12
ni.com
Chapter 5
Fuzzy Controllers
If you use an old output value as a default value, undefined intervals or
incomplete rule bases can lead to hysteretic effects on the controller
characteristic.
You can use nonoverlapping, rectangular-shaped conclusion terms to
obtain an exact linear controller characteristic for a single-input controller.
In this case both area and momentum vary linearly with the degree of truth,
and overlapping regions of the output terms do not cause any distortion.
The simplest way to obtain a linear controller characteristic is to use
singletons as conclusion terms with entirely overlapping input terms.
Refer to Figure 5-11 for an example of such a controller. Singletons are
normalized rectangular membership functions with an infinitely small
width.
© National Instruments Corporation
5-13
PID Control Toolkit User Manual
Chapter 5
Fuzzy Controllers
Using singleton membership functions for the conclusion terms makes the
CoG defuzzification method identical to the CoM method. Figure 5-11
shows the controller for the CoG method using singleton membership
functions.
Negative
Zero
Positive
Negative
1.0
μ(x) 0.8
μ(y)
0.6
0.4
0.4
0.2
0.2
Rule
Base
Positive
0.8
0.6
0.0
–1.0
Zero
1.0
– 0.5
0.0
0.5
x
0.0
–1.0
1.0
–0.5
0.0
0.5
y
1.0
Max-MinInference
Rule 1: IF x = Negative THEN y = Negative
Rule 2: IF x = Zero
THEN y = Zero
Rule 3: IF x = Positive THEN y = Positive
Modified
CoA
1.0
0.8
0.6
y
0.4
0.2
0.0
–0.2
–0.4
–0.6
–0.8
–1.0
–1.0
–0.8
–0.6
–0.4
0.0
–0.2
0.2
0.4
0.6
0.8
1.0
x
Figure 5-11. I/O Characteristic of a Fuzzy Controller (Singletons as Output Terms,
Entirely Overlapping Input Terms)
PID Control Toolkit User Manual
5-14
ni.com
Chapter 5
Fuzzy Controllers
The controller characteristic remains relatively unchanged when you leave
the input terms entirely overlapped to vary the overlapping degree of
the membership functions for the conclusion terms, especially if all the
conclusion terms are equal in width. Then only the typical values of the
conclusion terms are significant.
Therefore, in most closed-loop control applications you can use singleton
membership functions to sufficiently model the output terms rather than
using triangular or other membership function types.
Figure 5-12 shows that if all the conclusion terms are equal in width, the
overlapping degree of the membership functions for the conclusion terms
has no significant influence on the controller characteristic.
© National Instruments Corporation
5-15
PID Control Toolkit User Manual
Chapter 5
Fuzzy Controllers
Negative
Zero
Positive
Negative
1.0
Zero
Positive
1.0
μ(x) 0.8
μ(y)
0.8
0.6
0.6
0.4
0.4
0.2
0.2
0.0
–1.0
–0.5
0.0
0.5
x
0.0
–1.0
1.0
–0.5
0.0
0.5
y
Max-MinInference
Rule 1: IF x = Negative THEN y = Negative
Rule 2: IF x = Zero
THEN y = Zero
Rule 3: IF x = Positive THEN y = Positive
Rule
Base
1.0
Modified
CoA
1.0
0.8
0.6
y
0.4
0.2
0.0
–0.2
–0.4
–0.6
–0.8
–1.0
–1.0
–0.8
–0.6
–0.4
–0.2
0.0
0.2
0.4
0.6
0.8
1.0
x
Figure 5-12. I/O Characteristics of a Fuzzy Controller (Different Overlapping Degrees
of Membership Functions for the Output Terms)
PID Control Toolkit User Manual
5-16
ni.com
Chapter 5
Fuzzy Controllers
Instead, use output terms that membership functions model with equally
distributed typical values but different scopes of influence, to significantly
influence the controller characteristic. The different terms have different
areas and thus different weights with respect to the defuzzification process.
A wide output term has more influence on the inference result than a small
neighboring output term. This effect is demonstrated in Figure 5-13.
© National Instruments Corporation
5-17
PID Control Toolkit User Manual
Chapter 5
Fuzzy Controllers
Negative
Zero
Positive
Negative
1.0
1.0
μ(x) 0.8
μ(y) 0.8
0.6
0.6
0.4
0.4
0.2
0.2
0.0
–1.0
Rule
Base
–0.5
0.0
0.5
x
0.0
–1.0
1.0
Zero
–0.5
Positive
0.0
0.5
y
1.0
Max-MinInference
Rule 1: IF x = Negative THEN y = Negative
Rule 2: IF x = Zero
THEN y = Zero
Rule 3: IF x = Positive THEN y = Positive
Modified
CoA
1.0
0.8
0.6
y
0.4
0.2
0.0
–0.2
–0.4
–0.6
–0.8
–1.0
–1.0
–0.8
–0.6
–0.4
0.0
–0.2
0.2
0.4
0.6
0.8
1.0
x
Figure 5-13. I/O Characteristics of a Fuzzy Controller (Wide and Small
Membership Functions for the Output Terms)
Using CoA or CoM as the defuzzification method results in continuous
controller characteristic functions, especially within those intervals of the
input values in which two or more rules are active simultaneously. This
behavior results from the averaging character of the defuzzification
methods described in Chapter 4, Overview of Fuzzy Logic.
PID Control Toolkit User Manual
5-18
ni.com
Chapter 5
Fuzzy Controllers
When you use the MoM defuzzification method, you calculate the most
plausible result. In other words, the typical value of the conclusion term of
the most valid rule is taken as a crisp output value, which results in stepped
output characteristics, as shown in Figure 5-14.
Negative
Zero
Negative
Positive
μ(x) 0.8
μ(y)
0.6
0.4
0.4
0.2
0.2
Rule
Base
Positive
0.8
0.6
0.0
–1.0
Zero
1.0
1.0
0.0
–0.5
0.5
x
0.0
–1.0
1.0
–0.5
0.0
0.5
y
1.0
Max-MinInference
Rule 1: IF x = Negative THEN y = Negative
Rule 2: IF x = Zero
THEN y = Zero
Rule 3: IF x = Positive THEN y = Positive
Mean-ofMaximum
1.0
0.8
0.6
y
0.4
0.2
0.0
–0.2
–0.4
–0.6
–0.8
–1.0
–1.0
–0.8
–0.6
–0.4
0.0
–0.2
0.2
0.4
0.6
0.8
1.0
x
Figure 5-14. I/O Characteristic of a Fuzzy Controller with Mean-of-Maximum
(Entirely Overlapping Membership Functions for Input and Output Terms)
© National Instruments Corporation
5-19
PID Control Toolkit User Manual
Chapter 5
Fuzzy Controllers
The rule base itself has the biggest influence on the controller
characteristic. The rule base determines the principal functionality of the
controller.
Figure 5-15 illustrates how the controller characteristic changes if you
change the rule base of the previous example to include the following rules:
Rule 1: IF x = negative THEN y = negative
Rule 2: IF x = zero
THEN y = positive
Rule 3: IF x = positive THEN y = negative
PID Control Toolkit User Manual
5-20
ni.com
Chapter 5
Negative
Zero
Negative
Positive
Fuzzy Controllers
Zero
Positive
1.0
1.0
μ(x) 0.8
μ(y)
0.8
0.6
0.6
0.4
0.4
0.2
0.2
0.0
–1.0
0.0
–0.5
0.5
x
0.0
–1.0
1.0
–0.5
0.0
0.5
y
Max-MinInference
Rule 1: IF x = Negative THEN y = Negative
Rule 2: IF x = Zero
THEN y = Positive
Rule 3: IF x = Positive THEN y = Negative
Rule
Base
1.0
Modified
CoA
1.0
0.8
0.6
y
0.4
0.2
0.0
–0.2
–0.4
–0.6
–0.8
–1.0
–1.0
–0.8
–0.6
–0.4
–0.2
0.0
0.2
0.4
0.6
0.8
1.0
x
Figure 5-15. I/O Characteristic of a Fuzzy Controller with a Changed Rule Base
The examples show that you can use a fuzzy controller to perform arbitrary
I/O operations. The number of linguistic input and output terms depends on
the desired characteristic type and the precision to which you approximate
the given I/O characteristic.
© National Instruments Corporation
5-21
PID Control Toolkit User Manual
Chapter 5
Fuzzy Controllers
Consider, for example, the stepped linear characteristic curve shown in
Figure 5-16. There are four linear sections that you can describe with the
five circled base points (xi, yi).
x1
x2
x3
x4
y1 y2
1.0
x5
1.0
μ(x) 0.8
μ(y)
0.6
0.4
0.4
0.2
0.2
Rule
Base
–0.5
0.0
0.5
x
Rule 1: IF x = x1
Rule 1: IF x = x2
Rule 2: IF x = x3
Rule 3: IF x = x4
Rule 3: IF x = x5
0.0
–1.0
1.0
y4
y5
0.8
0.6
0.0
–1.0
y3
–0.5
0.0
1.0
0.5
y
THEN y = y1
THEN y = y2
THEN y = y3
THEN y = y4
THEN y = y5
Max-MinInference
Modified
CoA
(x5, y5)
1.0
0.8
0.6
(x4, y4)
y
0.4
0.2
0.0
–0.2
(x3, y3)
–0.4
–0.6
–0.8
–1.0
–1.0
(x1, y1)
–0.8
–0.6
–0.4
(x2, y2)
–0.2
0.0
0.2
0.4
0.6
0.8
1.0
x
Figure 5-16. Fuzzy Controller for a Given I/O Characteristic
PID Control Toolkit User Manual
5-22
ni.com
Chapter 5
Fuzzy Controllers
To use a single input fuzzy controller to reproduce the given characteristic,
use five linguistic terms each for the input and output quantities, naming
them x1, x2, …, x5 and y1, y2, …, y5, respectively. To obtain the stepped
linear sections between the base points, you must always have exactly
two available active rules. To implement this, entirely overlap the triangular
membership functions for the input variable, giving each a typical value
that corresponds to a certain base point component, xi.
To obtain characteristic sections that are exactly linear, you must model the
output variable with singleton membership functions, each of which has a
typical value that corresponds to a certain base point component, yi. The
rule base is then a linguistic enumeration of the five base points.
In principle, these conclusions about I/O characteristics are valid for fuzzy
controllers with two or more inputs as well. However, using the AND
operation to combine the different input conditions raises an additional
nonlinear effect. Usually the minimum operator models the
AND-operation that always prefers as a result the antecedence term of the
rule with the lowest degree of truth. Refer to Figure 5-16 for an example.
Figure 5-17 shows the I/O characteristic field for a dual input fuzzy
controller.
© National Instruments Corporation
5-23
PID Control Toolkit User Manual
Chapter 5
Fuzzy Controllers
Negative
Zero
NL
Positive
μ(x) 0.8
μ(y)
ZE
PS
PL
–0.5
0.0
0.5
y
1.0
0.8
0.6
0.6
0.4
0.4
0.2
0.2
0.0
–1.0
–0.5
Negative
0.0
0.5
x
Zero
0.0
–1.0
1.0
Positive
Input x
Rule
Base
1.0
Negative
Zero
Positive
Negative
NL
NS
ZE
Zero
NS
ZE
PS
Positive
ZE
PS
PL
0.8
0.6
Input dx/dt
μ(dx/dt)
NS
1.0
1.0
0.4
0.2
0.0
–1.0
–0.5
0.0
0.5
dx/dt
1.0
Max-Min- Inference
Modified CoA
y = f(x, dx/dt)
1.00
0.00
–1.00
1.00
dx/dt
0.00
–1.00
1.00
0.00
–1.00
x
Figure 5-17. I/O Characteristic Field of a Dual Input Fuzzy Controller
PID Control Toolkit User Manual
5-24
ni.com
Chapter 5
Fuzzy Controllers
Because the minimum operator used in the aggregation step is nonlinear,
the characteristic field is not exactly linear despite the entirely overlapping
membership functions that overlap entirely for both input variables.
Nonoverlapping membership functions yield a stepped characteristic field
with constant planes, as shown in Figure 5-18.
© National Instruments Corporation
5-25
PID Control Toolkit User Manual
Chapter 5
Fuzzy Controllers
Negative
Zero
NL
1.0
Positive
1.0
μ(x) 0.8
μ(y) 0.8
0.6
0.6
0.4
0.4
0.2
0.2
0.0
–1.0
0.0
–0.5
Negative
0.5
x
Zero
0.0
–1.0
1.0
Positive
Rule
Base
ZE
PS
PL
–0.5
0.0
0.5
y
1.0
Input x
Negative
Zero
Positive
Negative
NL
NS
ZE
Zero
NS
ZE
PS
Positive
ZE
PS
PL
0.8
0.6
Input dx/dt
μ(dx/dt)
1.0
NS
0.4
0.2
0.0
–1.0
0.0
–0.5
0.5
dx/dt
1.0
Max-Min- Inference
Modified CoA
y = f(x, dx/dt)
1.00
0.00
–1.00
1.00
dx/dt
0.00
1.00
0.00
–1.00 –1.00
x
Figure 5-18. I/O Characteristic Field of a Dual Input Fuzzy Controller
(Slightly Overlapping Input Terms)
PID Control Toolkit User Manual
5-26
ni.com
6
Design Methodology
This chapter provides an overview of the design methodology of a fuzzy
controller.
Design and Implementation Process Overview
Acquiring Knowledge
The knowledge base of a fuzzy controller determines its I/O characteristics
and thus the dynamic behavior of the complete closed-loop control circuit.
The knowledge base consists of the following parts:
•
Linguistic terms, defined by membership functions, that describe the
input and output quantities of the controller
•
Rule base that contains engineering knowledge
•
Operators for both the AND and OR operations
•
Fuzzy inference method and defuzzification method
Within the first system design step, you must establish all of the linguistic
variables and terms for the given application as the vocabulary of the
rule-based system. Use the rule base to formulate the control strategy, then
select an appropriate defuzzification method.
Optimizing Offline
Within this design step, you should test the prototype controller and
simulate it with either real process data previously recorded from the
process or simulation data obtained from a mathematical process model.
You can perform transfer characteristics analysis and time response
analysis to observe the system behavior and optimize the controller.
LabVIEW supports both types of analysis. In this step, you also can use
neuro fuzzy techniques, as well as genetic or evolutionary algorithms,
to optimize your system.
© National Instruments Corporation
6-1
PID Control Toolkit User Manual
Chapter 6
Design Methodology
Optimizing Online
With the data acquisition capabilities of LabVIEW, you can run the fuzzy
controller in conjunction with a process. Then, you can use online
optimization techniques to make modifications to the running system.
Implementing
Although you can use the fuzzy controller directly with LabVIEW,
real-time performance constraints might make it necessary to download
the fuzzy controller to a fast microcontroller board.
Defining Linguistic Variables
The sensors and actuators of the system to be automated determine the
input and output quantities of a fuzzy controller. Each additional quantity
you measure provides more information about the current process state.
However, although additional sensors can improve accuracy, they also can
increase cost.
Fuzzy systems do not require high-precision measurement equipment. In
fact, using inexpensive, lower-precision sensors to obtain many values is
better than using expensive, higher-precision sensors to acquire less data.
If measuring exact process quantities is too difficult, secondary quantities
that reveal less specific process information might be sufficient.
Number of Linguistic Terms
The possible values of a linguistic variable are the linguistic terms which
are linguistic interpretations of technical quantities. For example, the
quantity vehicle position x, which is usually called the base variable and is
measured in meters, can have the linguistic interpretations left, left center,
center, right center, and right.
When you create a linguistic variable, first determine how many terms
define the linguistic variable. In most applications, between three and seven
terms make up a linguistic variable. It makes no sense to use less than three
terms, because most linguistic concepts have at least two extreme terms
with a middle term between them. On the other hand, linguistic systems
that use more than seven terms are difficult to understand because humans
use their short-term memory to interpret technical quantities, and the
human short-term memory can only compute up to seven symbols
simultaneously.
PID Control Toolkit User Manual
6-2
ni.com
Chapter 6
Design Methodology
Linguistic variables usually have an odd number of terms because they are
defined symmetrically and they include a middle term between the
extremes.
As a starting point, set up the input variables with at least three or five terms
and the output variables with five or seven terms.
Standard Membership Functions
The degree of truth to which a measurement value of a technical quantity
satisfies the linguistic concept of a certain term of a linguistic variable is
called degree of membership. You can use a mathematical function to
model the degree of membership of a continuous variable.
You can apply the normalized standard membership functions illustrated in
Figure 6-1 to most technical processes. These standard functions include
Z-type, Λ-type (triangular shape), Π-type (trapezoidal shape), and S-type
membership function shapes.
Ζ-type
Λ-type
Π-type
S-type
Figure 6-1. Shapes of Standard Membership Functions
© National Instruments Corporation
6-3
PID Control Toolkit User Manual
Chapter 6
Design Methodology
To establish standard membership functions, complete the following steps,
illustrated in Figure 6-2.
1.
Define the typical value for each term. This is the value that best fits
the linguistic meaning of the term and yields the membership degree
µ = 1.
2.
For each term, set the membership degree to µ = 0 at the typical values
of neighboring terms.
3.
Connect the point µ = 1 with the points µ = 0 by straight lines, creating
triangular membership function shapes for all inner terms.
4.
Because there are no terms beyond the rightmost term and below the
leftmost term, all values that fall into this region belong to the
respective border term with the membership degree µ = 1.
Typical value for center is 5.0.
μ[x]
Left
Center
Left
Right
Center
Center
Right
1.0
0.8
0.6
0.4
0.2
0.0
0.0
1.0
2.0
3.0
4.0
5.0
6.0
7.0
8.0
9.0
10.0 [m]
Typical values for left center
and right center are 4.0 and 6.0.
Vehicle Position x
Figure 6-2. Definition of a Triangular Membership Function
for the Linguistic Term Center
PID Control Toolkit User Manual
6-4
ni.com
Chapter 6
Design Methodology
Sometimes the typical value of a term is an interval rather than a crisp
value. If, for example, the position center is characterized by the statement
x = 5 ±0.25 m, a trapezoidal membership function applies, as shown in
Figure 6-3.
μ[x]
Left
Center
Left
Right
Center
Center
Right
1.0
0.8
0.6
0.4
0.2
0.0
0.0
1.0
2.0
3.0
4.0
4.75
5.0
6.0
5.25
7.0
8.0
9.0
10.0 [m]
Vehicle Position x
Figure 6-3. Definition of a Trapezoidal Membership Function
for the Linguistic Term Center
If there is no a priori information available, begin with terms equally
spaced within the range of the associated variable, with each term entirely
overlapping the neighboring terms. Cover the desired stable region of the
system with a larger number of linguistic terms that have a small influence
interval rather than trying to cover the border regions with a smaller number
of linguistic terms that have a large influence interval. A term distribution
like this makes the controller more sensitive within the stable state region
of the system.
You must take into account disturbance effects, such as noise, on input
values such as noise. Do not set up membership functions with an interval
of influence that is smaller than the amplitude of the noise signal.
© National Instruments Corporation
6-5
PID Control Toolkit User Manual
Chapter 6
Design Methodology
Defining a Fuzzy Logic Rule Base
The fuzzy logic rule base is the main part of a fuzzy system and contains
all the engineering knowledge necessary to control a system. The rule base
supplies all the actions the fuzzy controller should perform in certain
situations. In a sense, the rule base represents the intelligence of the
controller.
Changes to a single rule only have a local influence on the controller
characteristic. Thus you can selectively change the behavior of the fuzzy
controller for a certain input situation by modifying a particular rule.
Because the modification of a rule is usually carried out in discrete steps
through changes to the consequence term, modifications to a rule have a
much greater influence on the controller characteristic than modifications
to the membership functions. Implement weight factors, or degrees of
support, for the rules to enhance or reduce the influence of a rule on the
controller characteristic.
To build up a rule base, define one rule for each combination of antecedent
terms, of the input variables used in the IF-part of the rule. Then select the
most plausible conclusion from the output variable to specify the
THEN-part of each rule.
Assume that you are building a fuzzy controller with m input variables,
each of which has p terms each. The total number N of possible rules is
N = p
p = number of terms for each input variable
m = number of input variables
m
For example, for three input variables with five terms each, the total number
of possible rules is 125. The complete rule base for five input variables with
seven terms each totals 16,807 rules.
Notice that for systems with numerous controller inputs, you can use
cascading fuzzy controllers to avoid large rule bases. Outputs from fuzzy
controllers serve as the inputs to the next layer of fuzzy controllers.
PID Control Toolkit User Manual
6-6
ni.com
Chapter 6
Design Methodology
In the case of a fuzzy controller with m input variables, each with an
individual number of terms pi (with 1 ≤ i ≤ m), there are a total of N possible
rules according to
m
N =
∏p
i
pi = number of terms for input variable i
m = number of input variables
i=1
This great degree of freedom allows a lot of design flexibility. However, it
is very difficult to implement the complete rule base in large and complex
systems. In such cases, you usually only implement the rules that cover the
normal system operation.
A fuzzy controller with an incomplete rule base must have a default action value,
which is usually the last command value, for input situations with no active rule.
Note
A rule base with at least one active rule for each possible combination
of crisp input values is called a complete rule base. Because there are
overlapping regions of the membership functions, an undefined output
in a rule base does not necessarily mean that there is no rule active for
a certain input situation.
The completeness of a rule base is not the only aspect to consider when you
deal with large rule bases. Avoid contradicting rules, rules with the same
IF-part but different THEN-parts because they are illogical. Contradicting
rules have only a marginal effect on the controller characteristic because
of the averaging process that occurs during the defuzzification step.
A consistent rule base is a rule base that has no contradicting rules.
If the rule base is small enough to contain all possible rules, it is not difficult
to detect inconsistencies. This is guaranteed for rule bases that can be built
in the form of a matrix. Refer to Figure 4-9, Complete Linguistic Rule Base,
for more information about rule bases in matrix form. However, many rule
bases are larger and more complex. To build these rule bases, begin with
just a few rules to operate input quantities and gradually add more rules.
It is difficult to detect inconsistencies in larger rule bases.
For fuzzy controllers with only two or three input quantities, it is possible
to estimate the qualitative controller characteristic just by looking at the
rule base. Neighboring terms within a rule matrix with strongly differing
meanings like positive large and negative small indicate steeply sloped
edges in the control surface, which usually are not desired. This is referred
© National Instruments Corporation
6-7
PID Control Toolkit User Manual
Chapter 6
Design Methodology
to as the continuity of a rule base. If neighboring rules have the same or
similar conclusions, the rule base is said to be continuous.
Within large rule bases it is possible to have multiple definitions of the same
rule. This is called redundancy. It has no influence on the inference result
at all if the Max-Min inference method is implemented. But there are other
inference methods, which are not discussed in this manual, such as the
Sum-Product method, in which multiple rules can effect the inference
result.
Operators, Inference Mechanism, and the
Defuzzification Method
In closed-loop control applications that use fuzzy logic, the standard
common operators for the AND- and the OR-operation are the Min- and
Max-operators discussed in the Using IF-THEN Rules in Fuzzy Inference
section of Chapter 5, Overview of Fuzzy Logic. Within certain control
applications in the field of process technology, however, it might be
necessary to use a compensatory AND-operator rather than the pure AND.
The most important compensatory AND-operator is the γ-operator, which
is not discussed in detail here. The γ-operator allows a continuous tuning
between AND, no compensation, and OR, full compensation. In real
situations the word AND is sometimes used to combine two antecedences
meaning as well as, indicating that you can compensate when you have a
little less of one quantity. This is exactly what the γ-operator, also called the
compensatory AND, can model. Refer to the Related Documentation
section of this manual for a list of documents with more information about
this topic.
The standard inference mechanism is the Max-Min method. Other
inference methods have only a marginal influence on the controller
characteristic.
The defuzzification method derives a crisp output value that best represents
the linguistic result obtained from the fuzzy inference process. As
explained in Chapter 4, Overview of Fuzzy Logic, there are generally
two different linguistic meanings of the defuzzification process: calculating
the best compromise, CoM or CoA, and calculating the most plausible
result, MoM.
PID Control Toolkit User Manual
6-8
ni.com
Chapter 6
Design Methodology
An important aspect of the defuzzification method is the continuity of the
output signal. Consider a fuzzy logic system with a complete rule base
and overlapping membership functions. A defuzzification method is
continuous if an arbitrary small change of an input value can never cause
an abrupt change in the output signal.
In this respect, the defuzzification methods CoM and CoA are continuous
because, assuming overlapping output membership functions, the best
compromise can never jump to a different value with a small change to the
inputs. To the contrary, the defuzzification method MoM is discontinuous
because there is always a point at which an arbitrary small change in the
input situation of the system will cause a switch to another more plausible
result. Refer to Table 6-1 for a comparison of different fuzzification
methods.
Table 6-1. Comparison of Different Defuzzification Methods
Method
Center-of-Gravity
(CoG)
Center-of-Area
(CoA)
Assessment
Criteria
Center-of-Maximum
(CoM)
Mean-of-Maximum
(MoM)
Linguistic
Characteristic
Best Compromise
Best Compromise
Most Plausible Result
Fit with
Intuition
Implausible with
varying membership
function shapes and
strong overlapping
membership functions
Good
Good
Continuity
Yes
Yes
No
Computational
Effort
Very High
Low
Very Low
Application
Field
Closed-Loop Control,
Decision Support,
Data Analysis
Closed-Loop Control,
Decision Support,
Data Analysis
Pattern Recognition,
Decision Support,
Data Analysis
6-9
PID Control Toolkit User Manual
© National Instruments Corporation
7
Using the Fuzzy Logic
Controller Design VI
This chapter describes how to use the Fuzzy Logic Controller Design VI
to design a fuzzy controller. This VI is available by launching LabVIEW
and selecting Tools»Control Design and Simulation»Fuzzy Logic
Controller Design.
Overview
The Fuzzy Logic Controller Design VI consists of the following parts:
•
Project Manager—Maintains a fuzzy logic project.
•
Fuzzy Set Editor—Defines and modifies linguistic variables
including their linguistic terms.
•
Rule Base Editor—Defines and modifies the rule base of a fuzzy
system to be designed.
•
Testing and project maintenance utilities.
Refer to the LabVIEW Help, available by selecting Help»Search the
LabVIEW Help, for more information about fuzzy logic control.
The following restrictions are valid:
•
The maximum number of linguistic variables is four.
•
The maximum number of linguistic terms for each linguistic variable
is nine.
•
The types of membership functions are normalized triangular and
trapezoidal membership functions (Z-, Λ-, Π- and S-Type) and
singletons.
© National Instruments Corporation
7-1
PID Control Toolkit User Manual
Chapter 7
Using the Fuzzy Logic Controller Design VI
Project Manager
Select Tools»Control Design and Simulation»Fuzzy Logic Controller
Design. The Fuzzy Logic Controller Design VI runs immediately when
you open it. This VI is a stand-alone application with a graphical user
interface for designing and editing a fuzzy controller. Although this VI
has no inputs or outputs, you can use it as a subVI. Place the icon on your
application diagram to allow your user to edit the fuzzy logic controller
programmatically.
LabVIEW automatically calls the Fuzzy-Set-Editor when you create a new
fuzzy logic project.
Figure 7-1 displays the Fuzzy Logic Controller Design VI front panel.
Figure 7-1. Project Manager Front Panel
You use the menu bar (1) to access options related to fuzzy logic
controllers. In particular, use the File menu (2) to load custom controllers
and create new ones. Use the Description text box (3) to enter a description
of the controller. The information area (4) shows information about the
controller.
PID Control Toolkit User Manual
7-2
ni.com
Chapter 7
Using the Fuzzy Logic Controller Design VI
Many of the commands in the fuzzy logic control portion of the
LabVIEW PID Control Toolkit work similarly to those in LabVIEW.
Select File»Save or File»Save as to store the project data to a file with an
.fc extension. Refer to the LabVIEW Help for more information about the
fuzzy logic controls.
Fuzzy-Set-Editor
Now, consider designing a fuzzy controller for the truck maneuvering
example described in the Rule-Based Systems section of Chapter 4,
Overview of Fuzzy Logic. When you begin a new project, it is best to enter
at least a short project description and the name of the developer into the
project identification field.
Select File»New to start the Fuzzy Set Editor. If there is an existing project
already loaded, select Edit»Set-Editor to open the Fuzzy Set Editor. The
Fuzzy Set Editor front panel is shown in Figure 7-2.
Figure 7-2. Default Fuzzy Controller Settings
This dialog box consists of the following components:
1.
Variable selector
2.
Term selector
© National Instruments Corporation
7-3
PID Control Toolkit User Manual
Chapter 7
Using the Fuzzy Logic Controller Design VI
3.
I/O select button
4.
Editing function selectors
5.
Term legend
6.
Term display with point slider field
A new project has certain default settings. Among these are two normalized
linguistic input variables with the default description identifiers in1 and
in2. Each input variable ranges from –1.0 to 1.0 by default. Each linguistic
input variable is composed of three entirely overlapping linguistic terms.
For in1, the linguistic terms NE1 (negative), ZE1 (zero), and PO1 (positive)
are predefined. For in2, the linguistic terms NE2 (negative), ZE2 (zero),
and PO2 (positive) are predefined.
There is one normalized linguistic output variable comprising the three
entirely overlapping linguistic terms NEo (negative), ZEo (zero), and POo
(positive). The default range of the output variable is –1.0 to 1.0.
The term display shows the linguistic terms of the linguistic variable that
the variable selector activates, while the term legend displays the term
description identifiers.
You can adjust the sliders or input controls in the point slider field to
interactively modify the linguistic term activated by the term selector.
The Fuzzy Set Editor controls modifications to terms with respect to
plausibility restrictions. To prevent the user from making implausible term
arrangements, LabVIEW dims all input sliders of term points that cannot
be modified because of plausibility restrictions.
When you move a particular point slider to modify a term shape, the Fuzzy
Set Editor controls and updates all input sliders according to plausibility
restrictions, too. Thus, the right top value of the term NE1 might not
override the left top value of the term ZE1. When you move the right top
slider, the Fuzzy Set Editor constantly updates this slider according to the
plausibility restriction mentioned above so that this point, right top of NE1,
cannot exceed the left top of ZE1. As the example in Figure 7-3 illustrates,
you cannot move the left-bottom point or left-top point of the term NE1
below the left-hand range limit of the input variable.
PID Control Toolkit User Manual
7-4
ni.com
Chapter 7
Using the Fuzzy Logic Controller Design VI
Figure 7-3. Plausibility Checking and Point Slider Movement
In the truck maneuvering example in the Rule-Based Systems section
of Chapter 4, Overview of Fuzzy Logic, there are two linguistic input
variables, vehicle position x and vehicle orientation β, and one linguistic
output variable, steering angle ϕ. It is a good idea to use descriptive
variable names instead of the default identifiers offered by the Fuzzy Set
Editor.
Select specify»rename variable to display the Rename dialog box. Now
you can enter the new description identifier vehicle-position into the
text input box above the OK button to change the selected variable
identifier in1. Figure 7-4 shows the dialog box. Click the OK button to save
the new variable identifier.
© National Instruments Corporation
7-5
PID Control Toolkit User Manual
Chapter 7
Using the Fuzzy Logic Controller Design VI
Figure 7-4. Rename Variable Dialog Box
After this, select the variable identifier in2 and enter the description
identifier vehicle-orientation into the text input box. Again, click
OK to save the new variable identifier. Click the Exit button to close the
Rename dialog box.
Click the I/O Select button to select CONSEQUENCE and access the
output variable. Follow the steps listed above to rename the output variable
to steering-angle. Return the button to the ANTECEDENCE position
to be able to use the variable selector to access the input variables.
The Fuzzy Set Editor starts a new project with two input variables, each
of which has the default data range interval [–1.0, +1.0]. The variable
data ranges must be changed for the truck application example. The
vehicle-position ranges from 0.0 to 10.0 meters and the vehicle-orientation
from –90.0 to +270.0 degrees.
Select specify»edit range to display the Define Range dialog box, from
which you can change the data range of the input variable vehicle position.
PID Control Toolkit User Manual
7-6
ni.com
Chapter 7
Using the Fuzzy Logic Controller Design VI
Enter the range boundaries as shown in Figure 7-5.
Figure 7-5. Edit Range Dialog Box
Click the Exit button to close the dialog box. Notice that all linguistic terms
of the linguistic variable are adapted to the new data range proportionally,
as shown in Figure 7-6.
Figure 7-6. Current Input Variable Data Range Changed
For the application example, repeat the steps discussed above to set up
the correct data range for the second input variable vehicle-orientation
and for the output variable steering-angle, which ranges from –30.0 to
+30.0 degree.
© National Instruments Corporation
7-7
PID Control Toolkit User Manual
Chapter 7
Using the Fuzzy Logic Controller Design VI
For the next step, you must have access to the input variable
vehicle-position. To access the variable, switch I/O Select to the
ANTECEDENCE position and select the desired input variable from
the variable selector.
Any modifications made during the Fuzzy Set Editor session can have
a significant influence on the rule base. It is always a good idea to open
the Rulebase Editor immediately after you close the Fuzzy Set Editor.
Because you started your Fuzzy Set Editor session with a new project,
the Fuzzy Logic VIs automatically call the Rulebase Editor to create a rule
base.
Because you still have to do additional work on the rule base, you should
add and set up all linguistic terms according to the application example.
You do not need to work with the Rulebase Editor at this point in the
project, so click Quit to exit the Rulebase Editor.
LabVIEW does not automatically call the Rulebase Editor when you are
working on an existing project and you close the Fuzzy Set Editor.
Regardless, closing the Fuzzy Set Editor as well as closing the Rulebase
Editor activates the Project Manager.
Use the File»Save or File»Save As command to save your project. When
LabVIEW prompts you to enter a file name, type in FuzzyTruck as the
project name. Notice that fuzzy controller project files always have the
extension .fc.
Use File»Open to load an existing project that has not yet been
loaded. Immediately after the Project Manager loads a project, select
Edit»Set-Editor to call the Fuzzy Set Editor. Now the input and output
variables have the correct names and data ranges.
The three entirely overlapping default terms NE1, ZE1, and PO1 still set
up the input variable, vehicle-position. Because vehicle-position must be
composed of the five linguistic terms shown in Figure 4-6, you must add
two new linguistic terms. Refer to the Rule-Based Systems section in
Chapter 4, Overview of Fuzzy Logic, for more information about linguistic
variables and linguistic terms. All linguistic terms must have the same
names and shapes so that the complete term arrangement corresponds to
that in Figure 4-6.
Select define»add term after to add a new linguistic term between
the terms NE1 and ZE1. The term identifier of the referred term with
a + symbol added to its right side composes the new term identifier.
PID Control Toolkit User Manual
7-8
ni.com
Chapter 7
Using the Fuzzy Logic Controller Design VI
NE1 is the term identifier of the active term, and the new term is NE1+, as
shown in Figure 7-7. Notice that the new term becomes the active term and
you can modify it immediately.
Figure 7-7. New Term Added to the Vehicle-Position Variable
Adding a new term to an input variable, especially one that is part of an existing
project, causes significant changes to the rule base. Additional rules automatically extend
the rule base. Each rule has a conclusion that is predefined as none. Adding a new
consequence term only extends the possibility to select conclusion terms within the
Rulebase Editor. Remember that each input and output variable can have a maximum
of nine linguistic terms.
Note
To add the second new term between ZE1 and PO1, first select ZE1 from
the term selector. With ZE1 as the active term, you can select define»
add term after to add the new term. LabVIEW adds the new term, ZE1+,
to the term display.
© National Instruments Corporation
7-9
PID Control Toolkit User Manual
Chapter 7
Using the Fuzzy Logic Controller Design VI
Before rearranging the linguistic terms according to the desired pattern,
select specify»rename term to assign the correct term identifiers. Refer
to Figure 4-6 for more information about the desired pattern. Figure 7-8
shows an intermediate state and Figure 7-9 shows the final result of this
renaming process.
Note
You also can use the specify menu to add or remove linguistic variables.
Figure 7-8. Rename Dialog Box
PID Control Toolkit User Manual
7-10
ni.com
Chapter 7
Using the Fuzzy Logic Controller Design VI
Figure 7-9. All Vehicle-Position Terms Named Correctly
The Fuzzy Set Editor offers many functions that you can use to modify
single terms or the whole term arrangement of the active variable. It is
a good idea to experiment with this function at this point in your project
because you must modify the whole term arrangement according to the
desired term arrangement shown in Figure 4-6. Figure 7-10 shows the term
arrangement you obtain when you select edit»full term-overlap all, which
results in a term arrangement with all terms of the active linguistic variable
completely overlapping each other.
The edit menu also has several other functions for automatically editing
membership functions. You can change individual membership functions,
or all of the membership functions, to singleton fuzzy sets, which are
typically used only for controller output. The tolerance function changes
a trapezoidal membership to a triangular function. In addition, you can set
the overlap between functions and make all functions symmetric. This
command does not affect the left side of the left-most term and the right
side of the right-most term.
© National Instruments Corporation
7-11
PID Control Toolkit User Manual
Chapter 7
Using the Fuzzy Logic Controller Design VI
Figure 7-10. A Term Arrangement of Completely Overlapping Terms
With the Fuzzy Set Editor functions described in this section, you can edit
all linguistic variables, including the desired term arrangements for the
FuzzyTruck example project. Figure 7-11 shows the result of the
complete editing session.
PID Control Toolkit User Manual
7-12
ni.com
Chapter 7
Using the Fuzzy Logic Controller Design VI
Figure 7-11. Results of the Complete Editing Session Example
© National Instruments Corporation
7-13
PID Control Toolkit User Manual
Chapter 7
Using the Fuzzy Logic Controller Design VI
Rulebase Editor
After you enter all the linguistic information of the application example
into your FuzzyTruck project, you can begin editing. The rule base
represents expert knowledge about the vehicle maneuvering process.
If it is not already active, select File»Open to load the example project,
FuzzyTruck. Select Edit»Rulebase-Editor to open the Rulebase Editor.
Because you have not explicitly entered or modified a rule at this point
in the example project, the Rulebase Editor begins with a project-specific,
complete default rule base.
LabVIEW assigns each possible combination of linguistic terms for each
of the input variables to a single rule with its consequence part set to none.
The Rulebase Editor offers a rule base that contains 35 rules because there
are five terms for the first input variable, vehicle-position, and seven terms
for the second input variable, vehicle-orientation.
If there are more than 15 rules available, LabVIEW activates a scrollbar, to
access the rules not currently displayed on the Rulebase Editor front panel.
Each rule is associated with a weight factor to enhance or reduce the
influence of a rule on the controller characteristic. The DoS ranges from
0.0 to 1.0. In a default rule base, all DoS values are automatically set to 1.0.
Use the Utils menu to set weights for all rules.
Use weight factors in combination with other techniques, such as genetic
algorithms, to optimize controller performance.
Enter the desired consequence of each rule to begin editing the rule base.
The consequence part of each rule is implemented as a term selection box
containing all possible consequence terms. You can select a consequence
term from the term selection box to specify the consequence of a particular
rule.
According to the rule base specified in Figure 4-9, Complete Linguistic
Rule Base, if the vehicle position is left and the vehicle orientation is left
down, the consequence term is negative small. When you select NegSmall
from the term selection box of the consequence part, the THEN part the
first rule of the rule base is:
IF vehicle-position is left AND vehicle-orientation is left down,
THEN set steering-angle to negative small.
PID Control Toolkit User Manual
7-14
ni.com
Chapter 7
Using the Fuzzy Logic Controller Design VI
You can enter the complete rule base this way. The IF part of the Rulebase
Editor automatically accommodates the number of input variables used in
the fuzzy controller.
Next, select an appropriate defuzzification method. Because there must be
a continuous output signal for the steering angle control, you must select
a defuzzification method that calculates the best compromise. Follow the
guidelines in Table 6-1, Comparison of Different Defuzzification Methods,
to choose either the CoM method or the CoA method.
Select the defuzzification method from the appropriate selector from the
Defuzzification Method pull-down menu.
You can use the default setting as the default controller output. The default
setting does not affect the application example because the fuzzy controller
has a complete rule base and overlapping term arrangements. In the
example, no input variables have definition gaps or undefined intervals.
Refer to Figure 5-10, I/O Characteristic of a Fuzzy Controller (Undefined
Input Term Interval), for more information about input variables.
The design work for the example project is complete. It is time to save the
project and see what documentation features are available for the fuzzy
logic controls.
Documenting Fuzzy Control Projects
The File»Print sub-menu offers documentation facilities for printing
information about the active project. Select Print»Complete
Documentation to print the complete controller documentation for
the example project.
Test Facilities
Before you run a fuzzy controller within a designated system environment,
study the I/O characteristics of the controller within the toolkit. You can
use these characteristics to optimize the fuzzy controller and make any
necessary modifications. The fuzzy logic controls provide an appropriate
test environment.
Select Test»I/O - Characteristics to call the test facility to perform the I/O
characteristic studies of a fuzzy controller.
© National Instruments Corporation
7-15
PID Control Toolkit User Manual
Chapter 7
Using the Fuzzy Logic Controller Design VI
For the application example, FuzzyTruck, previously loaded, the
Input/Output Characteristic test facility starts with a front panel similar
to the one shown in Figure 7-12.
Figure 7-12. I/O-Characteristic Project-Specific Front Panel
There is a different parameter control block in the input parameter field
of the Input/Output Characteristic front panel for each input variable of
the fuzzy controller. The toolkit uses the blocks to set up the desired test
conditions for the different controller inputs.
Suppose you want to vary the vehicle-position within the input data range
and keep the vehicle-orientation constant at 0° to observe how the behavior
of the controller output variable, steering-angle, changes with the
vehicle-position and the vehicle-orientation.
PID Control Toolkit User Manual
7-16
ni.com
Chapter 7
Using the Fuzzy Logic Controller Design VI
To set up these test conditions, first enter the desired test value into the
parameter control block for vehicle-orientation, as shown in Figure 7-13.
Figure 7-13. Entering a Test Condition into a Parameter Control Block
of the Input/Output Characteristic Front Panel
Then, click the Run button to begin calculating the I/O characteristic
within the parameter control block for vehicle-position.
LabVIEW executes the I/O characteristics calculation according to the
number of points specified in the No. Points control box. To animate the
calculation process, move the slider of the varying input variable.
The controller characteristic is calculated twice, varying the activated input variable,
which is vehicle-position in this example, from the minimum value up to the maximum
value, and vice versa. This happens because of possible hysteresis effects that occur with
incomplete rule bases. Definition gaps in the term arrangement of the input variable, which
cause the controller to use the default output value or the last originally-computed value,
also can cause LabVIEW to calculate the controller characteristic twice.
Note
© National Instruments Corporation
7-17
PID Control Toolkit User Manual
Chapter 7
Using the Fuzzy Logic Controller Design VI
As soon as the characteristic calculation completes, LabVIEW displays
the characteristic curve in the Input/Output Characteristic display, as
shown in Figure 7-14.
Figure 7-14. Controller Characteristic Displayed
This display contains a cursor that you can control with the cursor
navigation block. The cursor can travel along the characteristic curve and
identify the active rules for the input situation at each cursor position. The
Input/Output Characteristic panel displays the current input values and
controller output value.
PID Control Toolkit User Manual
7-18
ni.com
Chapter 7
Using the Fuzzy Logic Controller Design VI
The Active Rules display shows all active rules within the input situation
determined by the cursor position, including the degree of truth for each
antecedence term. You can select each active rule by clicking the pull-down
arrow to the right of the Active Rules display, as shown in Figure 7-15.
Figure 7-15. Selecting One of the Active Rules from the Active Rules Display
Click the Print button to print out the current situation for documentation
purposes.
© National Instruments Corporation
7-19
PID Control Toolkit User Manual
Implementing a Fuzzy Controller
8
This chapter describes how to implement a fuzzy controller and includes a
pattern recognition application example. There are several different ways
to use the Fuzzy Logic VIs to implement a fuzzy controller. The easiest
implementation uses the Fuzzy Controller VI.
Pattern Recognition Application Example
Suppose you need to develop and implement a fuzzy controller that
identifies the shape of different-sized triangular, hexagonal, and
rectangular plastic parts moving on a conveyor belt through a simple reflex
light barrier, as shown in Figure 8-1.
Conveyor Belt
Reflex Light Barrier
Moving Direction
Figure 8-1. Sensor Facility
The plastic parts can be symmetric or asymmetric. The reflex light barrier
reads a characteristic voltage signal for each plastic part. The signal
depends on the resistances set up on the light barrier. Measuring these
signals with a real sensor shows that even the signals of identical plastic
© National Instruments Corporation
8-1
PID Control Toolkit User Manual
Chapter 8
Implementing a Fuzzy Controller
parts vary to a certain extent. Different environmental conditions such as
scattered light can affect the signal. Figure 8-2 shows some typical voltage
drop curves derived from an asymmetric triangle, a lefthand-shaped
triangle.
(LDR)
U[V]
9.5
9.0
8.5
8.0
7.5
0
15
30
75
60
45
90
105 120
t/Tstep
Figure 8-2. Typical Voltage Drop Curves Obtained from a Lefthand-Shaped Triangle
To obtain a simple but efficient controller, abstract the curves shown in
Figure 8-2 into the idealized curve outline that is shown in Figure 8-3.
10.0
Input
Signal x(t)
8.0
Flipped
Input
Signal xf(t)
6.0
4.0
TS
2.0
dxf(t)/dt
0.0
–2.0
–4.0
–6.0
TU
TU
TH
50.00
10.00
–8.0
–10.0
0
10
20
30
40
50
TH
TD
TD
20.00
60
70 80
t/Tstep
90 100
Figure 8-3. Abstract Voltage Drop Curve for Feature Extraction
There are three distinguishable parts of the flipped input signal represented
by the dashed curve xf(t) in Figure 8-3. There is a rising curve part, a
constant part, and a falling curve part. Differentiation of the flipped input
PID Control Toolkit User Manual
8-2
ni.com
Chapter 8
Implementing a Fuzzy Controller
signal yields the dash-dotted curve, dxf(t)/dt, from which you can derive
the time intervals TU (up), TH (hold) and TD (down). When TS (signal)
represents complete operation time, you can extract the following features
for the desired pattern recognition:
TH / TS ≈ 0
==> Triangle
(TU–TD) / TS > 0 ==> lefthand-shaped
0 < TH / TS > 1 ==> Hexagon
(TU–TD) / TS ≈ 0 ==> symmetrical
TH / TS ≈ 1
(TU–TD) / TS < 0 ==> righthand-shaped
==> Rectangle
You can use existing functions or functions you can write in LabVIEW to execute
all the signal processing steps described above.
Note
Because the real sensor signal is not an idealized signal as shown above,
the characteristic features derived from it are not precise. You can model
them directly by the appropriate linguistic terms for the two linguistic input
variables TH/TS and (TU–TD)/TS. Using fuzzy logic control as described
in Chapter 7, Using the Fuzzy Logic Controller Design VI, the term
arrangements shown in Figures 8-4 and 8-5 exist for the input variables
TH/TS and (TU–TD)/TS.
Figure 8-4. Linguistic Term Arrangement of Input Variable TH/TS
© National Instruments Corporation
8-3
PID Control Toolkit User Manual
Chapter 8
Implementing a Fuzzy Controller
Figure 8-5. Linguistic Term Arrangement of Input Variable (TU–TD)/TS
The linguistic output variable object can be composed of singletons,
each of which represents a specific shape. Figure 8-6 shows the term
arrangement and Figure 8-7 shows the rule base.
PID Control Toolkit User Manual
8-4
ni.com
Chapter 8
Implementing a Fuzzy Controller
Figure 8-6. Linguistic Term Arrangement of the Output Variable, Object
Figure 8-7. Complete Rule Base Describing the Pattern Recognition Process
© National Instruments Corporation
8-5
PID Control Toolkit User Manual
Chapter 8
Implementing a Fuzzy Controller
The principal program structure of the pattern recognition facility is a loop
structure, which repeatedly takes the input signal from a data acquisition
board using the easy I/O VIs, for example, and processes the signal.
Consider the following simulation environment to experiment with the
fuzzy controller independent of specific data acquisition equipment.
The SignalGen VI on the left side of the block diagram shown in Figure 8-8
corresponds to the input side of a process controller. You can regard the
NumtoString VI on the right side of the diagram as the output side of a
process controller. The VI supplies all necessary output signals, including
the signals used for process animation.
Figure 8-8. Block Diagram of the Pattern Recognition Application
Prepared for Entering the Pre-Defined Fuzzy Controller VI
The SignalGenVI replaces the data acquisition part, including all the data
pre-processing activities, which directly supplies the necessary input
signals, TH/TS and (TU–TD)/TS, for the example application. All other
input and output signals used in the block diagram are part of the user
interface that includes all the controls and indicators you can use to adjust
the pattern recognition application example. Figure 8-9 shows the front
panel of the example.
PID Control Toolkit User Manual
8-6
ni.com
Chapter 8
Implementing a Fuzzy Controller
Figure 8-9. Front Panel of the Pattern Recognition Application
You can use the input signal def sliders to simulate the signal from the
reflex light barrier of the real system. You also can modify the signal max
and signal min sliders to use them to test how the fuzzy controller works
despite having a signal with a very small amplitude The scale xss slider
models a gain factor towards the signal that the data preprocessing step
performs. You also can use the slider to study how different signal
conditions can affect the result of the pattern recognition process.
© National Instruments Corporation
8-7
PID Control Toolkit User Manual
Chapter 8
Implementing a Fuzzy Controller
Fuzzy Controller Implementation
Now incorporate the fuzzy controller into the application block diagram.
You do not need to program the fuzzy controller. Instead, use the Fuzzy
Controller VI, shown in Figure 8-10.
The Fuzzy Controller VI can be connected with as many as four input
signals from a process and one output signal used as a control value.
Although the Fuzzy Controller VI has many different inputs and outputs,
at this time you only need those inputs and outputs shown in bold in
Figure 8-10.
Figure 8-10. Fuzzy Controller VI
You can connect the input signals TH/TS and (TU–TD)/TS to the Fuzzy
Controller VI inputs in1 and in2. You also can connect the output signal of
the Fuzzy Controller VI, called analog output, to the input side of the
NumtoString VI. Leave the rest of the inputs unconnected at this time.
PID Control Toolkit User Manual
8-8
ni.com
Chapter 8
Implementing a Fuzzy Controller
Loading Fuzzy Controller Data
You can compare the Fuzzy Controller VI to a microprocessor that does not
have an executable program loaded. To obtain the specific data for the
fuzzy controller, you must use the Load Fuzzy Controller VI to load the
required data into the Fuzzy Controller VI.
Because the controller data must be loaded into the Fuzzy Controller VI
when the pattern recognition application is started, place it outside the
While Loop, as shown in Figure 8-11.
Figure 8-11. Block Diagram of the Pattern Recognition Application
The application example is complete. You can switch back to the front
panel from the fuzzy controller and run the VI to start the pattern
recognition application.
Immediately after the application begins, a file dialog box prompts you to
enter the name of a file that contains the appropriate controller data. Open
the project file FuzzyTruck.fc, which represents the fuzzy controller you
designed earlier.
© National Instruments Corporation
8-9
PID Control Toolkit User Manual
Chapter 8
Implementing a Fuzzy Controller
When you load the fuzzy controller, drag the sliders to try different settings
for the pattern recognition process. You can see how the pattern recognition
process changes with different input signal conditions. Refer
to Figure 8-12.
Figure 8-12. Running the Pattern Recognition Application
Clicking the Cancel button rather than selecting the fuzzy controller data
file, FuzzyTruck.fc, executes the default fuzzy controller repeatedly.
Without having actual data loaded to the controller, it will use the default
data. See the block diagram of the complete pattern recognition application
shown in Figure 8-11.
PID Control Toolkit User Manual
8-10
ni.com
Chapter 8
Implementing a Fuzzy Controller
Because of security aspects that can occur when running a controller within
a real application environment, if someone clicks the Cancel button, the
controller should not start. To improve your controller design, place the
While Loop inside a Case Structure and connect the selection terminal to
the cancel output of the Load Fuzzy Controller VI. Figure 8-13 shows the
result. The TRUE case is empty, and the application quits if you click the
Cancel button.
Figure 8-13. Improved Controller Application Block Diagram
The complete pattern recognition application example also is available
within the fuzzy logic controls.
Saving Controller Data with the Fuzzy Controller
You might want to use a fuzzy controller like a predefined VI that you
do not have to load to run. You might wonder how the currently valid
controller data file can be the default for the controller so you can use
it as a stand-alone controller.
Complete these steps to build a stand-alone Fuzzy Controller VI for the
pattern recognition application example.
1.
Bring the application block diagram to the front and double-click
the icon of the Fuzzy Controller VI to open the VI.
2.
Bring the application front panel to the front.
© National Instruments Corporation
8-11
PID Control Toolkit User Manual
Chapter 8
Implementing a Fuzzy Controller
3.
Start the application to open the input file dialog box that requests
a fuzzy controller data file.
4.
Select the desired fuzzy controller data file.
5.
Stop the application.
6.
Bring the front panel of the Fuzzy Controller VI to the front.
7.
Select Edit»Make Current Values Default to make the currently
valid controller data the default.
8.
Choose one of two options. Save a copy of the Fuzzy Controller VI if
you want it to be available under a unique name. Select No when asked
to save the original Fuzzy Controller VI. Or, you can save the original
Fuzzy Controller VI, which now has the current controller data as
default values. Only the default values of the original Fuzzy Controller
VI have been changed. You can still use the VI as a general-purpose
Fuzzy Controller VI because the VI only uses the default values when
you apply the controller without loading specific data into the VI.
9.
Close the application.
Now you can use either the new VI or the modified one as a stand-alone
fuzzy controller as shown in Figure 8-14.
Figure 8-14. Application Block Diagram with Stand-Alone Fuzzy Controller VI
PID Control Toolkit User Manual
8-12
ni.com
Chapter 8
Implementing a Fuzzy Controller
Testing the Fuzzy Controller
There is another predefined VI available with the fuzzy logic controls that
you can use to build or test fuzzy control applications. The Test Fuzzy
Control VI supplies a fuzzy control test and application environment
for as many as four different controller inputs. Input assignment is set
automatically according to the data being loaded into the controller.
This VI was created to show the proper use of all input and output signals
supplied by the Load Fuzzy Controller VI and the Fuzzy Controller VI.
Figure 8-15 shows the Test Fuzzy Control VI front panel.
Figure 8-15. Test Fuzzy Control VI Front Panel
The controller displays the fuzzy controller project identifier as soon as you
load the fuzzy controller data file. The input name displays the identifiers
of all used inputs. The minimum and maximum display the appropriate
currently valid data range for each used input variable. You can use input
value to enter input values to stimulate the controller. The controller out
indicator displays the output value. The lower data range values
automatically initialize the corresponding input value.
© National Instruments Corporation
8-13
PID Control Toolkit User Manual
Chapter 8
Implementing a Fuzzy Controller
Figure 8-16 shows the application front panel immediately after loading the
fuzzy controller data file for the pattern recognition example.
Figure 8-16. Test Fuzzy Control VI Front Panel with Controller Data Loaded
Remember that if there is an input situation not covered by active rules,
a fuzzy controller uses default values. The output assessment displays
a message to indicate such a situation.
If input values exceed the data range assigned to the related input variable,
the error ring displays an error message and the output value is set to the
default output value, as shown in Figure 8-17.
Figure 8-17. Test Fuzzy Control VI Front Panel with Incorrect Input Value for Input 1
PID Control Toolkit User Manual
8-14
ni.com
Chapter 8
Implementing a Fuzzy Controller
Figure 8-18 shows the proper use of all input and output signals supplied
by the Load Fuzzy Controller VI and the Fuzzy Controller VI. You can use
this program structure as a basis for building your own fuzzy logic
applications.
Figure 8-18. Test Fuzzy Control VI Block Diagram Example
Note You can connect the inputs and the controller output directly to the outputs and
inputs of the DAQ VIs available in LabVIEW in order to use real process data from sensors
instead of the values from the panel controls as shown in Figures 8-16 and 8-17.
© National Instruments Corporation
8-15
PID Control Toolkit User Manual
Technical Support and
Professional Services
A
Visit the following sections of the award-winning National Instruments
Web site at ni.com for technical support and professional services:
•
Support—Technical support resources at ni.com/support include
the following:
–
Self-Help Technical Resources—For answers and solutions,
visit ni.com/support for software drivers and updates, a
searchable KnowledgeBase, product manuals, step-by-step
troubleshooting wizards, thousands of example programs,
tutorials, application notes, instrument drivers, and so on.
Registered users also receive access to the NI Discussion Forums
at ni.com/forums. NI Applications Engineers make sure every
question submitted online receives an answer.
–
Standard Service Program Membership—This program
entitles members to direct access to NI Applications Engineers
via phone and email for one-to-one technical support as well as
exclusive access to on demand training modules via the Services
Resource Center. NI offers complementary membership for a full
year after purchase, after which you may renew to continue your
benefits.
For information about other technical support options in your
area, visit ni.com/services, or contact your local office at
ni.com/contact.
•
Training and Certification—Visit ni.com/training for
self-paced training, eLearning virtual classrooms, interactive CDs,
and Certification program information. You also can register for
instructor-led, hands-on courses at locations around the world.
•
System Integration—If you have time constraints, limited in-house
technical resources, or other project challenges, National Instruments
Alliance Partner members can help. To learn more, call your local
NI office or visit ni.com/alliance.
© National Instruments Corporation
A-1
PID Control Toolkit User Manual
Appendix A
Technical Support and Professional Services
If you searched ni.com and could not find the answers you need, contact
your local office or NI corporate headquarters. Phone numbers for our
worldwide offices are listed at the front of this manual. You also can visit
the Worldwide Offices section of ni.com/niglobal to access the branch
office Web sites, which provide up-to-date contact information, support
phone numbers, email addresses, and current events.
PID Control Toolkit User Manual
A-2
ni.com
Glossary
A
aggregation
An operation in fuzzy logic in which several fuzzy sets are combined to
produce a single fuzzy set.
algorithm
A prescribed set of well-defined rules or processes for the solution of
a problem in a finite number of steps.
anti-reset windup
A method that prevents the integral term of the PID algorithm from moving
too far beyond saturation when an error persists.
autotuning
Automatically testing a process under control to determine the controller
gains that will provide the best controller performance.
Autotuning Wizard
An automated graphical user interface provided in the PID Autotuning VI.
The Autotuning Wizard gathers some information about the desired control
from the user and then steps through the PID autotuning process.
B
bias
The offset added to a controller output.
Boolean set theory
Traditional set theory based on strict membership or nonmembership of
elements to a set. Examples are TRUE or FALSE, ON or OFF, 1 or 0,
and so on.
bumpless transfer
A process in which the next output always increments from the current
output, regardless of the current controller output value; therefore, transfer
from automatic to manual control is always bumpless.
C
cascade control
Control in which the output of one controller is the setpoint for another
controller.
Center of Area (CoA)
Method of defuzzification in which the crisp output is determined by the
geometrical center of the composite output membership function. Also
known as Center of Gravity (CoG).
© National Instruments Corporation
G-1
PID Control Toolkit User Manual
Glossary
Center of Maximum
(CoM)
Method of defuzzification in which the crisp output is determined by
a weighted average of the maximum values of each output membership
function. This method is equivalent to the Center of Area method using
singleton sets.
closed loop
A signal path which includes a forward path, a feedback path,
and a summing point and which forms a closed circuit. Also called
a feedback loop.
composition
The process by which a fuzzy controller combines all of the fuzzy subsets
assigned to each output variable to form a single fuzzy subset for each
output variable.
controller
Hardware and/or software used to maintain parameters of a physical
process at desired values.
controller output
See manipulated variable.
crisp value
A finite single value such as a measured physical quantity, for example,
x = 5.3 m.
cycle time
The time between samples in a discrete digital control system.
D
damping
The progressive reduction or suppression of oscillation in a device
or system.
deadtime (Td)
The interval of time, expressed in minutes, between initiation of an input
change or stimulus and the start of the resulting observable response.
defuzzification
The process of converting the linguistic output of the rulebase evaluation
to a crisp controller output value.
degree of membership
A value that represents the degree of partial membership of an element
to a fuzzy set. This value may range from 0 to 1.
degree of support
A weighting value, ranging from 0 to 1, that is applied to each rule in the
rule base of a fuzzy controller. This weighting value represents the relative
significance of each rule and allows for fine-tuning of the rule base.
derivative (control)
action
Control response to the time rate of change of a variable. Also called
rate action.
PID Control Toolkit User Manual
G-2
ni.com
Glossary
derivative kick
A sudden change in PID controller output resulting from derivative action
applied to the error signal after a change in setpoint value. Derivative kick
is normally avoided in PID control by applying derivative action only to the
process variable and not to the error signal.
deviation
Any departure from a desired value or expected value or pattern.
downstream loop
In a cascade, the controller whose setpoint is provided by
another controller.
E
EGU
Engineering units.
expert
A human operator of a system or process that has acquired knowledge
related to controlling the process through experience.
F
FC
Flow controller.
feedback control
Control in which a measured variable is compared to its desired value
to produce an actuating error signal that is acted upon in such a way
as to reduce the magnitude of the error.
feedback loop
See closed loop.
fuzzification
The process of evaluating crisp controller input values, or process
parameters, using the defined membership functions to determine linguistic
input variables for the rulebase evaluation.
fuzzy inference
The process by which the rules of the rule base are evaluated to determine
output linguistic variables for defuzzification.
fuzzy set
A set that allows for partial membership of elements. Fuzzy sets usually
represent linguistic terms and are defined quantitatively by a membership
function.
fuzzy set theory
An extension of traditional Boolean set theory based on the idea that
fuzzy sets may be defined such that elements can have partial membership
to the set.
© National Instruments Corporation
G-3
PID Control Toolkit User Manual
Glossary
G
gain
For a linear system or element, the ratio of the magnitude, or amplitude,
of a steady-state sinusoidal output relative to the causal input; the length of
a phasor from the origin to a point of the transfer locus in a complex plane.
Also called the magnitude ratio.
gain scheduling
The process of applying different controller gains for different regions of
operation of a controller. Gain scheduling is most often used in controlling
nonlinear physical processes.
I
integral (control)
action
Control action in which the output is proportional to the time integral of the
input. That is, the rate of change of output is proportional to the input.
ISA
Instrument Society of America—The organization that sets standards for
process control instrumentation in the United States.
K
K
Process gain.
Kc
Controller gain.
L
lag
A lowpass filter or integrating response with respect to time.
linearity factor
A value ranging from 0 to 1, used to specify the linearity of a calculation.
A value of 1 indicates a linear operation. A value of 1 indicates a squared
nonlinear operation
linguistic term
A word or set of words to describe a quality of a process variable (for
example, hot, very low, small positive, and so on). The term is defined
quantitatively by the corresponding membership function.
linguistic variable
Defines the state of a process variable by the degree of membership of the
parameter to each linguistic term defined (for example, vehicle position
{left 0.0; left center 0.0; center 0.8; right center 0.1; right 0.0}).
PID Control Toolkit User Manual
G-4
ni.com
Glossary
load disturbance
The ability of a controller to compensate for changes in physical
parameters of a controlled process while the setpoint value remains
constant.
loop cycle time
Time interval between calls to a control algorithm.
M
magnitude ratio
See gain.
manipulated variable
A quantity or condition that is varied as a function of the actuating error
signal so as to change the value of the directly controlled variable. Also
called controller output.
Max-Min inference
Fuzzy inference method using the maximum function for the OR operator
and the minimum function for the AND operator. Another common
inference method is the Max-Prod, method which uses the product function
for the AND operator.
Mean of Maximum
(MoM)
Method of defuzzification in which the crisp output is determined by
selecting a value corresponding to the maximum degree of membership
of the composite output membership function. If there are multiple
maximums, the mean of the corresponding values is selected.
membership function
A function that defines degree of membership to the fuzzy set over
a defined universe of discourse of the variable parameter.
N
noise
In process instrumentation, an unwanted component of a signal or variable.
Noise may be expressed in units of the output or in percent of output span.
O
output limiting
Preventing a controller output from travelling beyond a desired maximum
range.
overshoot
The maximum excursion beyond the final steady-state value of output
as the result of an input change. Also called transient overshoot.
© National Instruments Corporation
G-5
PID Control Toolkit User Manual
Glossary
P
P
Proportional.
P controller
A controller which produces proportional control action only; that is,
a controller that has only a simple gain response.
partial membership
In fuzzy set theory, a condition in which the value of a member partially
fulfills the requirements of the membership function of a set.
PC
Pressure controller.
PD
Proportional, derivative.
PD controller
A controller that produces proportional plus derivative (rate) control action.
PI
Proportional, integral.
PI controller
A controller that produces proportional plus integral (reset) control action.
PID
Proportional, integral, derivative.
PID control
A common control strategy in which a process variable is measured and
compared to a desired set point to determine an error signal. A proportional
gain (P) is applied to the error signal, an integral gain (I) is applied to the
integral of the error signal, and a derivative gain (D) is applied to the
derivative of the error signal. The controller output is a linear combination
of the three resulting values.
PID controller
A controller that produces proportional plus integral (reset) plus derivative
(rate) control action.
process gain (K)
For a linear process, the ratio of the magnitudes of the measured process
response to that of the manipulated variable.
process variable (PV)
The measured variable (such as pressure or temperature) in a process
to be controlled.
proportional action
Control response in which the output is proportional to the input.
proportional band (PB)
The change in input required to produce a full range change in output due
to proportional control action. PB = 100 /Kc.
PID Control Toolkit User Manual
G-6
ni.com
Glossary
Q
quarter-decay ratio
A response in which the amplitude of each oscillation is one-quarter that
of the previous oscillation.
R
ramp
The total (transient plus steady-state) time response resulting from a sudden
increase in the rate of change from zero to some finite value of the input
stimulus. Also called ramp response.
rate action
Control response to the time rate of change of a variable. Also called
derivative control action.
reentrant
Execution mode in which calls to multiple instances of a subVI can execute
in parallel with distinct and separate data storage.
reset rate
Of proportional plus integral or proportional plus integral plus derivative
control action devices: for a step input, the ratio of the initial rate of change
of output due to integral control action to the change in steady-state output
due to proportional control action.
Of integral control action devices: for a step input, the ratio of the
initial rate of change of output to the input change. Also called integral
action rate.
rule
A linguistic definition of a specific control action of the form
IF {condition} AND {condition}... THEN {action}. For example,
IF vehicle position is right center AND vehicle orientation is left up
THEN steering angle is negative medium.
rule base
A complete set of rules defined for control of a given system. Used during
fuzzy inference to determine the linguistic controller output.
S
selector control
The use of multiple controllers and/or multiple process variables in which
the connections may change dynamically depending on process conditions.
singleton
A normalized membership function with an infinitely small width.
A singleton is used to model a crisp value with a fuzzy set.
© National Instruments Corporation
G-7
PID Control Toolkit User Manual
Glossary
SP
Setpoint—An input variable which sets the desired value of the controlled
process variable.
span
The algebraic difference between the upper and lower range values.
stochastic uncertainty
The degree of uncertainty of the occurrence of a given future
nondeterministic event.
T
time constant (T)
In process instrumentation, the value T (in minutes) in an exponential
response term, A exp (–t/T), or in one of the transform factors, such
as 1+sT.
transient overshoot
See overshoot.
trapezoidal integration
A numerical of integration in which the current value and the previous
value are used to calculate the addition of the current value to the integral
value.
W
windup area
PID Control Toolkit User Manual
The time during which the controller output is saturated at the maximum or
minimum value. The integral action of a simple PID controller continues to
increase (wind up) while the controller is in the windup area.
G-8
ni.com
Index
A
setting timing, 3-2
diagnostic tools (NI resources), A-1
documentation
conventions used in this manual, ix
NI resources, A-1
related documentation, x
drivers (NI resources), A-1
AND operator, 4-10
Aström, K. J., x
Autotuning Algorithm
tuning formulas, 2-8
PI control (fast), 2-9
PI control (normal), 2-9
PI control (slow), 2-9
P-only control (fast), 2-8
P-only control (normal), 2-8
P-only control (slow), 2-8
E
error calculation, 2-2
examples (NI resources), A-1
B
F
bumpless transfer, 2-3
FPGAs, 3-18
C
G
calculating controller action, 2-1
control strategies, 3-1
controller output, 2-3
conventions used in this manual, ix
Corripio, A. B., x
gain scheduling, 2-4
H
Hagglund, T., x
Hang C. C., x
help, technical support, A-1
Ho, W. K., x
D
DAQ hardware with PID
hardware-timed DAQ control loop, 3-24
software-timed DAQ control loop, 3-22
software-timed DAQ control loop with
advanced DAQ functions, 3-23
designing control strategies, 3-1
manual tracking techniques, 3-4
closed-loop tuning, 3-4
open-loop tuning, 3-5
step test, 3-5
ultimate gain, 3-4
© National Instruments Corporation
I
instrument drivers (NI resources), A-1
K
KnowledgeBase, A-1
I-1
PID Control Toolkit User Manual
Index
N
programming examples (NI resources), A-1
proportional action, 2-2, 2-5
National Instruments support and
services, A-1
Nichols, N. B., x
nonlinear adjustment of integral
action, 2-2, 2-6
R
related documentation, x
S
O
setpoint relay experiment, 2-7
Shinskey, F. G., x
software (NI resources), A-1
support, technical, A-1
output limiting, 2-3
P
partial derivative action, 2-2
PID Algorithm
calculating controller action, 2-1
controller output, 2-3
error calculation, 2-2
nonlinear adjustment of integral
action, 2-2, 2-6
output limiting, 2-3
partial derivative action, 2-2
proportional action, 2-2, 2-5
trapezoidal integration, 2-2, 2-6
gain scheduling, 2-4
PID algorithms
Autotuning Algorithm, 2-7
PID Algorithm, 2-1
PID software, 3-1
with DAQ, 3-21
with FPGAs, 3-18
PID toolkit
using with DAQ
hardware-timed DAQ control
loop, 3-24
software-timed DAQ control
loop, 3-22
software-timed DAQ control
loop with advanced DAQ
functions, 3-23
PID Control Toolkit User Manual
T
technical support, A-1
timing, 3-2
training and certification (NI resources), A-1
trapezoidal integration, 2-2, 2-6
troubleshooting (NI resources), A-1
tuning, 3-4
W
Web resources, A-1
Z
Ziegler, J. G., x
I-2
ni.com