1
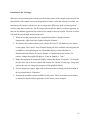
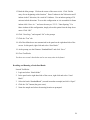
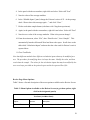
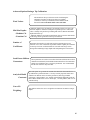
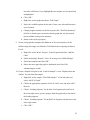
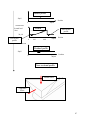
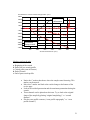
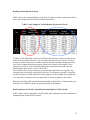
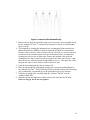
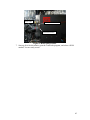
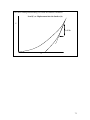
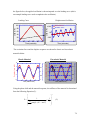
Penetration Curves With Roughness (nm)
4000
Residual
deformation
3000
2000
1000
0
a
M
b
e
-1000
-2000
-3000
C
-4000
-5000
-6000
Penetration
during scratch
d
-7000
100
200
300
400
500
600
700
Scratch Distance (um)
Markers used on the plot:
a: Beginning of the scratch
b: End of the pre-scratch profile
c: Critical point (start of fracture)
d: End of Scratch
e: End of post-scratch profile
•
•
•
•
•
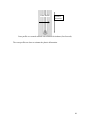
Notice the C marker that shows where the sample starts fracturing. This
marker can be moved.
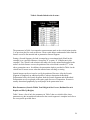
Move the C marker and look at the results change at the bottom of the
review page
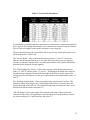
Look at the residual penetration and the maximum penetration during the
scratch.
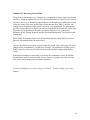
These channels can be plotted on their own. Try to look at the original
shape of the sample by plotting “original morphology” vs. “scratch
distance”
Plot the cross profile contours (“cross profile topography” vs. “cross
profile distance”)
51