1
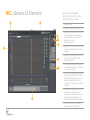
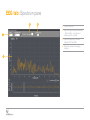
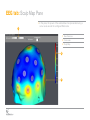
NIC 1. 4 User Guide Neuroelectrics Instrument Controller, version 1.4.6 Rev. 2015-06-06 How to Contact Neuroelectrics Mail Avda. Tibidao 47 bis 08035 Barcelona Spain Tel. +34 93 254 03 66 Fax +34 93 212 64 45 E-mail [email protected] Web http: www.neuroelectrics.com About this Guide >> This guide will introduce you to experimentation features provided by Neuroelectrics Instrument Controller software, hereafter called NIC. >> Now, assuming you have already installed NIC, let’s launch NIC. Contents >> What is NIC? >> How is NIC organized? >> General Principles >> Pairing your device >> NIC: Generic User Interface Elements >> The EEG tab and its panes >> The Stimulation tab and its panes >> The Settings tab and panes >> Advanced functions: communicating with NIC via TCP/IP >> NE data formats What is NIC? >> NIC stands for Neuroelectrics Instrument Controller. NIC is a software graphical user interface for local control of NE devices such as Enobio or StarStim. >> NIC runs on several platforms, including Windows Vista/7/8 and Mac OS X. >> NIC is used for various tasks: •pairing and managing NE bluetooth devices •controlling devices •recovery of data transmitted by NE devices •in the near future, NIC will also be used for communication with NE’s cloud How is NIC organized? >> NIC is organized by Tabs (top navigation bar) and Panes (left navigation bar) in each tab. >> Some tabs will activate and become visible only when NIC is paired with a specific type of device. E.g., the Stimulation tab appears when NIC is paired with a StarStim class device only. >> NIC’s first task is to connect to a bluetooth NE device. While this is happening, a splash screen is shown. If this fails, you will be sent to the Settings Pane to select and pair to a device. >> Now, assuming you have already installed NIC, let’s launch NIC. General principles >> NIC can pair (communicate with) with different NE devices. It will automatically modify its appearance depending on the device it pairs to at any given time. E.g., a Stimulation tab will appear when connecting to a StarStim device, but not with an Enobio device. >> NIC is designed to provide online information on EEG. Filtering of data is for visualization purposes- data is always saved raw (with the exception of the optional line noise filter - see Settings/Advanced Settings - which is applied to data on file). >> Orange colors in LEDs mean “on”, grey means “off”. >> Push buttons: darker means “pressed”. >> During stimulation (StarStim only), NIC needs to maintaincontinuous bluetooth communication with StarStim. If communication is broken, StarStim will abort the stimulation session. >> At NE we believe in the value of EEG data. EEG data is recorded during stimulation as well. EEG data recorded using tDCS is affected by an offset, but no extra noise. Our EEG amplifiers do not saturate (we use 24 bit digitization). >> Finally, as NIC is currently evolving more features will be added in the near future. Pairing your device >> If you haven’t already, first go to the Settings tab/Bluetooth pane. >> Switch on your NE device and push the scan button. >> Once NIC displays the device identifier, select it and push the Select device button. >> Wait a few seconds for NIC to reconfigure. The Bluetooth LED will blink and become steady when done. >> If the above fails, try using the provided bluetooth USB dongle (Windows only), and/or restarting the NE device, your laptop bluetooth or your laptop/computer. Pairing can be tedious on some devices. >> Some computers ask for a permission to connect the device the first time. The user should accept by pressing on this dialog >> Once you have paired with a device, NIC will try to connect to it when it is launched. NIC: Startup splash screening 1 NIC is connecting to your last used device. If this fails, you will be sent to the Settings tab. 1 NIC: Generic UI Elements 1 Some user interface (UI) elements are common to all or most tabs. These include: 9 1 navigation tabs 2 navigation Panes within each tab 3 4 5 2 6 7 3 Bluetooth connectivity led. Will be off when disconnected, blinking when attempting to connect, on when connected. LED (orange = on) 4 Battery level indicator (in % battery charge and with a built-in “reserve” margin) 5 Signal monitoring pane to turn on or off tracking of EEG or other streamed signals 6 Recording pane with led, elapsed time and remaining time. Led will be on during recording. 7 TCP/IP streaming pane with server address and clients. NIC streams data using TCP/IP and the server address indicated. Clients can connect to this address to collect raw data. 8 8 Visualization filtering pane (filters apply only to visualization, not recording of data, which is saved as is). See Settings/Advanced Settings for the default filter setup. 9 Device identifier (e.g., currently paired to an Enobio device). EEG Setup tab: Time Domain pane >> The EEG tab displays EEG and other streamed data online using several views. >> In the Time Domain Pane the user can see the data as it is being received, choosing different time and voltage scales. >> For convenience, channels can be turned on or off using channel buttons (with a small led). >> A visualization filter can be configured and applied (to all the channels). The user can configure a “Default” filter in the Advanced Settings Pane (Settings tab). >> A reference channel can be selected to clean data from noise common to all channels (the reference channel is subtracted from all other channels). This choice applies to all visualization Panes. >> EEG data is plotted in NE’s orange. If stimulation is taking place, the used channels will be shown in purple with a zero value (our convention for displaying stimulation data in NIC). You can record data to file by pushing the “Start” button in the recording sub-pane. You can configure recording duration in the Settings tab, Output pane (00:00:00 time means recording will continue until manually stopped). >> Note that computer screens have finite resolution. This implies that there has to be frequency cutoff for visualization (Nyquist theorem). This is automatically applied. Short time scales allow for visualization at higher frequencies. EEG tab: Time Domain Pane 1 2 3 1 Reference Channel (if chosen, this channel data is subtracted from all channels) 4 5 2 Temporal visualization window span with zoom buttons. Affects x-axis span (in seconds) 6 7 3 Vertical division (set here to 60 uV (microvolt) per division) 4 Manual vertical scale zoom 5 Vertical zoom autoscale. Unclick for manual mode 6 Signal monitoring is on 7 Recording is off 8 Visualization filter is off 8 EEG tab: Placement Pane 1 2 3 >> In this pane, the users of Enobio 8 and StarStim can select which postions correspond to each connected channel >> For Enobio 20 and Enobio 32 the positions cannot be modified because they are fixed 4 1 Channel display for ECG or EXT electrodes 2 Channel display for standard cap positions 3 Channel display for EOG electrodes 4 Position setting for each channel 5 Set as Default button: sets the current positions as default for the software 5 EEG tab: Settings Pane 1 2 1 Optional File format selection 2 SD card recording activation 3 Recording ID. Used for the name of the recorded file 4 Output directory for the recordings 3 5 4 5 Duration of the recording. For both in NIC and for Offline SD card recording 6 Tags for manual markers, for the 1-9 keys of the keyboard 7 Inclusion of the TPC markers in the tcp streaming 8 Name of the LSL streams to receive triggers from a ERP software or to stream markers to another NIC 6 9 Indication of LSL connection Orange: Outlet connected Green: trigger received 7 8 8 EEG tab: Spectrum pane >> The Spectrum Pane allows you to select a channel (referenced to your channel of choice, see the EEG/Time Domain Pane) and visualize its power spectrum online. >> You can choose different time scales for averaging the spectrum (Time Window), and choose among a linear or log10 scale for the power spectrum (natural units are microvolt2/Hz = uV2/Hz). >> Visualization filters can also be applied in this Pane. >> Temporal scales and filters can similarly be altered. EEG tab: Spectrum pane 3 1 4 1 Channel selector 2 Spectrum (power spectral density - Welch with 1 s window and Hamming 90% overlap) 3 Feature to display to choose between FFT and PSD 4 Spectrum temporal averaging window 2 EEG tab: Spectrogram pane >> The Spectrogram Pane allows you to select a channel (referenced to your channel of choice, see the EEG/Time Domain Pane) and visualize its power spectrogram online. That is, you can get information about the frequency content of the data as a function of time (time-frequency analysis). >> You can choose a linear or log scale for the power spectrum (natural units are microvolt2/Hz = uV2/Hz), and use different color schemes (colormap). >> Visualization filters can also be applied in this Pane. >> Temporal scales and filters can similarly be altered. EEG tab: Spectrogram Pane 1 1 Range control 2 Color scale 2 EEG tab: Features Pane 1 >> In this pane, the common EEG bands power is displayed >> The time plot for a selected feature or ratio between features is also displayed >> The user can choose between the common EEG bands or a custom band 2 1 Channel selector 2 Band Feature selector 3 Time Plot for the selected feature 2 4 Power bar representation for the common EEG bands 5 Power bar representation for the selected band or ratio 4 5 EEG tab: Scalp Map Pane 1 >> In this pane, the power of the selected band is represended using a colour scale around the configured Electrodes 1 Band Selection 2 Color scale 3 Scalp Map 2 3 For experts: about PSDs and filtering >> PSD (Power Spectral Density) Calculation: Data is stored in a one second FIFO buffer for a given electrode selected by the user. Every 100 ms the Fast Fourier Transform (FFT) is computed over this buffer. The FFT is calculated unilaterally over fixed or floating point temporal windows. The buffered signal is detrended and multiplied by a Hamming window prior the FFT. To calculate the PSD the complex power of two of the Fourier coefficients is performed and each one is divided by the buffer length. >> PSD Representation: The Spectrogram delivers every 0.1 seconds the PSD coefficients of the last temporal window evaluated. As it was explained before, a 1 second window with 0.9 seconds overlap is used to compute the FFT delivering its coefficients with a one Hz resolution. The PSD Representation graph plots the average of the coefficients obtained over the last N seconds, defined by the user, ranging from 2 to 6 seconds. Every time a new PSD calculation arrives the graph is updated (10 times per second). The average of the coefficients corresponding for the frequencies ranging from 0 to 50 Hz over the last N seconds is calculated and plotted in the PSD representation graph. >> About Visualization Filters: The filters used are finite impulse response filters (FIR) order 500 (1 second) and the minimum bandpass allowed is 3Hz. Both low pass and band pass FIR filters have been implemented. Even if they need more coefficients and therefore introduce more delay than infinite response filters (IIR) they have been chosen because: •FIR filters do not introduce phase distortion or delay. •FIR filters are always stable at every band. •FIR filters introduce a fixed delay of 0.5 seconds that has been assumed as acceptable. •For the minimum bandwidth allowed (3 Hz) the filter selectivity and attenuation in the band pass has been proved to be very accurate. Stimulation tab: Configure pane >> The Stimulation tab appears only when connected to a StarStim device. From this pane you can configure tDCS, tDCS+tACS, tRNS or Sham stimulation (single blind). >> Stimulation with StarStim is carried out in steps. First you configure your stimulation settings, in the Configuration pane (or tweak them further in the Advanced Configuration pane) then you check the mount and contact impedances, and finally you execute the stimulation protocol. NIC offers different modes to change stimulation settings: from simple to complex (Advanced mode). >> In the stimulation tab you can load a Template. A template refers to a particular publication, and spans settings including the montage (where each electrode goes and its function) as well as currents at each electrode and the overall duration of the stimulation session. >> You can also specify ramp up and ramp down times as well as Pre and Post-stimulation EEG recording times. Thus, in one simple manner, you can specify that you want to collect EEG data (from all electrodes), ramp up, stimulate (recording EEG data from the electrodes you are not using for stimulation), ramp down and collect more EEG data. EEG data is thus collected during all the time. >> The Configure pane also allows you to modify a template (click the Edit box). The only limitation in this pane is that you can only specify a stimulation electrode: the others have to be Return electrodes (you can specify the % current that each is to collect) or EEG electrodes. >> For safety, the maximal current at any electrode is < ±2 mA, and the maximal stimulation time <1 hour. These constraints may be relaxed in the future, as we learn more about tCS and its side effects. 1 Stimulation template selector Stimulation tab: Configure Pane 6 7 5 13 2 Stimulation type 3 Channel position selector 4 Channel modality during stimulation 8 5 Click to edit template 6 Save or delete templates 7 Import or Export templates in ASCII file format 1 8 Stimulation duration (max is 1 hour) 9 Stimulation parameter Amplitude configuration. This channel is an Anode (current goes in) 2 3 9 10These channels are “return” electrodes (current goes out, 50% each). 10 11Pre-EEG/ Post-EEG configuration 4 12Ramp up / Ramp down configuration 13Save report: generates a report including the stimulation configuration and the simulation of the protocol electric fields 14tRNS filter configuration: if a tRNS filter is set, the generated signal will have this filter applied 14 12 11 Safety: Current limits as a function of electrode size >> Check electrode size (Area) to ensure that you don’t inject more current than safe and comfortable. >> StarStim is limited to 2 mA anodal or cathodal current at any single electrode. >> StarStim will disconnect if impedance is too high at any electrode, or if it has lost communication with NIC. >> NIC always makes you to fix a stimulation duration - it will shutoff on completion. >> Maximal stimulation time is 1 h. MAX current intensity (mA) Application times > 40 minutes are for Research Use only Electrode size (cm2) >> The attach chart is a guide to maximal current as a function of electrode size (3 cm2 to 50 cm2). Stimulation tab: Advanced Configuration >> The Stimulation tab appears only when connected to a StarStim device. >> Stimulation with StarStim is carried out in two different types of configuration: •The basic configuration allows for only one stimulation electrode with n returns and one type of stimulation for a given session •The advanced configuration allows for more than one stimulation electrode with mixed types of stimulation. First you configure your stimulation settings using the Configuration Pane and, if needed, switch to the Advanced Configuration pane, where the basic configuration will be translated. >> In the Advanced Configuration pane, >> One or more channels can be you can further specify the current defined as Return to ensure current (type, amplitude, etc.) at each active conservation. channel (not return electrodes, As in the Configuration pane, you which are automatically set by can also specify ramp up and ramp current conservation and the ratio down times as well as Pre and Postof current they need to provide). stimulation EEG recording times. You can use an arbitrary linear Thus, in one simple manner, you combination of tDCS, tACS and can specify that you want to first tRNS, or Sham stimulation (single collect EEG data (from all mounted blind). electrodes), then ramp up, then stimulate (recording EEG data from the electrodes you are not using for stimulation), then ramp down and, finally, collect more EEG data. EEG data is thus collected during all the time. Three EEG data files will be generated. Stimulation tab: Adv Config Pane 2 3 4 5 Units in NIC are µA (10-6 Amperes), Hz, and degrees 6 1 For simplicity, return electrodes do not display any values. Their current is set through current conservation and the ratio assigned. 1 Current through each electrode: I(t)=Atdcs2 +Atacs3*sin(2π*Ftacs4*t+Ptacs5)+Atrns6*RNS(t) The current through each electrode >> Can be configured independently in Advanced mode. >> The general formula that applies to our configuration panes is: >> The current through an active electrode (in microAmperes - µA) is: I(t)=Atdcs+Atacs*sin(2π*Ftacs*t+Ptacs)+Atrns*RNS(t) where RNS is white noise (1000 S/s) with a unit variance Gaussian distribution. The parameters Atdcs, Atcs and Atrns are in uA. Ftacs is in Hz, and Ptacs in degrees. Time in seconds. >> Return electrodes derive their value from current conservation (total current through all stimulation electrodes must total 0) and the current return ratio assigned. >> Regardless of the configuration, current at any electrode is less than 2000 µA at any given time. Stimulation tab: Mount pane >> The Stimulation tab appears only when connected to a StarStim device. >> Stimulation with StarStim is carried out in steps. First you configure your stimulation settings, then you check the mount and contact impedances, and finally you execute the stimulation protocol. NIC offers different modes to change stimulation settings: from simple to complex (Advanced mode). >> In the Mount pane, you can check the montage: where each channel needs to go (using the 10-20 EEG position system). >> Stimulation channels are purple and grey (a code for return electrode), while EEG electrodes are code blue-green. >> You should carry an impedance check of the stimulation electrodes prior stimulation. A good impedance check will be reported by a short green bar, an acceptable one in orange, and an insufficient one in red. The longer the bar, the higher the impedance. Stimulation tab: Mount Pane 1 Use this pane to check the mount (which electrode goes where) and impedances of your stimulation electrodes. 2 1 Stimulation electrode (an anode or cathode) 2 Return electrodes 4 3 EEG-only electrode 4 Impedance meter. Green is good (the shorter the better), orange ok, red unusable (stimulator won’t start) 5 Impedance check button 3 5 Stimulation tab: Launch pane >> The Stimulation tab appears only when connected to a StarStim device. >> Stimulation with StarStim is carried out in steps. First you configure your stimulation settings, then you check the mount and contact impedances, and finally you execute – Launch – the stimulation protocol. >> In the Launch pane you can monitor the progress of the stimulation session, including impedance of stimulation electrodes. >> You can abort the stimulation session at any time using the Abort button. Stimulation tab: Launch Pane Use this pane to monitor the progress of stimulation. EEG data is recorded during stimulation in the available electrodes (i.e., not those used for stimulation). 1 Online impedance check (Current and voltage values in uA and V are useful during tDCS only). Stimulation will stop if impedance is too high. 2 Elapsed and remaining Stimulation time 3 Launch button: starts the stimulation protocol 4 Abort button: Stops the stimulation protocol ramping down the current following the configured rampdown time 5 Resume button: after pressing abort or aborting due to impedance or communication, the stimulation protocol continues from the abort point 1 2 3 4 5 Launch, Abort buttons with Elapsed and Remaining time in protocol Stimview tab >> StimViewer is the software component embedded in NIC which is activated when in use with StarStim. StimViewer is a fast simulation engine to produce electric fields in the brain associated with a particular tCS montage and display them on two surfaces: the outer cortex or inner cortex. >> The values that can be shown are: V - Electric potential E_n - normal component of the electric field ||E_t|| - magnitude of the tangention component ||E|| - total magnitude >> The electric field calculations were performed using the realistic head model >> For more information visit: wiki.neuroelectrics.com Stimview tab: 1 Control to show the electrode labels 2 Take a snapshop of the current view and stores it in the folder selected at the dialog that appears 3 Shows a dialog with information of the protocol if it is based on existing literature 4 Display buttons: Surface: choose the representation of white or grey matter Magnitude: choose the magnitude to represent Hemisfere: choose to display one of the hemisferes or both AAL: Select an AAL to highlight it 5 Slide bar to represent the current at a given time. Only for tACS 6 Display te influence map 7 Orientates the model to the basic point of view 1 2 7 3 4 5 6 Settings tab >> The Settings tab allows you to configure basic aspects of NIC: the devices you use, output filenames and formats. >> In the Bluetooth pane you can Scan for devices or select one of the ones you have connected to in the past. >> In the Output pane you can choose the output filename and format you want to use. A time stamp (YYYYMMDDHHMMSS) will always be added to the beginning of your file. You can also preset the duration of EEG recordings. Use 00:00:00 for arbitrary long takes (the default). >> If the device connected is an Enobio with 8 channels, a Placement pane is available to indicate in which position is each electrode located. >> In the Advanced pane, you can choose to invert the polarity of the voltage y-axis in EEG visualization (to have negative values on top), define your “Default” visualization filter button frequency range, and opt for line noise cancellation or not in both visualization and recording. Settings tab: Bluetooth Pane 1 1 This device is currently paired with NIC. The unique code is “Device ID” and MAC address. 2 These devices have been paired with NIC in the past. 3 Use the Select Device button to select one of them. 2 3 4 Scan for new devices button. Use first time you launch NIC. 4 5 The Convert to Enobio 8 configures NIC to use the first 8 channels of a Enobio20 or 32 to choose the placement and works as it was an Enobio 8 5 Settings tab: Advanced Pane 1 1 Inversion of signal visualization 2 Default setting of the visualization filter in the EEG monitoring 3 Line noise filter activation for visualization and recording 2 4 Accelerometer activation for visualization and recording 3 5 EOG correction activation for visualization and recording 6 EOG training, when the button is pressed, it performs the training during the configured training time 4 5 7 6 7 Double Blind Mode When this box is checked, the NIC asks for a password and blocks all the protocol information to the user until the box is unchecked entering the previous password Accelerometer >> If the accelerometer is activated in the settings tab, a new plot is displayed in the EEG tab. >> The X, Y and Z axes can be deactivated for the visualization using the buttons. >> If the recording setting is selected, the output file adds three columns after the EEG measurements in mm/s2. >> The positive Axes of the device correspond to the following picture. NIC 1.4 Neuroelectrics Instrument Controller, v 1.4.6 Rev 2015-06-06 NIC Offline Opening NIC recorded files using NIC Offline NIC Offline interface >> NIC Offline allows you to open and display recorded files using NIC (.info, .easy, .nedf, .sdeeg) and export them to other formats (.edf, .nedf, .easy) >> The functionality of NIC Offline is identical to NIC except for the file reproduction controls 1 Reproduction Controls 2 File progress bar 1 2 NIC Offline Reproduction controls >> NIC Offline allows you to open and display recorded files using NIC and export them to other formats >> The functionality of NIC Offline is identical to NIC except for the file reproduction controls 1 2 3 1 Opened File Path 2 Open File button 6 4 3 File content indication, EEG data, Stimulation Data 5 4 File reproduction time 7 5 File navigation controls Continuous Play/Stop 8 6 File navigation controls one second fw/rw 7 File navigation controls EEG window time fw/rw 8 File export NIC Offline Reporting >> NIC Offline allows you to generate a report based on the data file that has been opened >> The reports are generated in html format and readable in any browser and printable to pdf 1 Generate report button: triggers the report generation process 2 3 1 2 Time interval of the report generation 3 Parameters for the report calculations: - Reference channel for the report - Filter setting for all the plots - Window length: time of the window for the spectral calculations - Epoch rejection: NIC 1.3 Neuroelectrics Instrument Controller, v 1.4.1 Rev 2014-12-01 Advanced Functions Communicating with NIC NE Data formats About the TCP/IP interface in NIC >> From NIC you can stream EEG or other channel data to another application in your network using the TCP/IP address provided. >> NIC can also receive TPC/IP trigger data from other apps using the same address. These data is automatically annotated in the generated NIC data files (as extra channels). >> Some simple examples follow. Communicating with NIC >> Streaming TCP/IP data from NIC is simple. From your other application open a receive connection to the NIC server address (identified in the “TCP Server” sub-pane). >> The TCP/IP streaming can contain only the EEG channels or include also the markers information. This can be selected at the advanced settings >> Clients connected to NIC will appear in this pane as well. >> To send trigger data we must use the command <trigger>your_ number</trigger>. NIC will process the data and store it in the output file. Sending trigger data to NIC via TCP/IP % MATLAB example for receiving and sending information to NIC. Requires MATLAB and Instrument Control Toolbox. % Create TCP/IP object ‘connectionObject’’. Specify the server machine and port number indicated in NIC. connectionObject= tcpip(‘’, ‘1234’); % Open connection. fopen(connectionObject); % Read operation where ‘N’ is the number of channels. % Data is received in two’s complement and, thus, it may need further processing depending on your machine A = fread(connectionObject,N,’int32’) % Sending a trigger with 1234 value fprintf(t, ‘<trigger>1234</trigger>’); % Disconnect and clean up the server connection. fclose(t); delete(t); Communicating with NIC using the Lab Streaming Layer >> The Lab Streaming Layer is a standard library that sends TPC/IP data including timing information and clock syncronization >> The NIC supports input and output of markers and streaming of data via the LSL library >> The LS is recommended for ERP expriments to receive the markers in sub-sample accuracy Receiving Markers from the LSL >> NIC is ready to receive the LSL markers from another software. The supported data format is Integer following the standard for markers >> To receive markers, the name of the LSL outlet has to be configured at the EEG-Settings pane >> Ones the stream is connected, all the received makers will be coregistered along with the EEG signal to the output files >> If the triggers have to be received from another computer that is running NIC, the LSL outlet has the name of “NIC”. NIC generates triggers when there are stimulation events or when the 1 9 keys are pressed Sending data to the LSL >> NIC streams the received EEG data from Enobio usign the Lab Streaming Layer. >> The name of the LSL outlet by default is NIC, but it can be changed at the EEG settings tab. The outlets generated by NIC have the following parameters: >> Name: NIC Type: EEG Channel count: 8, 20 or 32 depending on the Enobio NIC handle Nominal sample rate: 500 Channel format: float_32 Unique source ID: The Enobio type plus its mac address >> Name: NIC Type: Accelerometer Channel count: 3 Nominal sample rate: 100 Channel format: float_32 Unique source ID: The Enobio type plus its mac address plus the “Acc” string Sending data to the LSL >> Name: NIC Type: Markers Channel count: 1 Nominal sample rate: n/a Channel format: int_32 Unique source ID: The Enobio type plus its mac address plus the >> Name: NIC Type: Quality Channel count: 8, 20 or 32 depending on the Enobio NIC handle Nominal sample rate: 1 update every 2 seconds Channel format: float_32 Unique source ID: The Enobio type plus its mac address >> This is the measurement of the signal quality from 0 (best quality) to 1. The setting of the colours in NIC is set as: - 0 to 0.5: green - 0.5 to 0.8: orange - > 0.8: red Our .easy data format NIC ASCII files use are labeled with a “.txt” or “.easy” file extension. Here is what they contain. ABOUT THE NE ASCII DATA FORMAT (July 2012): NE ASCII files contain one line per time sample. Each line contains first the EEG data (8 or 20 channels, depending on the device, with units in nV – nanovolts, i.e., 10-9 V), followed by (optionally) three acceleration channels (aX,aY,aZ in mm/s2- millimeters per second squared), an *optional* external input channel, a trigger flag (int32) and, finally, a timestamp in Unix time (ms from Jan 1 1970). A typical line in an .easy file will look like this: Ch1(nV) ... Ch8or20(nV) AddSensor Flags(uint32) aX(mm/s2) aY(mm/s2) aZ(mm/s2) TimeStamp (ms) with first EEG channel data (8 or 20 entries, depending on the device), acceleration data, additional sensor data, trigger flags and a time stamp in the last column. Sample Matlab code to read an NE ASCII data file % This is a an example file to read NE data. % First we load the file - change the filename below as needed. The file should be in % the Matlab working directory in this case: d=load(‘20120731153351_enobiodata.easy’); % Next we define the time axis using the last column in the data (in ms Unix time): time=d(:,end); % time stamp is in the last column - in ms Unix time time=time-time(1); % set clock to zero in first sample time=time/1000; % change time units to seconds % Example one: we plot channel 1 in mV figure(1); plot(time, d(:,1)/1e6); % divide by one million to go to mV xlabel(‘Time from start (s)’); ylabel(‘Voltage (mV)’); title(‘Channel 1 data’); % Example two: we plot channels 1 to 8 in uV figure(2); plot(time, d(:,1:8)/1e3); % divide by one thousand to go to uV xlabel(‘Time from start (s)’); ylabel(‘Voltage (uV)’); legend({‘Ch1’,’Ch2’,’Ch3’,’Ch4’,’Ch5’,’Ch6’,’Ch7’,’Ch8’}); title(‘Channels 1-8 data’); ylim([-200 200]); % fix the y-axis limits to plu/minus 200 uV Other output formats As part of the files that NIC output, the user can find: .stim files with stimulation information. .nedf files with EEG information in binary format .bin files with information for NIC. .tdb files containing protocol templates information. More information on these files will be available in the future. http://neuroelectrics.com Contact us at [email protected]