1
user manual
ImageQuant Utilities
User’s Guide
Microsoft Windows
Apple Macintosh
um
375-580
DeCyder, FluorImager, FluorSep, ImageQuant, Storm, and Typhoon are trademarks
of Amersham Biosciences Limited.
Amersham and Amersham Biosciences are trademarks of Amersham plc.
Adobe, Acrobat, and Photoshop are trademarks of Adobe Systems Incorporated.
Apple, Macintosh, and Mac OS are trademarks of Apple Computer, Inc.
Microsoft and Windows are trademarks of Microsoft Corporation.
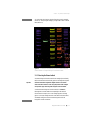
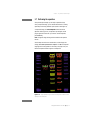
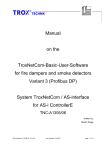
Cover (Foreground): A two-color gel image of fluorescently labeled DNA ladders
and PCR products scanned with the FluorImager™ 595 and displayed in FluorSep™.
The Fluorochrome Separation window is open in the lower right. The image has been
processed in FluorSep to facilitate spectral separation of the two labels. Channels 1
(Fluorescein and FAM = Green) and 2 (TAMRA = Red) are displayed in the overlay
mode. Yellow indicates simultaneous signals from both fluorochromes at positions
of comigration in the gel.
Cover (Background): A three-color DNA typing gel (short tandem repeats or STR)
scanned with the FluorImager 595 and displayed in ImageQuant Tools. The image
has been preprocessed in FluorSep to facilitate spectral separation of the three labels.
Channels 1 (Fluorescein = Green), 2 (TMR = Blue), and 3 (CXR = Red) are displayed
in the overlay mode. The Image Rotation window in ImageQuant™ Tools is used to
rotate the resulting three-color image as desired.
This document is furnished for informational use only and is subject to change
without notice. Amersham Biosciences assumes no responsibility or liability for
any errors or inaccuracies that might appear in this book.
Amersham Biosciences UK Limited Amersham Place Little Chalfont
Buckinghamshire England HP7 9NA
Amersham Biosciences AB SE-751 84 Uppsala Sweden
Amersham Biosciences Corp 800 Centennial Avenue PO Box 1327 Piscataway
NJ 08855 USA
Amersham Biosciences Europe GmbH Munzinger Strasse 9 D-79111 Freiburg
Germany
Amersham Biosciences (SV) Corp 928 East Arques Avenue Sunnyvale
CA 94085-4520 USA
© Amersham Biosciences Corp 2002—All rights reserved.
May 2002
Table of contents
Preface
About this guide. . . . . . . . . . . . . . . . . . . . . . . . . . . . . . . . . . . . . . . . . . ix
Related publications . . . . . . . . . . . . . . . . . . . . . . . . . . . . . . . . . . . . . . ix
Assumptions . . . . . . . . . . . . . . . . . . . . . . . . . . . . . . . . . . . . . . . . . . . . ix
Assistance . . . . . . . . . . . . . . . . . . . . . . . . . . . . . . . . . . . . . . . . . . . . . . . x
Part one
Introduction
Chapter 1 The ImageQuant utilities
1.1
Overview of the FluorSep utility . . . . . . . . . . . . . . . . . . . . . . . . . . . . . 1-1
1.2
Overview of the ImageQuant Tools utility . . . . . . . . . . . . . . . . . . . . . . 1-2
1.3
Checking the audit trail . . . . . . . . . . . . . . . . . . . . . . . . . . . . . . . . . . . 1-2
Part two
FluorSep utility
Chapter 2 Using FluorSep to separate images
2.1
About FluorSep . . . . . . . . . . . . . . . . . . . . . . . . . . . . . . . . . . . . . . . . . 2-1
2.2
Displaying the image . . . . . . . . . . . . . . . . . . . . . . . . . . . . . . . . . . . . . 2-3
2.3
Selecting Automatic or Manual background correction . . . . . . . . . . . . 2-3
2.3.1 Determining the uniformity of the background . . . . . . . . . . . . 2-4
2.3.2 Selecting the Automatic method . . . . . . . . . . . . . . . . . . . . . . . 2-4
2.3.3 Selecting the Manual method . . . . . . . . . . . . . . . . . . . . . . . . . 2-5
2.4
Locating and placing the fluorochrome marker rectangles . . . . . . . . . 2-7
2.5
Sizing and centering the fluorochrome marker rectangles . . . . . . . . . 2-9
2.6
Locating and placing the background rectangles
(Manual method only) . . . . . . . . . . . . . . . . . . . . . . . . . . . . . . . . . . . 2-10
2.6.1 Positioning the (B1) through (B4) rectangles. . . . . . . . . . . . . 2-11
2.6.2 Determining the location for the (B) rectangle . . . . . . . . . . . . 2-11
2.7
Performing the separation . . . . . . . . . . . . . . . . . . . . . . . . . . . . . . . . 2-13
2.8
Evaluating the results . . . . . . . . . . . . . . . . . . . . . . . . . . . . . . . . . . . 2-14
ImageQuant Utilities User’s Guide
●
iii
Table of contents
2.9
Choosing a background correction filter . . . . . . . . . . . . . . . . . . . . . . 2-14
2.9.1 Local background correction filter . . . . . . . . . . . . . . . . . . . . 2-14
2.9.2 Global background correction filter . . . . . . . . . . . . . . . . . . . 2-15
2.10 Using the impulse filter during separation . . . . . . . . . . . . . . . . . . . . 2-16
Chapter 3 Using FluorSep to build a dataset file
3.1
Creating the images . . . . . . . . . . . . . . . . . . . . . . . . . . . . . . . . . . . . . 3-1
3.2
Building a dataset file from single images . . . . . . . . . . . . . . . . . . . . . 3-1
3.3
Building a two-channel dataset file from separated image files . . . . . 3-3
Part three ImageQuant Tools utility
Chapter 4 Using ImageQuant Tools
4.1
Displaying an image . . . . . . . . . . . . . . . . . . . . . . . . . . . . . . . . . . . . . 4-1
4.2
Rotating the image in 90° increments . . . . . . . . . . . . . . . . . . . . . . . . 4-2
4.3
Rotating the image in 0.5° increments . . . . . . . . . . . . . . . . . . . . . . . 4-3
4.4
Inverting the data values in the image . . . . . . . . . . . . . . . . . . . . . . . . 4-4
4.5
Removing noise using the impulse filter . . . . . . . . . . . . . . . . . . . . . . 4-5
4.6
Removing noise using the median filter . . . . . . . . . . . . . . . . . . . . . . . 4-6
4.7
Cropping and uncropping a multichannel image (Windows only) . . . . 4-7
4.7.1 Cropping a dataset image (Windows only) . . . . . . . . . . . . . . . 4-8
4.7.2 Uncropping a dataset image (Windows only) . . . . . . . . . . . . 4-10
4.7.3 Saving the cropped dataset image (Windows only) . . . . . . . . 4-10
4.8
Exporting a multichannel image as individual images
(Windows only) . . . . . . . . . . . . . . . . . . . . . . . . . . . . . . . . . . . . . . . . 4-10
4.9
Viewing a multichannel image using a flicker effect
(Windows only) . . . . . . . . . . . . . . . . . . . . . . . . . . . . . . . . . . . . . . . . 4-11
4.9.1 Default settings (Windows only) . . . . . . . . . . . . . . . . . . . . . . 4-12
4.9.2 Selecting the flicker settings (Windows only). . . . . . . . . . . . . 4-13
4.10 Copying image data to Excel for 3D charting (Windows only) . . . . . . 4-14
Part four Reference
Chapter 5 File menu
iv
●
5.1
Open . . . . . . . . . . . . . . . . . . . . . . . . . . . . . . . . . . . . . . . . . . . . . . . . 5-1
5.2
Close . . . . . . . . . . . . . . . . . . . . . . . . . . . . . . . . . . . . . . . . . . . . . . . . 5-1
ImageQuant Utilities User’s Guide
Table of contents
5.3
Build Dataset (FluorSep only) . . . . . . . . . . . . . . . . . . . . . . . . . . . . . . 5-1
5.4
Save As (ImageQuant Tools only) . . . . . . . . . . . . . . . . . . . . . . . . . . . . 5-2
5.5
Save Region of Interest As (ImageQuant Tools only) . . . . . . . . . . . . . . 5-2
5.6
Save Cropped Dataset over Original (ImageQuant Tools for
Windows only) . . . . . . . . . . . . . . . . . . . . . . . . . . . . . . . . . . . . . . . . . . 5-2
5.7
Export Gel Files From Dataset to Folder (ImageQuant Tools for
Windows only) . . . . . . . . . . . . . . . . . . . . . . . . . . . . . . . . . . . . . . . . . . 5-3
5.8
Image Properties . . . . . . . . . . . . . . . . . . . . . . . . . . . . . . . . . . . . . . . . 5-3
5.9
Most recently used list . . . . . . . . . . . . . . . . . . . . . . . . . . . . . . . . . . . . 5-5
5.10 Exit or Quit . . . . . . . . . . . . . . . . . . . . . . . . . . . . . . . . . . . . . . . . . . . . . 5-5
Chapter 6 Edit menu (ImageQuant Tools only)
6.1
Copy Image . . . . . . . . . . . . . . . . . . . . . . . . . . . . . . . . . . . . . . . . . . . . 6-1
6.2
Copy Image Data for Excel 3D Chart (Windows only) . . . . . . . . . . . . . . 6-1
6.3
Crop Dataset (Windows only) . . . . . . . . . . . . . . . . . . . . . . . . . . . . . . . 6-2
6.4
Undo Crop Dataset (Windows only) . . . . . . . . . . . . . . . . . . . . . . . . . . 6-2
Chapter 7 View menu
7.1
Toolbars . . . . . . . . . . . . . . . . . . . . . . . . . . . . . . . . . . . . . . . . . . . . . . . 7-1
7.2
Status Bar . . . . . . . . . . . . . . . . . . . . . . . . . . . . . . . . . . . . . . . . . . . . . 7-2
7.3
Actual Size. . . . . . . . . . . . . . . . . . . . . . . . . . . . . . . . . . . . . . . . . . . . . 7-2
7.4
Fit to Window . . . . . . . . . . . . . . . . . . . . . . . . . . . . . . . . . . . . . . . . . . . 7-2
7.5
Magnification . . . . . . . . . . . . . . . . . . . . . . . . . . . . . . . . . . . . . . . . . . . 7-2
7.6
Zoom In . . . . . . . . . . . . . . . . . . . . . . . . . . . . . . . . . . . . . . . . . . . . . . . 7-2
7.7
Zoom Out. . . . . . . . . . . . . . . . . . . . . . . . . . . . . . . . . . . . . . . . . . . . . . 7-3
7.8
Gray/Color Adjust . . . . . . . . . . . . . . . . . . . . . . . . . . . . . . . . . . . . . . . . 7-3
7.8.1 Changing the high and low display values . . . . . . . . . . . . . . . . 7-4
7.8.2 Using the lookup tables to change the display . . . . . . . . . . . . 7-6
7.9
Map. . . . . . . . . . . . . . . . . . . . . . . . . . . . . . . . . . . . . . . . . . . . . . . . . . 7-7
7.10 Multichannel . . . . . . . . . . . . . . . . . . . . . . . . . . . . . . . . . . . . . . . . . . . 7-8
7.11 Flicker Display Channels (ImageQuant Tools for Windows only) . . . . . 7-9
7.12 Hide Objects (FluorSep only) . . . . . . . . . . . . . . . . . . . . . . . . . . . . . . . 7-9
Chapter 8 Tools menu
8.1
Select . . . . . . . . . . . . . . . . . . . . . . . . . . . . . . . . . . . . . . . . . . . . . . . . 8-1
8.2
Enlarge (ImageQuant Tools only) . . . . . . . . . . . . . . . . . . . . . . . . . . . . 8-1
ImageQuant Utilities User’s Guide
●
v
Table of contents
8.3
Reduce (ImageQuant Tools only) . . . . . . . . . . . . . . . . . . . . . . . . . . . . 8-1
8.4
Zoom Area . . . . . . . . . . . . . . . . . . . . . . . . . . . . . . . . . . . . . . . . . . . . 8-2
8.5
Magnifier. . . . . . . . . . . . . . . . . . . . . . . . . . . . . . . . . . . . . . . . . . . . . . 8-2
8.6
Pan. . . . . . . . . . . . . . . . . . . . . . . . . . . . . . . . . . . . . . . . . . . . . . . . . . 8-2
8.7
Pixel Locator . . . . . . . . . . . . . . . . . . . . . . . . . . . . . . . . . . . . . . . . . . . 8-3
8.8
Pixel Distance . . . . . . . . . . . . . . . . . . . . . . . . . . . . . . . . . . . . . . . . . . 8-3
8.9
Define Region of Interest (ImageQuant Tools only) . . . . . . . . . . . . . . . 8-4
Chapter 9 Image menu (ImageQuant Tools only)
9.1
Rotate Image . . . . . . . . . . . . . . . . . . . . . . . . . . . . . . . . . . . . . . . . . . 9-1
9.2
Invert Image . . . . . . . . . . . . . . . . . . . . . . . . . . . . . . . . . . . . . . . . . . . 9-1
9.3
Impulse Filter . . . . . . . . . . . . . . . . . . . . . . . . . . . . . . . . . . . . . . . . . . 9-1
9.4
Median Filter . . . . . . . . . . . . . . . . . . . . . . . . . . . . . . . . . . . . . . . . . . 9-1
Chapter 10 Window menu
10.1 Cascade . . . . . . . . . . . . . . . . . . . . . . . . . . . . . . . . . . . . . . . . . . . . . 10-1
10.2 Tile Horizontal . . . . . . . . . . . . . . . . . . . . . . . . . . . . . . . . . . . . . . . . . 10-1
10.3 Tile Vertical . . . . . . . . . . . . . . . . . . . . . . . . . . . . . . . . . . . . . . . . . . . 10-1
10.4 Close All . . . . . . . . . . . . . . . . . . . . . . . . . . . . . . . . . . . . . . . . . . . . . 10-1
10.5 List of open windows . . . . . . . . . . . . . . . . . . . . . . . . . . . . . . . . . . . . 10-1
Chapter 11 Help menu
11.1 Index (FluorSep and ImageQuant Tools for Macintosh only) . . . . . . . 11-1
11.2 Using Help (FluorSep and ImageQuant Tools for Macintosh only). . . 11-1
11.3 User’s Guide (ImageQuant Tools for Windows only) . . . . . . . . . . . . . 11-1
11.4 Molecular Dynamics Home Page . . . . . . . . . . . . . . . . . . . . . . . . . . . 11-1
11.5 About FluorSep . . . . . . . . . . . . . . . . . . . . . . . . . . . . . . . . . . . . . . . . 11-2
11.6 About ImageQuant Tools . . . . . . . . . . . . . . . . . . . . . . . . . . . . . . . . . 11-2
Part five
Appendixes
Appendix A Quick reference for Windows
vi
●
A.1
Keyboard shortcuts . . . . . . . . . . . . . . . . . . . . . . . . . . . . . . . . . . . . . . A-1
A.2
Mouse/key combinations . . . . . . . . . . . . . . . . . . . . . . . . . . . . . . . . . . A-2
A.3
Toolbar functions for FluorSep . . . . . . . . . . . . . . . . . . . . . . . . . . . . . . A-3
A.4
Toolbar functions for ImageQuant Tools . . . . . . . . . . . . . . . . . . . . . . . A-4
ImageQuant Utilities User’s Guide
Table of contents
A.5
Extensions that identify file types . . . . . . . . . . . . . . . . . . . . . . . . . . . . A-5
Appendix B Quick reference for Macintosh
B.1
Keyboard shortcuts . . . . . . . . . . . . . . . . . . . . . . . . . . . . . . . . . . . . . . B-1
B.2
Mouse/key combinations . . . . . . . . . . . . . . . . . . . . . . . . . . . . . . . . . . B-2
B.3
Toolbar functions . . . . . . . . . . . . . . . . . . . . . . . . . . . . . . . . . . . . . . . . B-3
B.4
Icons that identify file types . . . . . . . . . . . . . . . . . . . . . . . . . . . . . . . . B-4
ImageQuant Utilities User’s Guide
●
vii
Preface
About this guide
The ImageQuant Utilities User’s Guide describes how to use the FluorSep
and ImageQuant Tools utilities.
•
Part one: Introduction—Provides an introduction to the ImageQuant
utilities.
•
Part two: FluorSep utility—Describes how to use the FluorSep utility to
separate multichannel images and to create multichannel datasets.
•
Part three: ImageQuant Tools utility—Describes how to use the
ImageQuant Tools utility to modify images.
•
Part four: Reference—Provides a reference to features in the FluorSep and
ImageQuant Tools utilities that are not discussed in parts two and three.
•
Part five: Appendixes—Provides a quick reference for the FluorSep and
ImageQuant Tools utilities.
Related publications
In addition to the ImageQuant Utilities User’s Guide, Amersham Biosciences
provides the following publications:
•
ImageQuant User’s Guide—A step-by-step guide for all major functions of
the ImageQuant software.
•
ImageQuant Reference—A reference, by menu item, for each function of
the ImageQuant software.
•
ImageQuant Tutorial—A tutorial that highlights certain features of the
ImageQuant software.
•
A user’s guide for the instrument.
Assumptions
The software-related instructions in this guide assume you have basic computer
skills. You should be familiar with either the Microsoft™ Windows™ or the
Apple™ Mac OS™ graphical user interface. If you do not have these skills,
refer to the Windows or Mac OS documentation, or refer to the Help for these
operating systems.
ImageQuant Utilities User’s Guide
●
ix
Preface
Assistance
If you have problems, contact technical support using one of the numbers
listed below—
Asia Pacific
Tel: +852 2811 8693
Fax: +852 2811 5251
Latin America
Tel: +55 11 3667 5700
Fax: +55 11 3667 87 99
Australasia
Tel: +61 2 9899 0999
Fax: +61 2 9899 7511
Middle East and Africa
Tel: +30 (1) 96 00 687
Fax: +30 (1) 96 00 693
Austria
Tel: 01 576 0616 22
Fax: 01 576 0616 27
Netherlands
Tel: 0165 580 410
Fax: 0165 580 401
Belgium
Tel: 0800 73 888
Fax: 03 272 1637
Norway
Tel: 2318 5800
Fax: 2318 6800
Canada
Tel: +1 800 463 5800
Fax: +1 800 567 1008
Portugal
Tel: 21 417 70 35
Fax: 21 417 31 84
Central, East, and Southeast Europe
Tel: +43 1 982 3826
Fax: +43 1 985 8327
Russia & other C.I.S. & N.I.S.
Tel: +7 (095) 232 0250, 956 1137
Fax: +7 (095) 230 6377
Denmark
Tel: 45 16 2400
Fax: 45 16 2424
Southeast Asia
Tel: +60 3 8024 2080
Fax: +60 3 8024 2090
Finland & Baltics
Tel: +358 (0)9 512 39 40
Fax: +358 (0)9 512 17 10
Spain
Tel: 93 594 49 50
Fax: 93 594 49 55
France
Tel: 01 69 35 67 00
Fax: 01 69 41 96 77
Sweden
Tel: 018 612 1900
Fax: 018 612 1910
Germany
Tel: 0761 4903 291
Fax: 0761 4903 405
Switzerland
Tel: 01 802 81 50
Fax: 01 802 81 51
Italy
Tel: 02 27322 1
Fax: 02 27302 212
UK
Tel: 0800 616928
Fax: 0800 616927
Japan
Tel: +81 3 5331 9336
Fax: +81 3 5331 9370
USA
Tel: +1 800 526 3593
Fax: +1 877 295 8102
Web site
http://www.amershambiosciences.com
x
●
ImageQuant Utilities User’s Guide
Part one
Introduction
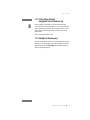
Chapter 1 The ImageQuant utilities
The ImageQuant Utilities User’s Guide explains how to use the FluorSep
and ImageQuant Tools utilities. This chapter provides a brief description
of each utility.
The topics in this chapter are—
•
•
•
Overview of the FluorSep utility (section 1.1)
Overview of the ImageQuant Tools utility (section 1.2)
Checking the audit trail (section 1.3)
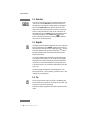
1.1 Overview of the FluorSep utility
The FluorSep utility uses a fluorochrome separation process to separate
the multichannel images you create using the Typhoon™, FluorImager, or
Storm™ 860 instruments.
The fluorochrome separation process removes the cross-contamination that
can occur when the emission spectra from multiple images overlap. Because
the emission spectra can overlap between the images, the emissions from one
fluorochrome can contaminate the collection for the other fluorochromes.
The fluorochrome separation process removes the cross-contamination by
performing a mathematical transformation on the images produced during
scanning. The end result includes two or more images that, under ideal
conditions, represent the light emitted from the fluorochromes used in the
sample.
The FluorSep utility also provides a method to create multichannel images
by combining single images (.gel).
See part 2 for a description of the FluorSep utility.
ImageQuant Utilities User’s Guide
●
p1-1
Part one Introduction
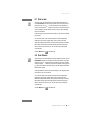
1.2 Overview of the ImageQuant Tools utility
The ImageQuant Tools utility provides several image processing tools. You
use these tools to modify a copy of the original image. The original image
remains unaltered. Both images can be used for quantitation.
The ImageQuant Tools utility allows you to—
•
Rotate—You can rotate or flip images.
•
Filter—You can reduce the noise in an image using a median filter or an
impulse filter.
•
Invert—You can invert the pixel values of the image so that images scanned
with a dark background (high values) and light spots (low values) are
displayed as dark spots (high values) with a light background (low values).
•
(Windows only) Flicker—You can use the flicker feature on a multichannel
(dataset) image to simulate an animation sequence.
•
(Windows only) Crop—You can crop a multichannel (dataset) image to
remove portions of the image from analysis. All the channels (images) of
the multichannel image are cropped to the same size.
•
(Windows only) Copy pixel values for 3D charting—You can copy
a portion of an image and paste the pixel values in Excel to create a
three-dimensional (3D) chart of the image features.
•
(Windows only) Save multichannel image as individual images—You can
save the channels of a multichannel (dataset) image as individual, uniquely
named images.
See part 3 for a description of the ImageQuant Tools utility.
1.3 Checking the audit trail
Because both the FluorSep and the ImageQuant Tools utilities modify the
original image, the software provides an audit trail of all the image processing
operations applied to the image. You can check the audit trail from FluorSep,
ImageQuant Tools, or ImageQuant.
To check the audit trail—
1. Open the image in FluorSep, ImageQuant Tools, or ImageQuant.
2. Choose Image Properties from the File menu. The ImageProperties window
appears and displays the File Info tab.
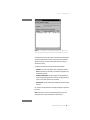
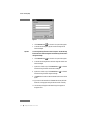
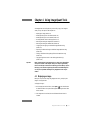
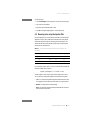
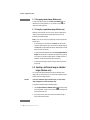
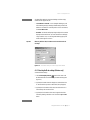
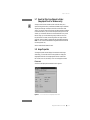
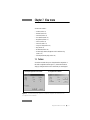
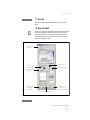
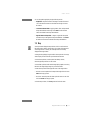
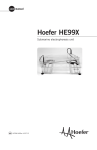
3. Click the History tab. The contents of the History tab appear (figure 1-1).
p1-2
●
ImageQuant Utilities User’s Guide
Chapter 1 The ImageQuant utilities
Figure 1-1. The History tab in the ImageProperties window. The Operations list
shows that the original image was rotated 180° using the ImageQuant Tools utility.
The image name at the top of the window is the name of the image displayed
in the Image window. Below the name is a list of each processing operation
applied to the image. You create a new image file each time you apply an
operation to the image.
The Sequence of Operations list provides the following information:
•
File Name—The name of the image to which you applied the operation.
Note: The file name is not the name you entered when ImageQuant Tools
performed the operation.
•
Operation and Parameter—The type of image processing applied to the
image, plus appropriate parameters. For example, the image referred to in
figure 1-1 was rotated (operation) 180° (parameter).
•
Date and Time—The date and time when ImageQuant Tools performed the
operation.
If no operation has been performed on the image, the Sequence of Operations
list is blank.
Note: Modifications you make to the image display using the Gray/Color
Adjust feature do not appear in the Sequence of Operations list.
ImageQuant Utilities User’s Guide
●
p1-3
Part two
FluorSep utility
Chapter 2 Using FluorSep to
separate images
The FluorSep utility allows you to separate the multichannel images you
created using the Typhoon, Storm 860, or FluorImager instruments. The
topics in this chapter are—
•
•
•
•
•
•
•
•
•
•
About FluorSep (section 2.1)
Displaying the image (section 2.2)
Selecting Automatic or Manual background correction (section 2.3)
Locating and placing the fluorochrome marker rectangles (section 2.4)
Sizing and centering the fluorochrome marker rectangles (section 2.5)
Locating and placing the background rectangles (Manual method only)
(section 2.6)
Performing the separation (section 2.7)
Evaluating the results (section 2.8)
Choosing a background correction filter (section 2.9)
Using the impulse filter during separation (section 2.10)
2.1 About FluorSep
The FluorSep utility provides two methods to remove the crosscontamination—
•
Automatic—FluorSep determines which pixel values are background
by using a histogram peak algorithm. Use this method if the image
background is uniform.
•
Manual—You determine which areas on the image represent the
background. Use this method if the image background is not uniform.
You should try the automatic method first. FluorSep includes an Undo
Separation feature, which allows you to, if necessary, repeat the separation
process using different variables. If the results are not acceptable, you can
use the manual method. In addition, you can add a local or global background
filter, an impulse filter, or both filters to improve the uniformity of the
background. If the result for any of the filters is not acceptable, you can
repeat the separation process without using the filter.
ImageQuant Utilities User’s Guide
●
p2-1
Part two FluorSep utility
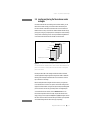
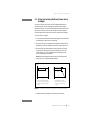
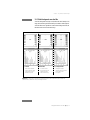
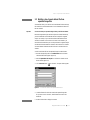
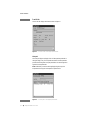
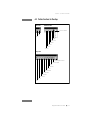
After FluorSep removes the cross-contamination, the utility creates new
separated files for each channel and stores the new files in the existing dataset
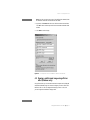
folder (.dir). The dataset (.ds) file structure was created by the Scanner Control
software (figure 2-1).
The dataset folder contains one separated and one unseparated image file (.gel)
for each channel. Each channel represents one designated fluorochrome. In
addition, you see one object file (.dox) for each channel. The object file
contains the rectangles used by FluorSep during the fluorochrome separation
process.
Figure 2-1. Sample of the dataset file structure.
You can view the channels in the dataset overlaid, side by side, or one at a time.
After the separation, FluorSep displays the channels in the Overlay view.
p2-2
●
ImageQuant Utilities User’s Guide
Chapter 2 Using FluorSep to separate images
2.2 Displaying the image
Before using the FluorSep utility, you display the image you want to separate in
an Image window.
Note: The Scanner Control software for your instrument might open FluorSep
and display the image automatically.
To display an image—
1. Choose Open (
) from the File menu or the Main toolbar. The Open
window appears and displays the active folder and its contents.
2. If the dataset name is not listed, choose a different folder and view its
contents.
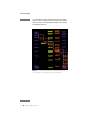
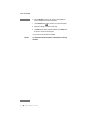
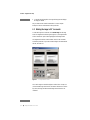
3. Locate and select the dataset file (.ds). The image appears in an Image
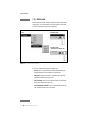
window, and the Fluorochrome Separation window appears (figure 2-2).
See your Windows or Macintosh documentation for a more complete
description of how to use the features in the Open window.
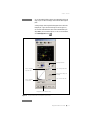
Figure 2-2. The Fluorochrome Separation window.
2.3 Selecting Automatic or Manual background
correction
The FluorSep utility provides two methods to remove the background
correction. To determine which method to use, you need to evaluate the
uniformity of the background (section 2.3.1). If you determine the background
is uniform, select the Automatic method (section 2.3.2). If you determine the
background is not uniform, select the Manual method (section 2.3.3). After
you select the background correction method, use sections 2.4 through 2.6
to place the rectangles.
ImageQuant Utilities User’s Guide
●
p2-3
Part two FluorSep utility
2.3.1 Determining the uniformity of the background
If you cannot determine the uniformity of the background visually, you can use
the Pixel Locator tool to examine the uniformity of the background by pixel
value. To use the Pixel Locator tool—
1. Choose Pixel Locator (
) from the Tools menu or the Image toolbar.
2. Move the pointer to the background near the top left of the image. Click
the mouse button and make a note of the value.
3. Move the pointer to a background location farther down and to the right.
Click the mouse button and make a note of the value.
4. Repeat step 3 until you reach the bottom of the image.
5. Click Select (
) to end the Pixel Locator mode.
6. Examine the difference between the highest and the lowest relative
fluorescent unit (rfu) values.
•
If the difference is less than 20% of the total values, choose the
Automatic method (section 2.3.2).
•
If the difference is more than 20% of the total values, you can either
choose the Automatic method (section 2.3.2) and the Local or Global
filter (section 2.9), or choose the Manual method (section 2.3.3) and
the Local filter (section 2.9.1).
2.3.2 Selecting the Automatic method
The automatic background correction method uses rectangle objects to identify
the fluorochrome markers.
Important
The fluorochrome marker designates the brightest location of each channel
relative to the other channels. Accurate sizing and placement of the rectangles
is important for proper functioning of the background correction methods.
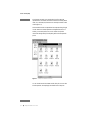
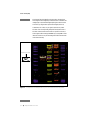
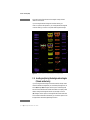
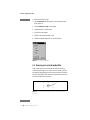
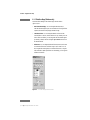
To select the Automatic background correction method, click Automatic
in the Background Correction Method area of the Fluorochrome Separation
window. Depending on the number of fluorochromes in the sample, two or
more rectangles appear on the image (figure 2-3). Each rectangle is labeled
(F#), where # is the fluorochrome marker number for the emission filter.
Note: The number of rectangles depends on the number of channels acquired
by the instrument and the settings you selected in the Scanner Control software
for that instrument. For example, if you scanned a sample that included two
fluorochrome markers, you will see two rectangles labeled (F1) and (F2).
p2-4
●
ImageQuant Utilities User’s Guide
Chapter 2 Using FluorSep to separate images
You use the Find Fluors feature to place the fluorochrome marker rectangles
(section 2.4). After placing the rectangles, you might need to resize or recenter
them (section 2.5).
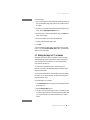
Figure 2-3. The rectangles that appear when you use the Automatic background
correction method for an image containing four fluorochrome markers.
2.3.3 Selecting the Manual method
The manual background correction method uses rectangle objects to identify
the fluorochrome markers and to identify portions of the image as background.
Important
The fluorochrome marker designates the brightest location of each channel
relative to the other channels. Accurate sizing and placement of the rectangles
are important for proper functioning of the background correction methods.
To select the Manual background correction method, click Manual in
the Background Correction Method area. Depending on the number of
fluorochromes in the sample, five or more rectangles appear on the image
(figure 2-4). The (F#) rectangles are used to locate the fluorochrome markers,
and the (B#) rectangles are used to locate the background used in the
background correction calculations.
ImageQuant Utilities User’s Guide
●
p2-5
Part two FluorSep utility
You use the Find Fluors feature to place the fluorochrome marker rectangles
(section 2.4). Next, you recenter or resize the fluorochrome marker rectangles
(section 2.5). Finally, you place the background rectangles in the correct areas
of the background (section 2.6).
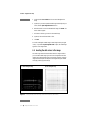
Figure 2-4. The rectangles that appear when you use the Manual background
correction method on an image containing four fluorochrome markers.
p2-6
●
ImageQuant Utilities User’s Guide
Chapter 2 Using FluorSep to separate images
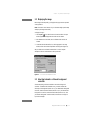
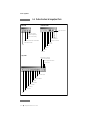
2.4 Locating and placing the fluorochrome marker
rectangles
In both the automatic and manual background correction methods, you use
the Find Fluors feature to help you locate the markers automatically. The
Find Fluors feature locates the fluorochrome marker for each channel with
better than 80% accuracy. The Find Fluors feature evaluates the entire image,
pixel by pixel, using a 2-pixel by 8-pixel area. FluorSep looks at the continuity
of the pixels in each band (figure 2-5). FluorSep calculates the brightest band
in each channel with the least amount of bleed into other channels.
Channel 4
Channel 3
Channel 2
Channel 1
x
X = Pixel 1
x
x
x
Brightest pixel in channel 1
(F1)
Figure 2-5. To place the fluorochrome markers, FluorSep compares pixel 1 in all
four channels and then compares pixel 2 in all four channels. After evaluating all the
pixels in all the channels, FluorSep places a fluorochrome marker on the brightest
pixels in each channel.
FluorSep uses the width of the rectangles to define the width of the bands,
and then applies the histogram algorithm using the same width to determine
the background. FluorSep assumes the bands are in lanes that run from the
top to the bottom of the image.
Before locating the markers using the Find Fluors feature, you might want
to use the instructions in section 2.5 to position and size the rectangle for the
largest fluorochrome marker. Doing this can help FluorSep locate the brightest
pixel in each marker and can help you identify which is the brightest pixel.
To locate the fluorochrome markers, click the Find Fluors button in the
Fluorochrome Separation window. FluorSep compares the channels in the
image, pixel by pixel. FluorSep uses the (F1) through (F4) rectangles to enclose
the control markers of the fluorochromes that you included in your experiment
and collected through emission filters 1 through 4, respectively.
ImageQuant Utilities User’s Guide
●
p2-7
Part two FluorSep utility
After FluorSep finds the brightest fluorochrome markers, FluorSep places
each rectangle so that the brightest pixel within the marker is centered in the
rectangle (figure 2-6). Because the brightest pixel might not be at the center
of the marker, you might need to reposition the rectangles (section 2.5).
Contaminants, such as dust, or a poor signal-to-noise ratio can prevent
Find Fluors from accurately locating the optimal fluorochrome markers. If
Find Fluors cannot locate the control marker for a specific fluorochrome, a
window appears with the message, “Cannot Find F (1, 2, 3, or 4) position.” Use the
instructions in section 2.5 to place the rectangle on the fluorochrome marker
for this channel manually.
Brightest pixel in band
Figure 2-6. The new positions of the rectangles after using Find Fluors to locate the fluorochrome markers.
p2-8
●
ImageQuant Utilities User’s Guide
Chapter 2 Using FluorSep to separate images
2.5 Sizing and centering the fluorochrome marker
rectangles
The way you place the fluorochrome marker rectangles determines how
accurately FluorSep removes the background. Because all the rectangles
must be the same size, you need to size the rectangle that encloses the largest
fluorochrome marker. After you size the rectangle, you should reposition
each rectangle so that the fluorochrome marker is centered in the rectangle.
To size and center a rectangle—
1. Click to select the rectangle that encloses the largest fluorochrome marker.
Handles appear on the corners of the rectangle.
2. Place the pointer on the rectangle name and drag the rectangle until two
perpendicular sides of the rectangle are close to the marker (figure 2-7a).
3. Place the pointer on the handle farthest from the marker and drag the
handle until the remaining two sides of the rectangle are close to the
marker (figure 2-7b). The rectangle should enclose the entire marker
with as little background as possible.
Note: Because the rectangles must be the same size, all the rectangles
change size as you change the selected rectangle.
Handle
F(#)
F(#)
(a) Click the name and drag the
rectangle so that the two sides
are close to the fluorochrome
marker.
(b) Drag the handle so that
the remaining two sides are
close to the fluorochrome
marker.
Figure 2-7. Positioning and sizing the rectangle over the fluorochrome marker.
4. Center the remaining rectangles over the fluorochrome markers.
ImageQuant Utilities User’s Guide
●
p2-9
Part two FluorSep utility
Figure 2-8 shows the fluorochrome marker rectangles correctly sized and
centered over the markers.
If you are using the automatic background correction method, go to
section 2.7 to perform the separation. If you are using the manual background
correction method, go to section 2.6 to position the background rectangles.
Figure 2-8. Correctly sized and centered rectangles in the Image window.
2.6 Locating and placing the background rectangles
(Manual method only)
If you are using the Manual background correction method, FluorSep creates
three to five additional rectangles that you use to identify the background. You
use the (B1) through (B4) rectangles to enclose a portion of the background
near the control marker that ends with the same number. For example, position
the (B1) rectangle in the background near the (F1) rectangle. You use the
(B) rectangle to enclose a portion of the background that contains values that
are lower than the lowest band. Alternatively, you can enclose a portion of the
background that contains the highest background value.
p2-10
●
ImageQuant Utilities User’s Guide
Chapter 2 Using FluorSep to separate images
The number of rectangles depends on the instrument and the settings you
selected in the Scanner Control software for that instrument. For example,
if you scanned a sample that included two fluorochrome markers, you
will see five rectangles labeled (F1), (F2), (B1), (B2), and (B).
2.6.1 Positioning the (B1) through (B4) rectangles
After you size and center the fluorochrome marker rectangles, you place
each background rectangle in a portion of the image background near the
corresponding fluorochrome marker rectangle.
To position the background rectangles—
1. Click to select the (B1) rectangle.
2. Drag the (B1) rectangle to a portion of the background near the control
marker for fluorochrome 1.
3. Repeat steps 1 and 2 for the (B2) through (B4) rectangles and the
control markers for fluorochromes 2 through 4. Note: The number of
background rectangles depends on the number of fluorochromes used
to scan the image.
2.6.2 Determining the location for the (B) rectangle
Important
Choosing the correct location for the (B) rectangle improves or optimizes the
separation results.
If your image has weak bands, you should place the (B) rectangle in an area
that contains values that are lower than the weakest band you want to see.
Placing the rectangle in an area with the highest background value can cause
weak bands to disappear from the separated image. You can visually determine
the weakest band on the image.
If your image does not have weak bands, you can place the (B) rectangle
in an area that contains the highest background value found on the image.
Note: Placing the (B) rectangle at the lowest background value is similar to
using the Global background filter.
To determine the highest background value—
1. Choose Pixel Locator (
) from the Tools menu or the Image toolbar.
2. Move the pointer to the background near the top of the image and then
click the mouse button. A value appears in the status bar.
3. Make a note of the value.
ImageQuant Utilities User’s Guide
●
p2-11
Part two FluorSep utility
4. Move the pointer to a background location farther down the image.
Click the mouse button and make a note of the value.
5. Repeat step 4 until you reach the bottom of the image.
6. From the list of values, select the highest background value.
7. Click Select (
), and then click the (B) rectangle.
8. Drag the (B) rectangle so that it surrounds the area that contains the
highest value.
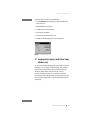
Figure 2-9 shows the fluorochrome marker rectangles and the background
rectangles correctly positioned on the image.
Figure 2-9. Correctly positioned rectangles for use with the manual background
correction method.
p2-12
●
ImageQuant Utilities User’s Guide
Chapter 2 Using FluorSep to separate images
2.7 Performing the separation
After positioning the rectangles, you are ready to separate the image.
After you separate the image, you can evaluate the results and, if necessary,
repeat the procedure using additional options (sections 2.8 through 2.10).
To separate the image, click Perform Separation in the Fluorochrome
Separation window (figure 2-2). The separation process begins, and the
progress appears in the status bar. If you want to cancel the separation,
press the ESC key.
Note: The larger the image, the longer the time needed for the separation
function.
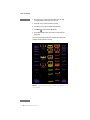
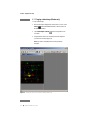
After FluorSep removes the cross-contamination, a window displays the
message, “Fluorochrome Separation has been completed.” Click OK. The separated
image appears in the Image window in the Overlay view (figure 2-10), and
the Perform Separation button changes to Undo Separation.
Figure 2-10. Image separated using the automatic background correction method
displayed in the Overlay view.
ImageQuant Utilities User’s Guide
●
p2-13
Part two FluorSep utility
2.8 Evaluating the results
Important
To improve the visibility of the image after separation, you might need to optimize
the image using the Gray/Color Adjust feature (section 7.8).
If you see distinct colored bands in the overlaid image, you have completed
the separation process. You can start your analysis using the ImageQuant
software. If the colored bands are not what you expected, you can undo the
separation. Click the Undo Separation button. A window appears with the
message, “Are you sure you want to undo Fluorochrome Separation?” Click OK. The
original unseparated image replaces the separated image in the Image window.
Repeat the separation using one or more of the following options:
•
The accuracy of fluorochrome separation is very sensitive to the placement
of the rectangles. Check each rectangle to make sure that the marker is
centered in the rectangle. Resize the rectangle that encloses the largest
fluorochrome marker to remove more background pixels (section 2.4).
•
If you do not like the results of the automatic background correction
method, use the Manual background correction method to define specific
areas on the image to use as the background (section 2.6).
•
In addition to the automatic background correction method, use the
Local or Global background filter to help remove the background values
(section 2.9).
•
In addition to the manual background correction method, use the Local
background filter to help remove the background values (section 2.9.1).
•
In addition to the automatic or manual background correction method, use
the Impulse Filter to remove artifacts caused by imperfections in the sample
matrix (section 2.10).
2.9 Choosing a background correction filter
To enhance the quality of the image background correction, you can use
the Local or Global background correction filter with the Automatic method
or the Local background correction filter with the Manual method.
2.9.1 Local background correction filter
Inconsistencies in the sample thickness used during the scan can result in an
image background that is not uniform. The Local filter (figure 2-11a) removes
the variation in the background values relative to the image bands, which
creates a uniform background. The Local filter works best on an unseparated
image that contains bright distinct bands but an uneven background.
p2-14
●
ImageQuant Utilities User’s Guide
Chapter 2 Using FluorSep to separate images
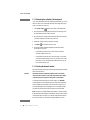
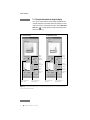
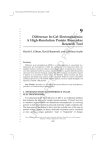
2.9.2 Global background correction filter
The Global background filter (figure 2-11b) reduces the overall intensity of the
image, while maintaining the relative intensity of the bands to the background.
The Global filter uses an algorithm to locate the lowest background value, and
then subtracts this value from the entire image.
(a) Local filter
Levels out the variations
in the background relative
to the bands to create a
uniform background.
(b) Global filter
Locates the lowest
background value and
subtracts this value
from the entire image.
(c) No background filter
Displays the original
intensity of the fluorochrome
bands relative to the
background.
Figure 2-11. Comparison of the effects of the background filters used to separate the same dataset file:
(a) Local filter, (b) Global filter, and (c) No background filter.
ImageQuant Utilities User’s Guide
●
p2-15
Part two FluorSep utility
2.10 Using the impulse filter during separation
Note: The impulse filter is a directionally applied filter designed to improve
images scanned on the Typhoon, FluorImager, and Storm instruments.
To improve the separation, you can use the impulse filter to remove artifacts
caused by contaminants and imperfections (such as dust or bubbles) in the
sample matrix. The impulse filter reduces 1-pixel impulses (positive only) by
comparing 3 vertical pixels at a time.
For each 3-pixel group (pixels A, B, and C), the impulse filter compares and
resolves the middle pixel B as follows:
If pixel B > {filter weight} × (A + C), then B = (A+C)/2
The filter weight is a factor used to compare pixel B against pixels A and C.
You can choose one of three filter weight levels from the Impulse Filter
list box—
•
Low is 0.75 and allows the greatest discrepancies between the pixel
values in the three-pixel set and removes the least number of one-pixel
impulses.
•
Medium is 0.6 and provides a midrange setting.
•
High is 0.55 and allows the fewest discrepancies between the pixel values
and removes the most impulses.
FluorSep applies the impulse filter to the unseparated files, and then separates
the image.
p2-16
●
ImageQuant Utilities User’s Guide
Chapter 3 Using FluorSep to build
a dataset file
The FluorSep utility includes a feature that allows you to build a dataset file.
You can build a dataset file from single images (.gel) or from images created as
part of a dataset (.ds). The topics in this chapter are—
•
•
•
Creating the images (section 3.1)
Building a dataset file from single images (section 3.2)
Building a two-channel dataset file from separated image files (section 3.3)
After creating the dataset, you view the multichannel image in ImageQuant or
ImageQuant Tools.
3.1 Creating the images
To build a dataset successfully from single image files (.gel), you must create the
images using the same—
•
Instrument
•
Sample (do not move the sample between scans)
•
Scan area
•
Digital resolution
FluorSep prompts you if you select files that do not match.
3.2 Building a dataset file from single images
You can create a dataset from two to four image files (.gel). To build a dataset
from single images—
1. Start the FluorSep utility and choose Build Dataset from the File menu. The
DS Builder window appears (figure 3-1).
2. Make sure the Separated DS for analysis box is not selected.
ImageQuant Utilities User’s Guide
●
p3-1
Part two FluorSep utility
Figure 3-1. The DS Builder window.
3. Click the Browse button (
) for channel 1. The Open window appears.
4. Locate and select the image file (.gel) that contains the image with the
shortest wavelength.
Important
You must assign the image files to the channels in sequence. Start with the image
file that contains the shortest wavelength and end with the image file that contains
the longest wavelength.
5. Click the Browse button (
) for channel 2. The Open window appears.
6. Locate and select the image file that contains the image data with the next
shortest wavelength.
7. (Optional for Channel 3 only) Click the Browse button (
) for channel 3
and select the image file with the next shortest wavelength.
8. (Optional for Channel 4 only) Click the Browse button (
and select the image file with the longest wavelength.
) for channel 4
9. Click Build. After the software creates the dataset file, the Save As window
appears.
10. Type a name for the dataset file and click Save. After FluorSep builds the
dataset file, a message appears stating the dataset was built successfully.
11. Close FluorSep and display the multichannel image in ImageQuant or
ImageQuant Tools.
p3-2
●
ImageQuant Utilities User’s Guide
Chapter 3 Using FluorSep to build a dataset file
3.3 Building a two-channel dataset file from
separated image files
The DS Builder allows you to build a two-channel dataset file that uses image
files created from two different datasets or from a dataset that includes more
than two channels.
Important
You must use FluorSep to separate the images before you build the new dataset.
Because the Fragment Analysis software analyzes two-channel datasets only,
you use the DS Builder to build datasets that can be analyzed in Fragment
Analysis. For example, if you create a three-channel dataset that includes
a standard in channel 1 and an unknown in channel 2 and channel 3, you
must build two datasets before you can analyze the data in Fragment Analysis.
One dataset includes the standard in channel 1 and the unknown in channel 2.
The second dataset includes the standard in channel 1 and the unknown in
channel 3.
To build a new dataset file from the separated images in another dataset—
1. Start the FluorSep utility and choose Build Dataset from the File menu.
The DS Builder window appears (figure 3-1).
2. Select the Separated DS for analysis box. The fields for channels 3 and 4
become inactive (figure 3-2).
3. Click the Browse button (
) for channel 1. The Open window appears.
Figure 3-2. The DS Builder window in the separated dataset mode.
4. Locate the filename.dir folder that contains the separated image data
file you want to use for channel 1, where filename is the name of the
dataset file.
5. Double-click the folder to display the contents.
ImageQuant Utilities User’s Guide
●
p3-3
Part two FluorSep utility
6. Select the sep#.gel file, where # can be 1 through 4, that represents the
number of image channels contained in the dataset.
7. Click the Browse button (
) for channel 2. The Open window appears.
8. Repeat steps 4 through 6 to select the second image.
9. Click Build. After the software creates the dataset file, choose Save As from
the File menu. The Save As window appears.
10. Type a name for the dataset file and click Save.
Important
p3-4
●
You cannot use the Undo Separation feature on a dataset file that you create using
this method.
ImageQuant Utilities User’s Guide
Part three
ImageQuant Tools utility
Chapter 4 Using ImageQuant Tools
The ImageQuant Tools utility allows you to modify a copy of an image in a
variety of ways. The topics in this chapter are—
•
•
•
•
•
•
•
•
•
•
Important
Displaying an image (section 4.1)
Rotating the image in 90° increments (section 4.2)
Rotating the image in 0.5° increments (section 4.3)
Inverting the data values in the image (section 4.4)
Removing noise using the impulse filter (section 4.5)
Removing noise using the median filter (section 4.6)
Cropping and uncropping a multichannel image (Windows only)
(section 4.7)
Exporting a multichannel image as individual images (Windows only)
(section 4.8)
Viewing a multichannel image using a flicker effect (Windows only)
(section 4.9)
Copying image data to Excel for 3D charting (Windows only)
(section 4.10)
Before using the features in ImageQuant Tools on an image, check that sufficient
disk space is available on the computer. Each process requires approximately
twice as much disk space as the size of the file being processed. After you process
the image, you will have the original image file and the new modified image file.
You can open and quantitate both images using ImageQuant or other analysis
software.
4.1 Displaying an image
Before you can process an image using ImageQuant Tools, you display the
image in an Image window.
To display an image—
1. In the ImageQuant Tools window, choose Open (
) from the File menu
or the Main toolbar. The Open window appears showing the active folder
and its contents.
2. If the image name is not listed, choose a different folder and view its
contents.
ImageQuant Utilities User’s Guide
●
p4-1
Part three ImageQuant Tools utility
3. Locate and select the image file. The Image window appears and displays
the image you selected.
See your Windows or Macintosh documentation for a more complete
description of how to use the features in the Open window.
4.2 Rotating the image in 90° increments
To rotate the image in 90° increments, choose Rotate Image from the Image
menu. The Image Rotation window appears (figure 4-1). The Image Rotation
window contains two copies of the image displayed in the Image window.
The Image Rotation window contains rotation controls for 90° increments
and arbitrary increments. If you want to rotate the image in increments smaller
than 90°, see section 4.3.
Figure 4-1. The Image Rotation window.
The Control Image area contains the eight 90° rotation choices. The top four
choices rotate the image clockwise in 90° increments. The bottom four choices
flip (mirror) the image, and then rotate the image counterclockwise in 90°
increments.
p4-2
●
ImageQuant Utilities User’s Guide
Chapter 4 Using ImageQuant Tools
To rotate the image—
1. In the Control Image area, click the button that represents the rotation you
want. The Destination image rotates so that you can preview the effect of
the rotation.
2. (Optional) If you want the rotated image to open automatically after you
save it, select the Open image after rotate check box.
3. When the rotation is correct for the Destination image, click Rotate. The
Save As window appears.
4. In the Save As window, type a name for the rotated image.
5. (Optional) Choose a different folder or drive.
6. Click Save.
A new file containing the rotated image is created using the name you typed
in step 4. If you selected Open image after rotate in step 2, the rotated image
appears in a new Image window.
4.3 Rotating the image in 0.5° increments
The Image Rotation window (figure 4-1) contains two copies of the image
displayed in the Image window, and the window contains rotation controls
for 90° increments and 0.5° increments. If you want to rotate the image
in 90° increments, see section 4.2.
You use the controls in the Arbitrary area to rotate the image in 0.5°
increments. If you want to smooth the jagged edges of the displayed image,
select the Anti-Alias feature.
The 90° increment and the arbitrary increment features can be used together.
For example, you can rotate the image 90°, and then rotate the image in 0.5°
increments in either direction.
To rotate the image in 0.5° increments—
1. Choose Rotate Image from the Image menu. The Image Rotation window
appears (figure 4-1).
2. Select the Arbitrary Angle check box.
3. Click the up arrow to rotate the image clockwise, or click the down arrow
to rotate the image counterclockwise. The Destination image rotates so that
you can preview the effect of the rotation. Alternatively, you can type a
number.
ImageQuant Utilities User’s Guide
●
p4-3
Part three ImageQuant Tools utility
4. (Optional) Select the Anti-Alias check box to smooth the edges of the
image.
5. (Optional) If you want to open the rotated image automatically after you
save it, select the Open image after rotate check box.
6. When the rotation is correct for the Destination image, click Rotate. The
Save As window appears.
7. In the Save As window, type a name for the rotated image.
8. (Optional) Choose a different folder or drive.
9. Click Save.
A new file containing the rotated image is created using the name you typed
in step 7. If you selected Open image after rotate in step 5, the rotated image
appears in a new Image window.
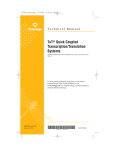
4.4 Inverting the data values in the image
The Invert Image command inverts the data values in an image and allows
you to save the inverted image. Figure 4-2 shows an image before and after
inverting. By inverting the data values in an image, the troughs in a negative
image are inverted to peaks and the peaks in the negative image are inverted
to troughs, producing a positive image.
(a) Before inverting the image
(b) After inverting the image
Figure 4-2. Inverting the data values in an image: (a) before inverting and (b) after inverting.
p4-4
●
ImageQuant Utilities User’s Guide
Chapter 4 Using ImageQuant Tools
To invert an image—
1. Choose Invert Image from the Image menu. The Save As window appears.
2. Type a name for the image file.
3. (Optional) Choose a different folder or drive.
4. Click OK. The inverted image appears in a new Image window.
4.5 Removing noise using the impulse filter
Using an impulse filter, you can remove artifacts caused by contaminants and
imperfections (such as dust or bubbles) in the sample matrix. Removing the
artifacts and imperfections improves the quality of the image analysis. The
impulse filter reduces one-pixel impulses (positive only) by comparing three
vertical pixels at a time (table 4-1).
Table 4-1. How the impulse filter affects pixel B using the Low, Medium, and
High weights
Pixel
Original pixel value
Low weight
Medium weight
High weight
A
250
250
250
250
B
350
350
275
275
C
300
300
300
300
For each three-pixel group (pixel A, B, and C), the impulse filter compares and
resolves the middle pixel B as follows:
If pixel B > {filter weight} × (A + C), then B = (A+C)/2
The filter weight is a factor used to compare pixel B against pixels A and C.
You can choose one of three filter weights from the Impulse Filter window—
•
Low = 0.75 and allows the greatest discrepancies between the pixel values
in the three-pixel set and removes the least number of one-pixel impulses.
•
Medium = 0.6 and provides a midrange setting.
•
High = 0.55 and allows the fewest discrepancies between the pixel values
and removes the most impulses.
ImageQuant Utilities User’s Guide
●
p4-5
Part three ImageQuant Tools utility
To remove the noise from an image—
1. Choose Impulse Filter from the Image menu. The Impulse Filter window
appears (figure 4-3).
2. Choose Low, Medium, or High for a filter weight.
3. Click OK. The Save As window appears.
4. Type a name for the image file.
5. (Optional) Choose a different folder or drive.
6. Click OK. The filtered image appears in a new Image window.
Figure 4-3. The Impulse Filter window.
4.6 Removing noise using the median filter
Using a median filter, you can remove bright noise spikes from the image
without blurring the image. You can choose a 3x3 or 5x5 kernel. The median
filter determines the highest pixel value (noise spike) in the kernel, and replaces
the value with the median value of all the pixels in the kernel. Figure 4-4 shows
how the median filter affects a 3x3 kernel.
100
100
300
200
600
200
300
100
100
200
Figure 4-4. How the median filter affects a 3x3 kernel. The median value in this
kernel is 200.
p4-6
●
ImageQuant Utilities User’s Guide
Chapter 4 Using ImageQuant Tools
To reduce the noise in an image using the median filter—
1. Choose Median Filter from the Image menu. The Median Filter window
appears (figure 4-5).
2. Select 3x3 or 5x5 in the Kernel area.
3. Click OK. The Save As window appears.
4. Type a name for the image file.
5. (Optional) Choose a different folder or drive.
6. Click OK. The filtered image appears in a new Image window.
Figure 4-5. The Median Filter window.
4.7 Cropping and uncropping a multichannel image
(Windows only)
You can crop a multichannel (dataset) image to exclude portions of the image
from analysis. If you are cropping a multichannel image, all the individual
images that make up the dataset are cropped to the same size and can be
used by other analysis software, such as the DeCyder™ software.
If you want to change the cropped area, you can return to the previous
view of the image. After cropping the image, you can save the image as a new
image, overwrite the original image, or close the window without saving the
cropped image.
ImageQuant Utilities User’s Guide
●
p4-7
Part three ImageQuant Tools utility
4.7.1 Cropping a dataset image (Windows only)
To crop a dataset image—
1. Make sure the image is displayed in the Overlay mode. If it is not, choose
Overlay (
) from the Multichannel submenu on the View menu or on
the Multichannel toolbar.
2. Choose Define Region of Interest (
Tools menu.
) from the Image toolbar or the
3. Drag the pointer to draw a box around the portion of the image that
you want to use for analysis (figure 4-6).
Note: If you want to change the portion of the image in the box,
drag again.
Figure 4-6. Selecting the portion of the multichannel (dataset) image to crop.
p4-8
●
ImageQuant Utilities User’s Guide
Chapter 4 Using ImageQuant Tools
4. Choose Crop Dataset (
) from the Edit menu or the Image toolbar.
The image changes to display only the area within the box (figure 4-7).
5. (Optional) To change the cropped area, repeat steps 2 through 4.
Figure 4-7. The image after cropping.
ImageQuant Utilities User’s Guide
●
p4-9
Part three ImageQuant Tools utility
4.7.2 Uncropping a dataset image (Windows only)
To return to the previous image, choose Undo Crop of Dataset (
) from
the Edit menu or the Image toolbar. You can continue to uncrop until the
image returns to the original size.
4.7.3 Saving the cropped dataset image (Windows only)
Depending on the command you choose, you can save the cropped dataset
image as a new dataset image, overwrite the original image, or save the
dataset image as individual images.
Note: If you do not want to save the cropped image, close the Image window
without saving.
•
To save the image as a new dataset, choose Save As from the File menu.
The Save As window appears. Type a new name for the dataset image and
click Save. Both the original dataset and the new dataset appear in the Data
folder or the folder you selected.
•
To overwrite the existing dataset image, choose Save Cropped Dataset over
Original from the File menu. A message window appears warning you that
you are about to overwrite the original dataset. Click Yes to overwrite, or
click No to close the message window without overwriting.
•
To export the dataset image as individual images, follow the instructions
in section 4.8.
4.8 Exporting a multichannel image as individual
images (Windows only)
You can export the displayed multichannel image as individually named
images. After you save the images, you can view the data using other analysis
software, such as the DeCyder software.
Important
If you export a multichannel image as individual images, you cannot view the
images in ImageQuant as a multichannel dataset image.
To export the multichannel image as individual images—
1. Choose Export Gel Files From Dataset to Folder (
) from the File menu
or the Image toolbar. The Export Gel Files From Dataset to Selected Folder
window appears (figure 4-8).
2. Type a unique name for each channel in the boxes labeled 1 through 4
under Gel File Names in Dataset.
p4-10
●
ImageQuant Utilities User’s Guide
Chapter 4 Using ImageQuant Tools
Note: If you do not want to export one of the gel files in the dataset, delete
the default file name and leave the file name box blank.
3. (Optional) Click Browse and select a new folder from the Browse window.
Click OK to return to the Export Gel Files From Dataset to Selected Folder
window.
4. Click Save to save the images.
Figure 4-8. The Export Gel Files From Dataset to Selected Folder window.
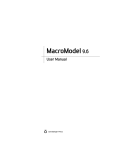
4.9 Viewing a multichannel image using a flicker
effect (Windows only)
Using a flicker effect, you can simulate an animation sequence on the displayed
multichannel (dataset) image. You choose the images you want to flicker and
the flicker rate. You can also change the default gray scale to a color, and
you can change the normalization display values.
ImageQuant Utilities User’s Guide
●
p4-11
Part three ImageQuant Tools utility
4.9.1 Default settings (Windows only)
The default flicker settings in the Flicker Display Channels window
(figure 4-9) are—
•
Static Channels to Display—You can change the default (None) to
select the channel images that you want to remain static. During the flicker
sequences, the software always displays the static images.
•
Channels to Flicker—You can change the defaults so that not all the
channels flicker. To do this, clear the check box for any channel you do not
want to flicker. In addition, you can change the order the channels appear
by selecting a channel, and then clicking the Up or Down button to move
the selected channel.
•
Flicker Rate—You can change the default flicker rate (500 ms) to increase
or decrease the flicker rate. The flicker range is 1 ms to 2 000 ms. To do
this, drag the slider to the right to slow down the flicker rate, or drag the
slider to the left to speed up the flicker rate. Alternatively, you can type the
milliseconds in the box.
Figure 4-9. The Flicker Display Channels window.
p4-12
●
ImageQuant Utilities User’s Guide
Chapter 4 Using ImageQuant Tools
The default flicker settings in the Advanced Setting For Flicker Display
Channels window (figure 4-10) are—
Important
•
Color Selection for Channels—You can change the default (gray scale
with white background) by selecting a different setting from the Color
Selection for Channels list. To manually select a color for each channel,
choose User Select Colors.
•
Normalize—All channels are displayed using the high and low numbers
displayed in the Normalize area. (For more information on the display
range, see section 7.8.1.) You can change the defaults by typing a new
number in the High and Low boxes.
When using the flicker effect, the software saves the normalized values for
each image.
Figure 4-10. The Advanced Setting For Flicker Display Channels window.
4.9.2 Selecting the flicker settings (Windows only)
To select the flicker settings—
1. Choose Flicker Display Channels (
) from the View menu or the
Multichannel toolbar. The Flicker Display Channels window appears
(figure 4-9).
2. (Optional) In the Static Channel to Display area, select the check box
for each channel that you want to remain static (always displayed).
3. (Optional) In the Channels to Flicker area, clear the check box for a
channel that you do not want to flicker.
4. (Optional) In the Channels to Flicker area, change the order of the
channels by selecting a channel to move. Then click the Up or Down
button.
ImageQuant Utilities User’s Guide
●
p4-13
Part three ImageQuant Tools utility
5. (Optional) In the Flicker Rate area, change the flicker rate by dragging the
slider to increase or decrease the rate. Alternatively, you can type a number
in the box.
6. (Optional) To change the advanced settings, click the Gray/Color Adjust
button. The Gray/Color Adjust window appears. Click Advanced. The
Advanced Setting For Flicker Display Channels window appears
(figure 4-10).
•
Select a different image color combination from the Color Selection
for Channels list. If you select User Select Colors, you choose a color
for each channel from the Color list in the Gray/Color Adjust window.
•
Type different values in the High and Low boxes to change the
normalization.
Click OK to return to the Gray/Color Adjust window. (If you are manually
selecting colors, you select a color from the Color list for the channel
currently displayed in the window. Then click the next Channel tab you
want to change and choose a color for that channel. Continue for the
remaining channels.) Click OK to return to the Flicker Display Channels
window.
7. Click Start. The images flicker according to the settings you selected.
8. After viewing the animation sequence, click Stop, and then click Close to
close the Flicker Display Channels window.
4.10 Copying image data to Excel for 3D charting
(Windows only)
You can copy the image data and then paste the individual pixel values in
Excel for three-dimensional (3D) charting. You can copy a portion of a single
image or a portion of one channel of a multichannel (dataset) image that is
displayed in the side-by-side mode. After you paste the values in Excel, you
can create a 3D surface chart that shows the spot contours of the image.
To copy the selected image data to Excel—
1. Choose Define Region of Interest (
Image toolbar.
) from the Tools menu or the
2. Drag the pointer through the area you want to chart.
Important
p4-14
●
Excel has a limitation on the number of columns that fit on a worksheet. If the area
you select contains too much data, Excel will truncate the data.
ImageQuant Utilities User’s Guide
Chapter 4 Using ImageQuant Tools
3. Choose Copy Image Data for Excel 3D Chart (
the Image toolbar.
) from the Edit menu or
4. Start Excel and display a new worksheet.
5. Choose Paste from the Edit menu or the toolbar. The data appear in the
worksheet.
6. Choose Chart from the Insert menu. The Chart Wizard appears.
7. Choose Surface as the chart type, and click Next.
8. (Optional) Continue filling in information in the Chart Wizard.
9. Click Finish. The chart appears.
10. (Optional) Save the chart and data.
ImageQuant Utilities User’s Guide
●
p4-15
Part four
Reference
Chapter 5 File menu
The File menu contains—
•
•
•
•
•
•
•
•
•
•
Open (section 5.1)
Close (section 5.2)
Build Dataset (FluorSep only) (section 5.3)
Save As (ImageQuant Tools only) (section 5.4)
Save Region of Interest As (ImageQuant Tools only) (section 5.5)
Save Cropped Dataset over Original (ImageQuant Tools for Windows
only) (section 5.6)
Export Gel Files From Dataset to Folder (ImageQuant Tools for Windows
only) (section 5.7)
Image Properties (section 5.8)
Most recently used list (section 5.9)
Exit or Quit (section 5.10)
5.1 Open
The Open command provides access to any stored image. To open an image—
Windows—Open the folder that contains the image, and then double-click the
name in the box.
Macintosh—Double-click the image name in the File Name box.
The utilities use several file types. Each type is identified with a different
extension or icon.
Windows—See appendix A for a description of each extension.
Macintosh—See appendix B for a description of each extension.
5.2 Close
The Close command closes the active window. Choosing the Close command is
the same as clicking the Close box in the window.
5.3 Build Dataset
(FluorSep only)
The Build Dataset command allows you to create a multichannel dataset image
file from separate image files. Section 3.3 describes this feature in detail.
ImageQuant Utilities User’s Guide
●
p5-1
Part four Reference
5.4 Save As
(ImageQuant Tools only)
The Save As command allows you to save the selected image and associated
files using a new name. In the Save As window, type the name to use for saving
the image. If you are saving the image to a different folder from the default,
choose the folder from the folder/file name list. If you are saving a dataset
image, ImageQuant Tools copies the dataset document, the dataset folder,
and the contents of the dataset folder. ImageQuant Tools adds the appropriate
extensions to all the files. The original image and associated files remain
unaltered.
5.5 Save Region of Interest As
(ImageQuant Tools only)
The Save Region of Interest As command allows you to save a portion of
an image using a new name. You select the portion of the image using the
Define Region of Interest command on the Tools menu (section 8.9). After
defining the region of interest, the Save Region of Interest As command
becomes active.
In the Save Region of Interest As window, type the name to use for saving
the image. If you are saving the image to a different folder from the default,
choose the folder from the folder/file name list. If you are saving a dataset
image, ImageQuant Tools copies the dataset document, the dataset folder,
and the contents of the dataset folder. ImageQuant Tools adds the appropriate
extensions to all the files. The original image and associated files remain
unaltered.
5.6 Save Cropped Dataset over Original
(ImageQuant Tools for Windows only)
The Save Cropped Dataset over Original command allows you to overwrite
the uncropped dataset files with the cropped dataset files.
Section 4.7 describes this feature in detail.
p5-2
●
ImageQuant Utilities User’s Guide
Chapter 5 File menu
5.7 Export Gel Files From Dataset to Folder
(ImageQuant Tools for Windows only)
The Export Gel Files From Dataset to Folder command allows you to
export the images that make up a multichannel (dataset) image as individual,
uniquely named images. In the Export Gel Files From Dataset to Folder
window, you type new names for each image, and then use the Browse button
to select a new folder. If you do not want to export the image for one of the
channels, you can leave the file name for that channel blank. After you save
the new images, you can view them using analysis software, such as the
DeCyder software. However, the new image files are no longer a dataset
image and cannot be viewed in ImageQuant using the Multichannel feature.
Note: You can reconstruct the dataset file using the Build Dataset command
in FluorSep (section 3.2).
Section 4.8 describes this feature in detail.
5.8 Image Properties
The Image Properties command displays information about the image.
Alternatively, you can double-click in the Image window to display the
ImageProperties window. The ImageProperties window contains three
tabs: File Info, Scan Info, and History. Click a tab to display the contents.
File Info tab
The File Info tab displays the information shown in figure 5-1.
Figure 5-1. The File Info tab of the ImageProperties window.
ImageQuant Utilities User’s Guide
●
p5-3
Part four Reference
Scan Info tab
The Scan Info tab displays the information shown in figure 5-2.
Figure 5-2. The Scan Info tab of the ImageProperties window.
History tab
The History tab (figure 5-3) displays a list of all the operations performed on
the original image, if any. This list provides an audit trail of all the operations
performed on the image that can impact quantitation. The current image name
appears in the Image Name box.
Note: Modifications you make to the image display using the Gray/Color
Adjust feature do not appear in the Sequence of Operations list.
Figure 5-3. The History tab in the ImageProperties window.
p5-4
●
ImageQuant Utilities User’s Guide
Chapter 5 File menu
5.9 Most recently used list
The File menu displays the last four most recently used files. You can open one
of these files by choosing the name from the File menu.
5.10 Exit or Quit
The Exit (Windows) or Quit (Macintosh) command closes ImageQuant Tools
or FluorSep. You will be prompted to save any changes.
ImageQuant Utilities User’s Guide
●
p5-5
Chapter 6 Edit menu
(ImageQuant Tools only)
The Edit menu contains—
•
•
•
•
Copy Image (section 6.1)
Copy Image Data for Excel 3D Chart (Windows only) (section 6.2)
Crop Dataset (Windows only) (section 6.3)
Undo Crop Dataset (Windows only) (section 6.4)
6.1 Copy Image
The Copy Image command allows you to make a copy of the entire image
or a portion of the image. To copy a portion of the image, you define the
portion using the Define Region of Interest command or toolbar button
(section 8.9) before using the Copy Image command. The copy of the image
is placed on the clipboard as a 24-bit RGB image. You can paste the copy
into another application, such as Microsoft Word, Excel, or Adobe™
Photoshop™.
You can copy the following images:
•
A single-channel image displayed in gray scale or color.
•
A multiple-channel image displayed in the overlaid, color mode.
•
The selected channel of a multichannel image displayed in the side-by-side,
gray-scale mode.
6.2 Copy Image Data for Excel 3D Chart
(Windows only)
The Copy Image Data for Excel 3D Chart command allows you to copy the
pixel values for a selected area to Excel. After you paste the values you can
create a three-dimensional (3D) surface chart that shows the spot contours
of the image.
Section 4.10 describes this feature in detail.
ImageQuant Utilities User’s Guide
●
p6-1
Part four Reference
6.3 Crop Dataset (Windows only)
The Crop Dataset command allows you to crop a multichannel (dataset)
image to exclude portions of the image that you do not want to analyze.
All the images in the dataset are cropped to the same dimension.
Section 4.7 describes this feature in detail.
6.4 Undo Crop Dataset (Windows only)
The Undo Crop Dataset command allows you to uncrop the multichannel
image displayed in the Image window.
Section 4.7 describes this feature in detail.
p6-2
●
ImageQuant Utilities User’s Guide
Chapter 7 View menu
The View menu contains—
•
•
•
•
•
•
•
•
•
•
•
•
Toolbars (section 7.1)
Status Bar (section 7.2)
Actual Size (section 7.3)
Fit to Window (section 7.4)
Magnification (section 7.5)
Zoom In (section 7.6)
Zoom Out (section 7.7)
Gray/Color Adjust (section 7.8)
Map (section 7.9)
Multichannel (section 7.10)
Flicker Display Channels (ImageQuant Tools for Windows only)
(section 7.11)
Hide Objects (FluorSep only) (section 7.12)
7.1 Toolbars
The Toolbars command allows you to change the toolbar configuration. In
the Toolbar Configuration window (figure 7-1), choose which toolbars to
display by clicking the check box next to each toolbar you want displayed.
(a) FluorSep and ImageQuant Tools for Macintosh
(b) ImageQuant Tools for Windows
Figure 7-1. The Toolbar Configuration window: (a) FluorSep and ImageQuant Tools for Macintosh and
(b) ImageQuant Tools for Windows.
ImageQuant Utilities User’s Guide
●
p7-1
Part four Reference
A ToolTip is a brief description of the function of a button. If you select
Show, you see the tip when you rest the pointer on the button. In FluorSep
and ImageQuant Tools for the Macintosh, you can select whether you want the
toolbar buttons displayed in color or in black and white. Click OK to confirm
your choices and close the window. If you reposition a toolbar, ImageQuant
saves the new position when you close the application.
Important
Leave the Multichannel toolbar in the horizontal orientation. Changing the
orientation to vertical causes the View One Channel button to disappear.
See appendix A for a description of the toolbar buttons in the Windows version
of the FluorSep and ImageQuant Tools software.
See appendix B for a description of the toolbar buttons in the Macintosh
version of the FluorSep and ImageQuant Tools software.
7.2 Status Bar
The Status Bar command displays or hides the status bar, which is at the
bottom of the screen. The status bar displays messages. Choose Status Bar
to show or hide the status bar.
7.3 Actual Size
The Actual Size command displays the image at 100%, which is the actual size
at which the image was scanned. For large images, the utilities will not display
all the pixels so that the image can approximate the scan size of the original
sample. When viewing an image in Actual Size, ImageQuant displays the image
as close to the actual size as possible.
7.4 Fit to Window
The Fit to Window command displays the entire image in the Image window.
If the image is larger than the Image window boundaries, the utility reduces the
image so that it fits within the boundaries.
7.5 Magnification
The Magnification command displays the image at the magnification you select
from the submenu. The percentages range from 25% to 800%.
7.6 Zoom In
The Zoom In command doubles the magnification of the entire image.
p7-2
●
ImageQuant Utilities User’s Guide
Chapter 7 View menu
7.7 Zoom Out
The Zoom Out command reduces the magnification of the entire image
by half.
7.8 Gray/Color Adjust
The Gray/Color Adjust command graphically shows how the pixel intensities
of the image are displayed in the Image window. The Gray/Color Adjust
window contains one tab for a single-channel image and one tab for each
channel of a multichannel image. Figure 7-2 shows the Gray/Color Adjust
window for a single-channel image.
Click a tab to view
the channel.
Edit High/Low button
Select a new channel
color from the list.
Edit Lookup Table button
Select to invert the
pixel values.
Click to apply the
changes and close the
Gray/Color Adjust window.
Click to apply the
changes to the
Image window.
(ImageQuant Tools for Windows only)
Figure 7-2. The Gray/Color Adjust window for a single image.
ImageQuant Utilities User’s Guide
●
p7-3
Part four Reference
The Preview Channels area displays a small version of the portion of the
image displayed in the Image window. The histogram plot displays the range
|of values for the portion of the image displayed in the Preview Channels area.
Important
If the entire image is not displayed in the Image window, changes you make to
the histogram plot can produce unexpected results.
As you make changes in the Histogram area, the change appears in the
Preview Channels area. You click Apply or OK to see the changes in the
Image window and to save the changes with the image.
You can alter the image (or each channel of the image) using the following
controls:
•
Color—Change the color of the image by choosing a new color from the
Color list.
(ImageQuant Tools for Windows only) Note: You can select the same color
for multiple channels of a multichannel (dataset) image.
•
Invert Mode—Invert the display of the pixel values in a single image by
selecting or deselecting the Invert Mode box. You can invert gray-scale
and color images.
•
Edit High/Low—Change the high and low display values to exclude
background and saturated data (section 7.8.1).
•
Edit Lookup Table—Change the image display by applying different
lookup tables to the image (section 7.8.2).
•
(ImageQuant Tools for Windows only) Advanced button—Click to view
the Advance Setting For Flicker Display Channels window, which allows
you to select settings to use with the flicker feature. Section 4.9 describes
this feature in detail.
For a step-by-step description of how to use the Gray/Color Adjust features,
see the ImageQuant User’s Guide.
7.8.1 Changing the high and low display values
After you create an image of your sample using an Amersham Biosciences
instrument, the image has no defined display range. The first time you open
the image, ImageQuant Tools or FluorSep automatically sets the range of
values to include the lowest and the highest data values collected by the
instrument. The utility saves the display range with the image when you
close the Image window.
p7-4
●
ImageQuant Utilities User’s Guide
Chapter 7 View menu
You can change the high display values to remove saturated pixels from the
image, and you can remove low display values to eliminate the background
pixels.
To change a display value, drag the slider that appears above or below the
histogram plot, or type a new value in the High or Low box (figure 7-3).
You can use the Autoscale button to return to the scale determined by the
utility. Note: If you do not see the High box, Low box, or Autoscale button,
click the Edit High/Low button (
).
Edit High/Low button
Type a new high data value.
Drag to change the
high data value.
Click to have the utility scale
the image.
Type a new low data value.
Drag to change the
low data value.
(ImageQuant Tools for Windows only)
Figure 7-3. The High/Low controls in the Gray/Color Adjust window.
ImageQuant Utilities User’s Guide
●
p7-5
Part four Reference
7.8.2 Using the lookup tables to change the display
The Gray/Color Adjust window also provides lookup table definitions that
change the image display. These changes affect the image display, but not the
features in the utility. To use the lookup table controls, click the Edit Lookup
Table button (
). The utility replaces the scaling controls with the lookup
table controls (figure 7-4).
(a) Curve mode controls
Drag to change the
data values.
(b) Sigmoidal mode controls
Drag to
change
the Bend
algorithm.
Drag to
change
the slope.
Drag to
change the
contrast.
Drag to
change the
contrast.
Click to
select
the Curve
mode.
Click to
select the
Sigmoidal
mode.
Click to return to the
original settings.
Drag to change the
data values.
Click to return to the
original settings.
Figure 7-4. The Edit Lookup Table controls in the Gray/Color Adjust window: (a) The Curve mode controls and
(b) The Sigmoidal mode controls.
p7-6
●
ImageQuant Utilities User’s Guide
Chapter 7 View menu
You can change the image display using the following controls:
•
Bright slider—Adjusts the contrast of the image. Move the slider toward
Low to decrease the contrast. Move the slider toward High to increase
the contrast.
•
Curve button and Bend slider—Apply logarithmic, linear, and exponential
lookup table definitions to the image. Click Reset in the Mode area to
return to the default linear lookup table definition.
•
Sigmoidal button and Slope slider—Change to a sigmoidal lookup table
and alter the slope of the sigmoidal lookup table definition. Click Reset in
the Mode area to return to the default linear lookup table definition.
7.9 Map
The Map command displays the Map window, which is a smaller version of
the Image window. The Map window allows you to select a different portion
of the Image window for viewing. An outline depicts the area currently
displayed in the Image window.
To change the image display, drag the outline in the Map window. The Image
window displays the new area when you release the mouse button.
To move the Map window, move the pointer into the Map window,
SHIFT+drag the Map window to a new location.
To move the Map window outline and the image display together, CTRL+drag
the outline. The image display changes as you move the outline.
To return the Map window to the upper-left corner of the Image window—
•
Windows—Move the pointer into the Map window. Right-click and choose
Reset from the pop-up menu.
•
Macintosh—Move the pointer into the Map window. SHIFT+CTRL+click
and choose Reset from the pop-up menu.
To close the Map window, click the Map command in the View menu.
ImageQuant Utilities User’s Guide
●
p7-7
Part four Reference
7.10 Multichannel
The Multichannel command contains the display commands for multichannel
images (figure 7-5). The multichannel command and toolbar are active when
you display a multichannel image in the Image window.
Menus
Multichannel toolbar
Multichannel toolbar
(ImageQuant Tools for Windows only)
Figure 7-5. Multichannel menus and toolbar.
You can view multichannel images in the following ways:
p7-8
●
•
Overlay—Shows a composite image in which the separated images are
displayed together. Each channel appears in a different color.
•
Side by side—Displays each channel in a different section of the Image
window. Each channel appears in gray scale.
•
View one channel—Displays only the selected channel of a multichannel
image. The channel appears in gray scale.
•
View a combination of channels—Adds or removes the channels that you
select or deselect using the menu or the toolbar.
ImageQuant Utilities User’s Guide
Chapter 7 View menu
7.11 Flicker Display Channels
(ImageQuant Tools for Windows only)
The Flicker Display Channels allows you to view a multichannel image
using a flicker effect, which simulates animation. You can customize the flicker
effect by selecting an image to remain static, the images you want to use, the
order in which you want the images to flicker, and how fast you want the
images to flicker.
Section 4.9 describes this feature in detail.
7.12 Hide Objects (FluorSep only)
The Hide Objects command allows you to remove the objects from the image
temporarily. If a check mark appears next to the Hide Objects command, the
objects are hidden. Choose the Hide Objects command again to remove the
check mark and display the objects.
ImageQuant Utilities User’s Guide
●
p7-9
Chapter 8 Tools menu
The Tools menu contains—
•
•
•
•
•
•
•
•
•
Select (section 8.1)
Enlarge (ImageQuant Tools only) (section 8.2)
Reduce (ImageQuant Tools only) (section 8.3)
Zoom Area (section 8.4)
Magnifier (section 8.5)
Pan (section 8.6)
Pixel Locator (section 8.7)
Pixel Distance (section 8.8)
Define Region of Interest (ImageQuant Tools only) (section 8.9)
8.1 Select
The Select command or button allows you to end mode commands. In
FluorSep, the Select command allows you to select the objects on the image
so that you can move them.
8.2 Enlarge (ImageQuant Tools only)
The Enlarge command doubles the magnification of the image. Choose Enlarge
and then click in the area you want enlarged. The pointer position is the center
point for the enlargement. Each click doubles the magnification. Click the
Select button (
) to end the Enlarge mode.
8.3 Reduce (ImageQuant Tools only)
The Reduce command reduces the magnification of the image by half each
time you click the mouse button. Choose Reduce and then click in the area you
want reduced. The pointer position is the center point for the reduction. Click
the Select button (
) to end the Reduce mode.
ImageQuant Utilities User’s Guide
●
p8-1
Part four Reference
8.4 Zoom Area
The Zoom Area commands create a stack of enlarged images that you view
in reverse order. Choose Create Frame from the submenu, and then draw
(by dragging) a box around the area to enlarge. Repeat to create additional
frames. Choose Previous Frame from the submenu, and then click in the
Image window to display the previous frame. Continue to click in the Image
window to recall all the stored frames. After you view a stored frame, the
utility deletes the frame. Choose Reset from the submenu to delete the stored
frames without viewing them. Click the Select button (
) to end the
Zoom Area mode but leave frames for later viewing. The utility deletes the
frames when you close the Image window.
8.5 Magnifier
The Magnifier command doubles the magnification of the portion of the image
directly under the pointer. Choose Magnifier, and then move the pointer into
the Image window. The pointer turns into a magnifying glass (
). Move the
pointer to the desired area and hold down the mouse button. A box appears
displaying the enlarged portion of the Image window. Release the mouse
button to remove the box.
You can select a different area for enlargement by repositioning the pointer
and holding down the mouse button, or you can select an area by dragging
the enlargement box around the Image window. While the enlargement box
is displayed, you can increase the magnification by pressing the plus (+) key
on the numeric keypad, or you can decrease the magnification by pressing the
minus (–) key.
The status bar displays the magnification of the enlargement box. It also
displays the upper-left X,Y pixel coordinates (Pi) and the lower-right X,Y pixel
coordinates (Pf) of the enlarged area.
8.6 Pan
The Pan command moves the image in any direction. Choose Pan, and then
move the pointer into the Image window. The pointer turns into a hand. Drag
the pointer in any direction to move the image.
When the entire image is displayed in the Image window, the Pan command is
inactive.
p8-2
●
ImageQuant Utilities User’s Guide
Chapter 8 Tools menu
8.7 Pixel Locator
The Pixel Locator command displays information about the selected pixel.
Choose Pixel Locator and then move the pointer into the Image window. The
pointer turns into a cross ( ). Click the mouse button at the desired pixel
location. The pixel information appears in the status bar. The data include the
pixel coordinates (P) and the intensity value of the pixel in the measurement
units of the instrument.
To add the raw pixel value to the status bar display, CTRL+click at the desired
pixel location.
You can use the Pixel Locator and Pixel Distance commands sequentially.
Determine a pixel location using the Pixel Locator command, and then
determine the distance between two pixels using the Pixel Distance command.
Both markers are displayed in the Image window. Because the utility saves
the last value for each command, you can recall the value by selecting the
command again.
Click the Select button (
) to end the mode.
8.8 Pixel Distance
The Pixel Distance command displays the distance between two pixels. Choose
Pixel Distance and then move the pointer into the Image window. The pointer
turns into a cross ( ). Drag the pointer across the area you want to measure.
The data displayed in the status bar are the pixel coordinates of the origin pixel
(Po), the pixel coordinates of the final pixel (Pf), and the distance in millimeters
between the two points.
To add the distance in pixels to the status bar display, CTRL+drag the pointer
across the area you want to measure.
You can use the Pixel Locator and Pixel Distance commands sequentially.
Determine a pixel location using the Pixel Locator command, and then
determine the distance between two pixels using the Pixel Distance command.
Both markers are displayed in the Image window. Because the utility saves
the last value for each command, you can recall the value by selecting the
command again.
Click the Select button (
) to end the mode.
ImageQuant Utilities User’s Guide
●
p8-3
Part four Reference
8.9 Define Region of Interest
(ImageQuant Tools only)
The Define Region of Interest command allows you to specify an area of
the image to copy or crop. After you choose the Define Region of Interest
command, the pointer changes shape. Position the pointer at one corner
of the area you want to copy, and then drag the pointer until the area is
enclosed in a dashed box.
Next, you can—
p8-4
●
•
Choose the Copy Image command from the Edit menu to copy the area
and paste the copy into another application, such as Microsoft Word,
Excel, or Adobe Photoshop (section 6.1).
•
(Windows only) Choose the Copy Image Data for Excel 3D Chart
command from the Edit menu or Image toolbar to copy the pixel values
and paste them into Excel (section 4.10).
•
(Windows only) Choose the Crop Dataset command from the Edit menu
or Main toolbar to crop a multichannel (dataset) image to exclude portions
of the image that you do not want to analyze (section 4.7).
ImageQuant Utilities User’s Guide
Chapter 9 Image menu
(ImageQuant Tools only)
The Image menu contains—
•
•
•
•
Rotate Image (section 9.1)
Invert Image (section 9.2)
Impulse Filter (section 9.3)
Median Filter (section 9.4)
9.1 Rotate Image
The Rotate Image command allows you to rotate, flip, or rotate and
flip the image. See sections 4.2 and 4.3 for a complete description of the
Rotate Image command.
9.2 Invert Image
The Invert Image command allows you to invert the pixel values in the image.
Inverting the pixel values changes a black background to white. See section 4.4
for a complete description of the Invert Image command.
9.3 Impulse Filter
The Impulse Filter command allows you to remove the background noise
from the image. See section 4.5 for a complete description of the Impulse Filter
command.
9.4 Median Filter
The Median Filter command allows you to remove bright noise spikes from
the image. See section 4.6 for a complete description of the Median Filter
command.
ImageQuant Utilities User’s Guide
●
p9-1
Chapter 10 Window menu
The Window menu contains—
•
•
•
•
•
Cascade (section 10.1)
Tile Horizontal (section 10.2)
Tile Vertical (section 10.3)
Close All (section 10.4)
List of open windows (section 10.5)
10.1 Cascade
The Cascade command overlaps multiple windows. The title bar for each
window is displayed and accessible. To bring a window to the top of the stack,
click anywhere in the window.
10.2 Tile Horizontal
The Tile Horizontal command displays all the windows horizontally. The
windows are reduced to fit the tiled arrangement.
10.3 Tile Vertical
The Tile Vertical command displays all the windows vertically. The windows
are reduced to fit the tiled arrangement.
10.4 Close All
The Close All command closes all open windows. You are prompted to save
changes to the files.
10.5 List of open windows
A list of the open windows appears at the bottom of the menu. You can select
a file name from the list and bring the window to the front if it is hidden or
difficult to locate.
ImageQuant Utilities User’s Guide
●
p10-1
Chapter 11 Help menu
The Help menu contains—
•
•
•
•
•
•
Index (FluorSep and ImageQuant Tools for Macintosh only)
(section 11.1)
Using Help (FluorSep and ImageQuant Tools for Macintosh only)
(section 11.2)
User’s Guide (ImageQuant Tools for Windows only) (figure 11.3)
Molecular Dynamics Home Page (section 11.4)
About FluorSep (section 11.5)
About ImageQuant Tools (section 11.6)
11.1 Index (FluorSep and ImageQuant Tools for
Macintosh only)
The Index command opens a Help window containing a list of topics.
Reference material is provided for each topic. Click the desired topic to
access the reference material.
11.2 Using Help (FluorSep and ImageQuant Tools for
Macintosh only)
The Using Help command provides tips on how to use Help.
11.3 User’s Guide
(ImageQuant Tools for Windows only)
The User’s Guide command allows you to view an electronic (.pdf format)
version of the ImageQuant Utilities User’s Guide. To view the guide, you
need the Adobe™ Acrobat™ Reader software, which is included on the
IQ Solutions CD.
11.4 Molecular Dynamics Home Page
If your ImageQuant workstation contains an Internet connection, you can
use the Molecular Dynamics Home Page command to go directly to the
Molecular Dynamics Home Page (www.mdyn.com).
ImageQuant Utilities User’s Guide
●
p11-1
Part four Reference
11.5 About FluorSep
The About FluorSep command displays the version number of the FluorSep
software you are using and displays copyright information.
Note: The About FluorSep command on a Macintosh computer is located in
the Apple menu.
11.6 About ImageQuant Tools
The About ImageQuant Tools command displays the version number of the
ImageQuant Tools software you are using and displays copyright information.
Note: The About ImageQuant Tools command on a Macintosh computer is
located in the Apple menu.
p11-2
●
ImageQuant Utilities User’s Guide
Part five
Appendixes
Appendix A Quick reference for
Windows
This appendix provides a quick reference for the Windows version of
IQ Tools and FluorSep. The topics in this appendix are—
•
•
•
•
•
Keyboard shortcuts (section A.1)
Mouse/key combinations (section A.2)
Toolbar functions for FluorSep (section A.3)
Toolbar functions for ImageQuant Tools (section A.4)
Extensions that identify file types (section A.5)
A.1 Keyboard shortcuts
Menu
Key
Function
File menu
CTRL+O
Open
SHIFT+F2
Image Properties
Edit menu
(ImageQuant Tools Only)
CTRL+SHIFT+C
Copy Image
View menu
F9
Zoom In
SHIFT+F9
Zoom Out
F8
Gray/Color Adjust
CTRL+1
Multichannel/Channel 1
CTRL+2
Multichannel/Channel 2
CTRL+3
Multichannel/Channel 3
CTRL+4
Multichannel/Channel 4
CTRL+SHIFT+S
Select
CTRL+R
Define Region of Interest
F5
Cascade
SHIFT+F5
Tile
Tools menu
Window menu
ImageQuant Utilities User’s Guide
●
pA-1
Part five Appendixes
A.2 Mouse/key combinations
Image window
Magnification
Map window
pA-2
●
ImageQuant Utilities User’s Guide
Mouse/key
Function
Mouse
Pull-down menus
Drag
Commands
Click
Toolbars
Click
Activate window
Right mouse
Pop-up menus
CTRL+click
Switch between Enlarge and
Reduce modes
Mouse+keypad plus
Enlarge while in Magnifier mode
Mouse+keypad minus
Reduce while in Magnifier mode
SHIFT+click
Move Map window
CTRL+click
Move Map window in sync with
Image window
Appendix A Quick reference for Windows
A.3 Toolbar functions for FluorSep
Main toolbar
Multichannel toolbar
View One Channel
Help
Open
Overlay
Side by Side
Channel 4
Channel 3
Channel 2
Channel 1
Image toolbar
Define Region of Interest
Gray/Color Adjust
Map
Fit to Window
Magnifier
Previous Frame
Create Frame
Pixel Distance
Pixel Locator
Select
Pan
ImageQuant Utilities User’s Guide
●
pA-3
Part five Appendixes
A.4 Toolbar functions for ImageQuant Tools
Main toolbar
Multichannel toolbar
View One Channel
Copy Select Region
of Non-Overlay Image
for Excel 3D Charting
Flicker Between
Displayed Channels
Help
Export Individual Gel Files From Dataset
to the Selected Folder
Overlay
Side by Side
Open
Channel 4
Channel 3
Channel 2
Channel 1
Image toolbar
Define Region of Interest
Crop Current Dataset
Undo Cropping and Restore
to Previous Size
Gray/Color Adjust
Map
Fit Image to Window
Magnifier
Previous Frame
Create Frame
Pixel Distance
Pixel Locator
Select
Pan
pA-4
●
ImageQuant Utilities User’s Guide
Appendix A Quick reference for Windows
A.5 Extensions that identify file types
The following extensions identify the types of files ImageQuant Tools and
FluorSep create:
.dir
Identifies the folder associated with an image dataset and contains
the image file and the object file for that dataset. Multichannel image
datasets contain an image file and an object file for each channel.
The dataset folder also contains a copy of the dataset file, which
you can use if you accidentally delete the original dataset file.
.ds
Identifies an image dataset. Each dataset file has an associated
dataset folder.
.dox
Identifies a file containing image objects.
.gel
Identifies a single image created on an Amersham Biosciences
instrument.
ImageQuant Utilities User’s Guide
●
pA-5
Appendix B Quick reference for
Macintosh
This appendix provides a quick reference for the Macintosh version of
IQ Tools and FluorSep. The topics in this appendix are—
•
•
•
•
Keyboard shortcuts (section B.1)
Mouse/key combinations (section B.2)
Toolbar functions (section B.3)
Icons that identify file types (section B.4)
B.1 Keyboard shortcuts
Menu
File menu
Key
Function
O
Open
SHIFT+F2
Edit menu
(ImageQuant Tools Only)
View menu
Tools menu
Window menu
Image Properties
Q
Quit
C
Copy Image
F9
Zoom In
SHIFT+F9
Zoom Out
F8
Gray/Color Adjust
CTRL+1
Multichannel/Channel 1
CTRL+2
Multichannel/Channel 2
CTRL+3
Multichannel/Channel 3
CTRL+4
Multichannel/Channel 4
CTRL+S
Select
CTRL+R
Define Region of Interest
F5
Cascade
SHIFT+F5
Tile
ImageQuant Utilities User’s Guide
●
pB-1
Part five Appendixes
B.2 Mouse/key combinations
Image window
Magnification
Map window
pB-2
●
ImageQuant Utilities User’s Guide
Mouse/key
Function
Mouse
Pull-down menus
Drag
Commands
Click
Toolbars
Click
Activate window
SHIFT+CTRL+mouse
Pop-up menus
CTRL+click
Switch between Enlarge and
Reduce modes
Mouse+keypad plus
Enlarge while in Magnifier mode
Mouse+keypad minus
Reduce while in Magnifier mode
SHIFT+click
Move Map window
CTRL+click
Move Map window in sync with
Image window
Appendix B Quick reference for Macintosh
B.3 Toolbar functions
Main toolbar
Multichannel toolbar
View One Channel
Help
Open
Overlay
Side by Side
Channel 4
Channel 3
Channel 2
Channel 1
Image toolbar
Define Region of Interest
Gray/Color Adjust
Map
Fit to Window
Magnifier
Previous Frame
Create Frame
Pixel Distance
Pixel Locator
Select
Pan
ImageQuant Utilities User’s Guide
●
pB-3
Part five Appendixes
B.4 Icons that identify file types
The following icons identify the types of files ImageQuant Tools and
FluorSep create:
Identifies the folder associated with an image dataset and contains
the image file and the object file for that dataset. Multichannel image
datasets contain an image file and an object file for each channel.
The dataset folder also contains a copy of the dataset file, which
you can use if you accidentally delete the original dataset file.
Identifies an image dataset. Each dataset file has an associated
dataset folder.
Identifies a file containing image objects.
Identifies a single image created on an Amersham Biosciences
instrument.
Identifies a single image file that has been converted to an 8-bit TIFF
format. An 8-bit image can be stored in or transferred to another
application.
pB-4
●
ImageQuant Utilities User’s Guide
Index
3D charting 4-14
A
About FluorSep command 11-2
About ImageQuant Tools command 11-2
Actual Size command 7-2
anti-alias, use with rotate 4-3
audit trail, checking 1-2
B
background correction method
automatic 2-4
manual 2-5
selecting 2-3
background uniformity, determine 2-4
Build Dataset command 5-1
C
Cascade command 10-1
charting in Excel 4-14
Close All command 10-1
Close command 5-1
copy data for 3D charting 4-14
Copy Image command 6-1
Copy Image Data for Excel 3D Chart command 6-1
Crop Dataset command 6-2
crop multichannel images 4-8
D
data values, invert using ImageQuant Tools 4-4
Define Region of Interest command 8-4
DS Builder
creating images for use with 3-1
separated image files, using 3-3
single images, using 3-1
window 3-2
ImageQuant Utilities User’s Guide
●
Index-1
Index
E
Edit menu
Copy Image command 6-1
Copy Image Data for Excel 3D Chart
command 6-1
Crop Dataset command 6-2
Undo Crop Dataset command 6-2
Enlarge command 8-1
Exit command 5-5
Export Gel Files From Dataset to Folder command
5-3
export multichannel image as individual images
4-10
F
File Info tab in Image Properties window 5-3
File menu
Build Dataset command 5-1
Close command 5-1
Exit command 5-5
Export Gel Files From Dataset to Folder
command 5-3
Image Properties command 5-3
most recently used list 5-5
Open command 5-1
Quit command 5-5
Save As command 5-2
Save Cropped Dataset over Original command
5-2
Save Region of Interest As command 5-2
Find Fluors, using in FluorSep 2-7
Fit to Window command 7-2
Flicker Display Channel command 7-9
flicker effect 4-11
FluorImager 1-1
Fluorochrome Separation window 2-3
Index-2
●
ImageQuant Utilities User’s Guide
FluorSep
automatic background correction method 2-4
background correction methods 2-3
description of 2-1
determine background uniformity 2-4
displaying an image 2-3
DS Builder 3-1
effects of using background filter 2-15
evalute results 2-14
Find Fluors 2-7
fluorochrome markers 2-4
Fluorochrome Separation window 2-3
global background correction filter 2-15
impulse filter, using 2-16
local background correction filter 2-14
locating background rectangles 2-10
locating fluorochrome marker rectangles 2-7
manual background correction method 2-5
overview 1-1
performing separation 2-13
sizing and centering rectangles 2-9
Undo Separation button 2-14
G
global background correction filter, in FluorSep 2-15
Gray/Color Adjust command 7-3
Gray/Color Adjust window
changing display values 7-4
description 7-3
using the lookup tables 7-6
H
Help menu
About FluorSep command 11-2
About ImageQuant Tools command 11-2
Index command 11-1
Molecular Dynamics Home Page command
11-1
User’s Guide command 11-1
Using Help command 11-1
Index
Hide Objects command 7-9
History tab in Image Properties window 1-2, 5-4
I
Image menu
Impulse Filter command 9-1
Invert Image command 9-1
Median Filter command 9-1
Rotate Image command 9-1
Image Properties command 5-3
Image Properties window
File Info tab 5-3
History tab 5-4
Scan Info tab 5-4
Image Properties, audit trail 1-2
Image Rotation window, in ImageQuant Tools 4-2
ImageQuant Tools
3D charting 4-14
copy image for publication 6-1
crop multichannel image 4-7
export multichannel image as individual
images 4-10
flicker effect on multichannel image 4-11
Image Rotation window 4-2
image, displaying in 4-1
impulse filter 4-5
Impulse Filter window 4-6
invert data values 4-4
median filter 4-6
Median Filter window 4-7
overview 1-2
rotate image 1° to 15° 4-3
rotate image 90° 4-2
rotate using anti-alias feature 4-3
uncrop multichannel image 4-7
Impulse Filter command 9-1
impulse filter in ImageQuant Tools 4-5
Impulse Filter window in ImageQuant Tools 4-6
impulse filter, in FluorSep 2-16
Index command 11-1
Invert Image command 9-1
K
keyboard shortcuts
Macintosh B-1
L
list of open windows 10-1
local background correction filter, in FluorSep 2-14
lookup tables in Gray/Color Adjust window 7-6
M
Macintosh, keyboard shortcuts B-1
Magnification command 7-2
Magnifier command 8-2
Map command 7-7
Median Filter command 9-1
median filter in ImageQuant Tools 4-6
Median Filter window in ImageQuant Tools 4-7
menu
Edit 6-1
File 5-1
Help 11-1
Image 9-1
Tools 8-1
View 7-1
Window 10-1
Molecular Dynamics Home Page command 11-1
most recently used list in File menu 5-5
Multichannel command 7-8
multichannel image
3D charting 4-14
crop 4-8
export as individual images 4-10
save cropped image 4-10
uncrop 4-10
using flicker effect 4-11
view one channel 7-8
view overlaid 7-8
view selected channels 7-8
view side-by-side 7-8
ImageQuant Utilities User’s Guide
●
Index-3
Index
Multichannel submenu
Overlay command 7-8
Side by Side command 7-8
view combination of channels 7-8
view one channel 7-8
O
Open command 5-1
Overlay command 7-8
P
Pan command 8-2
Pixel Distance command 8-3
Pixel Locator command 8-3
Q
Quit command 5-5
R
Reduce command 8-1
Rotate Image command 9-1
Tools menu
Define Region of Interest command 8-4
Enlarge command 8-1
Magnifier command 8-2
Pan command 8-2
Pixel Distance command 8-3
Pixel Locator command 8-3
Reduce command 8-1
Select command 8-1
Zoom Area command 8-2
Typhoon 1-1
U
uncrop multichannel image 4-10
Undo Crop Dataset command 6-2
Undo Separation button in FluorSep 2-14
User’s Guide command 11-1
Using Help command 11-1
V
Save As command 5-2
Save Cropped Dataset over Original command 5-2
save cropped multichannel images 4-10
Save Region of Interest As command 5-2
Scan Info tab in Image Properties window 5-4
Select command 8-1
Side by Side command 7-8
Status Bar command 7-2
Storm 860 1-1
View menu
Actual Size command 7-2
Fit to Window command 7-2
Flicker Display Channel command 7-9
Gray/Color Adjust command 7-3
Hide Objects command 7-9
Magnification command 7-2
Map command 7-7
Multichannel command 7-8
Toolbars command 7-1
View Status Bar command 7-2
Zoom 7-2
T
W
Tile Horizontal command 10-1
Tile Vertical command 10-1
Toolbar Configuration window 7-1
Toolbars command 7-1
Web site connection 11-1
Window menu
Cascade command 10-1
Close All command 10-1
list of open windows 10-1
Tile Horizontal command 10-1
Tile Vertical command 10-1
S
Index-4
●
ImageQuant Utilities User’s Guide
Index
Z
Zoom Area command 8-2
Zoom Area submenu
Create Frame command 8-2
Previous command 8-2
Reset command 8-2
Zoom In command 7-2
Zoom Out command 7-3
ImageQuant Utilities User’s Guide
●
Index-5