1
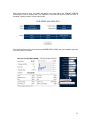
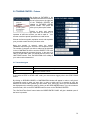
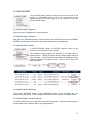
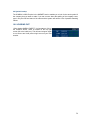
HLC
OHLC
Candlestick
Area
Bar Charts
Dot
Close
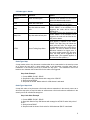
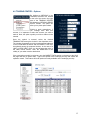
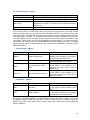
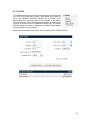
High-Low-Close; This is a vertical bar type chart displaying the price variations for
the covered period. You will also see a horizontal bar representing the last closing
price for that period.
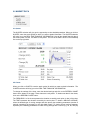
Open-High-Low-Close; This is a vertical bar type chart displaying the price
variations for the covered period. You will also see two horizontal bars. The left
one is the opening price of the period and the right one is the closing price of the
period.
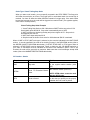
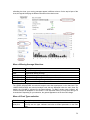
This chart type is represented by colour sticks (candles) and vertical lines at each
extremity. The candlesticks represent the difference between the opening and
closing of the period; the vertical lines are the high and low of the period. The
white candlesticks mean that the period is a high whereas the blue candlesticks
mean that the period is a low.
This chart type displays the information for the closing periods connecting various
data points.
The values in this chart type are represented by rectangular bars.
The closing prices of each period is represented by a dot.
The closing prices of each period is connected to each other with a line.
Logarithmic This is the same chart type as the OHLC but this one puts more
weight on the recent data
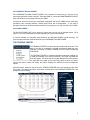
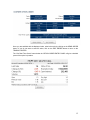
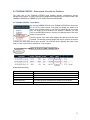
In the QUOTES AND CHARTS page, if you select OPTIONS, the option chain for the stock in
question will be obtained. The information is not dynamic, you can see the timestamp on the top
right hand corner. On the top of the option chain, the real time quote of the underlying asset is
found.
9.3 Options Chain
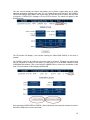
To obtain the option chains, enter the stock symbol. In the right drop-down menu, select the desired
option.
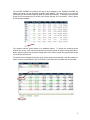
The option chains are separated by expiry date. Thus, it is important to start by selecting the
expiration month in the FOR drop-down menu. By clicking on the SUBMIT button, the option chain
you want will appear. Select the SHOW drop-down menu to view only the calls, puts or both of
them together. If the CHART checkbox is checked, it will show a chart displaying the evolution of
the stock during the current day.
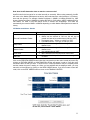
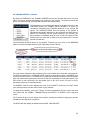
When viewing both calls and puts in the menu, the calls will be on the left side and the puts will be
on the right side of the screen. In between them is a dark column, this shows the different strike
prices available for the expiration of that month. For each available strike price, on each call or put
side, you will see a TRADE button, the SYMBOL of the option and the quotation information of the
option. You can also see if the option is in-the-money or out-of-the-money. The in-the-money
information is presented on a light gray surface whereas the out-of-the-money information is shown
on a white surface. The in-the-money and out-of-the-money blocks are separated with a dark grey
line showing the last traded price of the underlying asset.
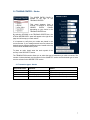
By clicking on the TRADE button, the OPTION ORDER ENTRY PANEL will appear. The option
symbol is entered automatically. Otherwise, it can be entered manually in the TRADING CENTER
or in the OPTIONS section in the TRADING menu.
The option quotes are similar to the stock quotes. Available is the last traded price, the change
since the last closing and also the number of contracts traded during the day. The buyers and
sellers are represented by the showing bid and ask. The INTEREST column displays the actual
number of open contracts on the markets for this particular option.
25