1
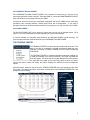
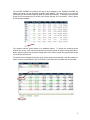
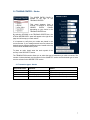
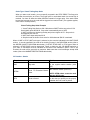
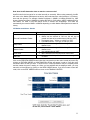
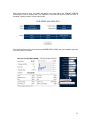
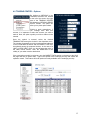
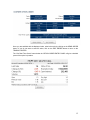
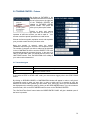
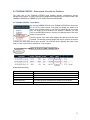
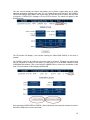
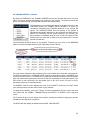
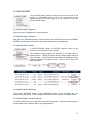
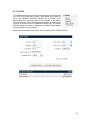
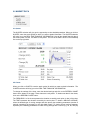
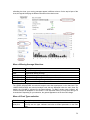
User Manual
January, 2006
Version 1.0
1.0 LOGIN_______________________________________________________________________________________3
User Agreements ________________________________________________________________________________3
2.0 BALANCES __________________________________________________________________________________4
2.1 CASH BALANCE __________________________________________________________________________ 4
2.2 MARKET VALUE___________________________________________________________________________ 4
2.3 TOTAL EQUITY____________________________________________________________________________ 4
2.4 MAINTENANCE EXCESS ____________________________________________________________________ 4
2.5 OVERNIGHT BUYING POWER _______________________________________________________________ 5
2.6 BUYING POWER___________________________________________________________________________ 5
3.0 TRADING CENTER – Stocks ____________________________________________________________________7
3.1 Transaction types - Stocks __________________________________________________________________ 7
3.2 Order types - Stocks _______________________________________________________________________ 8
3.3 Duration - Stocks __________________________________________________________________________ 9
3.4 Route Choices ___________________________________________________________________________
3.4.1 Route: AUTO _________________________________________________________________________
3.4.2 Route: INET __________________________________________________________________________
3.4.3 Route: ARCA _________________________________________________________________________
10
10
10
10
3.5 Market restrictions - Stocks ________________________________________________________________ 11
4.0 TRADING CENTER – Options __________________________________________________________________13
4.1 Transaction types - Options ________________________________________________________________ 14
4.2 Order types - Options _____________________________________________________________________ 14
4.3 Duration – Options________________________________________________________________________ 14
5.0 TRADING CENTER – Futures___________________________________________________________________16
5.1 Transaction types ________________________________________________________________________ 16
6.0 TRADING CENTER – Order status, Executions, Positions ___________________________________________17
6.1 TRADING CENTER - Order Status ___________________________________________________________ 17
6.2 TRADING CENTER - Executions ____________________________________________________________ 19
6.4 TRADING CENTER - Positions______________________________________________________________ 20
7.0 YOUR ACCOUNT_____________________________________________________________________________21
7.1 YOUR ACCOUNT - Balances________________________________________________________________ 21
7.3 YOUR ACCOUNT - History _________________________________________________________________ 21
7.4 YOUR ACCOUNT - Messages _______________________________________________________________ 21
7.5 YOUR ACCOUNT – Account Settings ________________________________________________________ 21
8.0 TRADING ___________________________________________________________________________________22
9.0 MARKET DATA ______________________________________________________________________________23
9.1 Quotes__________________________________________________________________________________ 23
9.2 Charts __________________________________________________________________________________ 23
9.3 Options Chain____________________________________________________________________________ 25
9.4 Symbol Lookup __________________________________________________________________________ 26
10.0 LOGGING OUT _____________________________________________________________________________26
2
1.0 LOGIN
To access your Karoll Direct account, go to http://www.traderlogin.com/karoll/, where you will find
Karoll Direct’s main page.
Once the access page is displayed, your USER ID and PASSWORD will be required. Enter the
corresponding information and click on LOGIN. The account BALANCE information will appear
once you have successfully logged in.
Possible problems and solutions:
If you are unable to access your account, it is important to verify that you are at the correct URL link
(you may be on the demo site). The correct URL link displayed on the browser address bar should
be: https://www.pentrader.net/webtrader
If you are already at the correct URL link, the problem may be associated to MS Explorer Auto
Complete settings. This function can be deactivated by going to the TOOLS menu of your browser
and then selecting INTERNET OPTIONS. An option window will appear. Click on the CONTENT
tab and click on AUTOCOMPLETE in the Personal Information section. Simply remove the stored
passwords by clicking on CLEAR PASSWORDS. Now try logging on again.
User Agreements
Upon your first visit to your account, certain User Agreements for various markets and
organizations may be displayed. These documents must be accepted in order to use Karoll Direct.
Please read them and fill-in the required sections. Certain documents will require check marks, your
initials or your entire name. Once these forms are completed, you will have access to your account
BALANCE.
3
2.0 BALANCES
When accessing your account, by default, you will land on the BALANCE page. This page displays
your account’s portfolio balance in USD dollars as well as all new messages sent to you. To view
new messages click on “view messages”.
The BALANCE is also accessible from the left hand side menu of the page under the YOUR
ACCOUNT section. If you manage more than one account, the desired account BALANCE can be
selected by using the drop-down menu on the top of the page.
The items that make up the BALANCE page are as follows:
2.1 CASH BALANCE
In the BALANCE section, the first row represents the CASH BALANCE of your account according
to the most recent closing date (the date on top of the table).
2.2 MARKET VALUE
The second row shows you the MARKET VALUE of the securities you possess according to the
most recent closing date (the date on top of the table. The evaluation of the securities is done via a
conservative method using the last closing bid price.
2.3 TOTAL EQUITY
The third row shows you the TOTAL EQUITY VALUE of your account. This number represents the
sum of the cash and market value of the positions, MINUS any debit balance in the account, as of
the last closing date of the markets.
2.4 MAINTENANCE EXCESS
The MAINTENANCE EXCESS is based on the market value and cash balance of your margin
account. A portion of the market value of the stock you possess will be eligible for margin. When
your MAINTENANCE EXCESS is showing as negative you will have a margin call and
subsequently will have 0 BUYING POWER.
4
2.5 OVERNIGHT BUYING POWER
The OVERNIGHT BUYING POWER (“ONBP”) is the amount of money that you may use to buy
new margin positions to hold overnight. Generally ONBP is 2 times the MAINTENANCE EXCESS.
Each new position you purchase uses up your ONBP.
If stocks are above $5.00 they are considered marginable and the full ONBP can be used when
purchasing new overnight positions. Stocks below $5.00 are non-marginable. If you want to
purchase and hold a new stock position under $5.00 overnight you can only use half of your ONBP.
2.6 BUYING POWER
The BUYING POWER (“BP”) is the amount of money that you may use to daytrade stocks. BP is
equal to 1 to 4 times maintenance excess depending on your account settings.
A common mistake is to purchase stock based on your BUYING POWER to hold overnight. All
new overnight purchases must be based off your OVERNIGHT BUYING POWER.
THE TRADING CENTER
The TRADING CENTER is found at the top left hand side of the site. This
page of the site is composed of several sub-sections within the box:
STOCKS, OPTIONS, FUTURES, ORDER STATUS, EXECUTIONS and
POSITIONS.
The TRADING CENTER is composed of different elements enabling you
to trade and manage your account efficiently. This page is divided into
three sub-pages. The upper part of the page displays the market quotes,
the right part of the page is the order entry panel to place your stock,
futures and option orders and finally, the bottom displays the different account management
options.
Choosing stocks, options or futures from the TRADING CENTER menu will change the right order
entry panel. Choosing order status, executions or positions from the TRADING CENTER menu will
change the bottom display.
5
The QUOTES SCREEN is located at the top of each sub-page in the TRADING CENTER. By
default, this panel is a non-streaming, snapshot quote window. This will provide you a real-time
quote when you first load the page but does not update automatically. To change or add a symbol
simply click in the symbol box on the left of the screen and type in a new symbol. There is space
for ten symbols available.
The dynamic real-time quote feature is an additional feature. To access the streaming quote
window click on the “Java” button at the bottom of the quote window as shown in the graphic above.
When using this feature the quotes will change without the need to refresh the page and will always
be real-time market quotes.
The quotes can be changed by clicking on an existing symbol and replacing it with the symbol you
wish to consult. It is important to click on ENTER on your keyboard to complete the entry process.
6
3.0 TRADING CENTER – Stocks
The ORDER ENTRY PANEL is
located to the right of the
TRADING CENTER.
This panel changes from a
STOCK, FUTURES or OPTION
ORDER
ENTRY
PANEL
depending on your choice in the
TRADING CENTER box.
By selecting STOCKS in the TRADING CENTER box, the
STOCK ORDER ENTRY panel will appear to the right of the
page and will accept your stock orders.
It is important to verify that your orders are placed in the
correct account. If you manage several accounts, select the
desired account from the drop-down menu located at the top
of the STOCK ORDER ENTRY panel.
To place an order, simply enter the stock symbol of the
security in the SECURITY section.
The TRANSACTION section allows you to select the type of transaction you wish to execute. The
number of shares desired must be entered in the QUANTITY section and the desired type of order
must be selected in the ORDER TYPE section.
3.1 Transaction types - Stocks
Drop-down menu
Buy
Sell
Short
Cover
Definition
Buy
Sell
Short Selling
Cover a Stock Position
Details
Buy stock
Sell stock that you posses
Sell stock that you do not posses
Buy back the stocks that you shorted
7
3.2 Order types - Stocks
Drop-down menu
Definition
Market
Order at market price
Limit
Order with a limit price
Stop
Stop loss order at market
price
Stop Limit
Stop loss order at limit price
VTSO
Virtual Trailing Stop Order
Details
This order will be filled at the best
possible price available on the market
at the time that the order is sent.
This order will not be filled if it does not
reach the specified price or better.
This order will not be triggered if the
“STOP PRICE” is not reached. If it is
triggered, the order will be filled at
market price.
This order will not be triggered if the
“STOP PRICE” is not reached. If it is
triggered, the order will be filled at the
limit price or better.
When you want to sell a stock, you
must specify a spread in the STOP
PRICE. The Stop price will follow the
stock price as it rises. The trigger price
is recalculated each time a new high is
reached. You have to define the dollar
difference instead of a trigger price. If
the stock trades beyond the last stop
price, the order will be triggered as a
market order. (The opposite applies, in
the case of a short position.)
Order Type: Stop
A stop market order to buy becomes a market order when a transaction in the security occurs
at or above the stop price; a stop market order to sell becomes a market order when a
transaction in the security occurs at or below the stop price. The transaction must occur
between at or between the bid and offer for the order to be triggered.
Stop Order Example
1. Current NBBO- $19.85 - $20.05
2. Stop Order to Buy 1000 shares with a stop price of $20.07
3. Stock prints at $20.08
4. Stop order is elected. Market order for 1000 shares is activated.
Order Type: Stop-Limit
A stop limit order to buy becomes a limit order when a transaction in the security occurs at or
above the stop price; a stop limit order to sell becomes a limit order when a transaction in the
security occurs at or below the stop price
Stop Limit Order Example
1. Current NBBO- $19.85 - $20.05
2. Stop Limit Order to Buy 1000 shares with a stop price of $20.07 and a limit price of
20.07
3. Stock prints at $20.07
4. Stop limit order is elected. Limit order for 1000 shares at $20.07 is activated.
8
Order Type: Virtual Trailing Stop Order
When you want to sell a stock, you must specify a spread in the STOP PRICE. The Stop price
will follow the stock price as it rises. The trigger price is recalculated each time a new high is
reached. You have to define the dollar difference instead of a trigger price. If the stock trades
beyond the last stop price, the order will be triggered as a market order. (The opposite applies,
in the case of a short position.)
Virtual Trailing Stop Order Example
1. Virtual Trailing Stop Order to Sell 1000 shares of MSFT with a stop price of 0.50.
Stock initially prints at $20.05. Stop order is automatically set at 19.55
2. MSFT continues to rise during the day and prints a high at 20.75. Stop order is
automatically set at 20.25
3. MSFT then drops and prints 20.25
4. Stop limit order is elected. Limit order for 1000 shares at $20.25 is activated.
When a LIMIT or STOP LIMIT order type is selected, a price must be indicated in the LIMIT PRICE
section. It must be specified if the order is for the day or longer in the DURATION section (refer to
the ORDER VALIDITY DURATION table below). If a STOP, STOP LIMIT or VTSO type of order is
selected, a STOP PRICE must be determined. Finally, to apply the ALL OR NONE restriction to
your order, a checkmark must be indicated on the AON in the transaction panel. If this is not
checked, the order will be sent with no restriction. Make note that not all exchanges accept AON
orders (refer to the MARKET RESTRICTIONS table below).
3.3 Duration - Stocks
Drop-down menu
Definition
DAY
Day order
GTEM
Good 'Till Extended Market
Order
GTC
Good to Cancel
Details
This order is cancelled at market close
of the regular market session (4:00
EST)
This order is cancelled at the end of the
after markets session (8:00 EST).
NOTE: GTEM orders cannot be used
with the AUTO route.
This order remains open until cancelled
on the date you specify on the pop-up
calendar when the order is placed.
9
ROUTE
3.4 Route Choices
You have three choices on how your stock order is routed to the market place – AUTO, ARCA ECN
and INET ECN (formally ISLAND / INCA ECN).
An ECN (Electronic Communication Network) is an electronic system that brings buyers and sellers
together for the electronic execution of trades. It disseminates information to interested parties
about the orders entered into the network and allows these orders to be executed
3.4.1 Route: AUTO
Trading Hours – 9:30 a.m. to 4:00 p.m. EST
The AUTO route is a smart routing system that sends your order to market through an ECN or
market marker depending on the order type and market. This route can be used for all OTC,
OTCBB and listed securities. This route is only accessible during regular market hours. Any trades
placed after the regular market hours using the AUTO route will be rejected. Use either ARCA or
INET for after-hours trades.
3.4.2 Route: INET
Trading Hours – 9:30 a.m. to 4:00 p.m. EST
Pre-Market Trading Hours – 8:00 a.m. to 9:30 a.m. EST
Post-Market Trading Hours – 4:00 p.m. to 8:00 p.m. EST
About: In 2002 the largest US ECN (Instinet) purchased the second largest US ECN (Island).
These two ECNs have been merged to create the INET ECN. Orders through INET are only
matched against other INET orders and are not sent to other pools of liquidity for executions. INET
is known for its liquidity and speed. Generally an order matching on the INET book will be faster
than an ARCA or AUTO smart routing order.
Size: INET handles approximately 25% of Nasdaq (OTC) orders. In several securities, such as the
QQQs, INET regularly represents over 30% of all orders.
3.4.3 Route: ARCA
Trading Hours – 9:30 a.m. to 4:00 p.m. EST
Pre-Market Trading Hours – 8:00 a.m. to 9:30 a.m. EST
Post-Market Trading Hours – 4:00 p.m. to 8:00 p.m. EST
Archipelago (ArcaEx)
About: The ArcaEx exchange features a trading system that searches for the best execution for
each order. ArcaEx has an internal order book (ARCA book). If orders are not matched on the
internal order book they are routed to other pools of liquidity (ECNs, Market Makers, etc) for
execution. ArcaEx is the first totally open, fully electronic stock exchange to trade in all NYSE,
Nasdaq, AMEX and Pacific Exchange securities. ARCA is known for its liquidity and smart routing
ability.
Size: ArcaEx handles approximately 20-25% of Nasdaq (OTC) orders. In early 2004 ArcaEx
averaged over 100 million listed shares daily.
10
How does ArcaEx determine when to match or route an order?
ArcaEx looks for the best price for an order internally or externally. When routing externally, ArcaEx
will route to the Market Participant that has the best order/execution ratio (based on % fill history,
time and size shown). For example: Market Participant 1 (MMID1) is bidding $50.625 for 1000
shares. Market Participant 2 (MMID2) is bidding $50.625 for 1000 shares. ARCA is bidding $50 for
500 shares. An order to sell 500 shares at 50 is entered into Archipelago. This order will
automatically be routed to MMID1 or MMID2 depending on which Market Participant has a better fill
history.
3.5 Market restrictions - Stocks
Orders
Pre and Post Market Trades
Stop Orders
Market Orders
All or None
Odd Lots
Restrictions
• Only available through the ARCA and INET routes
• Orders can be entered at 7:30 a.m. but will not be
posted until start of pre-market hours (8:00 a.m. EST).
• Pre-Market Hours – 8:00 a.m. to 9:30 a.m. EST
• Post-Market Hours – 4:00 p.m. to 8:00 p.m. EST
• Only available through ARCA during Pre and Post
Market Hours
• Only available through ARCA during Pre and Post
Market Hours
• Not available through INET
• INET and ARCA do not except all or none orders.
• Orders not divisible by 100 must be traded through INET
or ARCA.
Click on the PREVIEW ORDER button below the entry panel once the order is ready to be sent. By
clicking on PREVIEW ORDER, a CONFIRMATION window will appear in order to verify the order
and ensure that it is what you want. To avoid errors, it is also important to verify the company name
and the market the stock is trading on. When you are satisfied with the displayed order, you may
transmit it to Karoll Direct by clicking on the SEND ORDER button. If you do not want to send the
order, click on the EDIT ORDER button to return to the TRADING CENTER.
11
After having sent your order, a message will appear in the lower part of the TRADING CENTER
confirming the order is properly sent. It is important to note that this does not mean the order is
accepted, it simply means it is sent to the market.
The “Get Real-Time Quote” button below the ORDER ENTRY PANEL will give a detailed quote and
chart of the stock in question.
12
4.0 TRADING CENTER – Options
By clicking on OPTIONS in the
TRADING CENTER box located
to the left of the screen, the right
part of the TRADING CENTER
will change to OPTIONS ORDER
ENTRY PANEL. This panel will
allow you to place option orders.
Similar to stock transactions, if
you manage more than one
account, it is important to select the account you wish to
trade in. Next, the option symbol you wish to trade must be
entered.
Once the symbol is entered, select the desired
TRANSACTION among the choices in the dropdown menu.
The number of contracts you wish to trade must be indicated
in the # CONTRACTS section and the ORDER TYPE must
be selected among the proposed choices. In the case of a
LIMIT or STOP LIMIT order, you should enter the price in
the LIMIT PRICE section. Then, the DURATION of the
validity of your order must be determined.
If the exact option symbol is not known, go to the MARKET DATA section on the menu to the left of
the page and click on option chain. Type in the symbol of the underlying security and choose the
expiration month. This feature will list all options currently available on the underlying security.
13
4.1 Transaction types - Options
Drop-down menu choice
Details
Buy to Open
Buy order of an option contract that you do not possess.
Sell order of an option contract that you presently possess.
Sell order of an option contract that you do not possess. This
transaction can either be covered by the equivalent underlying
asset or not.
Buy back an option contract that you sold without possessing it.
Sell to Close
Sell to Open
Buy to Close
If you select a STOP or STOP LIMIT order, you must enter a trigger price in the STOP PRICE
section. Just like stocks, you can apply the ALL OR NONE restriction if you wish to. Finally, take
note that the SELL TO OPEN orders are sent to the system as being covered transactions with the
underlying assets. Therefore, it is important to assure that the equity is available to be granted to
cover the position. No open sell orders should be active on these stocks (this includes stop or stop
limit orders). These shares must not be allocated for other transactions. If you wish to send an
uncovered order (naked), click on the UNCOVERED box before sending your order. (Uncovered
option trading is subject to special approval only). When all the information is entered, click on
PREVIEW ORDER.
4.2 Order types - Options
Drop-down menu
Definition
Market
Order at market price
Limit
Order with a limit price
Stop
Stop loss order at market
price
Stop Limit
Stop loss order at limit price
Details
This order will be filled at the best
possible price available on the market
at the time that the order is sent.
This order will not be filled if it does not
reach the specified price or better.
This order will not be triggered if the
“STOP PRICE” is not reached. If it is
triggered, the order will be filled at
market price.
This order will not be triggered if the
“STOP PRICE” is not reached. If it is
triggered, the order will be filled at the
limit price or better.
4.3 Duration – Options
Drop-down menu
Definition
DAY
Day order
GTC
Good to Cancel
Details
This order is cancelled at market close
of the regular market session (4:00
EST)
This order remains open until cancelled
on the date you specify on the pop-up
calendar when the order is placed.
By clicking on PREVIEW ORDER, a CONFIRMATION window will appear in order to verify that it
corresponds exactly to what you want. Also, in order to avoid errors, it is essential to verify the
details of the option order (name of the company, expiry date, strike price) and the market the
option is traded on.
14
Once you are satisfied with the displayed order, submit the order by clicking on the SEND ORDER
button. If you do not want to send the order, click on the EDIT ORDER button to return to the
TRADING CENTER.
The “Get Real-Time Quote” button below the OPTION ORDER ENTRY PANEL will give a detailed
quote of the option in question.
15
5.0 TRADING CENTER – Futures
By clicking on FUTURES in the
TRADING CENTER box located to
the left of the screen, the right part
of the TRADING CENTER will
change to FUTURES ORDER
ENTRY PANEL. This panel will
allow you to place option orders.
Similar to stock and options
transactions, if you manage more than one account, it is
important to select the account you wish to trade in. Your
account must have special permissions to trade futures.
Choose the futures symbol, expiration month, and expiration
year you wish to trade from the pull-down menu.
Once the symbol is entered, select the desired
TRANSACTION among the choices in the dropdown menu.
The number of contracts you wish to trade must be indicated
in the # CONTRACTS section and the ORDER TYPE must
be selected among the proposed choices. In the case of a
LIMIT or STOP LIMIT order, you should enter the price in the
LIMIT PRICE section. Then, the DURATION of the validity of
your order must be determined.
5.1 Transaction types
Drop-down menu choice
Details
Buy
Buy future contract or cover existing short.
Sell
Sell future contacts or short.
If you select a STOP or STOP LIMIT order, you must enter a trigger price in the STOP PRICE
section.
By clicking on PREVIEW ORDER, a CONFIRMATION window will appear in order to verify that it
corresponds exactly to what you want. Also, in order to avoid errors, it is essential to verify the
details of the futures order (contact type and month, price, order type). Once you are satisfied with
the displayed order, submit the order by clicking on the SEND ORDER button. If you do not want to
send the order, click on the EDIT ORDER button to return to the TRADING CENTER.
The “Get Real-Time Quote” button below the ORDER ENTRY PANEL will give a detailed quote of
the future in question.
16
6.0 TRADING CENTER – Order status, Executions, Positions
The lower part of the TRADING CENTER page displays different informational account
management functions. This part of the screen changes and is affected by the choices made in the
TRADING CENTER box: ORDER STATUS, EXECUTION and POSITIONS.
6.1 TRADING CENTER - Order Status
By choosing ORDER STATUS in the TRADING CENTER box from menu
on the left, the lower section of the page will display the status of all
active and non-active orders in your account placed during the current
day. The Order STATUS section is not dynamic. Therefore you must
click on the REFRESH button to view the new date and time of the order
status on top of the list.
The first column of the order status displays the date and time the order
is placed. The following columns display the security symbol, the number
of shares, the order type and the price entered. The STATUS column displays the status of the
order, to verify if your order is executed or if it is accepted.
Order status meaning
Order status
Executed
Open
Partial
Access Refused
Cancelled
Definition
The order is executed.
The order has been sent to the market but not yet executed.
The order is partially executed on the market.
The order has been refused by the system or by the broker.
You personally cancelled the order.
17
The next columns display the buttons that enable you to perform certain tasks and to obtain
additional information regarding your order. The “D” symbol shows the DETAILS OF THE ORDER.
This window displays all the data of the original order, and will also show the reason why the order
is refused if a “REJECTED” message is in the STATUS column. The reason will appear in the
NOTES section.
The RTQ button will display a new window showing the REAL-TIME QUOTE of the stock in
question.
The CANCEL button will be visible as long as the order is still active. Therefore, any active order
may be cancelled by clicking on this button. This will bring you to an ORDER CANCELLATION
CONFIRMATION window. Click on the CANCEL ORDER button to confirm the cancellation of the
order. The order status will then display CANCELLED.
Once the status is EXECUTED or PARTIAL, all the information concerning the execution is found in
the EXECUTION section for the current day.
18
6.2 TRADING CENTER - Executions
By selecting EXECUTION in the TRADING CENTER box, you will
access all trades executed on the markets during the current day. The
EXECUTION STATUS section is not dynamic. Therefore you must click
on the REFRESH button to view the new date and time of the order
status on top of the list.
The first column shows the date and time of the execution and the
second shows the net amount generated by this transaction. A negative
amount means that you have used liquidity for this execution (buy). A
positive amount means that you have received liquidity from this execution (sell).
The TRANSACTION column shows the details of the execution; the type of transaction, the quantity
filled, the symbol and the price at which the order was executed. It is important to note that if the
order was executed separately, the execution of the order will appear on different lines showing a
clear picture of the executions and information necessary.
By clicking on the “D” button, a window will display the ORDER DETAIL. Once a transaction is
executed and it is seen as EXECUTED, the POSITIONS section of your portfolio will be adjusted.
The stocks purchased will be added and those sold will be removed.
Take note that the value in the POSITIONS section comes from the evaluation of the last traded
price whereas the value for the BALANCES is based on the last visible bid price on the last closing
date of the markets.
19
6.4 TRADING CENTER - Positions
By selecting POSITIONS in the TRADING CENTER box from the left hand side menu, the lower
part of the screen changes and displays the positions in the portfolio. The positions include the
stocks you possess (long), and those that have been are shorted (short).
The time stamp of your positions will appear on the top of each list. In the
POSITIONS section, the SYMBOL and the QUANTITY of shares (or
contracts for options/futures) of different positions in your account will
appear. The AVERAGE PRICE from the opening of the position is
calculated automatically depending on the purchases and sales that you
perform, by conserving only the recent positions in the account. The
stock inventory is calculated using the First In First Out method (FIFO).
Positions that you close will be those that were opened prior to those
opened at a later time.
The POSITIONS STATUS section is not dynamic. Therefore you must click on the REFRESH
button to view the new date and time of the order status on top of the list.
The next column displays the last transaction price on the market at the evaluation of the portfolio.
The difference between the AVERAGE PRICE (opening of the position) and the CURRENT price
results in the P&L column. It is important to note that the profit/loss includes the paid commission
when the position was opened but it does not include the commission for closing the position. The
P&L column is also converted in the percentage form in the %P/L column for profit or loss in
percentage values for the opened positions.
The MARKET VALUE column displays the value of the QUANTITY owned by the LAST market
price, which permits to see the value of each of your positions.
To rapidly close a position, click on the T button. This will automatically bring your stock to the order
entry panel with the SYMBOL, TRANSACTION and QUANTITY all entered in their respective
cases.
The D button will give you the details of the position, including the different buying prices and the
timestamp of the opening of the position.
The RTQ button will display the window with the REAL TIME QUOTES.
20
7.0 YOUR ACCOUNT
The YOUR ACCOUNT section is located in the menu on the left. In this
section, the BALANCES page is found. This is the same as the
welcoming page seen when logging in and is explained in the prior
sections of this manual.
7.1 YOUR ACCOUNT - Balances
Please see section 3.0 Balances for more information.
7.2 YOUR ACCOUNT - Positions
Next, there is the POSITIONS section, which is similar to the POSITIONS section in the TRADING
CENTER. The information in this section is the same but shown on a complete page.
7.3 YOUR ACCOUNT - History
In YOUR ACCOUNT section, the HISTORY section is found. In this
section, your security history can be viewed.
The transaction history displays the summary of all trades within a
selected period. Clicking Executions will only display orders that have
been executed. Clicking Executions and Orders will display all orders,
including cancelled and rejected orders. Click on the D button will
provide you details of the order in question.
7.4 YOUR ACCOUNT - Messages
In the YOUR ACCOUNT section is the MESSAGES section. These messages are sent
automatically by the system. These messages will remain intact until they are no longer pertinent.
7.5 YOUR ACCOUNT – Account Settings
In YOUR ACCOUNT section you will find the Account Settings option. This feature will provide you
account details and the ability to change your login password.
21
8.0 TRADING
The TRADING section on the menu to the left displays the trading panels
for STOCKS, OPTIONS and FUTURES. These panels are the same as
those in the TRADING CENTER but appear over a full page. These
pages display your total equity and your buying power on the bottom.
The other selections of the TRADING section are also repetitions of the
options that can be found in the TRADING CENTER box. The ORDER
STATUS displays the orders of the day and the EXECUTIONS display
all the filled orders of the current day.
Below is the Stocks Order Entry Screen when accessed from the TRADING section.
22
9.0 MARKET DATA
9.1 Quotes
The QUOTES selection will give you the opportunity to view detailed quotations. When you click on
QUOTES, enter the stock symbol for which you want to obtain information. The QUOTES selection
will bring you to the REAL TIME FINANCIAL INFORMATION. Here all the related financial data of
the stock symbol is found. This data is not dynamic. The time of the data is found in the timestamp
line on the top right side.
9.2 Charts
When you click on CHARTS, enter the stock symbol for which you want to obtain information. The
CHARTS selection will bring you to the REAL TIME FINANCIAL INFORMATION.
To change the settings of the chart, enter the desired settings and click on the REFRESH CHART
button at the bottom of the page. These charts are not dynamic. To obtain new data for the charts,
click on the REFRESH CHART button.
The FREQUENCY of the chart represents the duration covered by each point (or bar) of the chart.
The TIME represents the duration covered by the entire chart. To obtain a MOVING AVERAGE,
select the desired type of moving average and then specify the evaluating parameters (number of
periods composing the average) in the right blank space. To obtain several moving averages,
separate your evaluating parameters for each moving average with a comma (e.g. 20, 50, 200). By
23
refreshing the chart, your moving averages appear in different colours. On the top left part of the
chart, the legend identifying the different elements of the chart is seen.
Menu of Moving Average Selections
Selection
SMA
EMA
SMA (2 lines)
SMA (3 lines)
EMA (2 lines)
EMA (3 lines)
Description
Simple Moving Average
Exponential Moving Average
2 Simple Moving Average with different coordinates for the same stock.
3 Simple Moving Average with different coordinates for the same stock.
2 Exponential Moving Average with different coordinates for the same stock.
3 Exponential Moving Average with different coordinates for the same stock
The UPPER INDICATORS are technical analysis tools that superimpose on the chart itself. The
LOWER INDICATORS are technical analysis tools that are displayed below the main chart. By
default, the VOLUME is selected for the lower indicator. To deploy another lower indicator, the
volume indicator will disappear. In the CHART TYPE drop-down menu you may select the type of
chart desired. Depending on your selection, the general appearance of the chart will change.
Menu of Chart Types selection
Selection
Hide price
Description
This option will hide all the information related to the prices of the stock. Thus, you
will only see the upper indicators and other activated parameters in the main
chart.
24
HLC
OHLC
Candlestick
Area
Bar Charts
Dot
Close
High-Low-Close; This is a vertical bar type chart displaying the price variations for
the covered period. You will also see a horizontal bar representing the last closing
price for that period.
Open-High-Low-Close; This is a vertical bar type chart displaying the price
variations for the covered period. You will also see two horizontal bars. The left
one is the opening price of the period and the right one is the closing price of the
period.
This chart type is represented by colour sticks (candles) and vertical lines at each
extremity. The candlesticks represent the difference between the opening and
closing of the period; the vertical lines are the high and low of the period. The
white candlesticks mean that the period is a high whereas the blue candlesticks
mean that the period is a low.
This chart type displays the information for the closing periods connecting various
data points.
The values in this chart type are represented by rectangular bars.
The closing prices of each period is represented by a dot.
The closing prices of each period is connected to each other with a line.
Logarithmic This is the same chart type as the OHLC but this one puts more
weight on the recent data
In the QUOTES AND CHARTS page, if you select OPTIONS, the option chain for the stock in
question will be obtained. The information is not dynamic, you can see the timestamp on the top
right hand corner. On the top of the option chain, the real time quote of the underlying asset is
found.
9.3 Options Chain
To obtain the option chains, enter the stock symbol. In the right drop-down menu, select the desired
option.
The option chains are separated by expiry date. Thus, it is important to start by selecting the
expiration month in the FOR drop-down menu. By clicking on the SUBMIT button, the option chain
you want will appear. Select the SHOW drop-down menu to view only the calls, puts or both of
them together. If the CHART checkbox is checked, it will show a chart displaying the evolution of
the stock during the current day.
When viewing both calls and puts in the menu, the calls will be on the left side and the puts will be
on the right side of the screen. In between them is a dark column, this shows the different strike
prices available for the expiration of that month. For each available strike price, on each call or put
side, you will see a TRADE button, the SYMBOL of the option and the quotation information of the
option. You can also see if the option is in-the-money or out-of-the-money. The in-the-money
information is presented on a light gray surface whereas the out-of-the-money information is shown
on a white surface. The in-the-money and out-of-the-money blocks are separated with a dark grey
line showing the last traded price of the underlying asset.
By clicking on the TRADE button, the OPTION ORDER ENTRY PANEL will appear. The option
symbol is entered automatically. Otherwise, it can be entered manually in the TRADING CENTER
or in the OPTIONS section in the TRADING menu.
The option quotes are similar to the stock quotes. Available is the last traded price, the change
since the last closing and also the number of contracts traded during the day. The buyers and
sellers are represented by the showing bid and ask. The INTEREST column displays the actual
number of open contracts on the markets for this particular option.
25
9.4 Symbol Lookup
The SYMBOL LOOKUP option in the MARKET section enables you to look for the stock symbol of
the company that you want to trade. If you are not sure about the spelling of the company name,
type in only the first few letters of the name and the system will retrieve a list of possible matching
names.
10.0 LOGGING OUT
When closing KAROLL DIRECT, it is important to click on
the LOGOUT button, which is located on the top right
corner (left to the index box). This will send a logout signal
to our servers and it will prevent login errors on your next
session.
26