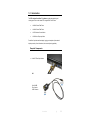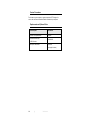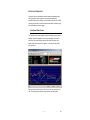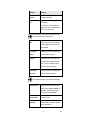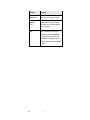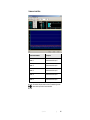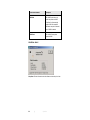
1
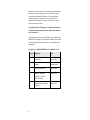
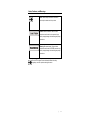
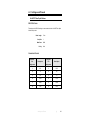
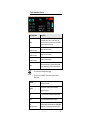
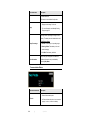
ProbeView™ II User Manual ETS-Lindgren L.P. reserves the right to make changes to any product described herein in order to improve function, design, or for any other reason. Nothing contained herein shall constitute ETS-Lindgren L.P. assuming any liability whatsoever arising out of the application or use of any product or circuit described herein. ETS-Lindgren L.P. does not convey any license under its patent rights or the rights of others. © Copyright 2004–2011 by ETS-Lindgren L.P. All Rights Reserved. No part of this document may be copied by any means without written permission from ETS-Lindgren L.P. Trademarks used in this document: The ETS-Lindgren logo and ProbeView are trademarks of ETS-Lindgren L.P.; Microsoft, Windows, Windows Vista, and Excel are registered trademarks of Microsoft Corporation in the United States and/or other countries. Revision Record | MANUAL,PROBEVIEW II | Part #H-600097, Rev. E ii Revision Description Date A Initial Release January, 2004 B Rebrand November, 2008 C Add HI-4413USB content October, 2009 D Added EC Declaration of Conformity for HI-4413P Fiber Optic Modem February, 2010 E Updated USB driver installation information October, 2011 | Table of Contents Notes, Cautions, and Warnings ................................................ v 1.0 Introduction .......................................................................... 7 Required Components ................................................................................ 7 ETS-Lindgren Product Information Bulletin ................................................. 8 2.0 Maintenance ......................................................................... 9 Maintenance of Fiber Optics ....................................................................... 9 Service Procedures .................................................................................. 10 Replacement and Optional Parts .............................................................. 10 3.0 Getting Started ................................................................... 11 Step 1: Download & Install Driver for HI-4413USB .................................... 11 Step 2: Install ProbeView II ....................................................................... 12 Step 3: Connect Components ................................................................... 12 ProbeView II Options Window................................................................... 13 Averaging ......................................................................................... 13 Text Update Rate .............................................................................. 13 Annotating Logged Data ................................................................... 13 Colors ............................................................................................... 14 Human Exposure .............................................................................. 14 4.0 Settings and Pinouts ......................................................... 15 HI-4413P Fiber Optic Modem ................................................................... 15 RS-232 Settings ................................................................................ 15 Connector Pinouts ............................................................................ 15 HI-4413USB Fiber Optic to USB Converter ............................................... 16 5.0 Operation ............................................................................ 17 ProbeView II Data ..................................................................................... 17 Sample Limit ..................................................................................... 17 Zero Probe Menu Item ...................................................................... 17 Auto Update Interval ......................................................................... 17 Sample Rate ..................................................................................... 18 Zoom-In / Zoom-Out ......................................................................... 18 Human Exposure (Health and Safety) ............................................... 18 Battery and Temperature .................................................................. 19 | iii ProbeView II Main Screen......................................................................... 19 File Menu .......................................................................................... 20 View Menu ........................................................................................ 21 Probe Menu ...................................................................................... 22 Communications Menu ..................................................................... 25 Help Menu: About ............................................................................. 26 Probe Interaction Screen .......................................................................... 27 Communication Status .............................................................................. 28 Field Intensity.................................................................................... 29 Units ................................................................................................. 29 Temperature ..................................................................................... 29 Battery Percentage ........................................................................... 29 Probe Information ............................................................................. 29 Peak ................................................................................................. 29 Bar Graph ......................................................................................... 29 Manually Setting Range ............................................................................ 30 Appendix A: EC Declaration of Conformity .......................... 33 HI-4413P Fiber Optic Modem ................................................................... 33 HI-4413USB Fiber Optic to USB Converter ............................................... 34 iv | Notes, Cautions, and Warnings Note: Denotes helpful information intended to provide tips for better use of the product. Caution: Denotes a hazard. Failure to follow instructions could result in minor personal injury and/or property damage. Included text gives proper procedures. Warning: Denotes a hazard. Failure to follow instructions could result in SEVERE personal injury and/or property damage. Included text gives proper procedures. See the ETS-Lindgren Product Information Bulletin for safety, regulatory, and other product marking information. | v This page intentionally left blank. vi | 1.0 Introduction The ETS-Lindgren ProbeView™ II software provides data gathering and viewing options for use with these ETS-Lindgren EMC Field Probes: HI-60XX Series Field Probe HI-44XX Series Field Probe HI-3702 Induced Current Meter HI-3638 Low Frequency Meter ProbeView II provides real-time display, logging, and analysis of probe data. It displays a variety of test information, both numerically and graphically. Required Components HI-4413P Fiber Optic Modem OR HI-4413USB Fiber Optic to USB Converter Introduction | 7 Fiber optic cable, part # 491106-nn, where nn=length in meters (not included) ProbeView II CD—See page 11 for the steps to install ProbeView II Personal computer with Microsoft® Windows® operating system (see page 11 for a list of supported operating systems) and one available serial port for HI-4413P or one available USB port for HI-4413USB (not included) USB driver for HI-4413USB—See page 11 for the steps to download and install the driver The field probe communication rate in samples per second is directly affected by the speed of the computer microprocessor. ETS-Lindgren Product Information Bulletin See the ETS-Lindgren Product Information Bulletin included with your shipment for the following: 8 Warranty information Safety, regulatory, and other product marking information Steps to receive your shipment Steps to return a component for service ETS-Lindgren calibration service ETS-Lindgren contact information | Introduction 2.0 Maintenance Before performing any maintenance, follow the safety information in the ETS-Lindgren Product Information Bulletin included with your shipment. WARRANTY Maintenance is limited to external components such as cables or connectors. If you have any questions concerning maintenance, contact ETS-Lindgren Customer Service. Maintenance of Fiber Optics Fiber optic connectors and cables can be damaged from airborne particles, humidity and moisture, oils from the human body, and debris from the connectors they plug into. Always handle connectors and cables with care, using the following guidelines. Before performing any maintenance, disconnect the fiber optic cables from the unit and turn off power. When disconnecting fiber optic cables, apply the included dust caps to the ends to maintain their integrity. Before connecting fiber optic cables, clean the connector tips and in-line connectors. Before attaching in-line connectors, clean them with moisture-free compressed air. Failure to perform these tasks may result in damage to the fiber optic connectors or cables. Maintenance | 9 Service Procedures For the steps to return a system or system component to ETS-Lindgren for service, see the Product Information Bulletin included with your shipment. Replacement and Optional Parts Part Description Part Number HI-4413P Fiber Optic Modem HI-4413P HI-4413USB Fiber Optic to USB Converter HI-4413USB Fiber Optic Cable, Glass 491106-nn (nn=length in meters) 10 | Maintenance 3.0 Getting Started Before connecting any components, follow the safety information in the ETS-Lindgren Product Information Bulletin included with your shipment. Step 1: Download & Install Driver for HI-4413USB The USB driver for the HI-4413USB automatically downloads and installs when the HI-4413USB is plugged into a computer that is connected to the Internet and that is installed with one of the following supported Microsoft® Windows® operating systems: Windows XP operating system Windows Vista® Client operating system Windows Vista Client x64 operating system Windows 7 Client operating system Windows 7 Client x64 operating system If you use an operating system not listed, please contact ETS-Lindgren. If your computer is not connected to the Internet, or it is connected but the automatic installation failed or was cancelled, you will need to download the drivers from www.ets-lindgren.com and manually install them on your computer. Go to www.ets-lindgren.com. On the Resources menu, click Software/Firmware. In the Software column, click USB Virtual Comm Port Driver (the name of the zip file may vary slightly). Save the zip file to the desired location on your computer. Getting Started | 11 Extract the files from the downloaded zip file. In the same section on the ETS-Lindgren website where the driver is located, click the link to download the installation instructions. Follow those instructions to install the USB driver on your computer. Step 2: Install ProbeView II See Required Components on page 7 for a list of hardware and software required to install and operate ProbeView II. Insert the ProbeView™ II CD into the CD drive on your host computer. Click Setup.exe located on the CD. ProbeView II installs in C:\Program Files\ProbeView II. Step 3: Connect Components Connect the fiber optic cable from the fiber optic ports on the probe to the HI-4413P Fiber Optic Modem or HI-4413USB Fiber Optic to USB Converter, matching white to white and yellow to yellow as indicated by the markers on the probe, modem, and cable. HI-4413P: Plug the HI-4413P into the RS-232 port on the computer (communication port 1, 2, 3, 4, or 5). HI-4413USB: Plug the HI-4413USB into the USB port on the computer (communication port 1, 2, 3, 4, or 5). The first time you use the HI-4413USB with your host computer, Microsoft Windows will set up the driver you installed in step 1, and then display a message that the device is ready to use. 12 Turn on the probe. Start ProbeView II. Click Start, All Programs, Holaday, ProbeView II, and then click ProbeView II. | Getting Started The first time ProbeView II is launched an option box displays to allow selection of a communication port. Select the port number where the HI-4413P/HI-4413USB is connected. To choose a different port after the initial selection, select the Communications menu after ProbeView II starts. For more information, see page 25. ProbeView II will look for a probe until one is detected, and then perform testing to determine the type of probe that is connected. If the HI-4413P/HI-4413USB is connected to the selected communication port, the LEDs on the HI-4413P/HI-4413USB will flash. Only one flashing LED indicates the communication port is working correctly but the connected probe is not responding. ProbeView II Options Window AVERAGING ProbeView II can be set to do a moving average of up to 50 samples. A setting of 1 indicates no averaging. TEXT UPDATE RATE Sets the text update rate in the Probe Status box to a readable rate. ProbeView II can acquire more than 70 samples per second with the HI-6005 probe. If every sample were displayed in text format, fast sample rates would become unreadable. ANNOTATING LOGGED DATA ProbeView II will prompt the user for information about the logged data being saved. To configure the prompts: Select the Options window. Click the Misc tab. Select Edit Note Prompts. The prompt, prompt-identifier, and last-user-entry are stored as a single line in the file. The prompt is the text preceding the first comma. Getting Started | 13 The text preceding the first comma is the prompt-identifier, which is written to the saved data file with the user response to the prompt. The last-user-entry is the last response the user gave to the prompt. It is also saved in the prompt file. COLORS ProbeView II colors can be customized to personalize the display. Some color combinations are not recommended. Avoid using light colors as the Box-Color; the white text in the Probe-Status-Area is not changeable. Avoid using red or yellow as the Text-Color, because red and yellow are used to indicate over and under range condition. The Bar Graph colors may be set to match the individual colors set in the Graph Colors frame by checking Match Graph Colors. HUMAN EXPOSURE Time based averaging is available to measure human exposure to EMF. Data samples are collected at one-second intervals for a specific time period. The samples are averaged over that time period, also known as the Threshold Limit Value. 14 | Getting Started 4.0 Settings and Pinouts HI-4413P Fiber Optic Modem RS-232 SETTINGS Following are the RS-232 settings to communicate with the HI-4413P Fiber Optic Modem and probes: Word Length: Stop Bits: Baud Rate: Parity: 7 bits 1 9600 Odd CONNECTOR PINOUTS HI-4413P Pin Description Computer Pin Assignment Description 1 N.C. 1 DCD 2 Tx 2 Rx 3 Rx 3 Tx 4 DSR 4 DTR 5 GND 5 GND 6 DTR 6 DSR Assignment Settings and Pinouts | 15 HI-4413USB Fiber Optic to USB Converter The cable for the HI-4413USB Fiber Optic to USB Converter uses the standard USB A-type male to USB mini-B male. 16 | Settings and Pinouts 5.0 Operation Before connecting any components, follow the safety information in the ETS-Lindgren Product Information Bulletin included with your shipment. ProbeView II Data Data is stored to C:\Program Files\ProbeView II, and is saved in a text format for analysis by a variety of software. The data is saved as a comma separated value file type. Microsoft® Office Excel® recognizes this format to allow easy loading of the data. To open the file and view the data, click the csv file. When the data in excess of 32 KB samples is saved, the data is saved in multiple files containing 32 KB samples each. SAMPLE LIMIT ProbeView™ II has a 512,000 data points limit before the data needs to be saved to a file. The log function will disengage automatically if this limit is reached. No other indication will be given. ZERO PROBE MENU ITEM Zeros the probe. Verify that the probe is in a zero field environment before selecting this item. See the probe manual for information regarding zeroing a probe. The zeroing function is not available for all probes. AUTO UPDATE INTERVAL Sets the time interval at which the probe temperature, laser current and temperature values are updated. These values can be updated immediately by clicking on the Temp label. These values are not updated during data logging. Operation | 17 SAMPLE RATE The sample rate is controlled with a list on the toolbar. The actual sample rate that is achieved depends on the features that are enabled and the type of probe. The actual sample rate may also vary depending on the speed of the computer and how busy it is performing other operations. The Sam/Sec label indicates the actual sample rate. Avoid other tasks during data logging, or the sample rate may vary. Irregular time stamp intervals in the recorded data can occur if this is ignored. When ProbeView II is set to 3 Axis-Data and auto-ranging is enabled, the sample rate will vary depending on how often the probe needs to change ranges as it switches axes. ZOOM-IN / ZOOM-OUT The Zoom-Out button becomes active after data has been recorded or data has been loaded from a file. To view the data after a recording session, click the Zoom-Out button. The graph is capable of displaying a maximum of 32,000 data samples. To view data in excess of 32 KB samples, the data needs to be saved to a file. The data will be saved in multiple files of 3 KB samples each. These files can be individually loaded for later viewing. To use the Zoom-In function, click the Zoom-In button, then click the graph and hold down the mouse button. Drag the mouse pointer down and to the right to select the area, and then release the button when the appropriate area is selected. The Zoom-In function only zooms the horizontal axis, not the vertical. Click the Scatter-Graph-Live button to return to viewing live probe data. HUMAN EXPOSURE (HEALTH AND SAFETY) To use this feature, select the View menu and enable Moving Average. The Moving-Average-Box will display on the main screen. Enabling Moving Average changes the log function to record one sample per second over the selected time period (for example, a six-minute average will average and record 360 data samples). Click the Log icon to measure and record the time-basedexposure to EMF. An elapsed timer will display the time of exposure along with the moving average. The Elapsed Time label will flash when the selected time interval is reached. 18 | Operation BATTERY AND TEMPERATURE ProbeView II does not automatically check the battery and temperature status while logging data. If data is logged over a long period the battery and temperature status will not reflect the current condition of the probe. The HI-6005 can take more than 500 mS to return temperature and battery information; during this time field data would not be logged. ProbeView II Main Screen The ProbeView II main screen displays the probe field strength or power density readings. The data is displayed as numeric values and graphs. The screen is divided into Probe Status, Moving Average, Peak Values, Bar Graphs, and Scatter Graph. Each section can be toggled on or off, except for Probe Status and Peak Values. The main screen contains five menus: File, View, Probe, Communications, and Help. The following screens assume a probe is active and collecting data. Operation | 19 FILE MENU 20 File Menu Description Open Selects and opens a file previously logged and saved by ProbeView II. Save As Saves logged data as a text format to a csv file. This file may be opened in several data analysis programs, including Excel. Exit Exits ProbeView II. | Operation VIEW MENU View Menu Description Moving Average (Human Exposure) Monitors the human exposure to EMF. Bar Graph Displays the field intensity or power density for each axis and the combined field intensity of the X, Y, and Z axes. Scatter Graph Displays the data in graph form. Live probe data will not be plotted unless Scatter Graph Live is enabled. Readings are sampled at one per second, and divided by the number of samples in the selected moving average period. When the moving average is started or reset, all the samples begin at zero. For every second during the first period of the selected moving average period, one of the zeros is replaced with a reading. At the end of the first period of the selected moving average period, the oldest reading is replaced with a new reading. This continues until the moving average is reset, which begins a new moving average. Operation | 21 View Menu Description Scatter Graph Live After probe data is logged it may be viewed in the graph. Live probe samples are not plotted while viewing previously logged data. This function toggles back to view live probe data. Data is not saved unless logging is turned on. Header Notes Displays information about previously logged data that was saved and then reloaded into ProbeView II. The Header Notes are saved with the data when it is exported to a csv file. Options Sets screen colors, averaging, and so on. PROBE MENU 22 Probe Menu Description Log Data Activates the program to record data from the probe. Data not saved during a previous logging session will be lost. Use Log Pause to append existing data. | Operation Probe Menu Description Log Pause Pauses probe data logging. Zero Zeros the probe. This feature cannot be accessed while data logging is active, and is not available for probes that do not have a zero function. Make sure the probe is in a zero field environment before zeroing a probe. See the probe manual for more information. Units Sets the units of measure in which data will be viewed and collected. The available units are probe-dependent. Plot Total Field Strength Disables plotting of the total field strength. Only the orthogonal values are plotted. Clear Peak Clears the peak values. The peak values are automatically cleared at the start of a new log session. The user is not allowed to clear the peak values manually during logging. Update Battery / Temperature Commands ProbeView II to immediately update battery and temperature information. Battery status and temperature are not updated during data logging. Auto Update Interval Updates the battery and temperature status at selected intervals: 5 minutes, 30 minutes, and 60 minutes. These values can be updated immediately by clicking the Temp label. Temperature Units Fahrenheit or Celsius. Alarm Enable Enables an audio alarm to indicate a preset field level has been exceeded. Operation | 23 24 Probe Menu Description Set Alarm Value Sets the value that will trigger the audio alarm. 3 Axis Data (slower) Enables ProbeView II to acquire independent axis data from the HI-44XX Series probes that have 3-axis capability. Range Allows manual selection of the probe range (when available). The default is Auto Range. This menu option may not be available when 3 Axis Data is enabled. Range changes must be made in the Probe Status Box when 3 Axis Data is enabled. | Operation COMMUNICATIONS MENU Communications Menu Description Comm. 1 Select communication port 1. Comm. 2 Select communication port 2. Comm. 3 Select communication port 3. Comm. 4 Select communication port 4. Comm. 5 Select communication port 5. Once selected, the port number is written to ProbeviewII.cfg, and the communication port number is set as the default. Operation | 25 Communications Menu Description 9600 Baud The HI-6005 probe is the only probe that operates at 19200. ProbeView II will automatically switch to 9600 if a compatible 9600 baud rate probe is detected, even if 19200 is selected. 19200 Baud The HI-44XX Series probes operate at 9600 HELP MENU: ABOUT Help About: Provides information about the software revision and probe in use. 26 | Operation Probe Interaction Screen Probe Status Box Description Combined value of the X, Y, and Z axes. This value is the square root of the sum of the squares when working with linear units. Field X (left side of screen) Value from X-axis reading. Y (left side of screen) Value from Y-axis reading. Z (left side of screen) Value from Z-axis reading. Units Units of field strength or power density available for the attached probe. Click to change the units. The units cannot be changed while logging. The units for the HI-2200 RF Survey Meter cannot be set with ProbeView II. Sam/Sec Samples per second. Log Cnt Total number of data points that have been logged or recorded. Log A red icon indicates that data is being recorded. Temp Current temperature returned from probe. XYZ (upper right corner) Used to disable individual axes when 3 Axis Data is disabled. Click the appropriate letter to enable Operation | 27 Probe Status Box Description or disable each axis. This feature is not available for all probes. Displays current range. Click to set. Range For more information, see Manually Setting Range on page 30. The approximate percentage of charge or life in battery. The battery icon also indicates this value. Probe Battery Status Battery Percentage Normal: Probe battery is in operating range. Warning–Yellow: Probe battery is low and needs recharging. Fail–Red: Probe battery has failed. Probe Information The probe type is displayed in the status bar. Additional information may be available by selecting Help About. Communication Status Communication Status Description Status of the attached probe. No Probe 28 No Probe indicates the probe is not connected properly, is not on, or has a low battery. | Operation FIELD INTENSITY The total field strength or power density is shown at the top in large numbers. In a non-squared unit, this reading is the square root of the sum of the squares of the X, Y, and Z axes. The orthogonal components for the X, Y, and Z axes are displayed in smaller numbers. Each time a reading is received from the probe this value is updated. UNITS The units of field strength or power density available for the attached probe. Click Units to scroll through the available units. The units cannot be changed while logging. TEMPERATURE The temperature returned from the Field Probe. Units may be switched between Fahrenheit and Celsius using the menu. Click Temp to update the temperature. BATTERY PERCENTAGE The approximate percentage of charge or life in battery. The battery icon also indicates this value. PROBE INFORMATION The probe type is displayed in the lower left status bar. Additional information may be available by selecting the Help menu. PEAK Shows the maximum field value since the last time the value was cleared. To clear this value, click Peak or the Bar Graph. BAR GRAPH Displays the data for the probe that is currently in use. Operation | 29 Bar Graph Display Definition Field The combined X, Y, and Z values. X-Data Value displayed by X-Value. Y-Data Value displayed by Y-Value. Z-Data Value displayed by Z-Value. Manually Setting Range ProbeView II has several options for changing probe range. The simplest method is to select Auto Range, but there may be times when more control is required. Following is a description of the range changing options. 30 When 3 Axis Data is enabled, the range can be only be changed from manual to auto or auto to manual by clicking the label Manual or Auto in the Probe Status box. The range control menu is only available when 3 Axis Data is disabled or an electrically-summed probe is connected. The HI-60XX Series probes and HI-2200 do not require any range control. When 3 Axis Data is disabled or when using a summed probe (HI-4450 or HI-4455), press the F1-F4 function keys to change to ranges 1 through 4, respectively. For some probe models, the F5 key can be pressed (HI-3702 and HI-3638). In the Probe Status box there is a 3x4 matrix which indicates the range of each axis when in Auto Range with 3 Axis Data enabled. If ProbeView II is switched to manual ranging this matrix should be used to set the range of each axis individually. Click the appropriate range for each axis. A yellow range number indicates Under Range. A red range number indicates Over Range. | Operation – Over Range—Indicates the probe reading is over the upper limits of the selected range. For example, if the probe is set to Range 1 with approximately 10 V/m as the upper setting, any reading greater than 10 V/m will cause an Over Range condition. – Under Range—Indicates the probe is reading less than approximately 10% of the full scale of the current range. For example, if the probe is set to Range 1 with approximately 10 V/m as the upper setting, any reading less than 1 V/m will cause an Under Range condition. ProbeView II may continuously toggle the over range and under range messages when in manual ranging with 3 Axis Data enabled. This indicates that at least one axis is over range and one axis is under range. A Range Next command can be sent to the probe by clicking Range in the Probe Status box. This feature is not available when 3 Axis Data is enabled. Operation | 31 This page intentionally left blank. 32 | Operation Appendix A: EC Declaration of Conformity HI-4413P Fiber Optic Modem EC Declaration of Conformity | 33 HI-4413USB Fiber Optic to USB Converter The EC Declaration of Conformity is the method by which ETS-Lindgren L.P. declares that the equipment listed on this document complies with the EMC Directive and Low Voltage Directive. Factory Issued by ETS-Lindgren L.P. 1301 Arrow Point Drive Cedar Park, TX, USA 78613 ETS-Lindgren L.P. 1301 Arrow Point Drive Cedar Park, TX, USA 78613 The products listed below are eligible to bear the CE mark: – HI-4413USB Fiber Optic to USB Converter APPLICABLE REQUIREMENTS Standard Criteria EMC Directive (2004/108/EC) EN 61326 –Electrical Equipment for Measurement, Control and Laboratory Use; EMC Requirements (1997). EN 55011 – CISPR 11 (1990) ed.2 – Threshold values and measuring methods for radio interference by HF equipment for industrial scientific and medical purposes. EN 61000-4-2:2009 –Testing and measurement techniques for electrostatic discharge immunity test. EN 61000-4-3:2006+A1:2008 –Testing and measurement techniques for radiated, radio-frequency, electromagnetic field immunity test. EN 61000-4-4 –Testing and measurement techniques for electrical fast transient/burst immunity test. EN 61000-4-5 –Testing and measurement techniques for surge immunity test. 34 | EC Declaration of Conformity Standard Criteria EN 61000-4-6 –Testing and measurement techniques for immunity to conducted disturbances, induced by radio-frequency fields. AUTHORIZED SIGNATORIES Date of Declaration: December 11, 2009 The authorizing signatures on the EC Declaration of Conformity document authorize ETS-Lindgren L.P. to affix the CE mark to the indicated product. CE marks placed on these products will be distinct and visible. Other marks or inscriptions liable to be confused with the CE mark will not be affixed to these products. ETS-Lindgren L.P. has ensured that appropriate documentation shall remain available on premises for inspection and validation purposes for a period of no less than 10 years. EC Declaration of Conformity | 35