1
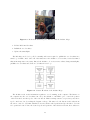
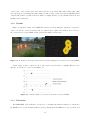
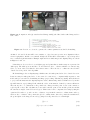
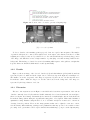
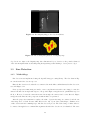
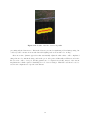
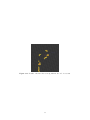
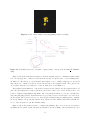
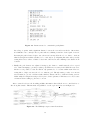
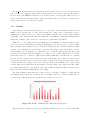
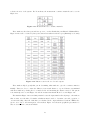
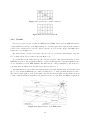
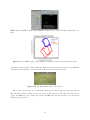
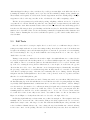
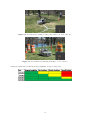
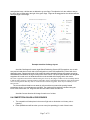
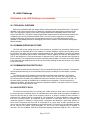
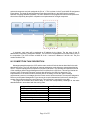
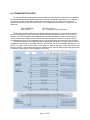
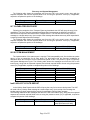
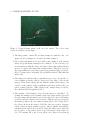
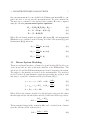
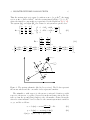
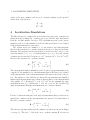
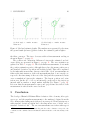
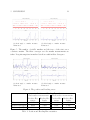
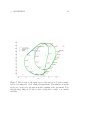
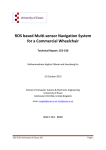
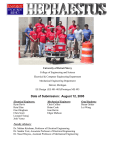
Figure 4.18: LabVIEW Logging of Raw and Filtered data from encoders and Compass (Akmanalp et al.,
2011)
Figure 4.19: LabVIEW logging of Raw and Filtered Path from Sensor Data around Atwater Kent
output into Comma Separated Value (CSV) files. This data was then imported and plotted in MATLAB.
The physical test and results of a run are shown in Figures 4.20 and 4.21 respectively.
Figure 4.20: The Hand Drawn Circle on the Ground
The red circle represents the encoder information and is given in meters. The blue circle represents the
GPS information gathered during the same run, it also is given in meters. The blue circle represents the
output of the EKF before the output is put back into the EKF. The circle has a diameter of about 8 meters
which is how large it was in
45