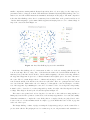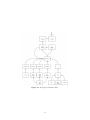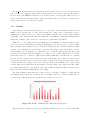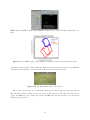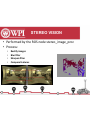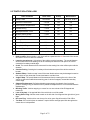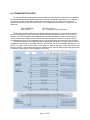
1
Faculty Code: Project Sequence: MQP Division: TP1 IGV3 RBE Improved Intelligence and Systems Integration for WPI’s UGV - Prometheus A Major Qualifying Project Report submitted to the faculty of WORCESTER POLYTECHNIC INSTITUTE in partial fulfillment of the requirments for the degree of Bachelor of Science Submitted by: Craig DeMello Robotics Engineering Eric Fitting Computer Science & Robotics Engineering Samson King Robotics Engineering Gregory McConnell Robotics Engineering Michael Rodriguez Robotics Engineering Advisors: Taskin Padir William R. Michalson April 26, 2012 Abstract This project focuses on realizing a series of operational improvements for WPI’s unmanned ground vehicle Prometheus with the end goal of a prize winning entry to the Intelligent Ground Vehicle Challenge. Operational improvements include a practical implementation of stereo vision on an NVIDIA GPU, a more reliable implementation of line detection, a better approach to mapping and path planning, and a modified system architecture realized by an easier to work with GPIO implementation. The end result of these improvements is better autonomy, accessibility, robustness, reliability, and usability for Prometheus. Contents List of Figures iv List of Tables v 1 Introduction 1.1 Motivation . . . . . . . . . . . . . . . . . . . . . . . . . . 1.2 Intelligent Ground Vehicle Competition (IGVC) Overview 1.2.1 Qualification Requirements . . . . . . . . . . . . . 1.3 Robot Operating System Overview . . . . . . . . . . . . . 1.4 2011 MQP Report Overview . . . . . . . . . . . . . . . . . 1.5 State of Prometheus . . . . . . . . . . . . . . . . . . . . . 1.5.1 Systems in Identified for Improvement . . . . . . . 1.5.2 GPU Implementation of Stereo Vision . . . . . . . 1.5.3 Extend Kalman Filter . . . . . . . . . . . . . . . . 1.5.4 Navigation and Costmap . . . . . . . . . . . . . . 1.6 Goals and Requirements . . . . . . . . . . . . . . . . . . . 1.7 Paper Overview . . . . . . . . . . . . . . . . . . . . . . . . . . . . . . . . . . . . . . . . . . . . . . . . . . . . . . . . . . . . . . . . . . . . . . . . . . . . . . . . . . . . . . . . . . . . . . . . . . . . . . . . . . . . . . . . . . . . . . . . . . . . . . . . . . . . . . . . . . . . . . . . . . . . . . . . . . . . . . . . . . . . . . . . . . . . . . . . . . . . . . . . . . . . . . . . . . . . . . . . . . . . . . . . . . . . . . . . . . . . . . . . . . . . . . . . . . . . . . . . . . . . . . . . . . . . . . . . . . . . . . . . 1 1 1 3 4 5 6 7 10 11 12 12 13 2 Drive System 14 2.1 Methodology . . . . . . . . . . . . . . . . . . . . . . . . . . . . . . . . . . . . . . . . . . . . . 14 2.2 Results . . . . . . . . . . . . . . . . . . . . . . . . . . . . . . . . . . . . . . . . . . . . . . . . . 20 2.3 Discussion . . . . . . . . . . . . . . . . . . . . . . . . . . . . . . . . . . . . . . . . . . . . . . . 21 3 Obstacle Detection System 3.1 LIDAR . . . . . . . . . . 3.1.1 Methodology . . . 3.1.2 Results . . . . . . 3.1.3 Discussion . . . . . 3.2 Stereo Vision . . . . . . . 3.2.1 Methodology . . . 3.2.2 Results . . . . . . 3.2.3 Discussion . . . . . 3.3 Line Detection . . . . . . 3.3.1 Methodology . . . 3.3.2 Results . . . . . . 3.3.3 Discussion . . . . . . . . . . . . . . . . . . . . . . . . . . . . . . . . . . . . . . . . . . . . . . . . . . . . . . . . . . . . . . . . . . . . . . . . . . . . . . . . . . . . . . . . . . . . . . . . . . . . . . . . . . . . . . . . . . . . . . . . . . . . . . . . . . . . . . . . . . . . . . . . . . . . . . . . . . . . . . . . . . . . . . . . . . . . . . . . . . . . . . . . . . . . . . . . . . . . . . . . . . . . . . . . . . . . . . . . . . . . . . . . . . . . . . . . . . . . . . . . . . . . . . . . . . . . . . . . . . . . . . . . . . . . . . . . . . . . . . . . . . . . . . . . . . . . . . . . . . . . . . . . . . . . . . . . . . . . . . . . . . . . . . . . . . . . . . . . . . . . . . . . . . . . . . . . . . . . . . . . . . . . . . . . . . . . . . . . . . . . . . . . . . . . . . . . . . . . . . . . . . . . . . . . . . . . . . . . . . . . . . . . . 23 23 23 24 24 25 25 28 28 29 29 30 31 4 Navigation System 4.1 Mapping Obstacles and CostMap 4.1.1 Methodology . . . . . . . 4.1.2 Results . . . . . . . . . . 4.1.3 Discussion . . . . . . . . . 4.2 Extended Kalman Filter . . . . . 4.2.1 Methodology . . . . . . . . . . . . . . . . . . . . . . . . . . . . . . . . . . . . . . . . . . . . . . . . . . . . . . . . . . . . . . . . . . . . . . . . . . . . . . . . . . . . . . . . . . . . . . . . . . . . . . . . . . . . . . . . . . . . . . . . . . . . . . . . . . . . . . . . . . . . . . . . . . . . . . . . . . . . . . . . . . . . . . . . . . . . . . . . . . . . . . . . . . . . . . . . . . . . . . . . . . . . . . . . . . . 34 34 34 40 41 42 42 . . . . . . . . . . . . . . . . . . . . . . . . . . . . . . . . . . . . i 4.2.2 4.2.3 4.2.4 Results . . . . . . . . . . . . . . . . . . . . . . . . . . . . . . . . . . . . . . . . . . . . Discussion . . . . . . . . . . . . . . . . . . . . . . . . . . . . . . . . . . . . . . . . . . . Improvements for Next Year . . . . . . . . . . . . . . . . . . . . . . . . . . . . . . . . 5 Results of Testing 5.1 Indoor Testing . . . 5.2 Outdoor Testing . . 5.2.1 Course Setup 5.2.2 Robot Setup 5.3 Full Tests . . . . . . . . . . . . . . . . . . . . . . . . . . . . . . . . . . . . . . . . . . . . . . . . . . . . . . . . . . . . . . . . . . . . . . . . . . . . . . . . . . . . . . . . . . . . . . . . . . . . . . . . . . . . . . . . . . . . . . . . . . . . . . . . . . . . . . . . . . . . . . . . . . . . . . . . . . . . . . . . . . . . . . . . . . . . . . . . . . . . . . . . . . . . . . . . . . . . . . . . . . . . . . . . . . . 44 46 46 47 47 48 48 49 50 6 Conclusion 52 A Authorship 54 B User Guide B.1 Stereo Vision . . . . . . . . . . . . . . . . . . . . B.1.1 Launching Stereo Vision . . . . . . . . . . B.1.2 Other useful commands and information: B.2 GPS . . . . . . . . . . . . . . . . . . . . . . . . . B.2.1 GPS Set-up . . . . . . . . . . . . . . . . . B.2.2 Running GPS Node . . . . . . . . . . . . B.3 Arduino . . . . . . . . . . . . . . . . . . . . . . . B.3.1 Hardware . . . . . . . . . . . . . . . . . . B.3.2 Software . . . . . . . . . . . . . . . . . . . B.3.3 Launching Tele-Op Mode . . . . . . . . . B.4 Launching the Compass . . . . . . . . . . . . . . B.5 Launching the EKF . . . . . . . . . . . . . . . . B.6 Installing Ubuntu . . . . . . . . . . . . . . . . . . B.7 Installing ROS . . . . . . . . . . . . . . . . . . . B.8 Setting Up A Development Environment . . . . . . . . . . . . . . . . . . . . . . . . . . . . . . . . . . . . . . . . . . . . . . . . . . . . . . . . . . . . . . . . . . . . . . . . . . . . . . . . . . . . . . . . . . . . . . . . . . . . . . . . . . . . . . . . . . . . . . . . . . . . . . . . . . . . . . . . . . . . . . . . . . . . . . . . . . . . . . . . . . . . . . . . . . . . . . . . . . . . . . . . . . . . . . . . . . . . . . . . . . . . . . . . . . . . . . . . . . . . . . . . . . . . . . . . . . . . . . . . . . . . . . . . . . . . . . . . . . . . . . . . . . . . . . . . . . . . . . . . . . . . . . . . . . . . . . . . . . . . . . . . . . . . . . . . . . . . . . . . . . . . . . . . . . . . . . . . . . . . . . . . . . . . . . . . . . . . . . . . . . . . . . . . . . . . . . . . . . . . 55 55 55 56 57 57 57 58 58 58 58 59 59 60 60 60 Works Cited 62 Preliminary Design Review Presentation 64 The 20th Annual Intelligent Ground Vehicle Competition Rules 102 Three-state Extended Kalman Filter for Mobile Robot Localization 125 ii List of Figures 1.1 1.2 1.3 1.4 1.5 1.6 1.7 1.8 1.9 Auto-Nav Challenge layout for the 2012 IGVC. . Auto-Nav Challenge layout for the 2012 IGVC. . An example ROS node and topic. . . . . . . . . . Camera postion changes made by the 2011 team. Progression of Prometheus . . . . . . . . . . . . . Components of Prometheus 2012. . . . . . . . . . 2011 System Architecture for Prometheus. . . . . Contents of the cabin of the 2011 Prometheus. . Compass . . . . . . . . . . . . . . . . . . . . . . . . . . . . . . . . 2 3 4 6 7 8 9 10 11 2.1 2.2 2.3 2.4 2.5 2.6 2.7 2.8 2.9 2.10 15 15 16 16 17 17 18 18 19 2.11 2.12 2.13 2.14 2012 System Architecture for Prometheus. . . . . . . . . . . . . . . . . . . . . . . . . . . . . . Circuit Diagram for the Wireless E-Stop. . . . . . . . . . . . . . . . . . . . . . . . . . . . . . Breakout Board Developed to Interface with the Arduino Mega. . . . . . . . . . . . . . . . . . Software Flowchart of the Arduino Mega. . . . . . . . . . . . . . . . . . . . . . . . . . . . . . Portion of the Arduino’s Code that Interfaces with the Remote Control. . . . . . . . . . . . . Code to Interface with Encoders . . . . . . . . . . . . . . . . . . . . . . . . . . . . . . . . . . Portion of the Arduino’s Code that Interfaces with the RGB LEDs. . . . . . . . . . . . . . . . Portion of code for the PID Loop that controls the position of the front wheel. . . . . . . . . Portion of code that parses the encoder data and processes it . . . . . . . . . . . . . . . . . . Portion of code that determines if Prometheus is in autonomous mode and sets the coresponding values to the wheels. . . . . . . . . . . . . . . . . . . . . . . . . . . . . . . . . . . . . . . . Portion of code that communicates with the Jaguars. . . . . . . . . . . . . . . . . . . . . . . . Portion of the RXGraph that deals with the Jaguars. . . . . . . . . . . . . . . . . . . . . . . . Results of the conversion to discrete encoder ICs. . . . . . . . . . . . . . . . . . . . . . . . . . Actual vs. Expected results of driving an arc. . . . . . . . . . . . . . . . . . . . . . . . . . . . 3.1 3.2 3.3 3.4 3.5 3.6 3.7 3.8 3.9 3.10 3.11 3.12 3.13 3.14 3.15 Lidar real world and costmap . . . . . . . . . . . . . . . . . . . . . . . . . . . . . Actual vs. Expected obstacle locations as seen by the LIDAR . . . . . . . . . . . Stereo Vision Flowchart . . . . . . . . . . . . . . . . . . . . . . . . . . . . . . . . Stereo vision real world and blurred . . . . . . . . . . . . . . . . . . . . . . . . . Portion of code used to generate the common parameters used in block matching Portion of the code used to generate a disparity map . . . . . . . . . . . . . . . . The left and right rectified images as seen by Prometheus . . . . . . . . . . . . . The Disparity Map produced by Prometheus . . . . . . . . . . . . . . . . . . . . The Costmap interpritation of a disparity map . . . . . . . . . . . . . . . . . . . Flowchart of the Line Detection Process . . . . . . . . . . . . . . . . . . . . . . . ROS nodes dealing with line detection . . . . . . . . . . . . . . . . . . . . . . . . rect . . . . . . . . . . . . . . . . . . . . . . . . . . . . . . . . . . . . . . . . . . . Portion of code that generates the pointcloud for input into CostMap . . . . . . Results of the line detection algorithm . . . . . . . . . . . . . . . . . . . . . . . . Results of the Line Detection algorithm at the end of a test run . . . . . . . . . . . . . . . . . . . . . . . . . 24 24 26 27 27 28 28 29 29 30 30 31 31 32 33 4.1 4.2 The common parameters used by both the local and global CostMap. . . . . . . . . . . . . . Navigation Stack Flowchart. . . . . . . . . . . . . . . . . . . . . . . . . . . . . . . . . . . . . . 35 36 iii . . . . . . . . . . . . . . . . . . . . . . . . . . . . . . . . . . . . . . . . . . . . . . . . . . . . . . . . . . . . . . . . . . . . . . . . . . . . . . . . . . . . . . . . . . . . . . . . . . . . . . . . . . . . . . . . . . . . . . . . . . . . . . . . . . . . . . . . . . . . . . . . . . . . . . . . . . . . . . . . . . . . . . . . . . . . . . . . . . . . . . . . . . . . . . . . . . . . . . . . . . . . . . . . . . . . . . . . . . . . . . . . . . . . . . . . . . . . . . . . . . . . . . . . . . . . . . . . . . . . . . . . . . . . . . . . . . . . . . . . . . . . . . . . . . . . . . . . . . . . . . . . . . 19 20 20 21 21 4.3 4.4 4.19 4.20 4.21 The obstacle inflation and path planning results of CostMap. . . . . . . . . . . . . . . . . . . How inflation is used to determine occupancy. Image courtesy of the CostMap 2D wiki(ROS, 2010). . . . . . . . . . . . . . . . . . . . . . . . . . . . . . . . . . . . . . . . . . . . . . . . . . Increased obstacle inflation and resulting path planning of CostMap. . . . . . . . . . . . . . . Portion of the code used to connect to the GPS client. . . . . . . . . . . . . . . . . . . . . . . Portion of the code used to send GPS goals to the path planner. . . . . . . . . . . . . . . . . Parameters used to constrain the path planner. . . . . . . . . . . . . . . . . . . . . . . . . . . The RXGraph output of 2012 Prometheus. . . . . . . . . . . . . . . . . . . . . . . . . . . . . Results of multiple trials of GPS Waypoint navigation. . . . . . . . . . . . . . . . . . . . . . . Operation of the extended Kalman Filter. Image courtesy of Welch & Bishop (1995) . . . . . The state vector of the system: GPS gives X and Y, Phi is given by the compass . . . . . . . Measurement noise covariance matrix R . . . . . . . . . . . . . . . . . . . . . . . . . . . . . . Distance tests for the encoder and compass . . . . . . . . . . . . . . . . . . . . . . . . . . . . System noise covariance matrix Q . . . . . . . . . . . . . . . . . . . . . . . . . . . . . . . . . . Measurement matrix H . . . . . . . . . . . . . . . . . . . . . . . . . . . . . . . . . . . . . . . . Implementation of the EKF in ROS . . . . . . . . . . . . . . . . . . . . . . . . . . . . . . . . LabVIEW Logging of Raw and Filtered data from encoders and Compass (Akmanalp et al., 2011) . . . . . . . . . . . . . . . . . . . . . . . . . . . . . . . . . . . . . . . . . . . . . . . . . . LabVIEW logging of Raw and Filtered Path from Sensor Data around Atwater Kent . . . . . The Hand Drawn Circle on the Ground . . . . . . . . . . . . . . . . . . . . . . . . . . . . . . EKF, GPS, and Encoder Results . . . . . . . . . . . . . . . . . . . . . . . . . . . . . . . . . . 5.1 5.2 5.3 5.4 5.5 Demonstration course with lines . . . . . . . . . . . . . . Demonstration course with cones and lines . . . . . . . . . Demonstration course with cones, lines and goals . . . . . Prometheus successfully avoiding a line with a goal on the Prometheus demonstrating its ability to locate obstacles . . . . . . 48 49 49 51 51 6.1 Prometheus navigating during the demonstration in Institute Park . . . . . . . . . . . . . . . 52 B.1 Description of the remote control and it’s various modes of operation. . . . . . . . . . . . . . 59 4.5 4.6 4.7 4.8 4.9 4.10 4.11 4.12 4.13 4.14 4.15 4.16 4.17 4.18 iv . . . . . . . . . . . . . . . . . . other side . . . . . . . . . . . . . . . . . . . . . . . . . . . . . . . . . . . . . . . . . . . . . . . . . . . . . . . . . . . . . . . . . . . . . . . 37 37 38 38 38 39 39 40 42 42 43 43 44 44 44 45 45 45 46 List of Tables B.1 Comparision of the color of the status LED on the DGPS with its meaning . . . . . . . . . . B.2 Comparision of the color of the status LED on the DGPS with its meaning . . . . . . . . . . v 57 58 Chapter 1 Introduction 1.1 Motivation The benefits and applications of autonomous driving vehicles are vast. They can provide transportation that is safer than a car driven by the average human, as they can be more aware of their surroundings and respond faster. They will not fall asleep at the wheel and are capable of traveling over great distances without stopping. They can also perform tasks constantly and consistently that would otherwise be tedious. For example, some car companies, such as Volkswagen, use autonomous driving vehicles to deliver tools and components to different departments of their factory when and where they are needed.(Markus, 2003) Autonomous driving vehicles are on their way to becoming integrated with society. Recently the state of Nevada passed a law that regulates the use of self-driving cars on the road. (Belezina, 2012) Google is working on an autonomous car and which has proven its capability by driving a blind man to his desired destination.(Korzeniewski, 2012) Google and Volkswagens interest in autonomous vehicles shows that it is a growing field and it is of great interest in the field of robotics, as it requires knowledge from electrical, mechanical, and computer engineering. The Major Qualifying Project (MQP) culminates the learning experience of students at Worcester Polytechnic Institute (WPI). The MQP demonstrates application of the skills, methods, and knowledge of the discipline to the solution of a problem that would be representative of the type to be encountered in ones career. (WPI, 2011) The Intelligent Vehicle Competition tests Robotics Engineering students ability to apply all theyve learned and focuses on the implementation of autonomous driving vehicles. While autonomous driving is becoming more commonplace, the competition forces students to innovate the procedure of producing an unmanned ground vehicle (UGV), because they must use a variety of sensors and hardware that are reasonably priced and can be purchased off the shelf. 1.2 Intelligent Ground Vehicle Competition (IGVC) Overview The Intelligent Ground Vehicle Competition (IGVC) is a yearly robotics competition for college and graduate students. On average 40 teams compete each year in the competition. IGVC consists of several 1 smaller competitions, starting with the Design Competition, where robots are judged on the design report, presentation and robot inspection. In the Joint Architecture Unmanned Systems (JAUS) challenge, the robot must receive and follow JAUS instructions transmitted wirelessly from the judges. The main competition is the Auto-Nav Challenge, where the robot must stay between white lines on the ground as well as avoid obstacles while navigating to predetermined GPS waypoints and staying between color-coordinated flags. A map of the course is shown in Figure 1.1. Figure 1.1: Auto-Nav Challenge layout for the 2012 IGVC. In the Auto-Nav challenge the robot must start at either one of the two starting paths shown at the bottom of the map. The red, orange, blue, or black circles show where the obstacles will most likely be. It must stay between the lines and avoid these obstacles while navigating to the stars on the map, which are the waypoints. Waypoints are given as coordinates in latitude and longitude prior to the start of the run of the course. The robot must interpret these coordinates and attempt to reach one before proceeding to the next. Down the middle of the field is a fence shown as a yellow line. There are openings in the fence shown as a dotted blue line. This is where the robot must proceed through the course and attempt to reach the rest of the waypoints. Upon finishing the course, the robot must be able to detect flags. More importantly, it must be able to detect the color of these flags and keep itself to the right of the blue flags and to the left red flags. These flags are shown by the red and blue squares in Figure 1.1. The team receives points based on how long the robot was able to drive without crossing any lines or hitting any obstacles. More points are obtained based on how many waypoints the robot reached successfully. Teams have 10 minutes to complete the course. If they have not completed it, they are judged based on the location of the robot at the 10-minute mark. A complete copy of the IGVC rules can be found on page 102 at the end of the report. The Design challenge consists of judges reviewing the design strategy and process the teams follow to produce their vehicles. The judging is based on a written report, an oral presentation and examination of 2 the vehicle. The primary focus of this challenge is design innovation, which must be documented clearly in the written report and emphasized in the oral presentation. The written report is not to exceed 15 letter-sized pages and include graphic material and appendices. The oral presentation is not to exceed 10 minutes and must consist of clear and understandable explanation of innovations and logical organization. The examination is judged on packaging neatness, efficient use of space, and a huge portion is based on the degree of original content in the vehicle. The robot must interface with a Judges common operation picture (COP) and provide specific information for the JAUS challenge. COP provides a high level view of the systems in operation and implements the JAUS protocol. The general approach to this challenge is to respond to a periodic status and position requests/queries from the COP. An overview of the JAUS protocol and queries can be seen in Figure 1.2 Figure 1.2: Auto-Nav Challenge layout for the 2012 IGVC. 1.2.1 Qualification Requirements The COP will request Identification every five seconds until is received then request a list of the services that can be provided by the identified entry. The COP will then query the control where it will get control of the entry and query the stauts of the entry every 5 seconds until the task is terminated. Finally, the COP will query various data that resembles the tasking until the judge terminates the JAUS mission at which the point the interface will shut down. Length: The vehicle will be measured to ensure that it is over the minimum of three feet long and under the maximum of seven feet long. Width: The vehicle will be measured to ensure that it is over the minimum of two feet wide and under the maximum of five feet wide. Height: The vehicle will be measured to ensure that it does not to exceed six feet high; this excludes 3 emergency stop antennas. Mechanical E-Stop: The mechanical E-stop will be checked for location to ensure it is located on the center rear of vehicle a minimum of two feet high and a maximum of four feet high and for functionality. Wireless E-Stop: The wireless E-Stop will be checked to ensure that it is effective for a minimum of 100 feet. During the performance events the wireless E-stop will be held by the Judges. Saftey Light: The safety light will be checked to ensure that when the vehicle is powered up the light is on and solid and when the vehicle is running in autonomous mode, the light goes from solid it to flashing, then from flashing to solid when the vehicle comes out of autonomous mode Speed: The vehicle will have to drive over a prescribed distance where its minimum and maximum speeds will be determined.The vehicle must not drop below the minimum of one mile per hour and not exceed the maximum speed of ten miles per hour. Minimum speed of one mph will be assessed in the fully autonomous mode and verified over a 44 foot distance between the lanes and avoiding obstacles. No change to maximum speed control hardware is allowed after qualification. If the vehicle completes a performance event at a speed faster than the one it passed Qualification at, that run will not be counted. Lane Following: The vehicle must demonstrate that it can detect and follow lanes. Obstacle Avoidance: The vehicle must demonstrate that it can detect and avoid obstacles. Waypoint Navigation: Vehicle must prove it can find a path to a single two meter navigation waypoint by navigating around an obstacle. 1.3 Robot Operating System Overview Robot Operating System, or ROS, is an open source software package developed by Willow Garage starting in 2008. It is a highly modular software framework that can work on a variety of robot platforms, and it allows for easy expansion based on user needs.(Quigley et al., 2009) It is supported on Linux platforms, with experimental versions on Mac OS and other platforms. The primary language for programming is C++; however, Python is also supported. ROS operation is very much based on the concept of nodes. A node in this context is one piece of software that accomplishes a task. An example of a node would be a package of code whose job it is to gather data from the compass. The nodes have the ability to publish and subscribe. Publishing is when the node puts out information, for example an array of values, for other nodes to use. Subscribing is how a node listens for published data. The information going back and forth between nodes is known as a topic. The end result is multi-threaded process with hundreds of smaller programs running at once. This system is perfect for a robot with multiple sensors to integrate. Figure 1.3: An example ROS node and topic. 4 ROS has pre written open source software available to download. These are commonly referred to as packages. These packages have to be customized to work with your specific application, but they are good starting points. Some popular packages include RVIZ, which allows for visualization of path planning and obstacles, and the navigation stack, which is a path planning framework based on Dijkstras Algorithm and tentacles. They are highly tunable using parameters that are set in launch files or yaml files. Users can also write their own software packages that can subscribe and publish the same as a downloaded package. These can be written in C++ or Python. The node type architecture is great for multi sensor robots with the appropriate processing power. The packages communicating back and forth via topics makes ROS highly modular by nature, since changing packages only requires subscribing and publishing the appropriate topics. The open source nature does have its drawbacks, the documentation is very lacking, but overall ROS is the standard for a robot software framework. 1.4 2011 MQP Report Overview The team working on Prometheus for the 2011 IGVC made significant improvements to the overall design of the robot. Their goals were to improve the usability of Prometheus under testing conditions, to improve the reliability of sensor data, and to improve the overall intelligence of the robot. The 2011 team added many usability improvements which made working with Prometheus much easier for our team. The 2011 team redesigned the cover of Prometheus to allow easy access to the internal computer and hardware. They purchased a remote control for manually driving Prometheus around between autonomous test runs. Before the remote was integrated, a tester had to follow a complex process to connect a laptop wirelessly to the robot and connect a joystick to the laptop. The team added a computer monitor and external USB hub, making direct interaction with the onboard computer possible. The 2011 team also made significant improvements to the sensor data collected by Prometheus. One of the main issues with the stereo vision implementation in the 2010 version of Prometheus was that the cameras were mounted low and towards the back of the robot. This meant that the cameras could not see directly in front of the robot, and sometimes they detected the horizon, which caused issues. This problem was solved by mounting the cameras further forward and up higher, as seen in Figure 3.12(a). The GPS used by the 2010 team was extremely unreliable, and could not give an accurate representation of Prometheuss position, so the 2011 team replaced it with a high accuracy differential GPS, which uses information from a base station to obtain extremely accurate measurements. The 2011 team also moved the LIDAR up by several inches, so that patches of tall grass or minor variations in elevation, and installed a compass to obtain heading information. The main focus of IGVC is building an intelligent robot, so the 2011 team also did a lot of work on Prometheuss intelligence systems. The 2011 team began using the ROS framework so that different systems in the robot could run separately in their own processes but still communicate between one another when needed. This made development significantly easier, because different people could work on different parts of the system simultaneously without interfering with each other. The 2011 team implemented an Extended Kalman Filter (EKF), line detection system based on the Hough transform, local and global maps, local path planning using the tentacles algorithm, and global path planning using an A* search. The EKF is an 5 Figure 1.4: Camera postion changes made by the 2011 team. algorithm used to combine data from various sensors into one reading that is more accurate than any of the individual sensor readings. The Hough transform is a method for detecting lines and other shapes in an image. Global and local maps are common in mobile robot applications, because they are useful for keeping track of the robots current environment. The tentacles algorithm works by producing a range of arcs that the robot could follow, and choosing one based on a variety of criteria. An A* search is an algorithm that looks for the shortest path from one place to another, so it is used to plan the path from Prometheus to its next waypoint. 1.5 State of Prometheus Worcester Polytechnic Institute (WPI) has competed in the past two IGVCs (IGVC 18 and 19). The 2010 IGVC Team designed and constructed the robot from scratch for the competition, known as Prometheus, which can be seen in Figure 1.5. Prometheus was constructed from a welded aluminum frame, and featured a differential GPS, a digital compass, cameras, and a light detection and range device (LIDAR). Getting the entire robot ready for the competition in one academic year was a large accomplishment, and earned the 2010 team the rookie of the year award at the IGVC. However due to time constraints, Prometheus had several problems during the first year competition, and was not competitive in the autonomous or navigation challenges. The 2011 team continued to build and improve upon the Prometheus platform. After entering Prometheus in the 2011 IGVC, many of the previous problems had been solved, allowing WPI to place competitively. This years IGVC team continued to improve upon the work done by the previous two teams as their Major Qualifying Project (MQP). An MQP demonstrates application of the skills, methods, and knowledge of the discipline to the solution of a problem that would be representative of the type to be encountered in ones career. This years goal is to greatly improve the intelligence of the robot. In order to fulfill this goal, an Extended Kalman filter, which reduces noise from sensors that localize the robot, and better line and obstacle detection methods are being implemented. These changes and additions are discussed in the following sections and the newest version is shown in Figure 1.6. At the top of the robot is the Trimble Global Positioning System (GPS) provides the global coordinates of the robot. Right below the GPS are Point Greys FL2C-08S2C cameras used for stereovision and behind those is PNIs High Accuracy Compass, which gives the heading of the robot. At the front of the robot is a Light Detection and Ranging (LIDAR) sensor used for obstacle detection. A new addition this year 6 (a) 2010 Prometheus (b) 2011 Prometheus Figure 1.5: Progression of Prometheus from the 2010 IGVC to the 2011 IGVC is the Arduino which replaced the compact reconfigurable IO (cRIO) module. There are Jaguars (motor controllers) and encoders in the rear and per requirement of the competition an emergency stop (E-stop) sits high on the robot for easy access should the robot perform in an undesirable and unpredicted way. There were several aspects of Prometheus that the 2012 team decided to leave unchanged. Most sensors on Prometheus are very expensive, including the LIDAR, GPS, cameras, and compass, and since the 2011 team didnt have any issues with any of these, our team saw no need to change the existing sensors. Prometheus’s sensors were also adequate for accurately detecting obstacles, lines, and position, so there wasn’t much need for any additional sensors, although a dedicated line detection camera was added. The computer hardware already on Prometheus consisted of an Intel i7 processor, 6 GB of DDR3 ram, a Tesla GPU, and a solid state hard drive. This was more than adequate for the computing Prometheus would be doing, so no changes were made to the primary computing hardware. 1.5.1 Systems in Identified for Improvement Prometheus 2011 had a system which successful integrated most sensors and motors on the robot. These include the two rear motors, front steered motor, SICK Laser Imaging Detection And Ranging sensor for obstacle detection, Trimble Differential Global Positioning System for absolute world position, Fly II cameras, PNI Compass and the front optical encoder for front wheel positioning. The system was lacking input from the rear optical encoders, which are imperative for accurate odometry. The 2011 architecture is laid out in Figure 1.7. The figure shows that the jaguars and compass, both of which can interface directly over serial, are first passing through the cRIO. There is also a router on board to handle communication between the cRIO and on board computer. The figure shows that the laptop is required to do any programming on the cRIO. 7 Figure 1.6: Components of Prometheus 2012. For 2011, the compass, lidar, encoder, jaguars, remote and status lights were fed into a National Instruments cRIO, shown in Figure 1.8. In the figure, the cRIO is the device in the very bottom of the picture. From the figure it is shown that the wiring is not organized, and that the cRIO is very large for use as an input and output device. The divider chips are located on the breadboard that is screwed onto the robot lexan. There are several shortcomings to such a system. The biggest issue that quickly arose was that the cRIO was a Field Programmable Gate Array (FPGA), a type of development board where the layout is rearranged every time the device is programmed. This meant that whenever new code had to be introduced it would take approximately 30 minutes to program. This was particularly undesirable since most of the changes would require testing and reprogramming, so each user change would have to be uploaded multiple times. The cRIO also required a separate PC to program, so whenever changes needed to be made to the cRIO code a separate computer needed to be brought in and connect to the robot. This system worked, but was not desirable. The cRIO communicated to the computer over Ethernet, and required a complicated handshake. Communication speeds were also slow compared to direct communication with the PC over serial. The biggest problem was that there were two separate code bases with this system, which left the data from the sensors separated by the Ethernet handshake. This lead to problems in the 2011 year when an Extended Kalman Filter was partially implemented, and the handshake required prevented the EKF from being implemented. The items that were marked for interface changes are described below. Compass The onboard PNI Compass is required to determine the orientation of Prometheus. In the 2011 year the compass communicated via the cRIO. This worked, however it was desirable to move the sensory input to the computer, where the GPS already send its data too, so that a full EKF could be realized. With a full EKF, more accurate position could be realized, even if one sensor had error. Jaguars The Jaguar speed controllers were interfaced with the cRIO in the 2011 year. Through research it was discovered that the Jaguar speed controllers had the capability to be controlled over serial communication. It was desired to move the Jaguars onto the main computer, for the sake of modularity and so that 8 Figure 1.7: 2011 System Architecture for Prometheus. the driving code was not split between two entities. Wheel Encoders Prometheus had several issues with the encoders on the rear wheels that prevented them from getting accurate information. The IC’s that were between the encoders and cRIO were dividers, and not encoder counters. This resulted in inaccurate readings, and prevented bi-directional measuring. In order to have an accurate EKF, there needed to be a correct implementation of encoders. A basic IO device was needed to interface the encoder chips with the computer. It was decided that the Arduino would be a good choice, because it integrated nicely with ROS. PID Control The 2011 Prometheus didn’t have a PID implementation to control the position of the front wheel or speed at which the robot drove. Instead the speed of the robot was set using a linear scale comparing speed to output voltage. It was decided that the 2012 team required more control than this, and a PID loop would have to be implemented. This would allow for more control over the robot, and better handling of tight moves and hills. Line Detection In order to qualify for the IGVC, it is necessary to detect white lines painted on the obstacle course. The 2011 implementation of line detection worked quite well, and was used successfully in the 2011 competition. Line detection is based primarily on the Hough Transform, which determines where lines most likely are in the image by first calculating possible lines that could intersect with each point in the image.(Hough, 1962) Lines that intersect with multiple points are considered to be a line in the image.(D. Fox & Thrun, 2004) The 2012 line detection implementation reuses much of the work completed by the 2011 team. Changes include adapting for integration with our new navigation system, editing the program for easier tuning, and further increasing the reliability by adjusting algorithm parameters. Navigation The 2011 implementation utilized a custom made mapping and path planning system based upon the A* path planning algorithm and tentacle approach for driving the robot along paths. Tentacles were also used in the 2010 IGVC implementation, and functions by projecting a series of arcs for the robot to potentially drive on. A series of factors are used to weigh which arc is the most ideal way for the robot 9 Figure 1.8: Contents of the cabin of the 2011 Prometheus. to traverse along a planned path. There were several inherent problems with the navigation implementation used by the 2011 IGVC: an inability to properly avoid obstacles that often resulted in often hitting obstacles before avoiding them, and a lack of adjustability that made tuning the navigation system difficult for specific environments. To overcome these problems, the 2012 navigation was based upon the open source Navigation Stack provided with ROS. The navigation stack provides a robust path planning system utilizing Dijkstras Algorithm(web, 2010), and a tentacle based approach for guiding the robot along planned paths. While this is a similar approach to the 2011 implementation, the navigation stack includes many more features including the ability to inflate a margin of safety around obstacles, and precisely define and tune numerous parameters. Additionally, the navigation stack preforms much faster, allowing the robot to detect and react to obstacles before hitting them. These improvements have proven greatly improved performance and reliability. 1.5.2 GPU Implementation of Stereo Vision The 2010 Prometheus team wrote a GPU accelerated stereo vision processing algorithm from scratch. However, the algorithm failed to produce reliable results, and was not included in the final revision of the code. The 2011 Prometheus team also attempted to make a reliable stereo vision algorithm, and also failed to get high quality results. The 2012 team found an existing stereo vision implementation included with ROS in the form of the stereo image proc node. This node performs stereo vision processing and produces a threedimensional pointcloud of the space the cameras are seeing. The disadvantage of using this implementation is that it is not GPU accelerated, and therefore it has trouble producing realtime results. Instead, the team utilized several GPU accelerated open source vision processing algorithms provided by the OpenCV library. This allowed the team to focus on tuning and tweaking the parameters of the algorithms to produce reliable results, instead of having to spend a large amount of time debugging and tracking down errors like the previous years did. 10 1.5.3 Extend Kalman Filter While extensive research was done on the Extended Kalman Filter the previous year, they did not have enough time to implement it. The team ran into problems fusing the GPS data with the encoder and compass data, so the filter was not used. Previously it was written in LabVIEW, but since that program was not used this year, it was written in Python and integrated in ROS and it successfully receives information from the encoders, compass, and GPS. Encoders The encoders being used are two US Digital E8P Optical Qudrature Encoders with 512 counts per revolution. The encoders have a maximum rating of 60 kHz and are mounted directly to the motor shaft which allows for higher resolution measurement of the driving wheels.(Akmanalp et al., 2011) Last year the code for the encoders was written in LabVIEW and mapped to the cRIO and caused that years team problems. This year the code for the encoders was written in C++ and integrated into ROS and is more reliable. It provides distance traveled to the extend Kalman filter. GPS It was determined by last years team that the Trimble AG252 GPS was sufficient for the purposes of this competition. Their requirements were that the GPS must have high accuracy and an update rate of 5Hz or more. During testing, the Trimble GPS had consistent performance and a subscription that further improved prometheus performance.(Akmanalp et al., 2011) The GPS is subscribed to the OmniSTAR HP subscription. According to OmniSTARs website, the correction service has about a 10 centimeter accuracy. The GPS code from the previous was already written in Python and integrated into ROS. It works extremely well and therefore was kept and integrated into this years code. It reports the X and Y coordinates relative to the starting position, the latitude and longitude, and UTM of Prometheus. The relevant information for the extended Kalman filter are the X and Y coordinates. Compass The compass used was PNIs High Accuracy Electronic Compass Module. Previously this compass was configured using LabVIEW and run through an RS232 to USB converter. Since the cRIO was removed, the compass was hooked directly up to an RS232 port. It was interfaced with ROS in Python by sending the correct Hex sequence requesting information. The retrieved information was then converted into readable data using IEEE 32 bit floating point conversion. The reported data was the heading, pitch, and roll of the robot. The compass and orientation are shown below. (a) Orientation (b) PNI Figure 1.9: Various views of the compass: (a) orientation of the axes and (b) the physical hardware 11 1.5.4 Navigation and Costmap The 2011 implementation utilized a custom made mapping and path planning system based upon the A* path planning algorithm and tentacle approach for driving the robot along paths. Tentacles were also used in the 2010 IGVC implementation, and functions by projecting a series of arcs for the robot to potentially drive on.(Chen et al., 2010) A series of factors are used to weigh which arc is the most ideal way for the robot to traverse along a planned path. There were several inherent problems with the navigation implementation used by the 2011 IGVC: an inability to properly avoid obstacles that often resulted in often hitting obstacles before avoiding them, and a lack of adjustability that made tuning the navigation system difficult for specific environments. To overcome these problems, the 2012 navigation was based upon the open source Navigation Stack provided with ROS. The navigation stack provides a robust path planning system utilizing Dijkstras Algorithm, and a tentacle based approach for guiding the robot along planned paths. While this is a similar approach to the 2011 implementation, the navigation stack includes many more features including the ability to inflate a margin of safety around obstacles, and precisely define and tune numerous parameters. Additionally, the navigation stack preforms much faster, allowing the robot to detect and react to obstacles before hitting them. Dijkstras Algorithm was found to preform faster than A*, with better reliability at finding the most direct path. (web, 2010) These improvements have proven greatly improved performance and reliability. There were several inherent problems with the navigation implementation used by the 2011 IGVC: an inability to properly avoid obstacles that often resulted in often hitting obstacles before avoiding them, and a lack of modularity that made adding or adapting multiple sensor streams difficult. To overcome these problems, the 2012 navigation was based upon the open source Navigation Stack provided with ROS. The navigation stack provides a robust path planning system utilizing Dijkstras Algorithm, and a tentacle based approach for guiding the robot along planned paths. Tentacles were also used in the 2010 and 2011 IGVC implementations, and functions by projecting a series of arcs for the robot to potentially drive on. A series of factors are used to weigh which arc is the most ideal way for the robot to traverse along a planned path. 1.6 Goals and Requirements The goal of this MQP is to make Prometheus more competitive for the IGVC than it has been in the past and place in the top 5 at the competition. In order to become more competitive, Prometheus must be able to make it to several waypoints, while avoiding obstacles and staying between lines successfully and consistently. Since the robot is sound mechanically and electrically, there was much focus on its intelligence. The following are our requirements: Simplify the system architecture. Improve intelligence by implementing new algorithms and methods of navigation. Create a system that can be easily picked up by another team to continue performance enhancement. Autonomously navigate through a flat, outdoor, static environment given no prior state information Autonomously follow and stay within a path marked by two lines on a grassy field Plan a path and autonomously navigate to several GPS coordinates that are given as input while avoiding obstacles 12 In order to simplify the system architecture, we will remove unnecessary components to implement new efficient and non-invasive ones. Moving most of the processes into one system, so that most sensor information is easily accessible to other sensors, will allow for future teams to readily adapt to the software environment. Use of the LIDAR and cameras will allow for obstacle and line detection. The GPS, encoders, and compass will allow for localization of the robot, which will provide a means for navigation. 1.7 Paper Overview Prometheus has several different subsystems and each of these subsystems was modified and analyzed to produce optimal results. As a result the remainder of the paper is broken down into sections that address each subsystem individually. The three subsystems focused on are the Drive System, Obstacle Detection, and Navigation System. Each subsystem also contains various smaller components that fall under each of these three categories and are addressed as well. 13 Chapter 2 Drive System With a focus on modularity and ease of use the development of a robust and user friendly low level architecture was an imperative improvement for Prometheus in the year 2012. For the scope of this report, low level architecture is defined the control and communication with the sensors and motors on the Prometheus robot. Have a reliable system in place for these tasks allows for more time to be spent on upper level programming, such as path planning and intelligence. Having a system that is easily understood and modular allows for future sensors to be integrated with minimal effort. 2.1 Methodology Prometheus came into the 2012 year with a full array of sensors that would be remaining the same. The Differential Global Positioning System allowed for the robots absolute position in the world to be determined. The robot incorporated speed controllers, which take in a signal from a device, as well as a constant voltage source and outputs a voltage that will drive the motors at a desired rate. The model of speed controller on the robot is known as a Jaguar. This system remained the same, except that the controlling signal would be coming straight from the computer. For 2012 it was desired to have as much communication as possible be direct to the PC. Two ROS nodes were written in order to allow the compass and Jaguars to communicate directly with the PC. This also required a new serial card with 4 ports on it (1 for the DGPS, 1 for the Compass, 1 for the Jaguars and 1 for the Lidar). A new card was installed on the robot, and custom drivers were implemented. With these sensors going direct into the computer any programming that is required dealing with these sensors can be done direct on the robot, without having to upload the code. This allows for exponentially faster programming. With these sensors successfully communicating directly with the computer, the status lights, encoders and remote still needed to be incorporated with the robot. The desired solution needed to be able to be expandable, durable, and have room for future expansion. It was determined that an Arduino AtMega would be the best solution. The Arduino an be programmed quickly direct from the robot, is modular, and is cost effective should it ever need to be replaced. The 2012 architecture is shown in Figure 2.1. It was desired to use the rear encoders for the 2012 year. Optical encoders are measurement tools that allow for the rotation of a shaft to be easily reported. To make the most out of these values, it was decided 14 Figure 2.1: 2012 System Architecture for Prometheus. to create a breakout board for the Arduino that would have encoder counter chips on it. This board would also incorporate driver circuits for the LED status lights, as well as a simple circuit that would cut power to the Jaguars when a signal from the remote was received, allowing for reliable E-Stop. The circuit for the wireless e-stop is shown below in Figure 2.2 while the finished breakout board is shown in Figure 2.3. Figure 2.2: Circuit Diagram for the Wireless E-Stop. The 2011 Prometheus robot did not have Proportional Integral Derivative control. PID control is a commonly used way to reduce oscillation when control the motion of an entity, based off of where the current position is in relation to the desired position. The 2011 robot did not have accurate control over the velocity of the robot, however the more obvious indication that the robot was lacking PID control was that the front steered wheel would oscillate significantly. In order to have a robot capable of operating smoothly at the low level a PID loop was implemented to control the velocity of the rear wheels, as well as the position of the front wheel. The Arduino contained code that allowed for controlled publishing and receipt of data. A flowchart of the code is shown below in Figure 2.4. The Arduino has three functions: 15 Figure 2.3: Breakout Board Developed to Interface with the Arduino Mega. 1. Poll the RC Controller values 2. Publish the encoder values 3. Update the status lights The RC values needed to be polled constantly, and it was required to publish the encoder values in a timed loop for PID control. Since all of the functions on the Arduino took a set time, it was determined that an interrupt was not necessary. Instead, the Arduino code receives remote values; changes status lights, publishes encoder values and clears encoder values in a set loop. Figure 2.4: Software Flowchart of the Arduino Mega. The Arduino sends out the information it gathers to a node running on the computer. The listener on the computer uses the encoder values sent out by the Arduino to run PID loops to control the position of the front wheel, and the speeds of the rear wheels. This is an improvement over previous years, where speed control was done by sending the Jaguars a voltage. The same node also listens for the values from the remote control, to determine which mode it is in, and the wheel positions and speeds if the robot is in tele-operational control. Once the desired speeds and positions of the wheels are known, these values are 16 sent to another node on the computer that takes the identification number of the jaguar and a desired speed, and outputs the required serial command to the correct jaguar. The Arduino was chosen in part because there was already a ROS library available. The code on the Arduino had several goals, the first being to receive the remote values for both tele-operational control, and for the wireless e-stop. The code to read the remote can be seen in Figure 2.5. Figure 2.5: Portion of the Arduino’s Code that Interfaces with the Remote Control. There is a pin set depending if the receiver is receiving a signal from the remote or now. If it is set high, the remote is connected and can be read, and the value for each switch on the remote is read into the computer. If the remote is not connected, the values for each item on the remote are set low, so that noise is not interpreted as user issued commands. The remote data is pushed into rc data.data, as well as whether or not the remote is connected. The Arduino was also tasked with reading in the values from the three wheel encoders. This was accomplished by reading in the values from the encoder ICs, sending the values to the computer, clearing the values for the rear wheels, then repeating. The code for this task can be seen in Figure 2.6(a). (a) readWheelEncoders (b) read and reset Counter Figure 2.6: Portion of the Arduino’s code that (a) reads the data from all three wheel encoders and (b) reads the data from each individual encoder The values from the encoders are read in from the function shown in Figure 2.6(a) team written functions that get the encoder counts over serial communication. These are placed into the encoders array. This data is then published, so that any ROS node can see it. After the data is published, the rear encoders are cleared 17 using another function shown in Figure 2.6(a) to allow for speed control. The Arduino also needed to directly set the LED light color based on the remote input. This was a simple task, since each color of LED was hooked up to a different pin on the Arduino. The value received from the autonomous switch and the E-Stop switches would be a high or low number based on their positions. To accomplish the task the pin corresponding to the color LED that needed to be turned on based on the switch positions was set high. This operation is shown in Figure 2.7. Figure 2.7: Portion of the Arduino’s Code that Interfaces with the RGB LEDs. The Arduino would simply run these programs in a loop, since they did not have to be done at a specific rate, as long as every loop was the same amount of time. This was automatically the case, since all of these operations took a fixed amount of time. On the computer side, several important actions had to be completed. The node on the computer needed to listen for the encoder counts, listen for velocity commands, and output speed commands over serial to the jaguars. This was accomplished with PID loops and odometry equations based on the robot geometry. The first item to accomplish was a PID loop. It was decided to make this a generic function to keep the code to a minimal size. The coded PID loop is shown in Figure 2.8. Figure 2.8: Portion of code for the PID Loop that controls the position of the front wheel. The PID loop function takes in the desired position, current position, previous error, total error, proportional, integral and derivative error, as well as a buffer that determines if the desired move is close enough to the end goal. We then calculate the error, and if it is bigger than the set buffer run the PID loop. We then added the current error to the total error, and return the PID output. The code on the computer needed to handle the incoming messages from the wheel encoders. The following function, shown in Figure 2.9, shows what happens each time a set of encoder values comes in from the Arduino. The three Jaguars are chained together on the robot, and a unique ID is set to distinguish each controller. After this the three wheel encoder values are read into the variables passCurrent, driverCurrent and 18 Figure 2.9: Portion of code that parses the encoder data and processes it . frontCurrent. The front counts are converted to degrees, and the rear to meters per second. These are then added to the total sum of encoder values. Figure 2.10: Portion of code that determines if Prometheus is in autonomous mode and sets the coresponding values to the wheels. The next function, shown in Figure 2.10, sets the voltages if the robot is in autonomous mode. This function operates on the wheel encoder values as well as the velocity commands from the mapping node. The velocity commands are read in as xdist and ztwist. Special cases are set for if the robot needs to go straight or turn in place. The wheel speeds for the rear wheels and the position for the front wheels are set using the desired distance and angle. The angle of the front wheel is capped to prevent it from rotating over 90 degrees. The code for tele-operational mode is a direct proportional control based off of the vales coming in from the Arduino, which come from the remote. This code is not shown here, but can be seen in the appendixes code. The function that accomplished this is remoteCallback, and it operated every time values come into the node from the remote. There is a separate function to take the scaled output from the node that communicates with the Arduino and converts it to serial. This output is then sent to the jaguars in the same node. The function to convert the scaled output to a serial command is shown in Figure 2.11. 19 Figure 2.11: Portion of code that communicates with the Jaguars. Figure 2.12 shows the structure of the ROS nodes centered on the Arduino. /Serial node represents the code running on the Arduino. The values from the remote and the wheel encoders go to the /jag listner node, which is the code that runs on the robot mentioned above. /remoteControl is the values from the remote, and /wheelEncoders are the values from the encoders. Also pictured is /cmd vel, which goes into the /jag listener node. /cmd vel is the distance and theta command from our mapping node. The line coming off of the bottom of the /serial node is what transmits the encoder information to the EKF. Figure 2.12: Portion of the RXGraph that deals with the Jaguars. 2.2 Results After the new system was fully in place, a few results were immediately noticeable. With the cRIO gone, and the Arduino mounted to the shield, there was a noticeable increase in space inside of Prometheus. Programming the Arduino was easy with the included Arduino IDE, and downloading code required no external computer, and was almost instant. The system redesign was first tested using remote control. Operating the robot in tele-operational mode allowed for Prometheus to move around very reliably. All of the sensors were tested under the new design, and all functioned without an issue, with no decrease in performance. After implementation, it was determined the best way to test the improvement expected from better communication and rear encoders was to do a distance test. Prometheus was driven a set distance of 3.5 meters with the old architecture, then the new. The results are shown in Figure 2.13. 20 Figure 2.13: Results of the conversion to discrete encoder ICs. The improvement is easily distinguishable. With a better sense of distance traveled, Prometheus will have better information of its position during the competition. The system has proven robust in our testing, with no issues at all since implementation. It was also desired to see how well the robot was able to accomplish driving arcs. The results for this were gathered by assigning the robot an arc to drive, and recording the encoder values. An arc was hard coded into the robot driving node. The resulting encoder values were then plotted to see how far the robot deviated from the path. The results are shown in Figure 2.14. Figure 2.14: Actual vs. Expected results of driving an arc. 2.3 Discussion The 2012 changes made to the drive system proved very functional and reliable. The robot reliably acted upon the move commands it received during autonomous mode, and the remote control mode proved robust as well. The stop circuit proved very reliable, and it is used every time the robot is used. This system offers several improvements over previous years; however there is still room for improvement. From the graphs shown in the results section, we can see that the robot clearly directly follows the commands it is given. It is shown that the robot slightly deviates from the assigned path while driving the arc; however that could be attributed to encoder slip. We can say that the current driving implementation is fully sufficient for the competition. The current system, as previously mentioned, is quick to program and can be done from the robot 21 computer. There were no issues when uploading code changes to the Arduino. Throughout the months of testing that were completed, there was never a single issue with the low level architecture that was developed. There are many advantages that will help future users. The Arduino is fully self-sufficient, starting up on its own with the computer, and operating on the computer power. It has plenty of room for expansion, should it be used for other purposes in the future. Should there be a need to replace the encoder counter ICs, the breakout board has been designed so that they are easily replaceable. The code base around the Arduino is easy to use, and will work easily with a changing code base. The code to control the motors simply subscribes to a topic. In order to drive the motors a command of theta and an x distance just need to be sent to the motor node. This means that if a future team decides to change the navigation algorithm, all they need to do is publish a message that the motor node can subscribe to, without changing anything in the Arduino or motor code. This system is certainly proven to be robust; however there is room for improvement. Currently, if the Arduino is unplugged while the computer is on it can be reassigned by the computer to a different port, which can cause communication issues. Restarting the computer or changing the port will correct the issue. The breakout board was originally designed to be printed, however there was not sufficient time or funds to print one. A printed board would be a more permanent solution. Currently the front encoder is an optical encoder, which tends to lose counts when the robot is bouncing around. A potentiometer would be a better choice for the front wheel, since it should never be turning a full 360 degrees 22 Chapter 3 Obstacle Detection System The obstacle detection system on Prometheus consists of several sub-systems. A Laser Image Detection And Ranging sensor, known as a LIDAR, returns obstacles in front of the robot. A stereo vision system also provides information about obstacles in front of the robot, which can be checked against data from the LIDAR to ensure that we have accurate information. The final piece of the obstacle detection puzzle is the line detection system. The IGVC requires robots to avoid lines, and this system handles that requirement. Detailed descriptions of the implementation and effectiveness of each of these systems is outlined in this chapter. 3.1 LIDAR A Laser Image Detection And Ranging sensor, known as the LIDAR in this report, is a sensor that uses a laser to detect obstacles in all lighting conditions. Similar to an ultrasonic or infrared sensor, a LIDAR measured the travel time of the laser beam to detect the distance to obstacles. The beam is reflected by a spinning motor, which allows for a larger field of view than conditional rangefinders. The location of obstacles can then be determined using the angle and length of the beam and simple trigonometry. 3.1.1 Methodology The implemented Costmap allowed for the LIDAR obstacles to be easily added to the map as a Laserscan topic. There also existed a ROS package and wrapper which allowed for easy interfacing with the SICK LIDAR. The system architecture redesign left the LIDAR ready to use on a serial port, allowing for a port to simply be hard coded into the software. Several parameters are set, including update rate, port, and obstacle persistence. After these settings were correct, the LIDAR obstacles an be viewed in the map, and several more adjustments needed to be made. The LIDAR on Prometheus was manufactured in 2005, and had some persistence issues. The LIDAR would consistently see obstacles on the outside edges of the 100 degree scan it was completing. To solve this issue the obstacles directly on the edges of the scan were removed completely. Additionally, obstacles detected with LIDAR could only be cleared using ray tracing. This proved challenging, since the LIDAR 23 could not trace outdoors, since any location where there is not an obstacle will return a max reading. This was compensated for by changing any max reading to a finite reading, so that every time the LIDAR scanned obstacles that should not persist would clear. This node simply subscribed to the published Laserscan, and published a fixed Laserscan. 3.1.2 Results Figure 3.1 depicts the results of the LIDARs LaserScan as seen in CostMap in comparison to the picture of the robot and the course it is viewing. The red outline is the footprint of Prometheus, the red dots are the obstacles as seen by the LIDAR and the yellow is the inflated obstacle space. (a) Real World (b) CostMap Figure 3.1: Comparison of the (a) actual real world obstacles with (b) the obstacles as seen by the LIDAR Actual obstacle position compared to the position depicted by the lidar for a slightly different course than the one shown above can be seen in Figure 3.2. Figure 3.2: Actual vs. Expected obstacle locations as seen by the LIDAR 3.1.3 Discussion The SICK LIDAR on Prometheus is a very precise tool, and this is shown in the results above. In all cases the LIDAR detected obstacles with centimeter accuracy. Results from the LIDAR were very repeatable, and 24 were not affected by lighting conditions. A LIDAR is the best choice for obstacle detection for the IGVC course. Through the year that the 2012 IGVC team worked with Prometheus, the results from the LIDAR seemed to be getting less repeatable as the year went on. The cones started out as half arcs with many points, but towards the end of the year the cones would show up as a few scattered points in no particular shape. The LIDAR than began having connectivity issues, and would die while running. In order to have a competitive robot, a new LIDAR would be a worthwhile investment. Newer LIDARs also offer a wider angle of scan, and a higher frequency of scans. 3.2 Stereo Vision Stereo vision is a process that uses images from two cameras to compute depth information about the scene in view. The two cameras are pointed in the same direction, but are apart slightly, so each camera has a slightly different view of the scene. Objects that are closer to the cameras will have a greater difference in position between the two images. This difference in position is known as disparity. Because the depth of an object is proportional to its disparity, it can be calculated by simply measuring the disparity and comparing it to calibration data. By computing the disparity of every pixel in the image, a disparity map is formed, showing the relative depth of every point in the image. Since this must be done for every pixel in an image, and there are almost half a million pixels per image, for fifteen images per second, this is a very computationally expensive process. A graphics processing unit (GPU) is a piece of computer hardware that is specially designed to run one algorithm on many different data points simultaneously. This parallelization makes a GPU perfect for image processing, because often each pixel in an image needs to have the same computation performed on it. However, there is a downside to GPU acceleration: it takes a relatively long time to transfer data from the CPU memory to the GPUs memory. This tradeoff must be considered when using a GPU for general purpose computing. 3.2.1 Methodology There are many different algorithms that will produce a disparity map. The Open Computer Vision (OpenCV) library provides two GPU-accelerated functions that will produce disparity maps; one is based on belief propagation, the other is based on block matching. Block matching is done by taking a block of pixels from one image and searching the other image for a similar block of pixels. Belief propagation uses Bayesian inference to find the most likely disparity map. Our team decided to use the block matching approach because the built in ROS stereo vision processing used the block matching approach, and the algorithm was simpler to understand. Many of the OpenCV functions require calibration data to give useful results. Calibration approximates inherent camera parameters such as the relative orientation of the cameras, and their fields of view. Calibration is accomplished by a built in ROS node called camera calibration. To calibrate the cameras, a team member holds up a printed checkerboard in various positions and orientations. The calibration node searches the incoming images for the checkerboard pattern, and if it finds the checkerboard in both images, it saves the data point. Once it has enough data points, the calibrator calculates several distortion matrices for use by the other stereo vision algorithms. 25 The main steps of the stereo vision algorithm are shown in Figure 3.3. Figure 3.3: Stereo Vision Flowchart The first step of the process is to blur both images. This is done by sampling the pixels within a certain radius of the pixel being blurred, and performing a weighted average of their values. The blurring reduces noise in the image, which helps the block matching algorithm. Each image is then rectified. Rectification is a process that distorts the left and right images so that they each show the same objects in the same orientations and at the same height. Rectification is done by the OpenCV function remap, and requires calibration data to tell it how to distort the images properly. This calibration data comes from the OpenCV function initUndistortRectifyMap. Rectification is necessary for block matching to work efficiently; with objects at the same height in both images, the block matching algorithm only has to search horizontally for a similar block, instead of searching horizontally and vertically. Below is an image straight from the camera (top) and the image after blurring and rectification (bottom). The right side of the image is removed by the rectification algorithm, because it lies outside the field of view of the other camera. Some of the code demonstrating the implementation of blurring and rectification is shown below in Figures 3.6 and 3.5. Figure 3.5 shows a piece of code that uses calibration data to calculate a rectification matrix, which is used by the GPU-accelerated remap function in Figure 3.6 to perform the rectification. Figure 3.6 also shows the use of the GPU-accelerated blur function. Figure 3.4 shows a test image (left) taken by the left stereo camera along with the same image after the blurring and rectification process. Notice that the chair legs and table on the far right of the raw image are not present in the rectified image. This is because these objects are outside the field of view of the right camera, so this portion of the image is not useful for the block matching algorithm. The next step in the block diagram (Figure 3.3 is block matching. For every pixel in one image, block matching takes a certain number of pixels on either side of it and searches the other image for the same set of pixels. Then the difference in horizontal distance between the two images is calculated. This difference is proportional to the depth of the pixel in question, and the depths of all the pixels put together are called a disparity map. There are two parameters that are used to tune the algorithm: number of disparities, and block size. Block size is the number of pixels on either side of the pixel that is having its disparity 26 (a) RealWorld (b) RectBlur Figure 3.4: Comparison of the (a) actual real world image with (b) the blured and rectified image used for stereo vision Figure 3.5: Portion of code used to generate the common parameters used in block matching calculated. A lower block size will be more sensitive to edges, but can report incorrect disparities if there arent enough pixels to find the correct match. A higher block size will be less sensitive to edges, but provides more consistent depth information. Example right and left rectified images and disparity image are shown in Figures 3.7 and 3.8. Points that are closer to the robot are lighter gray, and points that are further away are represented in darker gray. The white spots around the cone and barrel are due to occlusion, which is one camera being able to see areas of the scene that the other camera cant see. The noise due to occlusion is removed in the obstacle detection portion of the algorithm. Block matching produces a disparity map, which is sent to the makepointcloud node for obstacle detection. It was necessary for makepointcloud to be its own node because it is too computationally expensive to run in the same process as the block matching and image preprocessing. The first step makepointcloud takes is to project the information in the disparity map into a three dimensional pointcloud. This is done by another OpenCV function, reprojectImageTo3D, which also relies on information obtained by camera calibration. The next step is to do a transform on the pointcloud to change from the point of view of the cameras to a global point of view. The only difference between the cameras’ point of view and the global view is that the cameras are angled down at about 45 degrees. This rotation can be compensated for using by using the equations below where ẋ, ẏ, and ż are the coordinates of a point in the camera’s coordinate frame, and x, y, and z are the coordinates of the point in the global coordinate frame. Once the pointcloud is transformed, the ground plane of the image is removed by getting rid of all points below a certain height. [h]x = ẋ (3.1) [h]y = ẏ ∗ cos θ + ż ∗ sin θ (3.2) 27 Figure 3.6: Portion of the code used to generate a disparity map Figure 3.7: The left and right rectified images as seen by Prometheus [h]z = ż ∗ cos θ + ẏ ∗ sin θ (3.3) To detect obstacles, each remaining point is projected down onto a grid of 1x1 cm squares. The number of points in each square are counted, and weighted based on the square of the distance from the robot This weighting is necessary, because an object that is close to the cameras will take up a relatively large portion of the image, and will therefore have a higher number of points lying on it than an image farther in the background. The final step of obstacle detection is determining which squares on the grid have a weight that is greater than some threshold which must be found experimentally. 3.2.2 Results Figure 3.9 shows an image of the detected obstacles (red) and their inflation (yellow) with Prometheus represented by the red outline and is the output of stereo vision based upon the input as seen in Figure 3.7. The smaller cone in the foreground of the image is represented by the four red dots directly in front of Prometheus’s outline. While the larger cone and the desk located in the background of the image are represented by the larger clusters of red dots. 3.2.3 Discussion The stereo vision system as seen in Figure 3.9 is reliable and robust in its representation of the various obstacles commonly detected by Prometheus. It will consistently detect obstacles in its field of view and place them correctly into the Costmap. Unfortunately, the cameras are somewhat fragile, and an electrical short in Prometheus damaged them during the experimental testing phase of development. This resulted in limited quantitative testing. Further testing should be done to determine exactly how accurate stereo vision is at detecting obstacles’ positions. There are also many parameters that can be adjusted to tune stereo vision, as well as many different filtering techniques and optimizations that may produce better results or faster processing. Some options that could be explored include bilateral filtering to post-process the disparity map, 28 Figure 3.8: The Disparity Map produced by Prometheus Figure 3.9: The Costmap interpritation of a disparity map edge detection to improve the disparity map, three-dimensional object detection on the pointcloud instead of the current implementation, and sharpening the input images after blurring to better preserve edges. 3.3 3.3.1 Line Detection Methodology Line detection was implemented using the OpenCV image-processing library. The flow chart in Figure 3.10 shows the line detection process. First, the line detection node subscribes to camera feed from the Microsoft LifeCam used for line detection, as seen in Figure 3.11. Next, a perspective transform is preformed to remove any distortion from the source image, because the camera is mounted at an angle with respect to the ground. Figure 3.12(a) shows two parallel lines taped on the floor. However, because the camera is mounted at an angle, the camera view becomes distorted. Figure 3.12(b) shows the lines after the perspective transform has been performed. After the perspective transform is complete, the white objects in the image are extracted, and the rest of the image is set to black. Because white lines are the only objects desired, this helps to eliminate noise or false detections in the remaining steps of the line detection process. The desired range of white values to be extracted is supplied as a command line argument when the line detection node is launched. The exact 29 Figure 3.10: Flowchart of the Line Detection Process Figure 3.11: ROS nodes dealing with line detection color of the lines can vary depending on lighting conditions, so it is important that this value can be easily changed. Finally, a Hough Transform is applied to the black and white image. The Hough Transform determines where lines most likely are in the image by first calculating possible lines that could intersect with each point in the image. Lines that intersect with multiple points are considered to be a line in the image. The Hough Transform then returns the end points of found lines. The line end points are returned in pixels, so they must be converted to distance values in meters, using the measured frame size of the camera. Next, a coordinate system transform must be performed, because the OpenCV uses a different coordinate system than CostMap. After the conversions are performed, a series of points is fitted along each line, to allow them to be represented in the occupancy grid. This is accomplished by using the end points to calculate the slope and y-intercept of the line. The equation y=mx+b is then used to calculate x and y values for each point that lies on the line between the end points. These points are then stored in the ROS Pointcloud format a 3 dimensional array for input into the Costmap. This process can be seen in Figure 3.13. 3.3.2 Results Figure 3.14 shows an example of the result of the line detection process. The top portion of the image shows the line painted on the ground, as the robot sees it. The image below shows the line after it has completed line detection and been imported into CostMap. As previously mentioned, the red represents the actual line, and the yellow is a margin of safety. It should also be noted that the slope and shape of the line closely resembles the source image. Furthermore, it can be seen that the line occupies thirty grid cells, corresponding to a length of three meters. The camera field of view was measured to be three meters. 30 (a) Real World View (b) Rect View Figure 3.12: Comparison of the (a) unrectified camera image with (b) the rectified image Figure 3.13: Portion of code that generates the pointcloud for input into CostMap Because the line is consuming the entire field of view, this indicates the line is being sized correctly. Outdoor testing has shown that line detection is very reliable once the color selection portion of the algorithm is properly tuned for the current lighting conditions. That is, the shade of white seen by the camera will change depending on the current lighting, and the line detection must be updated to detect only the shade of white the lines currently are. If the range of whites is set too broady, undesired objects can be detected as lines, such as glare reflecting off the grass, or dead, tan patches of grass. Figure 3.15 below shows lines detected while driving a course. The circular obstacles represent cones, not lines. 3.3.3 Discussion While the line detection works quite well once tuned, the tuning process is time consuming and provides no compensation for lighting changes that may occur while the robot is driving. The current approach is to set the range of acceptable white values wide enough to allow compensation for minor changes, while still 31 Figure 3.14: Results of the line detection algorithm preventing undesired interference. This method has not presented a significant problem during testing, but could very well be an issue in areas with less stable lighting, such as areas with a lot of foliage. Given more time, dynamic approaches that automatically adjust the white values could be implanted using a known color with in the image, such as the green of the grass. Additionally, a GUI front end for the line detection could be developed, allowing parameters to be adjusted in real time, instead of the current implementation, which requires re-launching the node between changes. This GUI could then be used to save known configurations for specific environments. 32 Figure 3.15: Results of the Line Detection algorithm at the end of a test run 33 Chapter 4 Navigation System The 2012 navigation was based upon the open source Navigation Stack provided with ROS. The navigation stack provides a robust path planning system utilizing Dijkstras Algorithm, and a tentacle based approach for guiding the robot along planned paths. While this is a similar approach to the 2011 implementation, the navigation stack includes many more features including the ability to inflate a margin of safety around obstacles, and precisely define and tune numerous parameters. Additionally, the navigation stack preforms much faster, allowing the robot to detect and react to obstacles before hitting them. Dijkstras Algorithm was found to preform faster than A*, with better reliability at finding the most direct path.(web, 2010) These improvements have proven greatly improved performance and reliability. 4.1 Mapping Obstacles and CostMap For the robot to navigate around obstacles, it’s necessary to perform sensor fusion and create an occupancy grid. This accomplished using the Navigation Stack package CostMap, which takes in information from the LIDAR, Stereo Vision, Line Detection, and EKF, to represent the robot and the world around it. 4.1.1 Methodology When configuring CostMap, two maps are created: the Local CostMap and the Global CostMap. The Local CostMap is used for real time sensor information, and is used to plan the robots immediate path. The Global CostMap shares the Local CostMaps sensor information, and is used to plan the entire path the robot will take from start position, to end goal.(ROS, 2010) Figure 4.1shows the configuration data that is common to both the local and global CostMap. First, the footprint of the robot must be defined. This is a series of points, which allows the navigation stack to model the shape of the robot. Next, sensor information must be configured. The LaserScan is a two dimensional, polar coordinate representation of obstacles, and is the default format for the incoming data from the LIDAR. A point cloud, a three-dimensional array, and is used to import data from the line detection and stereo vision. Each sensor is defined as a separate line item, such as laser scan sensor representing the LIDAR. This information tells CostMap what topic the sensor information is published on, and provides 34 Figure 4.1: The common parameters used by both the local and global CostMap. additional configuration information, such as the obstacle marking and clearing. Figure 4.2 shows the topics the Navigation Stack node, which is named move base, subscribes to. This includes the LIDAR, stereo vision, and line detection. For each sensor source CostMap also subscribes to a tf, or coordinate system transform, so CostMap is aware of the sensors position, with respect to the center of the robot. Another tf from the EKF provides the robot’s current location with respect to the map origin. Finally, the obstacle inflation is configured. Obstacle inflation provides a margin of safety around obstacles, to ensure the robot doesnt navigate too close to them. The red cells indicate the definitive position of the obstacles, and the yellow cells indicate a margin of inflation for safety, as seen in Figure 4.3. This is also necessary because the path the robot will follow is calculated from the robots center. Obstacle inflation allows the navigations stack to account for the width of the robot, and ensure the chosen path wont allow any portion of the robot to intersect with any obstacles. By default, CostMap calculates the size of Obstacle Inflation based upon the robots footprint, as seen in Figure 4.4. There are two inflation radiuses used: inscribed radius and circumscribed radius. The inscribed radius is created from the inner radius of the robots footprint. Anytime the robot is a distance less than the inscribed radius away from an obstacle, this is considered cost-inscribed, meaning the robot will intersect with an obstacle. The second inflation value, circumscribed-radius is calculated from the outer perimeter of the robot. This radius is used to determine when the robot might possibly collide with an obstacle, depending on orientation. For instance, Prometheus has a much greater radius extending from the front, instead of the sides. When the robot is a distance less than the circumscribed-radius from an obstacle, this is considered cost-possibly-circumscribed. Attempts are made to avoid driving in a cost-possibly-circumscribed state at all times, except when there is no other path possible. However, field-testing proved that while this prevented the robot from hitting obstacles, in some cases it would still drive very close to them. As a result, the navigation stack was modified to include the parameter, inflation radius scale, which allows a custom value for the inflation to be defined. Figure 4.5 shows an example of obstacle inflation that has been increased to twice the default value. It can be seen in this case, the path is planned a greater distance from the obstacles ensuring the robot remains a safer distance away. Once the CostMap is successfully populated with sensor data, the path-planning portion of the navigation stack is configured. As stated above, the navigation stack is aware of the robots current position by subscribing to a tf published by the EKF. Next, a goal must be sent to the navigation stack, so a path can be planned from the start to end position.(ROS, 2010) At the IGVC competition, goals are supplied in the form of a series of GPS waypoints the robot must navigate to throughout the obstacle course. Software was written that allows the these GPS way points to be fed into the navigation stack as a series of comma separated values, and executed sequentially. 35 Figure 4.2: Navigation Stack Flowchart. 36 Figure 4.3: The obstacle inflation and path planning results of CostMap. Figure 4.4: How inflation is used to determine occupancy. Image courtesy of the CostMap 2D wiki(ROS, 2010). Figure 4.6 shows the client that was written to allow the navigation stack to communicate with the GPS node. As each waypoint coordinate is read in from the text file, a request is sent to a server running inside the GPS node. The GPS node converts latitude and longitude to x,y coordinates with respect to the global map. These x,y coordinates are then stored in a list and sent to the navigation stack. The goals are sent one at a time, after the robot navigates to each goal. This can be seen in Figure 4.7. The navigation stack utilizes two components to navigate around obstacles: the global plan and the local plan. The global plan is the complete path is the ideal route for the robot to follow from its start to end position, calculated using Dijkstras Algorithm. The local path then tells the robot how to actually drive along this path using tentacles. Tentacles function by projecting a series of arcs from the robot center along the global path. The best arc for the robot to drive along is determined using a weighing system, comparing the arcs proximity to the global path, distance from obstacles, and the estimated time that it will take the robot to drive along the arc. (D. Fox & Thrun, 2004). Figure 4.8 shows the parameters used to configure path planning. The robots velocity and acceleration capabilities and acceptable deviation from the global path are specified. Tuning of these parameters are used 37 Figure 4.5: Increased obstacle inflation and resulting path planning of CostMap. Figure 4.6: Portion of the code used to connect to the GPS client. to achieve a balance between accuracy and smooth driving. That is, setting very wide tolerances results in a robot that drives very smoothly and aesthetically, but may result in the robot deviating too much from the global path and hitting obstacles. Setting tolerances that are too tight can result in very short tentacles that cause the robot to oscillate, jitter, and drive too slowly. Thorough tuning and testing was preformed to arrive at the correct values for our specific chassis and outdoor application. The processed used to correctly tune the robot was as follows: 1. Determine desirable velocity and acceleration limits. Acceleration limits too high would cause the robot to jerk around, and accelerate so quickly that it could bump into obstacles before having time to react. Acceleration limits too low can cause the robot to move too slowly, which is a prominent concern with a competition runtime of ten minutes. Like wise, the velocity limits needs to be set low enough to ensure smooth motion and acceptable response time, but high enough that the robot moves at an acceptable pace. Fortunately, by setting the acceleration and velocity upper and lower bounds, were able to move slowly when necessary, but retain the ability to gain speed over longer runs. 2. Once an acceptable speed has been determined, tolerances to path need to be adjusted. Prometheus Figure 4.7: Portion of the code used to send GPS goals to the path planner. 38 Figure 4.8: Parameters used to constrain the path planner. has a large footprint, with a significant distance between the rear and front wheels. Often times, it is difficult for it to strictly follow a path, without oscillating around the desired path of motion. Increasing the path tolerance helps to smooth motion, but may allow the robot to drift too far from what the navigation stack has calculated to be a safe trajectory. Adjusting this value and repeatedly testing allowed us to achieve a balance between smoother motion, and remaining a safe distance from obstacles. 3. Finally, the goal tolerances were adjusted. Setting a goal tolerance too small causes the robot to spend a lot of time attempting to precisely reach its goal, which is not necessary for the IGVC. In some cases, this is not even possible, because the GPS is only guaranteed to be accurate within 30cm. However, setting this too high, can cause the robot to miss its goal. Through testing, a value of 0.5 meters was determined to provide excellent results, which is discussed in more detail in following sections. Additionally, the navigation stack provides a yaw- tolerance parameter. This was set to 6.28, because orientation when reaching a goal is not a concern. After a tentacle is chosen, the CostMap publishes information that tells the motor controllers how to drive along this tentacle. This information is published over the topic cmd vel as seen in Figure 4.9. Figure 4.9: The RXGraph output of 2012 Prometheus. 39 The cmd velcontains the linear and rotational velocities necessary for the robot to move along the desired path of motion. The navigation stack is then updated with the robots current position by subscribing to the tf provided by the EKF that relates the robots current position to the map origin. This creates a feed back loop that allows the navigation stack to update the tentacles if the robot deviates too much from the desired path of motion or encounters new obstacles. 4.1.2 Results After tuning, the navigation stack has proven to be very reliable. Sensor information is taken in from multiple sources, and fused into one map. The following video - https://vimeo.com/40559488 - shows a qualifying run completed by the robot, where it successfully avoids lines and obstacles while navigating sequentially to three GPS waypoints. This was a significant accomplishment - ensuring that all implemented systems were working together, and the robot met the base requirements for the IGVC. While the robot did complete the run successfully, the run did illustrate several issues that have since been resolved. As previously mentioned, during the qualifying run robot came very close to obstacles. While this is a useful because it guarantees the robot follows an ideal path, it also sometimes brushed up against the sides of cones, which is not acceptable in the competition. The navigation stack was modified to increase obstacle inflation, as seen in Figure 4.5. Additional outdoor testing has indicated that this has greatly reduced the problem previously found with the robot coming so close to obstacles. Furthermore, the tentacle system caused the robot to experience oscillation when driving. While this doesnt affect the robot reaching its goals, it reduces aesthetic appeal, and increases time spent driving. As a result, the tentacle portion of the navigation stack modified, to increase the length of tentacles. Because Prometheus features a large footprint, and has a large distance between the front and back wheels, it is difficult for it to traverse along a tentacle with a short radius. The front wheel must be at nearly a ninety-degree angle, and it will oscillate several times until it is able to place itself upon the desired path. Increasing the length of tentacles reduces this problem, and results in dramatically smoother driving. The graph in Figure 4.10 measures the accuracy of the robots ability to navigate to a GPS waypoint from differing start positions and orientations. As seen in Figure 4.10 the robot achieves a high degree of accuracy when reaching waypoints 12 cm was the most extreme error recorded. Figure 4.10: Results of multiple trials of GPS Waypoint navigation. This can largely be attributed to the accuracy of the GPS, which is rated to 1 foot or 30 cm. Additionally, 40 the navigation stack is configured to allow a tolerance of 0.5 m when reaching goals. A goal tolerance helps to prevent oscillation that may occur, in situations where it is desirable to have the robot reach a waypoint and keep driving. With a very small tolerance the robot has to stop, and spend a lot of time carefully positioning itself exactly on the waypoint. A larger tolerance allows the robot to come acceptably close to the waypoint, and then keep moving. This is important in the competition, where the robot only has ten minutes to complete the course. 4.1.3 Discussion The mapping and global path planning portions of the navigation stack are very robust and functional. The tentacle local path planner functions, and successfully navigates the robot towards goals. The biggest issue encountered during implementation of the navigation stack was lack of documentation. Often ROS documents failed to specify critical information like the map coordinate system layout, or parameters needed to tune the navigation stack. This forced us to discover this information through reverse engineering, or researching through alternative means, such as forum posts. A significant amount of time was also spent integrating various nodes and systems written by different team members together. There were inconsistencies in data formats and refresh rates that had to be resolved in order for the system to function correctly. While everything worked individually, these issues did not arise until field-testing began. That said, there is certainty room for improvement that future teams could add to the navigation stack. With more time, the system could be modified to implement a system of probabilistic mapping, which would help filter out noise and erroneous sensor readings. Additionally, the navigation stack currently clears out some obstacles that are no longer in the field of view through a process called ray tracing. This can be an issue in situations when it would be useful to retain obstacles, such as when the robot is next to a cone that is outside the field of view of sensors. 41 4.2 Extended Kalman Filter In order to localize Prometheus, the team used the abovementioned GPS, encoders, and compass. However, these sensors have noise and over time, this noise can add up and report an inaccurate position of the robot. In order to account for this inaccuracy the noise must be taken care of by a filter. An Extended Kalman Filter is a version of the Kalman Filter for non-linear systems. It was determined this was the best choice for a filter by last years team and this years team agrees. With the removal of the cRIO, the Extended Kalman Filter (EKF) from 2011 written in LabVIEW was also removed. A new EKF was written and implemented in Python. 4.2.1 Methodology The model of Prometheus EKF was based off a report, Three-State Extended Kalman Filter, by students of McGill University, whose goals were similar to ours.(Kiriy & Buehler, 2002) The full procedure and implementation of the EKF, and descriptions of the matrix variables can be found in the Appendix. The EKF uses Jacobian matrices to determine a best guess for the position of a robot. It first predicts what the state the system should be, and then based on sensor data, corrects the state and updates the robot so it knows where it is at all times. The following is a summary of EKF equations. Figure 4.11: Operation of the extended Kalman Filter. Image courtesy of Welch & Bishop (1995) Xk and Zk represent the state and measurement vectors. Both these vectors are of the form [x,y, φ] and can be seen in Figure 4.12. Xk is the previous state and gets its input from the output of the EKF. Zk is the measured state and get its X and Y coordinate from the GPS and the heading from the compass. The left and right encoder enter the system as measured distance is represented by the vector Uk . Figure 4.12: The state vector of the system: GPS gives X and Y, Phi is given by the compass The covariance matrix is an important part of the EKF as adjusting these values directly affects the 42 reduction in noise of the system. For Prometheus, the measurement covariance matrix R can be seen in Figure 4.13. Figure 4.13: Measurement noise covariance matrix R These numbers reflect last years and have proven to work well with this years Extended Kalman Filter. Figure 4.14 is a table condensed by last years team and was taken from their report.(Akmanalp et al., 2011) Figure 4.14: Distance tests for the encoder and compass These numbers helped greatly this year in determining what numbers to give the covariances matrices initially. Tests were done to ensure the difference from actual distance to reported distance was minimal with these numbers by driving the robot inside the lab and measuring the distance traveled. The system noise matrix Q can be seen in Figure 4.15 and the measurement matrix H can be seen in Figure 4.16. The matrix in Figure 4.16 is an identity matrix because the input numbers directly map to the numbers that we want out of the filter. No further calculations must be made to determine our x and y position, or our current heading. After all of this has been calculated it the output which is fed back into EKF is also given to move base to aid in navigation of Prometheus. Figure 4.17 shows the graphical representation of these nodes and their connections in ROS. 43 Figure 4.15: System noise covariance matrix Q Figure 4.16: Measurement matrix H 4.2.2 Results Last year provided a means of testing the EKF inside LabVIEW. They tested the EKF with just the compass (which they referred to as the IMU) with the encoders and graphed their output from the calculated position of the compass and encoders, the output of just the encoders, and the output of the EKF. These results can be seen in Figure 4.18. The 2011 team also performed a test where they drove the robot around the main hallways of the first floor of Atwater Kent. Those results are shown in Figure 4.19 To perform this test, the 2011 team logged the data into a text file. This data was then imported into MATLAB and plotted. The graph shows that the overlap from first lap and second lap is minimal for the encoder information, but the EKF minimizes this shift and the overlap is maintained. The method for performing this test influenced the way this years team tested their robot. The main difference between this years testing and last years is that GPS information was included and also recorded. Testing the EKF this year consisted of taking the robot outside and hand driving it in a circle. The circle was spray painted on the ground using a tape measure that was planted in the middle and spun to make consistent markings. Information was gathered from the encoders, GPS, and EKF by logging their Figure 4.17: Implementation of the EKF in ROS 44 Figure 4.18: LabVIEW Logging of Raw and Filtered data from encoders and Compass (Akmanalp et al., 2011) Figure 4.19: LabVIEW logging of Raw and Filtered Path from Sensor Data around Atwater Kent output into Comma Separated Value (CSV) files. This data was then imported and plotted in MATLAB. The physical test and results of a run are shown in Figures 4.20 and 4.21 respectively. Figure 4.20: The Hand Drawn Circle on the Ground The red circle represents the encoder information and is given in meters. The blue circle represents the GPS information gathered during the same run, it also is given in meters. The blue circle represents the output of the EKF before the output is put back into the EKF. The circle has a diameter of about 8 meters which is how large it was in 45 Figure 4.21: EKF, GPS, and Encoder Results 4.2.3 Discussion While the encoder information looks more uniform, the GPS gives a more accurate representation of the position of the hand driven robot. This being the case the EKF resembles this information more so than the encoders. Taking notice of the top left of the graph, one can see that the GPS started to give erroneous data and cause the robot to jump from one position to another. The EKF handled this and minimized the jump and the GPS ended up converging with EKF once again. Due to time constraint and need to test things other than the EKF, the system covariance matrix is most likely not optimal. 4.2.4 Improvements for Next Year While the system architecture for this year works quite well, there is of course room for improvement. The LIDAR on Prometheus is old and needs to be replaced. It does not report as much as it used to and does not update costmap quickly enough to be competitive. The noise covariance matrix for the EKF can be tested further. Currently the numbers in place are good enough to compete but those numbers can constantly be improved for greater accuracy. The robot also has some problems staying on the path aesthetically. It currently struggles to drive straight when it clearly has the option to do so. 46 Chapter 5 Results of Testing 5.1 Indoor Testing Using ROS provides several advantages, one of which is the ability to run nodes separate from the main code base. This allows for testing to be carried out on various sensors and algorithms in a small indoor setting during the winter months. Items such as obstacle detection, stereo vision and mapping can be tested indoors by running nodes separately and providing false published information. The table below shows an outline of the accomplishments the 2012 made in order to improve the overall performance of Prometheus. Each item required new code with the exception of the GPS, since the 2011 team had already written a highly functional protocol to communicate with the GPS. Indoor testing was highly desired so that different aspects of the robot could be tested when the weather did not permit outdoor testing. In order to accomplish this indoor testing a separate launch file was constructed with dedicated transforms and settings so that the robot could function indoors with no risk to lab equipment and no risk of errors from lack of information. A transform was constructed to place the robot stationary in the middle of the false map. The EKF node was left out, since the GPS could not receive a signal indoors, and the robot position would not be changing. Having a dedicated node and launch file allowed for indoor testing to be carried out without editing code that would be used for outdoor testing. This edit of the code was particularly useful for testing stereo vision, lidar obstacles, and for providing a visualization of path planning without having to follow the robot as it completed the path. A node providing simulated obstacles is also constructed in order to test path planning. The indoor simulations provide a good means of initial testing for individual parts, so that time outdoors was spent integrating all of the separate parts. This approach works very well, and almost all time spent outdoors was spent on tuning, since the individual nodes all functioned beforehand in the lab setting. 47 5.2 Outdoor Testing With the entirety individual sensor nodes successfully tested indoors, Prometheus was in a very good state to begin outdoor testing. It was important to replicate the conditions of the competition, since much of the testing being completed required very fine tuning that would not easily be changed in the short time span of the competition. Items such as line detection parameters, inflation size and acceleration limits heavily depend on the course, so these parameters need to be decided upon before competition date. 5.2.1 Course Setup Constructing the course to mimic the competition course was is important. The first task is to locate an area suitable for testing. Conditions at the actual competition are not directly known by the 2012 team, so it was decided to use a worse case approach so that the tuning done would allow for successful operation at the competition. There are several areas of concern relating to course placement. The topography of the land is of much concern, since pitching and rolling of the robot can have an effect on obstacle placement (including false obstacles). How level the ground is also plays a part in determining correct parameters for acceleration, velocity and PID parameters. Line detection is also very much influenced by the location of the course. With a completely green ground, such as fake turf, parameters for line detection can be a lot more open than is allowable for an area with brown grass. Angle of the line detection camera is influenced by the topography of the land, since the line detection camera can never be allowed to see the horizon. With the following locations in mind, an area in Institute Park was selected that included an uphill, light colored roots and areas of rough terrain. Once the area of the course was selected the outline of the course was made using lines. The approach to creating lines on the ground selected was white marking paint. The course layout needs to mimic the way the competition course would be laid out, but on a smaller scale. There are three sections to the final course design. The beginning and the end of the course are enclosed by 10 foot lanes. In the middle of these lanes there is a turn, and then an area with no lanes, the same as the competition layout. A line is laid out protruding into the first lane, so line avoidance is clearly demonstrated. A top down view of the course with lines is shown in Figure 5.1. Figure 5.1: Demonstration course with lines A major part of the challenge is obstacle avoidance. Just as in the competition, cones are used in the demonstration course to represent obstacles. These are placed in varying layouts, just as they would be in 48 competition. Several of these cones are placed on lines, and several in groups. This demonstrates the robots ability to determine if it can fit in between obstacles or not, and its ability to combine line obstacles and cone obstacles. Many cones are also placed in the open area, just as they are in the competition. The course layout with the cone obstacles is shown in Figure 5.2. Figure 5.2: Demonstration course with cones and lines Waypoints navigation is a major part of the competition. Positioning of waypoints was an important selection. The goals needed to be place such that path the robot planned would conflict with obstacle and lines so that successful planning could be demonstrated. If there was a direct line of sigh between goals the robot would always take this path, thus it is not a valid demonstration. The waypoint markers needed to be something that the robot could run over, since the robot would be trying to get as close to them as possible. Orange wire landscaping flags were chosen for this task. The layout with all aspects involved is shown in Figure 5.3. Cones are red circles, lines are white and goals are gold stars. Figure 5.3: Demonstration course with cones, lines and goals 5.2.2 Robot Setup In order to have the robot complete the course several actions have to be completed. Line detection must be tuned for the current lighting conditions and waypoints need to be added. Once these are set attempts can be made to complete the course, and parameters can be tuned based on the results. The procedure for setting up the waypoints requires uses of the robot. The approach taken is to move the robot to the desired goal using the remote, and then use the GPS to determine the exact position of the goal. Once the robot is in position the GPS node can be run. It is important that the robot have a 49 differential signal for this procedure, as indicated by a solid green status light on the GPS. Once the node is running the latitude and longitude can be reproduced in the terminal by simply echoing /trimble gps. These latitude and longitude are added in the text file waypoints.txt under the nav2D package. Multiple waypoints are added, each being a new line, in the order that the robot will be navigating to them. The line detection parameters depend heavily depending on lighting conditions, and need to be updated every time the robot is run. The first step taken is to run /disable auto, a script written by the 2012 team, under Cameras to turn off the automatic features of the webcam. The cameras are run, and an image grabbed from the view. The image is then opened in Gimp, and the line is selected so that the Hue Saturation Value numbers can be determined. Line detection is run using command level arguments for Hue Saturation and Value tolerances. Running line detection several times is required to get the desired results, which can be viewed in Rviz. 5.3 Full Tests Once the course and robot setup is complete the robot can be set loose on full runs. Our procedure for testing was a simple trial and error, since the tuning at this point is all motion control. Prometheus was brought to the starting location, and the main navigation node was run. To prevent the robot from injuring whoever was starting it, the e stop is enabled until the user is away from the robot. Once the e stop is disabled the robot is free to move. Tuning for autonomous continued for the month of April. Successful full runs were conducted in the second week of April on the 7th. At this point the robot could successfully navigate the course, but reliability and oscillation of the robot around the path were the main issues that need to be resolved. An issue came up of the robot rotating the wrong direction when it tried to rotate in place, it would rotate the opposite direction that it needed to move. Once this was corrected navigation improved dramatically, was wall as the percentage of times the robot would hit its waypoints. At this point the robot was able to successfully detect lines a very high percentage of the time, but consistently came close to hitting obstacles. Waypoint navigation was tuned with adjustment to the tolerance of the goal made on the robot position, and after this the robot would reliably hit its goals. On April 14th more advancement were made. Testing was carried out on an almost daily basis between the last full testing day on the 7th and this date; however this date is notable for getting navigation working very reliably. With adjustments made to inflation size the robot would no longer run into obstacles. Changes were also made as to how far the robot could stray from its global path, and acceleration and velocity limits were also changed. Filming for carried out on this date, as the robot was able to perform quite well. The remaining issues were that the robot would consistently come too close to the cones for comfort, and the robot still did not drive as smoothly as was desired. Successful avoidance of a line is demonstrated in Figure 5.4, and Figure 5.5 clearly shows a line and cone detected to the right of the robot. On Tuesday April 24th major advancements were realized in navigation. The navigation stack was manually edited to increase the size of the tentacles. This provided larger paths for the robot to traverse, which was necessary because of the large robot size. The result was dramatically smoother performance and reduced oscillation. Manual edits were also done to change the way obstacle inflation is conducted, allowing for more user control over the padding. The table below shows the major successes, there were much more 50 Figure 5.4: Prometheus successfully avoiding a line with a goal on the other side Figure 5.5: Prometheus demonstrating its ability to locate obstacles testing dates than this, but this shows major highlights on major testing dates. 51 Chapter 6 Conclusion On April 16, the team filmed Prometheus demonstrating the 2012 implementation efforts integrated together and functioning as a fully autonomous system. The goal of this demonstration was to prove that Prometheus would qualify for the 2012 IGVC. The IGVC rules specify that a qualifying robot must demonstrate ”Lane Following: The vehicle must demonstrate that it can detect and follow lanes. Obstacle Avoidance: The vehicle must demonstrate that it can detect and avoid obstacles. Waypoint Navigation: Vehicle must prove it can find a path to a single two meter navigation” (Theisen, 2011). With these requirements in mind the demonstration consisted of a fifty-meter course (Figure 6.1) with a series of cones, spray painted lanes, and GPS waypoints. The course was designed to mimic most of the conditions most commonly found on the IGVC course. Figure 6.1: Prometheus navigating the demonstration course on April 16, 2012 in Institute Park, Worcester Massachusetts Prometheus was started at the beginning of the lane and instructed to navigate to each of the three GPS waypoints (marked by the orange flags). It then used data from the LIDAR, EKF, and cameras to effectively avoid obstacles. After several trial runs, where various parameters such as line detection were tuned, an 52 IGVC qualifying run was achieved. During the successful run Prometheus completely navigated the entire length of the sample course without hitting any obstacles or crossing a line as well as successfully navigating to each GPS waypoint. Since this demonstration a significant amount of work has gone into path planning resulting in a smoother, more fluid path. Based upon this result and the individual component results outlined in the proceeding chapters we are pleased with the final outcome of this MQP. Improvements were made upon existing work from past years, by improving or redesigning intelligence, navigation, line detection, and the low-end architecture. These improvements were based on large amounts of research and testing done by previous teams, which provided a great base to start with and identified areas that could be further improved. Additionally, new technologies were brought to Prometheus, including Stereo Vision, and a functional implementation of an Extended Kalman Filter. These changes were made with a focus on modularity, and the use of well supported and documented frameworks. This should provide a stable, modular platform for future competitions and research endeavors. 53 Appendix A Authorship Craig DeMello wrote the Drive System chapter and wrote the Results of Testing and and wrote the Robot Operating System Overview section of the Introduction and wrote the Systems marked for change section of 1.5 collaborated with Samsonl on some of the LIDAR related sections of the Obstacle Detection System chapter. Eric Fitting wrote the 2011 MQP Report Overview section and collaborated with Gregory to write the Stereo Vision section of the Obstacle Detection System chapter. Samson King wrote the section on Mapping Obstacles and CostMap for the Navigation System chapter and wrote the Line Detection section of the Obstacle Detection System as well as collaborated with Craig on the LIDAR section of the Obstacle Detection System. Gregory McConnell wrote the Conclusion chapter as well as collaborated with Eric on the Stereo Vision section of the Obstacle Detection System chapter. Michael Rodriguez wrote the Extended Kalman Filter section of the Navigation System chapter as well sections 1.1 and 1.2 in the Introduction chapter. All team members contributed to writing the State of Prometheus section of the Introduction chapter. 54 Appendix B User Guide B.1 Stereo Vision The easiest way to read the stereo vision code is to start with the main loop of stereo vision.cpp. When stereo vision is called the first time it reads the contents of the yaml files that contain the configuration data for the cameras. The yaml files are automatically generated by the stereo calibration utility and stored in /home/igvc/.ros/camera info/[GUID].yaml. If any of the parameters fail to load a warning is printed to the terminal specifying which parameter failed. Several one-time functions are then called after all the yamls have been loaded. stereoRectify is called to generate the Q-matrix, which is later used to convert the disparity map into a point cloud, and initUndistortRectifyMap is then called to generate the rectification parameters for stereo vision. The last thing that main() does is take care of subscribing to and publishing various topics. When subscribing to a topic a function is also specified and every time data is published to that topic the specified function is called. In this case every time a camera image is published either proc right or proc left is called. proc right and proc left convert the ROS image into a CV image through the use of cv bridge. Next the time stamp of the new image is checked against the timestamp of the latest image from the opposite channel, if they are within a specified limit (MAX TIME DIFF is set to 10ms by default) proc imgs is called. Once two images with timestamps that are within the limit are received it’s a simple matter of bluring the image, rectifying it with gpu::remap, process the images with disparityBM to produce a disparity image and then publishing the disparity. Turning the disparity into a point cloud which is usable by CostMap2D is performed by makepointcloud.cpp and is basically a copy of the pointcloud nodelet found in the ROS stereo vision package. B.1.1 Launching Stereo Vision The stereo vision package developed for use in the 2012 IGVC competition contains three launch files, cameras.launch, stereo vision.launch, and makepointcloud.launch. The best way to think about the three launch files is that they built upon the previous. cameras.launch opens communications with the cameras at the specified resolution (800x600 at 15Hz) and outputs the video streams (/stereo/right and /stereo/left). stereo vision.launch calls cameras.launch, processes the images returned by the cameras and publishes the 55 corresponding disparity map. The remaining launch file, makepointcloud.launch, calls stereo vision.launch (which in turn calls cameras.launch) and process’ the disparity map and returns a point cloud. One of the primary reasons for doing it this way is to utilize multiple threads. To start the cameras publishing data: roslaunch stereo vision cameras.launch subscribes to: none publishes: /stereo/left/* and /stereo/right/* To start the cameras and publish a disparity map: roslaunch stereo vision stereo vision.launch subscribes to: /stereo/left/image raw and /stereo/right/image raw publishes: /stereo/disparity raw To start the cameras, publish a disparity map, and create a PointCloud: roslaunch stereo vision makepointcloud.launch subscribes to: /stereo/disparity raw publishes: /stereo/pointcloud B.1.2 Other useful commands and information: Left camera: serial number - 9430912 guid - 00b09d01008fe780 Right camera: serial number - 9430910 guid - 00b09d01008fe77e Viewing disparity and images: rosrun image view stereo view stereo:=/stereo image:=image rect color approximate sync:=True note: approximate sync:=True is a requirement for these cameras as they can’t return images with exactly the same timestamp. Calibrating the cameras: rosrun camera calibration cameracalibrator.py –size 8x6 –square 0.0254 –approximate=0.01 right:=/stereo/right/image raw left:=/stereo/left/image raw right camera:=/stereo/right left camera:=/stereo/left note: Follow the ROS tutorial for a more detailed explanation (http://www.ros.org/wiki/camera calibration/Tutorials/Ster 56 B.2 GPS The GPS on Prometheus is a Trimble ag252 model, designed for high precision agricultural applications. The GPS has the ability to be accurate to within 3 inches. Power for the unit is connected via the 12 volt automotive outlet on the robot. Communication is over serial with a baud rate of 115200. The status light on the side of the GPS has several colors for different states, described in the table below: Color Blinking Orange Solid Orange State GPS is on, no signal GPS signal, not converged GPS on and converged No power Solid Green No Light Table B.1: Comparision of the color of the status LED on the DGPS with its meaning B.2.1 GPS Set-up The procedure for setting up the gps involves several steps. The first and most important thing to note is that there are two ports on the gps unit, A and B. It is very important to not switch these ports. Port A is set up to use Trimbles AGremote software, basic software used for diagnostics and settings. Port B is set up to communicate with Prometheus. Switching the ports will override these settings, and they will have to be changed in AGremote. The first step to using the GPS is to sign up with Omnistar, which usually supplies the team with 3 month memberships free of charge. The service allows the GPS to converge to gain the best accuracy. To renew the subscription follow the following steps: 1. Take the GPS outside, it will not get a signal inside. 2. Make sure the GPS is outside with power for several minutes, so that it can communicate. 3. Locate the serial number on the side of the GPS. 4. Call Omnistar, and give them the serial number of the GPS. 5. The GPS should converge in several minutes. The light will turn green if it converges. B.2.2 Running GPS Node Running the GPS requires the use of a linux program known as GPSD.(GPSd, 2011) Note that linux automatically launches GPSD at startup, so it must be killed to launch on the right port. Use command sudo killall gpsd. The baud rate for the port needs to be set. Use command sudo stty /dev/ttyS1 speed 115200, where ttyS1 is the serial port you are on. GPSD can be launched from the terminal using the command gpsd Nn /def/ttyS1, where Nn tell the program to run in the foreground, and ttys1 is your port that the gps is on. Alternatively, there is a file that will do all of this for you. Using cd and ls navigate to the gps folder, and do sudo ./start gpsd.sh. Once gpsd is running you can view the result by launching xgps. Xgps will tell you if the gps is getting a signal, and if it is it will return the latitude and longitude of the robot. Once you 57 get the results in xgps, you can launch the ros node. First, launch roscore as usual. Then navigate to the gps folder, and rosrun gps node. If you are ouside and the gps is converged, the latitude and longitude will publish under the topic trimble gps. Use the latitude and longitude for whatever applications you desire. B.3 Arduino The low level feedback and control of Prometheus is accomplished using an Arduino Mega 2560 that communicates over USB. This is the only device that communicates over USB. The motors are controlled using encoder feedback from the Arduino, and are controlled via Jaguar speed controllers, which communicate over serial with the computer. B.3.1 Hardware Prometheus has 3 encoders on the robot, one for each wheel. These are tied into the proto board on the front lexan of the inside of Prometheus. The encoders go to LS7366R IC encoder counter chips on the proto board, and the ICs go to the Arduino. The encoder counter chips are set up to be replaceable, in case of future issues. The Arduino samples the encoders at a fixed rate in a loop. The enocer values are sent to a ros node. The Arduino also has other responsibilities, such as handling the LED lights and receiving the data from the remote. The table below outlines the status lights and what the different colors mean. Color Green Red Blue State Tele-op Mode Enabled E-Stop Enabled Autonomous Mode Enabled No power No Light Table B.2: Comparision of the color of the status LED on the DGPS with its meaning B.3.2 Software The Arduino has its own code on it, much like you would have in an embedded system. It uses an type of C++ with a ROS package, rosserial arduino. The program to put code on the Arduino is pinned to the taskbar in Ubuntu. The final code from 2012 is called Final arduino code. For more information check the Arduino website. There are two ROS nodes that handle driving and related communication; they are both in the package jaguarControl. Listener.py handles subscribing to the Arduino, PID loops and odometry. jagControl.py simply handles serial communication with the Jaguars. B.3.3 Launching Tele-Op Mode Launching the tele operation and motor code is very simple. Make sure the Arduino has power, and that it is connected to the USB on the robot. The LEDs on the robot should be lit. Launch roscore, then do roslaunch jaguarControl rc control.launch. This launch file also launches other topics, including the remote 58 control handler, LED lights and PID loops. Once this node is launched you have control via the remote over the robot. You will also have access to the encoder counts via the topic wheelEncoders, which is an arrar of 16 bit ints. The first item is the front wheel, then driver, then passenger. In case the port needs to be switched for the Jaguars, the port setting is located under jaguarControl - src - jagControl, at the top of the file. The Futaba layout is described below. Figure B.1: Description of the remote control and it’s various modes of operation. B.4 Launching the Compass The compass is setup to give the heading roll and pitch. It can give much more information but we only needed heading. To get the information you want you have to request it by sending it a certain amount of bytes in a certain order. See Page 35 (Chapter 7) of the PNI User Manual on how to specifically do this.(?) To start the compass: You must have roscore running if it is not, type ”roscore” into the terminal and open a new window. In the new terminal window type: rosrun Compass talker.py B.5 Launching the EKF The EKF takes in GPS, encoder, and compass information and gives the position [x,y,phi] of the robot relative to a starting position normally [0,0,0]. To start the EKF: You must have roscore running. If it is not, type ”roscore” into the terminal and open a new terminal. You must also have the encoders, compass and running. Type the following lines all in new terminals per line: roslaunch jaguarControl rc control 59 rosrun Compass talker.py rosrun gps gps node.py rosrun EKF listener.py B.6 Installing Ubuntu Ubuntu Linux is the officially supported distribution of ROS. As a result, we are currently running Ubuntu 10.04 - the long-term support (LTS) release. While ROS does support newer versions of Ubuntu, we encourage running the current LTS release because it only includes highly stable, tested software and has well documented community support. 1. Download the current 64bit LTS release from the Ubuntu Website. http://www.ubuntu.com/download/ubuntu/downloa 2. Next, you will need to prepare a bootable flashdrive to install Ubuntu from, because the onboard computer does not include a CD drive. The Ubuntu download page includes instructions for preparing a bootable Ubuntu install flashdrive from Windows, Linux, and OS X operating systems. Click the link in step 1, select Show me how next to Create a CD or bootable USB disk, and select USB Disk and your host operating system of choice under the options section. Follow the presented instructions. 3. After youve created a bootable flashdrive insert it into one of the onboard computer USB ports and press the power button. 4. At the bios post screen, press F11 to enter the boot menu. Select the flashdrive you previously inserted. 5. Click the link in step 1. Click Show Me How under the Install It section. This will provide you with the most up to date instructions for installing Ubuntu. Follow these steps to complete the installation. B.7 Installing ROS Currently we are using ROS-Electric, the current, stable release. Instructions for installing and upgrading ROS can be found at: http://www.ros.org/wiki/electric/Installation/Ubuntu. You will want to install the current, stable, full installation for the applicable version of Ubuntu. B.8 Setting Up A Development Environment 1. First, install Eclipse by executing a sudo apt-get update and then a sudo apt-get install eclipse from the command line. 2. Setup Eclipse for C++ Development by installing Eclipse CDT from: http://www.eclipse.org/cdt/downloads.php. Simply open eclipse, select help - install new software and enter the p2 software repository URL for the appropriate version of eclipse (currently Galieo). 60 3. Setup Eclipse for Python Development by installing PyDev from: http://pydev.org/download.html. Simply select help -¿ install new software in eclipse and enter the main PyDev Eclipse Plugin URL from the above link. 4. Setup the Arduino IDE. The following tutorial provides excellent instructions. http://www.codetorment.com/2009/11/0 getting-started-with-arduino-ide-on-linux-ubuntu-9-10/ 61 Bibliography (2010). Rationale of Dijkstra being used in navfn instead of A*. Retrieved from http://answers.ros.org/question/28366/why-navfn-is-using-dijkstra. 10, 12, 34 Akmanalp, M. A., Doherty, R., Gorges, J., Kalauskas, P., Peterson, E., & Polindo, F. (2011). Realization of performance advancements for wpi’s ugv - prometheus. Retrieved from http://users.wpi.edu/~tpadir/Prometheus2011.pdf. (Accessed on 2012-2-11). iv, 11, 43, 45 Belezina, J. (2012). Nevada Approves Regulations for Self-Driving Cars. Retrieved from http://www.gizmag.com/nevada-autonomous-car-regulations/21507/. 1 Chen, J., Luo, C., Krishnan, M., Paulik, M., & Tang, Y. (2010). An enhanced dynamic delaunay triangulation-based path planning algorithm for autonomous mobile robot navigation. vol. 7539, (p. 75390P). SPIE. Retrieved from http://link.aip.org/link/?PSI/7539/75390P/1. 12 D. Fox, W. B., & Thrun, S. (2004). The Dynamic Window Approach to Collision Avoidance. Retrieved from http://portal.acm.org/citation.cfm?id=1405647.1405650. 9, 37 GPSd (2011). GPSd. Retrieved from http://gpsd.berlios.de/. (Accessed on 2011-4-24). 57 Hough, P. V. (1962). Method and means for recognizing complex patterns. US Patent 3,069,654. 9 Kiriy, E., & Buehler, M. (2002). Three-state Extended Kalman Filter for Mobile Robot Localization. Retrieved from http://kom.aau.dk/group/05gr999/reference_material/filtering/eKf-3state. pdf. 42 Korzeniewski, J. (2012). Watch Google’s Autonomous Car Drive a Blind Man. Retrieved from http://www.autoblog.com/2012/03/30/watch-googles-autonomous-car-drive-a-blind-man-to-tac 1 Markus, F. (2003). VW’s Transparent Factory. Retrieved from http://www.caranddriver.com/features/vws-transparent-factory. 1 Quigley, M., Gerkey, B., Conley, K., Faust, J., Foote, T., Leibs, J., Berger, E., Wheeler, R., & Ng, A. (2009). ROS: an open-source Robot Operating System. In International Conference on Robotics and Automation. 4 62 ROS (2010). Retrieved from http://www.ros.org/. (Accessed on 2010-12-17). iv, 34, 35, 37 Theisen, B. (2011). The 20th annual intelligent ground vehicle competition (igvc) annual igvc rules. Retrieved from http://www.igvc.org/rules.pdf. (Accessed on 2011-1-7). 52 WPI (2011). 2011-2012 undergraduate catalog. Retrieved from http://www.wpi.edu/academics/catalogs/ugrad2012.htmll. (Accessed on 2012-4-25). 1 63 IGVC 2012 PROBLEM STATEMENT • Design and build a robot that will competitively participate in the 2012 Intelligent Ground Vehicle Competition IGVC REQUIREMENTS • General: – – – – – – – Length: 3-7 Feet Width: 2-5 Feet Height: Not to exceed 6 Feet Vehicle Power must be generated onboard Must have a mechanical and wireless E-stop Must have safety lights Must be able to carry a 18”x8”x8” 20 pound payload • Three Challenges AUTO-NAV CHALLENGE • Must negotiate around an outdoor obstacle course under a prescribed time autonomously while navigating to specific waypoints • Must maintain an average course speed of one mph but not exceed 10 mph • 10 minutes to complete the course OBSTACLE COURSE JAUS CHALLENGE • Must interface with a judge’s Common Operating Picture (COP) using Joint Architecture for Unmanned Systems (JAUS) protocol as requested by judges by connecting to an external wireless router • COP – Simple validation, reporting and recording tool that provides a graphical display of the operational area in relative coordinates DESIGN CHALLENGE • MQP Style Report and Presentation – Effective innovation represented in the design – Mapping Technique – Electronic Design – Software Strategy – Systems Integration PROGRESSION OF PROMETHEUS PROMETHEUS 2010 • Frame constructed • Differential drive rear wheels • cRIO interfaces with all the sensors except for the stereo cameras • Line detection by stereo cameras • Tentacles implemented • Results of 2010 IGVC: – Didn’t Qualify – Rookie of the Year Award PROMETHEUS 2011 • DGPS and LIDAR interfaced on main computer • Stereo cameras and DGPS mounted on boom • Robot Operating System (ROS) implemented • Results of 2011 IGVC: – Qualified – 0 points in Grand Challenge PROMETHEUS 2012 • • • • • cRIO removed and Arduino Mega added Better implementation of extended kalman filter Stereo vision and SLAM implemented Wheel encoders properly interfaced Expanded payload capabilities • Goal for 2012 IGVC: – Top 5 SENSOR FUSION 2012 2011 Sensors: SICK Lidar, Trimble DGPS, PNI Compass, Point Grey FlyII Cameras, US digital quadrature encoders 2011 SENSOR INTEGRATION Design Advantages • More Computing Power • Advanced Hardware Capability Design Problems • Slow to Compile FPGA (30 min) • Difficult to Debug • Difficult to create large, complex programs in LabView • Unreliable Encoder Data • Required Creation of Two Separate Kalman Filters • Limited ROS Integration 2012 SENSOR INTEGRATION Design Advantages • Compass and Jaguars Direct Interface • Reliable Encoders • Position Tracking • PID Speed Control • Quick C/C++ Programming • Lots of Software Libraries • Existing ROS Interface Design Disadvantages • Slower Processing Speed • Loss of FPGA ELECTRO-MECHANICAL • Electrical and Mechanical Updates to Prometheus – Remove CRIO – Develop Arduino board solution – Trailer design – Housecleaning of wires – Mount PC, hard drive, power supply ARDUINO SHIELD DESIGN Before: cRio and Breakout Board After: Arduino Shield ARDUINO SHIELD • Shield features – Robust, will not disconnect – Mounts to lexan, space efficient – Incorporates: • • • • Arduino RC Reciever LED driver circuit E stop circuit ARDUINO SHIELD • Allows Jaguar Motor Controller power to be cut from wireless controller. • Circuit Designed to interface with existing Jaguar power relay circuit (used to have positive side of relays triggered by cRio) ARDUINO CODE • Constantly polls values from RC receiver • Publishes these values to ROS • LEDs are connected to Arduino, changes color based on remote control state • 10 Hz Interrupt • Get encoder values • Publish values to ROS • Clear encoder values DISTANCE TRIAL RESULTS Before After RESULTS MOTOR CONTROL FLOW DIAGRAM • Two operating modes: • Autonomous • Tele-op • Mode determined by remote control TRAILER DESIGN • 35 x 62 trailer for transport of UAVs or other UGVs • Constructed from 1x1 and 2x2 aluminum square channel stock • Attachment via commercially available 2 inch Hitch-Ball Trailer Coupler • Encoders on wheels of trailer to facilitate driving in reverse CASTER DESIGN • Designed a modular solution for removing front steered wheel • Removing the front wheel would: • Simplify the system • Allow us to use regular differential drive • Conserve power • Currently not implemented, new controls for front wheel are an improvement over last year INTELLIGENCE • Changes to intelligence system: – More intelligent tentacle choice – Implement EKF – Implement stereo vision – Implement SLAM AUTONOMOUS OVERVIEW Deadlines: • • • • • • • • • Compass – Done Wheel Encoders – Done Stereo Vision – 1/12/12 Global Map – 1/20/12 Map Merge – 1/25/12 EKF – 2/1/12 SLAM – 2/15/12 Wavefront – 2/20/12 Path Evaluation – 2/27/12 EXTENDED KALMAN FILTER • Takes many measurements and gives an estimation of the actual value. • Constant loop of prediction and correction • Position and orientation data from: – – – – Wheel encoders Compass GPS Map merge also contributes EXTENDED KALMAN FILTER STEREO VISION • Performed by the ROS node stereo_image_proc • Process: • • • • Rectify images Blur filter Sharpen filter Compare features MAP MERGE • Combines data from the LIDAR, stereo vision cameras, and its global map • Compares common points between maps • Merging provides a better map because – Multiple viewpoints – Random errors reduced • Merging with global map provides localization data that can be used in the EKF SLAM • Simultaneous Localization And Mapping (SLAM) combines results of EKF with global map • Accomplished using the ROS package slam_gmapping which combines the odometry data of the EKF with the SICK LIDAR scans • Creates an occupancy grid that can be subscribed to SIMPLE SLAM EXAMPLE + Old global map = Local map New global map DRIVING WITH TENTACLES • Projects arcs from turning radius • Eliminates those that touch obstacles • Evaluates the best remaining tentacle – Currently Based on the one closest to the path given by A* TENTACLE EVALUATION FUNCTION • Explore three options: – A* (currently implemented) – Wavefront – Recursive tentacle evaluation • Evaluate based on: – Time to run – Accuracy – Memory requirements • Algorithms will be given the same test environment, and simulated in RViz LINE DETECTION • Must detect lines of varying contrast • Currently implemented • Uses 1 camera • Room for improvement with stereo vision – Glare reduction – Larger field of view IGVC ‘12 WINNING COMBINATION • Robust, easy and quick to program system • Low level work complete, allowing for focus on intelligence • New system of probability and SLAM will allow for more accurate positioning • Knowledge from previous years competitions, know what to expect QUALIFICATION REQUIREMENTS • • • • • • • Design Speed Mechanical and Wireless E-stop Safety Light Lane Following Obstacle Avoidance Waypoint Navigation SOURCES • 2010 MQP Report: Design and Realization of an Intelligent Ground Vehicle • 2011 MQP Report: Realization of Performance Advancements for WPI’s UGV – Prometheus • Intelligent Ground Vehicle Competition rules located at www.igvc.org/rules.htm • Stereo vision information and examples courtesy of the stereo_image_proc website located at www.ros.org/wiki/stereo_image_proc • SLAM information courtesy of the gmapping website located at www.ros.org/wiki/gmapping Official Competition Details, Rules and Format The 20TH Annual Intelligent Ground Vehicle Competition (IGVC) June 8th - 11TH, 2012 Oakland University Rochester, Michigan In memory of Paul Lescoe New Items: Autonomous & Navigation Challenges fully Integrated into the Auto-Nav Challenge Course length 1000ft, 10 min Two vehicles on course at once, starting 5 minutes apart Slow vehicles will have to yield with judges call Obstacle Driving Clearance reduced to 5 feet Maximum vehicle with reduced to 4 feet Student teams are invited to display their vehicles at The Association for Unmanned Vehicle Systems International’s Unmanned Systems North America 2012 Symposium & Exhibition Held at LasVegas Nev 7-10 August , 2012 December 19th, 2011 Version Page 1 of 23 TABLE OF CONTENTS I COMPETITION INFORMATION I.1 TEAM ENTRIES I.2 VEHICLE CONFIGURATION I.3 PAYLOADS I.4 QUALIFICATION I.5 INDEMNIFICATION AND INSURANCE II AUTO-NAV CHALLENGE II.1 OBJECTIVE II.2 VEHICLE CONTROL II.3 OBSTACLE COURSE II.4 COMPETITION RULES & PROCEDURES II.5 PRACTICE COURSE II.6 TRAFFIC VIOLATION LAWS II.7 HOW COMPETITION WILL BE JUDGED II.8 GROUNDS FOR DISQUALIFICATION III DESIGN COMPETITION III.1 OBJECTIVE III.2 WRITTEN REPORT III.3 ORAL PRESENTATION III.4 EXAMINATION OF THE VEHICLE III.5 FINAL SCORING IV JAUS CHALLENGE V.1 TECHNICAL OVERVIEW V.2 COMMON OPERATING PICTURE V.3 COMMUNICATIONS PROTOCOLS V.4 JAUS SPECIFIC DATA V.5 COMPETITION TASK DESCRIPTION V.6 TRANSPORT DISCOVERY V.7 CAPABILITIES DISCOVERY V.8 SYSTEM MANAGEMENT V.9 VELOCITY STATE REPORT V.10 POSITION AND ORIENTATION REP V AWARDS AND RECOGNITION VI.1 AUTONOMOUS CHALLENGE VI.2 DESIGN COMPETITION VI.3 JAUS CHALLENGE VI.4 ROOKIE OF THE YEAR AWARD VI.5 GRAND AWARD VI.6 PUBLICATION AND RECOGNITION Page 2 of 23 I. COMPETITION INFORMATION I.1 TEAM ENTRIES Teams may be comprised of undergraduate and graduate students, and must be supervised by at least one faculty advisor. Interdisciplinary (Electrical, computer, mechanical, systems engineering, etc.) teams are encouraged. Students must staff each team. Only the student component of each team will be eligible for the awards. Faculty supervisor will certify that all team members are bonafide students on application form and will also provide contact information (telephone number and e-mail address) for him and the student team leader on the form. Business/Non-Engineering students are encouraged to join teams to promote marketing, sponsorships, and other program management functions. For a student to be eligible to compete as a team member, they are required to have attended at least one semester of school as a registered student between June 2011 and June 2012. Team sponsors are encouraged. Sponsors' participation will be limited to hardware donation and/or funding support. Sponsors logos may be placed on the vehicle and may be displayed inside of the team maintenance area. Teams should encourage sponsor attendance at the IGVC. Schools are encouraged to have more than one entry; but are limited to a maximum of three per school, and each vehicle must have a separate team of students and a distinct design report. Each entry must be based on a different chassis and software and must be documented by a separate application form and design report, submitted in accordance with all deadlines. All entries must have a team name and each application form must be TYPED and accompanied with a $250.00 non-refundable registration fee made payable to Oakland University. Intention to compete must be received no later than February 28, 2012, by mailing your application form to: Gerald C. Lane C/O Dr. Ka C. Cheok 102A SEB SECS-ECE Dept. Oakland University Rochester, MI 48309-4478 If you have any questions, please contact Andrew Kosinski by telephone at (586) 282-9389, fax: (586) 282-8684 or e-mail: [email protected]. I.2 VEHICLE CONFIGURATION The competition is designed for a small semi-rugged outdoor vehicle. Vehicle chassis can be fabricated from scratch or commercially bought. Entries must conform to the following specifications: • • • • • • Design: Must be a ground vehicle (propelled by direct mechanical contact to the ground such as wheels, tracks, pods, etc. or hovercraft. Length: Minimum length three feet, maximum length seven feet. Width: Minimum width two feet, maximum width five feet. Height: Not to exceed 6 six feet (excluding emergency stop antenna). Propulsion: Vehicle power must be generated onboard. Fuel storage or running of internal combustion engines and fuel cells are not permitted in the team maintenance area (tent/building). Average Speed: Speed will be checked at the end of a challenge run to make sure the average speed of the competing vehicle is above one (1) mph over the course completed. Vehicle slower than the minimum average speed will be disqualified for the run. Page 3 of 23 • • • • • • Minimum Speed: There will be a stretch of about 44 ft. long at the beginning of a run where the contending vehicle must consistently travel above 1 mph. A vehicle slower than this speed is considered to “hold-up traffic” and will be disqualified. Maximum Speed: A maximum vehicle speed of ten miles per hour (10 mph) will be enforced. All vehicles must be hardware governed not to exceed this maximum speed. No changes to maximum speed control hardware are allowed after the vehicle passes Qualification. Mechanical E-stop location: The E-stop button must be a push to stop, red in color and a minimum of one inch in diameter. It must be easy to identify and activate safely, even if the vehicle is moving. It must be located in the center rear of vehicle at least two feet from ground, not to exceed four feet above ground. Vehicle E-stops must be hardware based and not controlled through software. Activating the E-Stop must bring the vehicle to a quick and complete stop. Wireless E-Stop: The wireless E-Stop must be effective for a minimum of 100 feet. Vehicle E-stops must be hardware based and not controlled through software. Activating the E-Stop must bring the vehicle to a quick and complete stop. During the Auto-Navevent, the wireless E-stop will be held by the Judges. Safety Light: The vehicle must have an easily viewed solid indicator light which is turned on whenever the vehicle power is turned on. The light must go from solid to flashing whenever the vehicle is in autonomous mode. As soon as the vehicle comes out of autonomous mode the light must go back to solid. Payload: Each vehicle will be required to carry a 20-pound payload. The shape and size is approximately that of an 18" x 8" x 8" cinder block. Refer to section I.3 Payload. I.3 PAYLOAD The payload must be securely mounted on the vehicle. If the payload falls off the vehicle during a run, the run will be terminated. The payload specifications are as follows: 18 inches long, 8 inches wide, 8 inches high and a weight of 20 pounds. I.4 QUALIFICATION All vehicles must pass Qualification to receive standard award money in the Design Competition and compete in the Auto Nav performance event. To complete Qualification the vehicle must pass/perform all of the following criteria. • • • • • • • Length: The vehicle will be measured to ensure that it is over the minimum of three feet long and under the maximum of seven feet long. Width: The vehicle will be measured to ensure that it is over the minimum of two feet wide and under the maximum of four feet wide. Height: The vehicle will be measured to ensure that it does not to exceed six feet high; this excludes emergency stop antennas. Mechanical E-stop: The mechanical E-stop will be checked for location to ensure it is located on the center rear of vehicle a minimum of two feet high and a maximum of four feet high and for functionality. Wireless E-Stop: The wireless E-Stop will be checked to ensure that it is effective for a minimum of 100 feet. During the performance events the wireless E-stop will be held by the Judges. Safety Light: The safety light will be checked to ensure that when the vehicle is powered up the light is on and solid and when the vehicle is running in autonomous mode, the light goes from solid it to flashing, then from flashing to solid when the vehicle comes out of autonomous mode Speed: The vehicle will have to drive over a prescribed distance where its minimum and maximum speeds will be determined. The vehicle must not drop below the minimum of one mile Page 4 of 23 • • • per hour and not exceed the maximum speed of ten miles per hour. Minimum speed of one mph will be assessed in the fully autonomous mode and verified over a 44 foot distance between the lanes and avoiding obstacles. No change to maximum speed control hardware is allowed after qualification. If the vehicle completes a performance event at a speed faster than the one it passed Qualification at, that run will not be counted. Lane Following: The vehicle must demonstrate that it can detect and follow lanes. Obstacle Avoidance: The vehicle must demonstrate that it can detect and avoid obstacles. Waypoint Navigation: Vehicle must prove it can find a path to a single two meter navigation waypoint by navigating around an obstacle. During the Qualification the vehicle must be put in autonomous mode to verify the mechanical and wireless E-stops and to verify minimum speed, lane following, obstacle avoidance and waypoint navigation. The vehicle software cannot be reconfigured for waypoint navigation qualification. It must be integrated into the original autonomous software.. For the max speed run the vehicle may be in autonomous mode or joystick/remote controlled. Judges will not qualify vehicles that fail to meet these requirements. Teams may fine tune their vehicles and resubmit for Qualification. There is no penalty for not qualifying the first time. Vehicles that are judged to be unsafe will not be allowed to compete. In the event of any conflict, the judges’ decision will be final. I.5 INDEMNIFICATION AND INSURANCE Teams will be required to submit an Application Form prior to February 28, 2012. The Application Form can be downloaded from www.igvc.org. Each Team's sponsoring institution will also be required to submit a Certificate of Insurance at the time the Application Form is submitted. The certificate is to show commercial general liability coverage in an amount not less than $1 million. In addition, each individual participating at the competition will be required to sign a Waiver of Claims when they arrive at site and before they can participate in the IGVC events. NOTE: The IGVC Committee and Officials will try to adhere to the above official competition details, rules and format as much as possible. However, it reserves the right to change or modify the competition where deemed necessary for preserving fairness of the competition. Modifications, if any, will be announced prior to the competition as early as possible. Page 5 of 23 II AUTO-NAV CHALLENGE COMPETITION All teams must pass Qualification to participate in this event. II.1 OBJECTIVE A fully autonomous unmanned ground robotic vehicle must negotiate around an outdoor obstacle course under a prescribed time while maintaining an average course speed of one mph, a minimum of speed of one mph over a section and a maximum speed limit of ten mph, remaining within the lane, negotiating flags and avoiding the obstacles on the course. Judges will rank the entries that complete the course based on shortest adjusted time taken. In the event that a vehicle does not finish the course, the judges will rank the entry based on longest adjusted distance traveled. Adjusted time and distance are the net scores given by judges after taking penalties, incurred from obstacle collisions and boundary crossings, into consideration. II.2 VEHICLE CONTROL Vehicles must be unmanned and autonomous. They must compete based on their ability to perceive the course environment and avoid obstacles. Vehicles cannot be remotely controlled by a human operator during competition. All computational power, sensing and control equipment must be carried on board the vehicle. No base stations allowed for positioning accuracy is allowed. Teams are encouraged to map the course and use that information to improve their performance on the course. II.3 OBSTACLE COURSE The course will be laid out on grass over an area of approximately 500 feet long by 240 feet wide and minimum of 1000 feet in length. This distance is identified so teams can set their maximum speed to complete the course pending no prior violations resulting in run termination. Track width will vary from ten to twenty feet wide with a turning radius not less than five feet. The course outer boundaries will be designated by continuous or dashed white lane markers (lines) approximately three inches wide, painted on the ground. Track width will be approximately ten feet wide with a turning radius not less than five feet. Alternating side-to-side dashes will be 15-20 feet long, with 10-15 feet separation. A minimum speed will be required of one mph and will be a requirement of Qualification and verified in each run of the Autonomous Challenge. If the vehicle does not average one mph for the first 44 feet (30 seconds) from the starting line, the vehicle run will be ended. The vehicle will then need to average over one mph for the entire run. Competitors should expect natural or artificial inclines with gradients not to exceed 15% and randomly placed obstacles along the course. The course will become more difficult to navigate autonomously as vehicle progresses. Obstacles on the course will consist of various colors (white, orange, brown, green, black, etc.) of construction barrels/drums that are used on roadways and highways. Natural obstacles such as trees or shrubs and manmade obstacles such as light posts or street signs could also appear on the course. The placement of the obstacles may be randomized from left, right, and center placements prior to every run. There will be a minimum of five feet clearance, minimum passage width, between the line and the obstacles; i.e., if the obstacle is in the middle of the course then on either side of the obstacle will be five feet of driving space. Or if the obstacle is closer to one side of the lane then the other side of the obstacle must have at least five feet of driving space for the vehicles. Also on the course there will be complex barrel arrangements with switchbacks and center islands. These will be adjusted for location between runs. Direction of the obstacle course will change between heats. Alternating red (right) flags (Grainger part no.3LUJ1) and green (left) flags (Grainger part no.3LUJ6) will be placed on the later part of the course. Flags will have a minimum passage width between them of six feet; i.e., if the flag is near the edge of the course then between the flag and the line will be six feet of driving space. Flags are not obstacles and vehicles can touch flags to increase speed Page 6 of 23 and optimized route, vehicles are not allowed to go over flags. The objective is for the vehicle to stay to the left of the red flags and to the right of the green flags. Flags can be staggered or the vehicle could be driving through a set of flags. Example Auto-Nav Challenge Layout Auto-Nav Challenge will contain eight Global Positioning System (GPS) waypoints, one at each entry and exit and three on each side of the navigation no-man’s land separated by a fence with three alternating gates Distance achieved will be totaled by adding straightline distances between waypoints and added to total distance driving on lined portion of the course. The open space between the navigation waypoints will contain a mix of obstacles which must be avoided while staying with-in the course. The exact waypoint locations will be marked on the grass for use by the judges, but there will be no standup markers to indicate those positions. Construction barrels, barricades, fences, and certain other obstacles will be located on the course in such positions that they must be circumvented to reach the waypoints. These may be randomly moved between runs. The course will be divided into two areas by a fence with a two meter wide opening located somewhere along it (no coordinates are provided). The opening will be randomly relocated along the fence at the start of each run. waypoints will have two meter circles around them. Auto-Nav Course direction will change for each run of a Heat. II.4 COMPETITION RULES & PROCEDURES • • The competition will take place in the event of light rain or drizzle but not in heavy rain or lightning. Each qualified team will have the up to two runs (time permitting) in each of three heats. Page 7 of 23 • • • • • • • • • • • Judges/officials will assign a designated starting order. Teams will setup on-deck in that order. Failure to be on-deck will place you at the end of the order for the run and may forfeit you final (second) run in a heat based on heat time completion. No team participant is allowed on the course before the team’s first run, and only one student team member is allowed on the course during a run. This shall in no case be the faculty advisor. At the designated on-deck time, the competing team will be asked to prepare their vehicle for an attempt. On-deck teams start in the order they arrive in the starting area unless they give way to another team. A Starting Official will call teams to the starting line. The Starting Official’s direction is final. The Starting Officials may alter the order to enhance the competition flow of entries; e.g. slower vehicles may be grouped together to allow successive running of two vehicles on the course simultaneously. A team will have one minute in the starting point to prep the vehicle at the starting line and point out to the Competition Judges the buttons to start and stop the vehicle, The Competition Judge will start the vehicle by a one touch motion; i.e. pushing a remote control button, hitting the enter key of a keyboard, a left mouse click, lifting the e-stop up, flipping a toggle switch, etc. The Competition Judge will also carry the E-Stop. An attempt will be declared valid when the Competition Judge initiates the start signal at designated competing time. An attempt will continue until one of the following occurs: o The vehicle finishes the course. o The vehicle was E-Stopped by a judge’s call. o The team E-Stops the vehicle. o Five minutes have passed after the vehicle run has started. o The vehicle has not started after one minute after moving to the start line or at the judges’ discretion. Time for each heat will be strictly observed. Tactile sensors will not be allowed. Each vehicle will be given 10minutes per attempt to complete the course, if the vehicle has not completed the course in the 10 minute time period, the attempt will ended by a judge’s choice Estop, with no additional penalty for that run. Each vehicle must navigate the course by remaining inside the course boundaries and navigating around course obstacles. For the following Traffic Violations, the appropriate ticket will be issued and deducted from the overall distance or time score. Refer to section II.5 Traffic Violation Laws. Page 8 of 23 II.5 TRAFFIC VIOLATION LAWS Traffic Violations Ticket Value E-Stop Measurement End of Run Yes >60 secs. to 88 ft 1 Hold-up Traffic 2 Leave the Course/Scene - 10 Feet Yes Yes 3 Crash/Obstacle Displacement - 10 Feet Yes Yes 4 Careless Driving - 5 Feet No No 5 Sideswipe/Obstacle Touch - 5 Feet No No 6 Student's Choice E-Stop - 5 Feet Yes Yes 7 Judge's Choice E-Stop 0 Feet Yes Yes 8 Blocking Traffic - 5 Feet Yes Yes 9 Loss of Payload 0 Feet Yes Yes 10 Wrong Side of Flag -5 Feet No No 11 Run over Flag -10 Feet Yes Yes Disqualified No No 12 Too slow, did not average 1 mph • • • • • • • • • • • • Hold-up traffic: Must maintain 1 mph, there will be a speed check at 44 foot mark of the course, will result in end of run with time recorded Leave the scene\course: All portions of the vehicle cross the boundary. The overall distance will be measured from the starting line to the furthest point where the final part of the vehicle crossed the boundary outside edge. Crash: The overall distance will be measured from the starting line to the collision point with the obstacle. Careless Driving: Crossing the boundary while at least some part of the vehicle remains in bounds. Student E-Stop: Student e-stop is used if the team feels that there may be damaged caused to their vehicle or they know that it is stuck and want to end their time. Judge E-Stop: The overall distance will be measured from the starting line to the front of the vehicle or where the final/furthest remaining part of vehicle if stopped, crossed the boundary outside edge. Obstacle Displacement: Defined as displacing permanently the obstacle from its original position. Rocking/Tilting an obstacle with no permanent displacement is not considered obstacle displacement. Blocking Traffic: Vehicles stopping on course for over one minute will be E-Stopped and measured. Loss of Payload: If the payload falls of the vehicle the run will be ended. Wrong Side of Flag: Vehicles must remain on the left side of red flags and the right side of green flags. Run over Flag: Vehicles drive over the top of a red or green flag will results in End of Run. Too Slow: If the vehicle does not maintain 1 mph minimum average speed limit throughout the course this run is disqualified. Page 9 of 23 II.6 PRACTICE COURSE All teams that have qualified will be given three tokens. Each token represent one opportunity to use the Auto-Nav Challenge Practice Course. The course will be open daily for use from the time a team Qualifies till the start of the third heat of the Autonomous Challenge. The course will focus on the nomans land portion of the Autonomous Challenge with the same rules and similar obstacles, fence & gates. One token allows a maximum of five minutes (one minute at the start point and five minutes for the run) on the Autonomous Challenge Practice Course. In that time you must position your vehicle at the start, prep the vehicle for the judge to start, and can continue to run as long as you do not break any of the rules of the Autonomous Challenge. If so, your run and remaining time will be ended. All teams will still have unlimited access to the regular practice fields. II.7 HOW COMPETITION WILL BE JUDGED • • • • • • A team of judges and officials will determine compliance with all rules. Designated competition judges will determine the official times, distances and ticket deductions of each entry. At the end of the competition, those vehicles crossing the finish line will be scored on the time taken to complete the course minus any ticket deductions. Ticket values will be assessed in seconds (one foot = one second) if the vehicle completes the course within the five minute run time. The team with the adjusted shortest time will be declared the winner. In the event that no vehicle completes the course, the score will be based on the distance traveled by the vehicle minus the ticket deductions. The team with the adjusted longest distance will be declared the winner. For standard award money consideration, entry must exhibit sufficient degree of autonomous mobility by passing the money barrel. The money barrel location is determined by the judges during the final/actual course layout. If a tie is declared between entries, the award money will be split between them. If your vehicle is overtaken by a faster vehicle you will be commanded to stop and your time will be recorded and allowed to be restarted with remaining time after the faster vehicle passes.. Total distance will be assessed at the 10 minute mark. II.8 GROUNDS FOR DISQUALIFICATION • • • • Judges will disqualify any vehicle which appears to be a safety hazard or violate the safety requirements during the competition. Intentional interference with another competitor's vehicle and/or data link will result in disqualification of the offending contestant's entry. Damaging the course or deliberate movement of the obstacles or running over the obstacles may result in disqualification. Actions designed to damage or destroy an opponent's vehicle are not in the spirit of the competition and will result in disqualification of the offending contestant's entry. Page 10 of 23 III. DESIGN COMPETITION All teams must participate in the Design Competition. III.1 OBJECTIVE Although the ability of the vehicles to negotiate the competition courses is the ultimate measure of product quality, the officials are also interested in the design strategy and process that engineering teams follow to produce their vehicles. Design judging will be by a panel of expert judges and will be conducted separate from and without regard to vehicle performance on the test course. Judging will be based on a written report, an oral presentation and examination of the vehicle. Design innovation is a primary objective of this competition and will be given special attention by the judges. Innovation is considered to be a technology (hardware or software) that has not ever been used by this or any other vehicle in this competition. The innovation needs to be documented, as an innovation, clearly in the written report and emphasized in the oral presentation. III.2 WRITTEN REPORT The report should not exceed 15 letter-sized pages, including graphic material and all appendices, but not including the title page. Reports will lose 5 points in scoring for each page over 15. Line spacing must be at least 1.5, with at least a 10 point font (12 is preferred). Each vehicle must have a distinct and complete report of its own (a report cannot cover more than one vehicle). Participants are required to submit four hard copies of the report and an electronic copy in PDF format on a CD; failure to submit either of these will result in disqualification. All reports, both for new vehicles and for earlier vehicles with design changes, must include a statement signed by the faculty advisor certifying that the design and engineering of the vehicle (original or changes) by the current student team has been significant and equivalent to what might be awarded credit in a senior design course. The certification should also include a brief description of the areas in which changes have been made to a vehicle from a previous year. Everything must be mailed so as to arrive by May 10, 2012, addressed to: Bernard Theisen 21281 Curie Avenue Warren, MI 48091-4316 Written reports arriving after that date will lose 10 points in scoring for each business day late, electronic copies arriving after that date will lose 5 points in scoring for each business day late. Teams are encouraged to submit reports even several weeks early to avoid the last minute rush of preparing vehicles for the competition, and there will be no penalty for last minute changes in the vehicle from the design reported. The electronic copy of the report will be posted on the competition's web site in PDF format after the completion of the competition. The paper should present the conceptual design of the vehicle and its components. Especially important to highlight are any unique innovative aspects of the design and the intelligence aspects of the vehicle. Also included must be descriptions of: electronics electrical system actuators software strategy sensors computers mapping design planning process signal processing plan for path following (both solid & dashed lines) plan for control decisions system integration plan high speed operations Page 11 of 23 Design of the lane following and obstacle detection/avoidance systems must be specifically described. Along with how the vehicle uses mapping techniques to perceive and navigate through its environment. Describe how the system uses GPS for waypoint navigation and localization. Components acquired ready-made must be identified, but their internal components need not be described in detail. The steps followed during the design process should be described along with any use of Computer-Aided Design (CAD). How considerations of safety, reliability, and durability were addressed in the design process should be specifically described, as well as problems encountered in the design process and how they were overcome. The analysis leading to the predicted performance of the vehicle should be documented, specifically: • Speed • Ramp climbing ability • Reaction times • Battery life • Distance at which obstacles are detected • How the vehicle deals with complex obstacles including switchbacks and center islands dead ends, traps, and potholes • Accuracy of arrival at navigation waypoints • Comparison of these predictions with actual trial data is desirable. Although cost itself is not a factor in judging (these are considered research vehicles), the report should include a cost estimate (not counting student labor) for the final product if it were to be duplicated. A breakdown of the cost by component is helpful. The team organization and the names of all members of the design team, with academic department and class, should be included along with an estimate of the project's total number of person-hours expended. Vehicles that have been entered in IGVC in earlier years and have not had significant changes in design are ineligible in either the design or performance events. Vehicles that have been changed significantly in design (hardware or software) from an earlier year are eligible, but will require a completely new design report (15 pages or less) treating both the old and new features, thus describing the complete vehicle as if it were all new. Judges will score the written reports as follows: 1. Conduct of the design process and team organization (including decision-making & software development) 2. Completeness of the documentation 3. Quality of documentation (English, grammar, and style) 4. Effective innovation represented in the design (as described above) 5. Description of mapping technique 6. Description of electronic design 7. Description of software strategy 8. Description of systems integration Descriptions to include: lane following, obstacle detection/ avoidance, and waypoint navigation (GPS or other) 9. Efficient use of power and materials 10. Attention given to safety, reliability, and durability Total Page 12 of 23 Maximum Points 50 50 50 150 100 100 150 150 50 50 900 III.3 ORAL PRESENTATION The technical talk should relate the highlights of the written report described above and include any updates of the design since the written report. Audio or video tape presentations of the text are not allowed, but graphic aids may be presented by video, slide projection, computer projection, overhead transparencies, or easel charts. The presentation must be made by one or more student members of the team to the judges and other interested members of the audience and should last not more than 10 minutes. A penalty of 5 points will be assessed for each minute or fraction thereof over 11 minutes. After the presentation, judges only may ask questions for up to 5 minutes. The audience should be considered as a senior management group of generally knowledgeable engineers upon whom the project is dependent for funding and the team is dependent for their employment. Scoring will be as follows: Judges will score the oral presentations as follows: 1.Clear and understandable explanation of the innovations 2. Logical organization of the talk 3. Effective use of graphic aids 4. Articulation 5. Demonstrated simulation of vehicle control in performance events 6. Response to questions 7. Salesmanship Total Maximum Points 50 25 25 20 10 10 10 150 Effective use of graphic aids includes not blocking the view of the screen by the presenter and simple enough graphics that are large enough to read (block diagrams rather than detailed circuit diagrams). Articulation refers to the clarity and loudness of speaking. Response to questions means short answers that address only the question. Salesmanship refers to the enthusiasm and pride exhibited (why this vehicle is the best). Participants are responsible for providing their own visual aids and related equipment (the vehicle itself may be displayed). A computer-connected projector will be made available. Projectors may also be supplied by the participants. During the oral presentation, the following question period and the examination of the vehicle, team members sitting the audience may participate by assisting the oral presenters, but at no time is the faculty advisor to participate in this part of the design competition. III.4 EXAMINATION OF THE VEHICLE The vehicle must be present and will be examined by the judges preferably immediately after the oral presentation or at another convenient time the time during the competition. Software is not included in this judging. Judging will be as follows: Judges will score the vehicle examinations as follows: 1. Packaging neatness, efficient use of space 2. Serviceability 3. Ruggedness 4. Safety 5. Degree of original content in the vehicle (as opposed to ready-made) 6. Style (overall appearance) Total Page 13 of 23 Maximum Points 20 20 20 20 50 20 150 III.5 FINAL SCORING The number of points awarded by the individual judges will be averaged for each of the 23 judging areas above, and these results will be offered to each participating team for their edification. The total of the average scores over all 23 areas (max 1200) will be used to determine the ranking. When two teams of judges are used (due to a large number of entries) each judging team will determine the top three winners in their group, and the resulting six contestants will participate in a runoff of oral presentations and vehicle examinations judged by all judges to determine an overall Design Winner. The six teams will be judged in random order. For the Finals competition four criteria from the written report judging will be added to the normal oral presentation scoring shown above for preliminary judging. Thus, the Finals Oral presentation scoring will have maximum points as below: Judges will score the final presentations as follows: 1.Clear explanation of the innovations 2. Description of mapping technique 3. Description of Electronic Design 4. Description of Software Strategy 5. Description of System Integration 6. Logical organization of the talk 7. Effective use of graphic aids 8. Articulation 9. Demonstrated Simulation of Vehicle Control 10. Response to questions 11. Salesmanship Total Maximum Points 50 30 30 30 30 50 25 25 10 10 10 300 The vehicle examination scoring will be the same as in the preliminary judging, as shown above. Page 14 of 23 IV. JAUS Challenge Participation in the JAUS Challenge is recommended. IV.1 TECHNICAL OVERVIEW Each entry will interface with the Judge’s COP providing information as specified below. The general approach to the JAUS interface will be to respond to a periodic status and position requests from the COP. This requires the support of the JAUS Transport Specification (AS5669A) and the JAUS Core Service Set (AS5710). The JAUS Transport Specification supports several communication protocols, the competition will use only the Ethernet based JUDP. The Core services required for the competition include the discovery, access control, and management services. The JAUS Mobility Service Set (AS6009) or JSS-Mobility defines the messaging to be used for position communications and waypoint based navigation. IV.2 COMMON OPERATING PICTURE The COP will provide a high level view of the systems in operation that successfully implement the JAUS protocol as described above. This software is a simple validation, reporting and recording tool for the Judges to use while verifying student implementations of the JAUS standard. It provides a graphical display of the operational area in relative coordinates. Primitive graphics are loaded in the display of the COP to add perspective. Each reported status is displayed on the COP user interface and recorded for future reference. For competitions and systems reporting positional data, a 2-D map on the COP display is annotated with the updated position as well as track marks showing the previous position of the system for the current task. IV.3 COMMUNICATIONS PROTOCOLS The teams will implement a wireless 802.11b/g or hardwired Ethernet (RJ-45) data link. The interface can be implemented at any point in the student team’s system including the control station or mobility platform. The Internet Protocol (IP) address to be used will be provided at the competition. For planning purposes, this address will be in the range of 192.168.1.100 to 192.168.1.200. The Judge’s COP will have both hard-wire and 802.11b/g capabilities where the IP address of the COP will be 192.168.1.42. All teams will be provided an IP address to be used during the competition. The last octet of the IP address is significant, as it will also be used as the subsystem identifier in the team’s JAUS ID. The port number for all JAUS traffic shall be 3794. IV.4 JAUS SPECIFIC DATA The JAUS ID mentioned above is a critical piece of data used by a JAUS node to route messages to the correct process or attached device. As indicated above each team will be provided an IP address in which the last octet will be used in their respective JAUS ID. A JAUS ID consists of three elements, a Subsystem ID, a Node ID and a Component ID. The Subsystem ID uniquely identifies a major element that is an unmanned system, an unmanned system controller or some other entity on a network with unmanned systems. A Node ID is unique within a subsystem and identifies a processing element on which JAUS Components can be found. A Component ID is unique within a Node represents an endpoint to and from which JAUS messages are sent and received. The last octet of the assigned IP address will be used as the team’s JAUS Subsystem ID. So for the team assigned the IP address of 192.168.1.155, the completed JAUS ID of the position-reporting component might be 155-1-1 where the Page 15 of 23 node and component are both assigned the IDs of 1. This is shown in the IP and JAUS ID Assignment Figure below. The Node ID and Component ID are discussed further in the JAUS Service Interface Definition Language standard (AS5684). The COP software will be programmed with the assumption that all services required by the specific competition are implemented on a single component. IP and JAUS ID Assignment In summary, each team will be assigned an IP address by the judges. The last octet of that IP address will be the team’s subsystem identifier. The COP will be a subsystem as will each team’s entry in the competition. The COP will have a JAUS ID of 42:1:1 and an IP address of 192.168.1.42. The port number shall be 3794. IV.5 COMPETITION TASK DESCRIPTION Messages passed between the COP and the team entries will include data as described in the task descriptions below. The COP will initiate all requests subsequent to the discovery process described as Task 1. A system management component is required of all teams. This interface will implement several of the messages defined by the Management Service defined in the JSS-Core. This service inherits the Access Control, Events and Transport services also defined by the JSS-Core document. The implementation of the Access Control interfaces will be necessary to meet the JAUS Challenge requirements; however no messages from the Events service will be exercised. The sequence diagram in Discovery and System Management Figure shows the required transactions for discovery including the access control setup and system control protocol. This interaction is required for every task. The judges will evaluate each team’s ability to meet the Interoperability Challenge for the tasks described below in accordance with the scoring chart. Judges will score the task as follows: 1. Transport Discovery 2. Capabilities Discovery 3. System Management 4. Velocity State Report 5. Position and Orientation Report 6. Waypoint Navigation Total Page 16 of 23 Maximum Points 10 10 10 10 10 10 60 IV.6 TRANSPORT DISCOVERY For any two elements in the system to communicate meaningful data there must first be a handshake to ensure both sides use the same protocols and are willing participants in the interaction. For the sake of simplicity, the team’s entry shall initiate the discovery protocol with the Judge’s COP, and the IP address and JAUS ID of the COP shall be fixed. The IP address and JAUS ID of the Judge’s COP are defined as: COP IP ADDRESS: COP JAUS ID: 192.168.1.42:3794 42-1-1 (Subsystem-Node-Component) The discovery process, in Discovery and System Management Figure, will occur at the application layer. The student team’s JAUS element will send a request for identification to the COP once every 5 seconds. The COP will respond with the appropriate informative message and request identification in return from the team’s JAUS interface. After the identification report from the COP, the team entry will stop repeating the request. This transaction will serve as the basic discovery between the two elements. The COP software will be programmed with the assumption that all services required by the specific competition are provided at the single JAUS ID. Furthermore, as per the AS5669A Specification, the team’s entry shall receive JUDP traffic at the same IP address and port number that initiated the discovery protocol. Teams should note that this is different from common UDP programming approaches in which the outbound port for sent messages is not bound. Page 17 of 23 Discovery and System Management The following table shows the messages sent from the COP to the team’s entry, along with the expected response and minimal required fields to be set using the presence vector (PV) if applicable, required to complete this portion of the challenge: Input Messages Query Identification Expected Response Report Identification Required Fields (PV) N/A IV.7 CAPABILITIES DISCOVERY Following the completion of the Transport Discovery handshake the COP will query the entry for its capabilities. The Query Services message and Report Services message are defined in the AS5710 document and require the inheritance of the Transport service. The COP will send a Query Services message to a student team entry. Upon receipt of the message the student team entry shall respond with a properly formed Report Services message. The following table shows the messages sent from the COP to the team’s entry, along with the expected response and minimal required fields to be set using the presence vector (PV) if applicable, required to complete this portion of the challenge: Input Messages Query Identification Expected Response Report Identification Required Fields (PV) N/A IV.8 SYSTEM MANAGEMENT The implementation of the status report is required. This interoperability task, like the discovery tasks above, is also a prerequisite for all other tasks. The task begins with the discovery handshake as described above and continues for an indeterminate period of time. The protocol is given in Discovery and System Management Figure. The following table shows the messages sent from the COP to the team’s entry, along with the expected response and minimal required fields to be set using the presence vector (PV) if applicable, required to complete this portion of the challenge: Input Messages Query Control Request Control Query Status Resume Standby Shutdown Expected Response Report Control Confirm Control Report Status <none> <none> <none> Required Fields (PV) N/A N/A N/A N/A N/A N/A IsaV.9 VELOCITY STATE REPORT In the Velocity State Report task the COP will query the entry for its current velocity state. The COP will send a Query Velocity State message to a student team entry. Upon receipt of the message the student team entry shall respond with a properly formed Report Velocity State message. The following table shows the messages sent from the COP to the team’s entry, along with the expected response and minimal required fields to be set using the presence vector (PV) if applicable, required to complete this portion of the challenge: Input Messages Query Velocity State Expected Response Report Velocity State Page 18 of 23 Required Fields (PV) Velocity X, Yaw Rate & Time Stamp [320 Decimal, 0140h] V.10 POSITION AND ORIENTATION REPORT For performing the task Position and Orientation Report, the discovery and status protocols described above are also required. In addition to the COP queries for status, the vehicle systems will also be required to respond correctly to local position queries. The reports will be validated for relative position and with respect to a relative time offset to ensure the time contained within each position report is valid with respect to some timer within the entry’s system. In other words, the position reports must show that the travel occurred at a reasonable speed and not instantaneously. Additional variation in the position reporting using the available presence vectors is allowed. Minimally, all entries must report X, Y and Time Stamp. The following table shows the messages sent from the COP to the team’s entry, along with the expected response and minimal required fields to be set using the presence vector (PV) if applicable, required to complete this portion of the challenge: Input Messages Set Local Pose Expected Response <none> Query Local Pose Report Local Pose Required Fields (PV) X, Y & Yaw [67 Decimal, 0043h] X, Y & Time Stamp [259 Decimal, 0103h] V.11 WAYPOINT NAVIGATION The team entry shall implement the Local Waypoint List Driver service from the JAUS Mobility Service Set (AS6009). From a starting point in the JAUS challenge test area the student entry will be commanded to traverse, in order, a series of 4 waypoints. Time will be kept and will start at the moment that the student entry exits the designated start box. Upon leaving the start box the student entry will proceed to the first waypoint in the list. Upon satisfactorily achieving each waypoint the team will be credited with 2.5 points. Time is kept for each waypoint achieved. The shortest overall time taken to achieve this task will determine the winner in the event of a tie. The following table shows the messages sent from the COP to the team’s entry, along with the expected response and minimal required fields to be set using the presence vector (PV) if applicable, required to complete this portion of the challenge: Input Messages Set Element Query Element List Query Element Count Execute List Query Active Element Query Travel Query Local Waypoint Expected Response Confirm Element Request Report Element List Report Element Count <none> Report Active Element Report Travel Speed Report Local Waypoint Page 19 of 23 Required Fields (PV) N/A N/A N/A N/Speed (value of 1) N/A N/A X & Y (value of 3) VI. AWARDS AND RECOGNITION All schools are only eligible to win award money once per event (Autonomous Challenge, Design Competition, and JAUS Challenge); if more then one team from the same school places in the same event, only the highest placing team will be placed in a standing and receive money for that event. VI.1 AUTO-NAV CHALLENGE COMPETITION Autonomous Competition Standard Awards 1ST Place 2ND Place 3RD Place 4TH Place 5TH Place 6TH Place $25,000 $5,000 $4,000 $3,000 $2,000 $1,000 Nominal Award Money (Vehicle did not pass Money Barrel) 1ST Place 2ND Place 3RD Place 4TH Place 5TH Place 6TH Place VI.2 $3,000 $2,000 $1,000 $ 750 $ 500 $ 250 VEHICLE DESIGN COMPETITION Design Competition Standard Awards Dr William G. Agnew Award 1ST Place 2ND Place $2,000 3RD Place $1,000 4TH Place $ 750 5TH Place $ 500 6TH Place $ 250 Nominal Award Money (Vehicle did not pass Qualification) 1ST Place 2ND Place 3RD Place 4TH Place 5TH Place 6TH Place $ $ $ $ $ $ 600 500 400 300 200 100 Page 20 of 23 $3,000 IVI.5 JAUS CHALLENGE JAUS Competition Standard Awards 1ST Place 2ND Place 3RD Place 4TH Place 5TH Place 6TH Place $4,000 $3,000 $2,000 $1,000 $ 750 $ 500 Nominal Award Money (Vehicle did not pass Qualification) 1ST Place 2ND Place 3RD Place 4TH Place 5TH Place 6TH Place $ $ $ $ $ $ 600 500 400 300 200 100 IVI.5 ROOKIE-OF-THE-YEAR AWARD The Rookie-of-the-Year Award will be given out to a team from a new school competing for the first time ever or a school that has not participated in the last five competitions (for this year the team would be eligible if they haven’t competed since the thirteenth IGVC in 2006). To win the Rookie-of-the-Year Award the team must be the best of the eligible teams competing and perform to the minimum standards of the following events. In the Design Competition you must pass Qualification, in the Autonomous Challenge you must pass the Rookie Barrel and in the Navigation Challenge you must make three waypoints. The winner of the Rookie-of-the-Year Award will receive $1,000 in award money; in the case the minimum requirements are not met the best of the eligible teams competing will receive $500. Page 21 of 23 VI.6 GRAND AWARD The Grand Award trophies will be, presented to the top three teams that perform the best overall (combined scores per below), in all three competitions. For each competition, points will be awarded to each team, below is a breakdown of the points: Autonomous Challenge First Place Second Place Third Place Fourth Place Fifth Place Sixth Place Passed Money Barrel 48 40 32 24 16 8 Short of Money Barrel 24 20 16 12 8 4 Design Competition First Place Second Place Third Place Fourth Place Fifth Place Sixth Place Vehicle Qualified 24 20 16 12 8 4 Vehicle Failed to Qualify 12 10 8 6 4 2 JAUS Competition First Place Second Place Third Place Fourth Place Fifth Place Sixth Place Vehicle Qualified 24 20 16 12 8 4 Vehicle Failed to Qualify 12 10 8 6 4 2 VI.7 PUBLICATION AND RECOGNITION International recognition of all participating teams through AUVSI and SAE publications. Student Teams are Invited to Display Their Vehicles at The Association for Unmanned Vehicle Systems International’s Unmanned Systems North America 2012 Symposium & Exhibition Held in Las Vegasl teams are invited to display the winning vehicles in the AUVSI exhibit halls. Videos of the competition event will be distributed to sponsors, media and the public. All design reports, articles, videos and pictures will be post on the IGVC website www.igvc.org. Page 22 of 23 If you have any questions, please feel free to contact any of the following IGVC Officials: IGVC Co-Chairs: Ka C Cheok Jerry R. Lane Oakland University SAIC [email protected] [email protected] Autonomous Challenge Lead Judges: Jerry R. Lane SAIC Ka C Cheok Oakland University Jeff Jaczkowski PEO GCS RS JPO Chris Mocnik U.S. Army TARDEC [email protected] [email protected] [email protected] [email protected] Design Competition Lead Judge: Steve Gadzinski Ford Motor Co, (retired) [email protected] JAUS Challenge Lead Judge: Woody English DeVivo AST [email protected] Administrative: Andrew Kosinski [email protected] U.S. Army TARDEC Director of Operations: Andrew Kosinski U.S. Army TARDEC [email protected] Name Bernard Theisen Greg Gill Bernard Theisen Dan Maslach Bernard Theisen Stephen W. Roberts Scot Wheelock Geoff Clark G. Edzko Smid Candy McLellan and G. Edzko Smid Jerry Lane, Paul Lescoe and Ka C. Cheok IGVC Rules Editors 19 December 2011, Version Page 23 of 23 Years as Editor 2006-2011 2005-2006 2004-2005 2003-2004 2001-2003 2000-2001 1999-2000 1998-1999 1997-1998 1996-1997 1992-1996 Three-state Extended Kalman Filter for Mobile Robot Localization Evgeni Kiriy [email protected] Martin Buehler [email protected] April 12, 2002 Summary This report describes the application of an extended Kalman filter to localization of a golf course lawn mower using fiber-optic gyroscope (FOG), odometry, and machine vision sensors. The two machine vision cameras were used to extract angular measurements from the previously surveyed artificial groundlevel markers on the course. The filter showed an average 0.352 m Cartesian error with a standard deviation of 0.296 m in position estimation and a mean error of 0.244o and standard deviation of 3.488o in heading estimation. The errors were computed with respect to the existing high-performance localization system. 1 Introduction For an autonomous lawn mower to be used on a golf course its navigation system must provide accuracy and robustness to assure precision of the resulting mowing pattern. The mower state - its position and orientation in real time - is obtained by combining the available internal and external sensory information using an Extended Kalman Filter (EKF). The internal sensor set consists of front wheel odometers[3] and a fiber optic gyroscope (FOG)[4], the external, absolute sensing is currently achieved by 2 cm accuracy NovAtel ProPack DGPS[5]. The internal and the absolute positioning information is fused in real time by an extended Kalman filter for localization and control of the mower. The existing DGPS high-performance localization system maintained 97% tracking error below a target value of 10 cm [7], and is used as a ground truth. At the same time the high cost of DGPS and its dependence on good satellite visibility calls for an alternative absolute localization system. Absolute positioning based on passive or active landmarks could replace the high-cost DGPS. In addition such a system could also provide reliable 1 2 IMAGE PROCESSING AT CMU 2 absolute positioning in places where the GPS signal is degraded or unavailable. A vision-based passive marker detection was implemented as an alternative to DGPS absolute localization. The local marker approach is general, so the results of the experiment will estimate the localization accuracy obtainable by a marker-based system irrespective of the actual hardware implementation. Two DFW-VL500[8] digital camera modules were mounted on the mower, one in the front and the back, as shown in Figure 1 on page 2. The markers were scattered so that there were three to four markers per 10 m2 in the testing area, allowing the GPS signal to provide 2 cm accuracy positioning and the existing localization system could be used as the ground truth. so that GPS Figure 1: The experimental setup: the mower (foreground) is equipped with the cameras in the front and in the back; the red markers are in front and in the back of the mower. The mower is manually driven during the experiment. signal provided 2 cm accuracy positioning and the existing localization system could be used as the ground truth) The mower was manually driven in a spiral-like trajectory over 50 m by 75 m open flat area. It is assumed that each marker is identifiable and its position is known with at least centimeter level accuracy (actual marker locations were surveyed by the NovAtel DGPS system). 2 Image Processing at CMU The image processing was done at Carnegie Mellon University (CMU), by Parag Batavia and Jeff Mishler. Figure 2 on page 3 shows a typical camera image and is referred to in the overview of the process, according to Jeff Mishler: The mower was driven on a spiral pattern on a field with 28 markers placed at roughly six meter intervals. During the motion 181 image points were extracted and 181 sets of angles are produced using the estimated pose, extracted image points, camera intrinsic and extrinsic parameters, and the marker map. 2 IMAGE PROCESSING AT CMU 3 Figure 2: A typical frame taken by the on-board camera. The colors of the circles are indicated in the figure. • The image name, camera ID, and time stamp are written to the “outimage.log” file as images are obtained and time stamped. • The position information is logged with a time stamp as well, but the image and position time stamps are not identical. To associate the position information with the image, the first position time stamp which is greater or equal to the image time stamp is taken. This gives a reasonable approximation because the position data (“marker-001-poselog.txt” file) is obtained more frequently (about 100 Hz versus 0.5 Hz) than the image data. • The images are run through a segmentation process to obtain the observed marker positions, which correspond to the white circles in the images. They should always line up with the marker in the image, but depend on the quality of the segmentation and may include false positives or missed targets. (This output is the “marker image locations” file, “marker-001-003-segmented.txt”.) • The identity of the markers observed in the image is established. To identify the markers and determine where the target should appear in the given image the information about the vehicle’s location, the marker locations, and the camera locations is used. This involves projecting the 3D marker position onto the camera’s image plane, and corresponds to the yellow circles in the images. If all the data were perfect (segmentation, vehicle position, marker location, camera extrinsic and intrinsic parameters) the yellow circle would be inside the white circle. Our data is not perfect, so the yellow circles do not fall exactly on the white circles. The marker ID of the closest yellow circle (that is less than 64 3 DISCRETE EXTENDED KALMAN FILTER 4 pixels away from the white circle) is associated with this image observation. (This step can be eliminated if we have barcodes or other means of performing this data association.) • If there is a successful match, the angles to this marker are computed and stored along with the time stamp in the “Marker angles” file, “marker001-003-angles.txt”. The data from “Marker angles” file is used as measurement input in the Extended Kalman Filter algorithm. 3 Discrete Extended Kalman Filter The discrete Extended Kalman Filter [2] was used to fuse the internal position estimation and external measurements to the markers. The following are the general discrete Extended Kalman Filter [6] equations particular realizations of which for our system are given in the Subsection 3.1. The general nonlinear system (Equation 1) and measurement (Equation 2) where xk and zk represent the state and measurement vectors at time instant k, f (·) and h(·) are the nonlinear system and measurement functions, uk is the input to the system, wk−1 , γ k−1 and vk−1 are the system, input and measurement noises: xk = f (xk−1 , uk ; wk−1 , γ k−1 ) zk = h(xk ; vk−1 ) (1) (2) removing the explicit noise descriptions from the above equations and representing them in terms of their probability distributions, the state and measurement estimates are obtained: x̂k = f (xk−1 , uk , 0, 0) ẑk = h(xk , 0) (3) (4) The system, input and measurement noises are assumed to be Gaussian with zero mean and are represented by their covariance matrices Q, Γ, and R: p(w) = N (0, Q) p(γ) = N (0, Γ) p(v) = N (0, R) (5) (6) (7) The Extended Kalman Filter predicts the future state of the system x̂− k based on the available system model f (·) and projects ahead the state error covariance matrix P− k using the time update equations: x̂− k = f (xk−1 , uk , 0, 0) P− k = Ak Pk−1 ATk + Bk Γk−1 BTk (8) + Qk−1 (9) 3 DISCRETE EXTENDED KALMAN FILTER 5 Once measurements zk become available the Kalman gain matrix Kk is computed and used to incorporate the measurement into the state estimate x̂k . The state error covariance for the updated state estimate Pk is also computed using the following measurement update equations: − T −1 T Kk = P− k Hk (Hk Pk Hk + Rk ) − x̂k = x̂− k + Kk (zk − h(x̂k , 0)) Pk = (I − Kk Hk )P− k (10) (11) (12) Where I is an identity matrix and system (A), input (B), and measurement (H) matrices are calculated as the following Jacobians of the system (f (·)) and measurement (h(·)) functions: (13) B[i,j] (14) H[i,j] 3.1 ∂f[i] − (x̂ , uk , 0, 0) ∂x[j] k ∂f[i] − = (x̂ , uk , 0, 0) ∂u[j] k ∂h[i] − = (x̂ , 0) ∂x[j] k A[i,j] = (15) Mower System Modeling The mower’s planar Cartesian coordinates (x, y) and heading (Φ) describe pose of the mower and are used as the state variables of the Kalman filter. The wheels encoder and the FOG measurements are treated as inputs to the system. The angles to the markers are treated as the measurements. The mower is modeled by the following kinematic equations representing the position of the mid-axis (x, y) and the orientation in the global frame (Φ) [9]. ∆Φk ) 2 ∆Φk fy = yk+1 = yk + ∆Dk · sin(Φk + ) 2 fΦ = Φk+1 = Φk + ∆Φk fx = xk+1 = xk + ∆Dk · cos(Φk + (16) (17) (18) Where ∆Dk is the distance travelled by the mid-axis point given the values that the right and the left wheels have travelled, ∆DkR and ∆DkL respectively: ∆Dk = ∆DkR + ∆DkL 2 (19) The incremental change in the orientation ∆Φk ,can be obtained from odometry given the effective width of the mower b: ∆Φk = ∆DkR − ∆DkL b (20) 3 DISCRETE EXTENDED KALMAN FILTER 6 Thus the system state vector may be written as xk = [xk yk Φk ]T , the input vector as uk = [∆DkL ∆DkR ]T and the system function f (x) = [fx fy fΦ ]T where the function components are represented by the Equations (16 to 18). The system (Ak ) and input (Bk ) Jacobians for our system are given below: ∂f ∂fx ∂fx x k ) 1 0 −∆Dk · sin(Φk + ∆Φ ∂xk ∂yk ∂Φk 2 ∂f ∂f ∂f k (21) Ak = ∂xyk ∂yyk ∂Φyk = 0 1 ∆Dk · cos(Φk + ∆Φ ) 2 ∂fΦ ∂fΦ ∂fΦ 0 0 1 x ∂x ∂y ∂Φ k k k k xk Bk = 1 ∂fx ∂∆DkL ∂fy ∂∆DkL ∂fΦ ∂∆DkL k k cos(Φk + ∆Φ ) + ∆D sin(Φk + 2 2 2b ∆Φ ∆D 1 = 2 sin(Φk + 2 k ) − 2b k cos(Φk + −1/b ∆Φk ) 2 ∆Φk ) 2 1 2 1 2 ∂fx ∂∆DkR ∂fy ∂∆DkR ∂fΦ ∂∆DkR xk (22) k k cos(Φk + ∆Φ ) − ∆D sin(Φk + 2 2b ∆Φk ∆Dk sin(Φk + 2 ) + 2b cos(Φk + 1/b B ( xB ,yB ) y ∆ DL ym yB − y arctan (____ xB− x ) d α M(x,y) ∆D xm Φ ∆ DR x Figure 3: The system schematic (the bird’s eye view.) The blocks represent the mower wheels and the concentric circles represent a marker. The azimuth αi with respect to the mower x-axis and elevation ηi with respect to the mower x−y plane (observed from the mid-axis point at the distance µ form the ground-plane) angles to the i-th marker obtained from the vision at a time instant k can be related to the current system state variables xk , yk , and Φk as follows: yBi − yk ) − Φk xBi − xk ηi = hηi (xk ) = − arctan(µ/di (xk )) p di (xk ) = (xBi − xk )2 + (yBi − yk )2 αi = hαi (xk ) = arctan( (23) (24) ∆Φk ) 2 ∆Φk ) 2 xk 3 DISCRETE EXTENDED KALMAN FILTER and the measurement matrix Hk is obtained: # " Hki = ∂hαi ∂xk ∂hαi ∂yk ∂hαi ∂Φk ∂hηi ∂xk ∂hαi ∂xk ∂hηi ∂xk ∂hαi ∂yk ∂hηi ∂yk ∂hαi ∂Φk ∂hηi ∂Φk 7 (25) xk yBi − yk (xBi − xk )2 + (yBi − yk )2 −xBi + xk = (xBi − xk )2 + (yBi − yk )2 = = −1 =p µ(xBi − xk ) (xBi − xk )2 + (yBi − yk )2 (µ2 + (xBi − xk )2 + (yBi − yk )2 ) µ(yBi − yk ) ∂hηi =p ∂yk (xBi − xk )2 + (yBi − yk )2 (µ2 + (xBi − xk )2 + (yBi − yk )2 ) ∂hηi =0 ∂Φk Now, once all the components of the extended Kalman filter are defined, the particular filter realization is described. 3.2 Filter Realization The discrete Extended Kalman Filter (EKF) presented here works off-line on the experimental data. The mower’s sensory information (apart from the marker measurements) is stored at about 100 Hz in the “marker-001poselog.txt” 1 file, the angles to the markers obtained from vision are stored at about 0.5Hz in the “marker-001-003-angles.txt” file, and the marker map is stored in the “marker-001-map.txt” file. The position and orientation output of the existing high-performance positioning is taken to be the ground truth. The EKF initial state x0 is taken to be equal to that of the ground truth. The initial state error covariance matrix is initialized to the value of the expected system error noise covariance: P− 0 = Q. The time update stage of the EKF estimates (Equations 8 and 9) the system state x̂k = [x̂k ŷk Φ̂k ]T using dead reckoning Equations 16, 17, and Equation 18 on page 5 that uses the fiber-optic gyroscope angular rate as 1 due to non-real-time operation of the on-board computer, the time stamp of the poselog.txt file is non-uniform and contains identical time stamps. On the other hand, replacing this time stamp by a uniform one results in almost 5 seconds time lag over about 9 minute (549 seconds) interval, which will introduce large error in the data association required to incorporate the angle to the markers measurements. Thus, assuming that at the high (100Hz) data rate the non-uniformness could be neglected in favor of more precise data association, the original time stamp is used. 3 DISCRETE EXTENDED KALMAN FILTER 8 input independent of odometry. The covariance matrix of the prior estimate is calculated by the formula: T 2 T P− k = Ak Pk−1 Ak + σγ Bk Bk + Q (26) where σγ2 is the the input noise variance (the encoders are assumed to have the same noise variance), and Q — the 3×3 covariance matrix of the system noise is taken to be time-invariant. The measurement update stage of the EKF operates only when the measurement is available. To associate the position information with the measurement, the first measurement with the image time stamp which is less or equal to the position time stamp is taken.2 The measurement matrix Hk (Equation 25) and the Kalman Kk gain are computed as follows: − T T −1 Kk = P− k Hk (Hk Pk Hk + R) (27) Where the measurement noise covariance matrix R is taken to be time-invariant (a simple assumption.) The measurement is incorporated by the estimate update in Equation 11 on page 5, and the state error covariance matrix for the updated estimate is calculated by a more computationally-stable version of Equation 12 on page 5 — the Joseph form [1]: T T Pk = (I − Kk Hk )P− k (I − Kk Hk ) + Kk RKk (28) The dead reckoning data of the “poselog.txt” file is given at much higher frequency (about 200 times more frequent), than the information in the angles.txt file, thus the time update and the measurement update parts of the EKF operate at different rates: the measurement can only be incorporated when it is available, that is approximately once every two seconds. When the measurement is not available the a priori state estimate and state error covariance matrix of the time update stage are used as virtual a posteriori state estimate and state error covariance matrix for the next iteration of the filter: x̂ = x̂− P̂ = P̂− Since the measurement errors to different markers are assumed to be uncorrelated, the measurements to markers visible at a given time instant may be computed consecutively, as opposed to simultaneously which allows to reduce the computational complexity and to facilitate tracking of the intermediate results. For sequential processing of the measurements available at a given time the measurement update equations are used iteratively replacing the a priori 2 This is in accordance with the data association convention used in image processing — the first position timestamp which is greater or equal to the image time stamp is taken there. 4 LOCALIZATION SIMULATIONS 9 values of the state estimate and its error covariance matrix by the updated values after each iteration: x̂− = x̂ P̂− = P̂ 4 Localization Simulations The filter was used to estimate the mower state x̂ (position and orientation in planar motion) by fusing the odometry, gyroscope, and the angle information from the absolute marker detection. The algorithm was run on the experimental as well as on the simulated ideal data that would have been obtained if the measurements had been perfect. The system noises are assumed to be uncorrelated and time-invariant, therefore the system noise covariance matrix is chosen to be diagonal and timeinvariant. The system position noise standard deviation for the x and y coordinates was taken to be σx = σy = 0.01 m (variances σx2 = σy2 = 10−4 m2 ), and the orientation noise standard deviation σΦ = 0.5o (variance σΦ2 = 7.62·10−5 rad2 ), therefore the system noise covariance matrix: −4 10 0 0 10−4 0 Q= 0 (29) −5 0 0 7.62 · 10 The experimental marker azimuth (α) and elevation (η) measurements were compared to the simulated set of measurements that would have been obtained at the time instants of the real measurements if the sensors used had been perfect. The variances of the differences between the experimental and simulated marker angle measurements were taken as characteristics of the measurement data quality: σα2 = (0.048 rad)2 = 2.30 · 10−3 rad2 for the azimuth (α) angle measurement and ση2 = (0.006 rad)2 = 3.60 · 10−5 rad2 for the elevation (η) angle measurement; thus the measurement noise covariance matrix: 2.30 · 10−3 0 R= (30) 0 3.60 · 10−5 For the localization using the ideal angle measurements (flat ground was assumed) the confidence in the measurements was expressed by small values of the noise covariance entries: 1 · 10−12 0 R= (31) 0 1 · 10−12 The reference (ground truth) and the estimated position are shown in Figure 4 on page 10. The trace3 of the state error covariance matrix P decreases as 5 CONCLUSION (a) Real angle to marker measurements used 10 (b) Ideal angle to marker measurements used Figure 4: Ideal and estimated paths. The markers are represented by the stars; the ground truth (reference) path is darker, the estimated path is lighter. the filter converges. The trace decreases with each measurement reading as shown in Figure 5 on page 11. The position and orientation differences between the estimated and reference states are presented in Figure 6 on page 11. The error statistics are gathered in Table 1 on page 11. The ideal marker measurements do not make the position estimation perfect, although they reduce the mean position error and standard deviation of position and heading by half. This can be explained by the inherently inexact time data association (the “ideal” measurements are taken at the time instances of the real measurements that do not exactly correspond to the time stamp of the rest of the data) and the system model state error accumulation between the estimates. The largest position and orientation error (in the 285 − 295 second interval) corresponds to the trajectory interval with no marker or single marker visibility (see Figure 7, page 12). It is seen that the measurement accuracy and proper time association of the measurement is critical in the curved sections. 5 Conclusion The developed Extended Kalman Filter for fusion of the odometry, fiber-optic gyroscope, and the angular measurements to the markers (obtained from the video frames taken during motion) showed an average 0.352 m Cartesian error with standard deviation 0.296 m and a heading mean error of 0.244o and a standard deviation 3.488o . The error measurements were taken with respect 3 The sum of the elements in the main diagonal; here these elements correspond to the covariances of the estimated states and thus the sum is indicative of the uncertainty of the state. 5 CONCLUSION 11 (a) Real angle to marker measurements used (b) Ideal angle to marker measurements used Figure 5: The number of visible markers and the trace of the state error covariance matrix. The filter converges once the marker measurements are taken. Long interruptions in marker data flow result in filter divergence. (a) Real angle to marker measurements used (b) Ideal angle to marker measurements used Figure 6: The position and heading errors. Mean Standard deviation Variance (unit2 ) Position and Heading Error Statistics Real marker measurements Ideal marker measurements Position Err. Heading Err. Position Err. Heading Err. meters degrees meters degrees 0.352 0.244 0.123 -0.233 0.296 3.488 0.171 1.301 0.088 2.168 0.029 1.695 Table 1: Position and Heading Error statistics. 5 CONCLUSION 12 Figure 7: The close-up to the spiral region of the trajectory. Position estimation is done using the “ideal” marker measurements. The numbers along the trajectory correspond to the time from the beginning of the experiment. Note that the large jump at 285-300 seconds corresponds to single or no marker visibility. 6 ACKNOWLEDGEMENTS 13 to the ground truth trajectory. The filter performance can be improved by: • On line adjustment of the system (Qk ) and measurement (Rk ) covariance matrices based on the statistical properties of the incoming data. • Extending the state of the filter to include the translational and rotational velocities. • Improved real time data correlation. • Increased external measurement data frequency. • Improved external data precision. 6 Acknowledgements The authors would like to thank the CMU team (Sanjiv Singh, Jeff Mishler, Parag Batavia, and Stephan Roth) for taking the data, processing, and providing us with the data that went into this report. We also thank Dana Lonn for sponsoring this work and making the trip to Palm Aire possible. References [1] Introduction to random signals and applied Kalman filtering: with MATLAB exercises and solutions, chapter 6.6, page 261. John Wiley Sons, Inc., third edition, 1997. [2] Ph. Bonnifait and G. Garcia. ”A Multicensor Localization Algorithm for Mobile Robots and its Real-Time Experimental Validation”. In Proc. of the IEEE International Conference on Robotics and Automation, pages 1395–1400, Minneapolis, Minnesota, April 1996. IEEE. [3] Dynaher Corporation, http://dynapar-encoders.com. Dynapar encoder series H20 data sheet. [4] KVH, http://www.kvh.com/Products/Product.asp?id=39. KVH2060 data sheet, 2000. [5] NovAtel Inc., http://www.novatel.com/Documents/Papers/Rt-2.pdf. NovAtel ProPack data sheet, 2000. [6] P. Y. C. Hwang R. G. Brown. Introduction to random signals and applied Kalman filtering: with MATLAB exercises and solutions. John Wiley Sons, Inc., third edition, 1997. [7] Stephan Roth, Parag Batavia, and Sanjiv Singh. Palm Aire Data Analysis. report, February 2002. A MATLAB CODE LISTING 14 [8] Sony, http://www.sony.co.jp/en/Products/ISP/pdf/catalog/DFWV500E.pdf. Sony DFW-VL500 Digital Camera Module data sheet. [9] C. Ming Wang. “localization estimation and uncertainty analysis for mobile robots”. In IEEE Int. Conf. on Robotics and Automation, Philadelphia, April 1988. A MATLAB Code Listing % this is an extended Kalman filter driver script % with sequential measurements incorporation. switch 1 case 1 clear all % Load the input files: %======================================================================== positionLog_o =load(’marker-001-poselog.txt’); % [timeStamp, MarkerID, azimuth, inclination, vehSpeed, headingRate; ...] finalMarkerLog =load(’marker-001-003-angles.txt’); %finalMarkerLog =load(’FinalMarkerLog’); %MarkerMap file: [markerID, markerX, markerY; ...] markerMap =load(’marker-001-map.txt’); %======================================================================== case 2 clear state end %switch bgn=10464; % first element of the positionLog to be considered; endd=bgn+10000; positionLog=positionLog_o(bgn:end,:); % get phi within +/- 2pi range (wrap) positionLog(:,21)=mod(positionLog(:,21),sign(positionLog(:,21))*2*pi); %hight of the reference point of the mower. h=0.226; % clock (generate times at 0.01 sec for the length of the experiment) %======================================================================== switch 2 % 1) 0.01 sec time stamp. 2) original time stamp. 3) equalized time step. case 1 dT=0.01; time=0:dT:dT*(size(positionLog,1)-1); timePosLog=time’+positionLog(1,3); case 2 A MATLAB CODE LISTING 15 dT=0.01; timePosLog=positionLog(:,3); case 3 dT=(positionLog(end,3)-positionLog(1,3))/size(positionLog,1); timePosLog=0:dT:dT*(size(positionLog,1)-1); timePosLog=timePosLog+positionLog(1,3); end %switch timeMarker=finalMarkerLog(:,1); %======================================================================== b=1.41; %b=1.65-0.24; % mower effective width (Hal) % Initialize the Kalman filter: %======================================================================== %enter loop with prior state estimate and its error covariance %x(0)projected or prior; supplied form the driver script. %P(0)its error covariance; supplied form the driver script. % Initial state guess:[xM; yM; Phi]; initHead=mean(positionLog(1+1:100,21)); initHead=mod(initHead,sign(initHead)*2*pi); % get phi within +/- 2pi range (wrap) x=[positionLog(1,19); positionLog(1,20); initHead]; PhiOdom=initHead; dPhiOdom=0; % System noise covariance: Q11=1e-4*1.00; Q22=1e-4*1.00; Q33=7.62e-5*1.00; Q=diag([Q11,Q22,Q33]); % Error covariance matrix: P_initial=Q; %P_initial=diag([1e-4,1e-4,1e-4]); traceP_initial=trace(P_initial); traceResetValue=traceP_initial*0.5; P=P_initial; % Build the measurement error covariance martix: azimuthCov=0.048^2; inclinCov=0.006^2; singleSensorCov=[azimuthCov inclinCov]; R=[]; R=diag(singleSensorCov); A MATLAB CODE LISTING 16 varIn=1e-4; % input noise covariance %======================================================================== numOfVisibleMarkers=zeros(size(positionLog,1),1); msrmtCnt=0; for i=1:size(positionLog,1) %main % store state state(:,1,i)=x; %======================================================================== % input: dDl=positionLog(i,4); % [m] dDr=positionLog(i,5); % [m] dPhiFOG=positionLog(i,9); % [rad/sec] %======================================================================== %=========================================================================== %the Kalman filter % The state vector: xM=x(1); yM=x(2); Phi=x(3); dD=(dDl+dDr)/2; %=========================================================================== % TIME UPDATE EQUATIONS (predict) % EKF time update equations: %x(k+1)project ahead=f(x(k)estim updated w meas); %P(k+1)project ahead=A(k)*P(k)*A(k)’+Q(k); argmnt=Phi+dPhiFOG/2*dT; x(1)=xM+dD*cos(argmnt); x(2)=yM+dD*sin(argmnt); x(3)=Phi+dPhiFOG*dT; x(3)=mod(x(3),sign(x(3))*2*pi); % get phi within +/- 2pi range (wrap) % Build the system matrix A: A=eye(3,3); %A=zeros(3,3); A(1,3)=-dD*sin(argmnt); A(2,3)=dD*cos(argmnt); % Build the input matrix B: cPhi=0.5*cos(argmnt); dDs=dD/2/b*sin(argmnt); sPhi=0.5*sin(argmnt); dDc=dD/2/b*cos(argmnt); B(1,1)=cPhi+dDs; B(1,2)=cPhi-dDs; B(2,1)=sPhi-dDc; B(2,2)=sPhi+dDc; B(3,1)=-1/b; B(3,2)=1/b; P=A*P*A’+varIn*B*eye(2,2)*B’+Q; A MATLAB CODE LISTING 17 %P=A*P+P*A’+Q; %=========================================================================== %=========================================================================== % Now, if a measurement is available - incorporate it: if ~isempty(finalMarkerLog) % check if markers exist % find the measurements corresponding to the current time instance: % according to CMU association: t_posLog>=t_marker measurementEntries=find(timeMarker>=timePosLog(i)-0.01 & timeMarker<=timePosLog(i)); % Search the final marker log for the time stamps equal to the curent time %and retrieve the corresponding data entry numbers: if ~isempty(measurementEntries) % if there exist contemporary measurements: numberOfMeas=length(measurementEntries); numOfVisibleMarkers(i)=numberOfMeas; markerID=finalMarkerLog(measurementEntries,2)+1; for n=1:numberOfMeas %loop for multiple measurements: % Build the measurement martix: xB=markerMap(markerID(n),2); yB=markerMap(markerID(n),3); H=[]; distSq=(xB-xM)^2+(yB-yM)^2; SqrtDistSq=sqrt(distSq); H(1,1)=-(-yB+yM)/( distSq ); H(1,2)=-( xB-xM)/( distSq ); H(1,3)=-1; H(2,1)=-h*(xB-xM)/(SqrtDistSq*(h^2+distSq)); H(2,2)=-h*(yB-yM)/(SqrtDistSq*(h^2+distSq)); H(2,3)=0; % measurement function: hx=[]; hx(1,1)=atan2(yB-yM,xB-xM)-Phi; %azimuth; non-linear version hx(2,1)=-atan(h/SqrtDistSq); %inclination; non-linear version % measurement: z=[finalMarkerLog(measurementEntries(n),3); finalMarkerLog(measurementEntries(n),4)]; % Compute Kalman Gain: %K(k)=P(k)projected*H(k)’*inv(H(k)*P(k)projected*H(k)’+R(k)); %R - variance of the measurement noise K=P*H’*inv(H*P*H’+R); condK=cond(K); if condK>100, disp([’condition number for K is > 100; it is ’ num2str(condK) ’ at step ’ num2str(i)]); A MATLAB CODE LISTING 18 end % Update estimate with measurement y(k): %x(k)=x(k)projected + K(k)*(y-H(k)*x(k)projected);%x=x+K*(z-hx); % extended KF estAzimuth=hx(1); %bring to +/- 180 if abs(estAzimuth)>pi, estAzimuth=-sign(estAzimuth)*2*pi+estAzimuth; end; hx(1)=estAzimuth; %substitute the corrected alpha (azimuth) values. innov=z-hx; %bring alpha to +/- 180 if abs(innov(1))>pi, innov(1)=-sign(innov(1))*2*pi+innov(1); end; corr=K*innov; x=x+corr; % Compute error covariance for updated estimate: %P(k)=(I-K(k)*H(k))P(k)projected; %P=(eye(size(K,1))-K*H)*P; %"Joseph form" - better numerical behavior (Brown p.261) P=(eye(size(K,1))-K*H)*P*(eye(size(K,1))-K*H)’+K*R*K’; end % loop for multiple measurements (sequential meas. incorporation) end % if there exist contemporary measurements; end % if markers exist %=========================================================================== % end of the Kalman filter %check for filter divergence (+ve definiteness of the state error covariance matrix): if eig(P)<0, disp([’covariance matrix P is not positive-definite in step ’ num2str(i)]); end traceP(i)=trace(P); %(becomes smaller as filter converges, see Greg’s p.25) xVar(i)=P(1,1); yVar(i)=P(2,2); PhiVar(i)=P(3,3); end %main state = squeeze(state);