1
LabSpec 5 user manual
Left click and drag with the Move/Delete Points
cursor to move the existing multipoint position to a
new position.
To clear all existing points and set point 1 at the
center of the video image do one of the following:
o
Click on the “Center Cursors” icon in the
Icon bar– see 4.4.3, page 92.
o
Right click and select “Center cursor”.
Note that the automated multipoint acquisition is
started by using the Mapping Acquisition icon –
see section 4.5.4, page 96. The data is acquired
as a multidimensional spectral array, with the
standard SpIm, Point and Map windows.
Available for:
Video
Page | 186
LabSpec 5 user manual
5.18.
Hor Line Mapping
Activates the Horizontal Line Mapping cursor, allowing a horizontal line for line mapping to be defined
on the active video image.
When this icon is active, and the mouse is hovered
over the line, the cursor changes to the Shift Hor
Line cursor.
Left click and drag with the Shift Hor Line cursor to
move the line to the desired position on the video
image.
When this icon is active, and the mouse is hovered
over the line drag points (at each end of the line),
the cursor changes to the Adjust Hor Line cursor.
Left click and drag with the Adjust Hor Line cursor
to make the line longer or shorter.
To clear the existing line, and create a new default
line at the center of the video image do one of the
following:
o
Click on the “Center Cursors” icon in the
Icon bar– see 4.4.3, page 92.
o
Right click and select “Center cursor”.
The Shift Hor Line and Adjust Hor Line cursors should be used in conjunction with the Mapping
Properties dialog window - see section 4.5.5, page 97.
Available for:
5.19.
Video
Rectangular Mapping
Activates the Rectangular Mapping cursor, allowing a rectangular area for mapping to be defined on
the active video image.
When this icon is active, and the mouse is hovered
over the existing rectangle, the cursor changes to
the Shift Rectangle cursor.
Page | 187
LabSpec 5 user manual
Left click and drag with the Shift Rectangle cursor
to move the line to the desired position on the
video image.
When this icon is active, and the mouse is hovered
over the rectangle drag points, the cursor changes
to the Adjust Rectangle cursor.
Left click and drag with the Adjust Rectangle
cursor to adjust the rectangle size.
To clear the existing rectangle and create a new
default rectangle at the center of the video image
do one of the following:
o
Click on the “Center Cursors” icon in the
Icon bar– see 4.4.3, page 92.
o
Right click and select “Center cursor”.
The Shift Rectangle and Adjust Rectangle cursors should be used in conjunction with the Mapping
Properties dialog window - see section 4.5.5, page 97.
Available for:
5.20.
Video
Line Mapping
Activates the Line Mapping cursor, allowing a line for line mapping to be defined on the active video
image.
When this icon is active, and the mouse is hovered
over the line, the cursor changes to the Shift Line
cursor.
Left click and drag with the Shift Line cursor to
move the line to the desired position on the video
image.
When this icon is active, and the mouse is hovered
over the line drag points (at each end of the line),
the cursor changes to the Adjust Line cursor.
Left click and drag with the Adjust Line cursor to
make the line longer or shorter, or to rotate the line
about the opposite drag point.
To clear the existing line and create a new default
line at the center of the video image do one of the
following:
Page | 188
LabSpec 5 user manual
o
Click on the “Center Cursors” icon in the
Icon bar– see 4.4.3, page 92.
o
Right click and select “Center cursor”.
The Shift Line and Adjust Line cursors should be used in conjunction with the Mapping Properties
dialog window - see section 4.5.5, page 97.
Available for:
5.21.
Video
Circle Mapping
Activates the Circle Mapping cursor, allowing a circle for mapping to be defined on the active video
image.
When this icon is active, and the mouse is hovered
over the line, the cursor changes to the Shift Circle
cursor.
Left click and drag with the Shift Circle cursor to
move the line to the desired position on the video
image.
When this icon is active, and the mouse is hovered
over the circle area drag points (at each edge of
the circle area), the cursor changes to the Adjust
Circle cursor.
Left click and drag with the Adjust Circle cursor to
adjust the circle size.
To clear the existing circle and create a new
default circle at the center of the video image do
one of the following:
o
Click on the “Center Cursors” icon in the
Icon bar– see 4.4.3, page 92.
o
Right click and select “Center cursor”.
The Shift Circle and Adjust Circle cursors should be used in conjunction with the Mapping Properties
dialog window - see section 4.5.5, page 97.
Available for:
Video
Page | 189
LabSpec 5 user manual
5.22.
Ver Line Mapping
Activates the Vertical Line Mapping cursor, allowing a vertical line for line mapping to be defined on
the active video image.
When this icon is active, and the mouse is hovered
over the line, the cursor changes to the Shift Ver
Line cursor.
Left click and drag with the Shift Ver Line cursor to
move the line to the desired position on the video
image.
When this icon is active, and the mouse is hovered
over the line drag points (at each end of the line),
the cursor changes to the Adjust Ver Line cursor.
Left click and drag with the Adjust Ver Line cursor
to make the line longer or shorter.
To clear the existing line, and create a new default
line at the center of the video image do one of the
following:
o
Click on the “Center Cursors” icon in the
Icon bar– see 4.4.3, page 92.
o
Right click and select “Center cursor”.
The Shift Ver Line and Adjust Ver Line cursors should be used in conjunction with the Mapping
Properties dialog window - see section 4.5.5, page 97.
Available for:
5.23.
Video
Polygon Mapping
Activates the Polygon Mapping cursor, allowing a polygon
polygon for mapping to be defined on the active
video image.
When this icon is active, and the mouse is hovered
over the video image the cursor will change to the
Add Polygon Points cursor.
Page | 190
LabSpec 5 user manual
Left click with the Add Polygon Points cursor to
add a polygon definition point to the video image.
When the Add Polygon Points cursor is active, and
the mouse is hovered over an existing polygon
definition point, the cursor changes to the
Move/Delete Polygon Points cursor.
Page | 191
LabSpec 5 user manual
Left click with the Move/Delete Polgyon Points
cursor to delete the existing polygon definition
point.
Left click and drag with the Move/Delete Polygon
Points cursor to move the existing polygon
definition point to a new position.
Page | 192
LabSpec 5 user manual
To clear all existing polygon definition points, and
set a single point at the center of the video image
do one of the following:
o
Click on the “Center Cursors” icon in the
Icon bar– see 4.4.3, page 92.
o
Right click and select “Center cursor”.
Note that the polygon shape is created by locating
nearest neighbours to each polygon definition
point.
Slight adjustment of polygon definition
points may be required to obtain the desired
polygon mapping shape.
The Add Polygon Points and Move/Delete Polygon Points cursors should be used in conjunction with
the Mapping Properties dialog window - see section 4.5.5, page 97.
Available for:
5.24.
Video
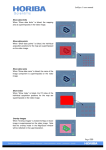
Axes3D
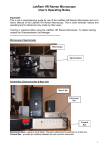
Activates axis drag points on a 3D image, allowing its position, shape and perspective to be modified.
When this icon is active, four drag points are
activated on the 3D image.
1
2
3
4
Left click and drag the drag points to adjust the
position, shape and perspective of the image:
Drag Point 1
Dragging up/down adjusts the size of the vertical
(intensity) axis.
Dragging left/right skews the image about its
center point, keeping the left hand side and right
hand side vertical axes static.
Page | 193
LabSpec 5 user manual
Drag Point 2
Dragging up/down/left/right adjusts the image
position within the display window.
Drag Point 3
Dragging up/down/left/right skews the image,
keeping the back and right hand side vertical axes
static.
Drag Point 4
Dragging up/down/left/right skews the image,
keeping the back and left hand side vertical axes
static.
To restore the 3D image to its default display, right click and select Axes, and then click on [Recenter image] – see section 8.8.2, page 215.
Available for:
Video, SpIm, Map, Score (when displayed in 3D mode)
Page | 194
LabSpec 5 user manual
6.
Data Bar
The Data bar located on the right hand side of the LabSpec 5 graphical user interface (GUI) allows
individual data objects (e.g., spectra, images, multidimensional spectral arrays) to be selected from a
group of open objects. In addition, the Data bar allows control of quick window formatting tools.
This is an active toolbar, and the number of data object selector radio tags (see section 6.3, page
198) will automatically update according to number of open objects in the currently selected window.
Quick Select: Single or Multiple data view
Quick graph settings
Selector radio tags for each open data object
6.1.
Quick Select: Single or Multiple Data View
The Single and Multiple Data Graph icons allow fast selection of overlay mode for the active window.
Note that when clicked an icon will be locked
down. Only one icon can be active and locked
down at a time.
The overlay mode can also be set using the
Format and Scale dialog window – see section 8.1,
page 204.
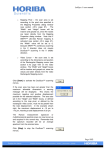
6.1.1.
Single Data Graph
When the Single Data Graph icon is active and locked, only the active data object will be displayed in
the window. For example, if there are three spectra open, only the active spectrum will be displayed.
Selecting a different spectrum using the Data bar (see section 6.3, page 198) will cause the selected
spectrum to be displayed.
Page | 195
LabSpec 5 user manual
In the example shown right, there are three open
spectra, but only the active spectrum (——) is
displayed.
500
6.1.2.
1 000
Raman Shift (cm-1 )
1 500
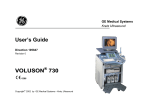
Multiple Data Graph
When the Multiple Data Graph icon is active and locked, all open data objects will be displayed in the
window. For example, if there are three spectra open, all three will be displayed in an overlay mode
in the window.
In the example shown right, there are three open
spectra, all of which are displayed.
500
1 000
Raman Shift (cm-1 )
1 500
Note that the overlay mode (“Overlay”, “Tile”,
“Stack”, “Projection” or “Trace”) used with the
Multiple Data Graph icon will be the mode set in
the Format and Scale dialog window (see section
8.1, page 204). To adjust the overlay mode right
click and select “Format and Scale”, and select the
desired mode from the “Mode” drop down box.
Page | 196
LabSpec 5 user manual
6.2.
Fast Graph Settings
When the Fast Graph Settings icon is active and locked, the formatting of axis units and scaling can
be quickly modified.
When Fast Graph Settings is active, the titles/units
and maximum/minimum values on all visible axes
are underlined.
Left click on an underlined item to modify its
formatting, by selecting a format from the drop
down list.
When Fast Graph Settings is inactive, the
titles/units and minimum/maximum values on all
visible axes are not underlined, and their formatting
cannot be modified using a left click.
Complete formatting is possible using the Format
and Scale dialog window – see section 8.1, page
204 for full information.
Note that the current status of the Fast Graph
Settings (i.e., active or inactive) is also displayed in
the right click menu, under “Fast Settings”. When
the Fast Graph Settings is active, “Fast Settings”
will be ticked.
Page | 197
LabSpec 5 user manual
6.3.
Selector Radio Tags for Open Data Objects
When multiple data objects (e.g., spectra, images, multidimensional spectral arrays) of a similar type
are open within a single display window, the Data bar will display a selector radio tag for each object.
Each radio tag will be displayed in the same colour
as the data object.
o
An active object has a color-filled radio
tag, as shown right.
o
An inactive object has a hollow radio tag,
as shown right.
Hover the mouse cursor over a radio tag to see the
data object name.
<CTRL>+Click on a radio tag to hide/show an
individual object. If an object is hidden the radio
tag will display a red cross.
o
o
In the example shown right there are
three open spectra, all of which are
displayed.
500
1 000
Raman Shift (cm-1 )
1 500
500
1 000
Raman Shift (cm-1 )
1 500
In the example shown right there are
three open spectra, but one (——) has
been hidden using <CTRL>+Click and is
not displayed.
The spectrum can be shown again by
<CTRL>+Clicking on its radio tag.
Page | 198
LabSpec 5 user manual
7.
Status Bar
The Status bar displays information about system status (e.g., progress of an acquisition), active
options (e.g., intensity correction, or extended range settings), and
and cursor values.
system
messages
7.1.
active
options
detector
progress bar
cursor values
System Messages
System messages show information relevant to the current operation. Typical examples include the
estimated time remaining until completion of a measurement, current status/operation of the
autocalibration routine, or current status/operation of the spectrometer.
7.2.
Active Options
The Active Options icons indicate whether certain data acquisition options are active – typically these
are options which have a significant effect on the measurement.
Photo-bleaching On
When Photo-bleaching is active (i.e., the photobleaching time is >0s) the Photo-bleaching On icon
is displayed.
For more information about Photo-bleaching and
how to turn it on and off, please see section
3.5.4.4, page 35).
Autofocus On
When Autofocus is active the Autofocus On icon is
displayed.
For more information about Autofocus and how to
turn it on and off, please see section 3.5.4.8, page
39).
Intensity Correction On
When Intensity Correction is active the Intensity
Correction On icon is displayed.
For more information about Intensity Correction
and how to turn it on and off, please see section
3.5.4.14, page 43.
Page | 199
LabSpec 5 user manual
Extended Range On
When an Extended Range measurement is active
(i.e., the extended range function is set to either
Multiwindow or Autoscanning) the Extended
Range On icon is displayed.
For more information about Extended Range
acquisition and how to turn it on and off, please
see section 3.5.6, page 49.
7.3.
Detector
o
The Detector display shows the detector temperature (in degrees celsius, C), and (on systems
equipped with multiple detectors) can be used to switch from one detector to another.
7.3.1.
Detector Temperature
The detector icon is colored according to the
temperature status of the active detector, relative
to the temperature set in the “Detector” dialog
window (see section 3.5.7, page 57).
o
Actual temperature is between set
o
temperature and 5 C above the set
temperature; detector can be used.
o
Actual temperature is between 5 C and
o
10 C above the set temperature.
o
Detector can be used, but data acquired
in this state may exhibit slightly reduced
quality (signal to noise).
o
o
Actual temperature is greater than 10 C
above the set temperature; it is
recommended that the detector is not
used.
Note that use of a detector at high
temperature will not damage it, but data
acquired in this state will exhibit
significantly reduced quality (signal to
noise).
Page | 200
LabSpec 5 user manual
7.3.2.
Switching Detector
On systems equipped with multiple detectors, click
on the detector icon to view a list of available
detectors.
The currently active detector is
indicated with a tick.
To switch detector, select the desired detector from
the list of available detectors. Note that a detector
initialization message may be displayed when the
detector is switched.
7.4.
-70
-70
Progress Bar
The Progress Bar indicates whether a hardware/software process is active, and displays the
approximate progress of an active process. It is also possible to temporarily pause a process using
the Progress Bar “Pause” icon.
When a process is active, the Progress Bar
displays a moving circle icon, and blue bars which
indicate the current progress.
0%
complete
100%
complete
Current
completion state
Left click on the “Pause” icon to pause the current
process.
The process will continue until the
current section of the process is completed, and it
will then pause. The “Pause” icon will change into
the “Start” icon.
Left click on the “Start” icon to re-start a paused
process. The “Start” icon will change into the
“Pause” icon.
When no process is active, the Progress Bar is
empty.
7.5.
Cursor Values
The Cursor Value display shows a range of information depending on the type of cursor which is
active – e.g., the X and Y axis positions of the cursors, the spectrum/profile/image intensity at the
cursor position, width between two cursors, and approximate peak width.
The following symbols are used to identify information displayed in the Cursor Value display.
Page | 201
LabSpec 5 user manual
o
o
o
o
o
S – spectral (X axis) position in a spectrum. The units will be those selected in Options >
-1
Unit (see section 3.4.1, page 22), typically Raman shift (cm ) or wavelength (nm).
I – intensity. The units for spectra and cursor generated profiles/maps will be those selected
in Options > Unit (see section 3.4.1, page 22), typically counts (cnt) or counts per second
(cnt/s). The units for video images will be arbitrary units (a.u.).
X, Y, Z – spatial position in a profile or image. The units will be micrometers (µm).
P – spectral (X axis) width between a paired set of map analysis cursors. The units will be
-1
those selected in Options > Unit (see section 3.4.1, page 22), typically Raman shift (cm ) or
wavelength (nm).
W – approximate peak width as indicated by the Peak cursor. The units will be those
-1
selected in Options > Unit (see section 3.4.1, page 22), typically Raman shift (cm ) or
wavelength (nm).
Page | 202
LabSpec 5 user manual
8.
Right Click Menus
Right mouse clicking on the data windows will display a menu, which typically will allow access to
additional dialog windows, provides shortcuts to other functions within LabSpec 5, or provides
information about the current configuration.
The right click menu is active, and its appearance and content will update according to the currently
selected window. For example, the options appearing for a Spectrum window will differ from those
appearing for a video image.
At the end of each function’s description, a list of windows where the function is available in the right
click menu is given. The possible windows are as follows:
Spectrum
The spectrum display window for individual spectra acquired using the real time display (RTD)
acquisition (
/
) and spectrum acquisition (
/
) modes.
Video
The video display window for optical images acquired with the integrated microscope camera(s).
SpIm
The overlay of all spectra within a multidimensional spectral array.
Point
The spectrum at the current cursor position within a multidimensional spectral array.
Map
The cursor intensity profile/image display created from a multidimensional spectral array.
Score
The score profile/image created by DCLS modelling of a multidimensional spectral array
Model
The reference component spectra used for DCLS modelling of a multidimensional spectral array.
To display the right click menu, right click
anywhere within the active window. Left click on a
menu item to open a new dialog window, or run the
function.
Note that setting a function in a right click menu dialog window will only set that function for the active
window. It is possible to have different settings for different windows. For example, a Spectrum and
Point window can have different format and scale settings, by applying different settings through the
Format and Scale dialog window for each window.
Page | 203
LabSpec 5 user manual
8.1.
Format and Scale
The Format and Scale dialog window allows control over the window display format, and the data
scaling within the window.
Note that depending on the data window selected, the Format and Scale dialog window may slightly
differ from that shown below.
Available for:
8.1.1.
Spectrum, Video, SpIm, Point, Map, Score, Model
Style
The Style section of the Format and Scale dialog window allows control over the appearance of the
data window, and how data is displayed within it.
Internal
Select the internal area color and fill option from
the “Internal” color drop down box.
Note that when a data window is copied as an
image, it will be copied with the default internal
white background.
INTERNAL AREA
The internal area is shaded in the image shown
right.
External
Select the external area color and fill option from
the “External” color drop down box.
Note that when a data window is copied as an
image, it will be copied with the default external
white background.
The external area is shaded in the image shown
right.
EXTERNAL AREA
Page | 204
LabSpec 5 user manual
Mode
Select the overlay mode for data objects (e.g.,
spectra, images, multidimensional spectral arrays)
from the “Mode” drop down box.
A number of overlay modes are available:
o
Single – display only the currently active
data object in the window.
o
Overlay – display all open data objects in
the window.
o
Tile – display all open data objects in
separate tiled sections within the window.
o
Stack – display all open data objects in
the window, offsetting each by a certain
amount.
Page | 205
LabSpec 5 user manual
o
Projection – displays a series of images
corresponding to the open data object in
separate tiled sections within the window.
This mode is only available for
multidimensional spectral arrays, and is
intended for display of 3D data sets (e.g.,
XYZ datacubes).
o
Trace - displays a single image from a
multi-image single data object within the
window. The scroll bar on the right hand
side can be used to scroll through each
image corresponding to the data object;
the axis value for the image is displayed
in the top right hand corner of the
window.
This mode is only available for
multidimensional spectral arrays, and is
intended for display of 3D data sets (e.g.,
XYZ datacubes).
Dimension
Select the display dimension from the “Dimension”
drop down box. The number of dimensions used
for data display refers to the number of nonintensity axes. For example, a simple spectrum is
considered a 1D display, because it constitutes the
intensity dimension plus one other dimension (the
spectral axis, typically Raman shift or wavelength).
A video image is considered a 2D display, because
it constitutes the intensity dimension plus two
spatial axes (X and Y).
Three display dimensions are available:
o
1D – simple ‘graph’ presentation,
typically used for spectra (including
Spectrum, SpIm, Point and Model
windows).
Page | 206
LabSpec 5 user manual
o
2D – simple image presentation, typically
used for images (including video, map
and score windows). Multiple images
can be overlaid in this mode.
o
3D – for pseudo 3D representation of 2D
data, where all three axes (intensity plus
two spatial) are visible. Only a single
image component can be displayed in
this mode.
Note that 3D images are configured
using the right click menus Axes (see
section 8.8.2, page 215) and 3Dimage
(see section 8.18, page 224).
Use Scroll Bars
When “Use scroll bars” is ticked, scroll bars will be displayed if part of the data is off scale (e.g., not
actually displayed in the data window).
Always Show Scroll Bars
When “Always show scroll bars” is ticked, the scroll bar display section of the data window will always
be present, even if all data is displayed within the window. The scroll bar(s) will only become active if
part of the data is off scale (e.g., not actually displayed in the data window).
One Data per View
When “One data per view” is ticked, each data object associated with the data window will always
open into a new data window. In this case, it is not possible to overlay objects in a single window.
Preserve Scale Ratio
When “Preserve scale ratio” is ticked, the aspect ratio will be retained. Typically this function is used
for image display only.
Use Data Only with Same X Axis
When “Use data only with same X axis” is ticked, only data objects which share the same X axis units
will be opened within the window. Objects with other X axis units will be opened into a new data
-1
window. For example, if a spectrum with Raman shift (cm ) units is already open in a data window,
when a spectrum with wavelength (nm) units is opened, a new data window will be created for it.
Page | 207
LabSpec 5 user manual
8.1.2.
Scale
The Scale section of the Format and Scale dialog window allows control over the scaling of data
within the data window.
Each available axis for the active data object is displayed in the “Scale” section, with a number of
options for its scaling. Typical axes displayed here are:
o
o
o
Hor – the X axis, typically the spectral axis for spectra, or the X (µm) axis for images.
Ver – the Y axis, typically the intensity axis for spectra, or the Y (µm) axis for images.
Intens – the intensity axis for images.
From and To
Displays the start (“From”) and stop (“To”) axis values which will be displayed.
manually adjusted by typing in desired values and clicking [OK].
These can be
Freeze
When “Freeze” is ticked the axis scaling is fixed, and will not be affected by scale normalization (see
section 4.4.1, page 91), its right click shortcut “Rescale” or its keyboard shortcut <CTRL>+N.
The axis scaling can also be fixed using the Fast Graph Settings and selecting “Fixed” for the axis
(see section 6.2, page 197).
Auto
When “Auto” is ticked the axis will autoscale to display all data open in the data window.
The axis scaling can also be set to autoscaling by using the Fast Graph Settings and selecting “Auto”
for the axis (see section 6.2, page 197).
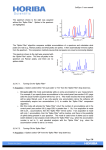
Rel
When “Rel” is ticked all data open in the data window will be displayed with identical minimum and
maximum intensities. The scale values displayed for the axis will correspond to the active data
object.
The data shown right are displayed with normal
scaling.
100
Intensity (cnt)
80
60
40
20
0
The data shown right are displayed with relative
scaling. The active spectrum is ——.
500
1 000
-1
Raman Shift (cm )
1 500
500
1 000
-1
Raman Shift (cm )
1 500
25
Intensity (cnt)
20
15
10
5
0
The axis scaling can also be set to relative scaling by using the Fast Graph Settings and selecting
“Relative” for the axis (see section 6.2, page 197).
Page | 208
LabSpec 5 user manual
Log
When “Log” is ticked the axis will be displayed with logarithmic scaling rather than linear scaling.
8.2.
Fast Settings
When “Fast settings” is ticked, the Fast Graph Settings are active (see section 6.2, page 197).
Left click on “Fast settings” to tick (activate) or untick (deactivate) this function.
Available for:
8.3.
Spectrum, Video, SpIm, Point, Map, Score, Model
Rescale
Left click on “Rescale” to rescale the active window so that all data is visible. In normal operation all
axes are affected, but note that an axis with scaling set to “Fixed” will not be rescaled. To rescale an
axis ensure that “Freeze” or “Fixed” scaling is turned off (see section 8.1, page 204).
This function can also be activated with the Scale Normalization icon (see section 4.4.1, page 91) or
with the <CTRL>+N keyboard shortcut.
Available for:
8.4.
Spectrum, Video, SpIm, Point, Map, Score, Model
Swap X axis
Click on “Swap X axis” to reverse the X axis display.
_________________________________________________________________________________
CAUTION: WHEN AN XY MOTORIZED SAMPLE STAGE IS PRESENT, THE AXIS DISPLAY FOR VIDEO IMAGES
SHOULD ALWAYS BE LEFT IN THE DEFAULT CONFIGURATION TO ENSURE CORRECT MAPPING AND EXTENDED
VIDEO IMAGING ACQUISITION.
-50
Y (µm)
THE X AXIS SHOULD HAVE UNITS RUNNING FROM
NEGATIVE ON THE LEFT HAND SIDE, THROUGH TO
POSITIVE ON THE RIGHT HAND SIDE, AS DISPLAYED
RIGHT.
0
20 µm
50
-100
0
X (µm)
100
_________________________________________________________________________________
Available for:
Spectrum, Video, SpIm, Point, Map, Score, Model
Page | 209
LabSpec 5 user manual
8.5.
Swap Y axis
Click on “Swap Y axis” to reverse the Y axis display.
_________________________________________________________________________________
CAUTION: WHEN AN XY MOTORIZED SAMPLE STAGE IS PRESENT, THE AXIS DISPLAY FOR VIDEO IMAGES
SHOULD ALWAYS BE LEFT IN THE DEFAULT CONFIGURATION TO ENSURE CORRECT MAPPING AND EXTENDED
VIDEO IMAGING ACQUISITION.
-50
Y (µm)
THE Y AXIS SHOULD HAVE UNITS RUNNING FROM
NEGATIVE AT THE TOP, THROUGH TO POSITIVE AT THE
BOTTOM, AS DISPLAYED RIGHT.
0
20 µm
50
-100
0
X (µm)
100
_________________________________________________________________________________
Available for:
8.6.
Spectrum, Video, SpIm, Point, Map, Score, Model
Image Colors
The Colors dialog window allows control of the color palettes used for image rendition, and
adjustment of image brightness and contrast.
Available for:
Spectrum, Video, SpIm, Point, Map, Score, Model
Page | 210
LabSpec 5 user manual
8.6.1.
Colors
LabSpec 5 uses an RGB palette for its image rendition – by default, red (R), green (G) and blue (B)
components are used to create the colored images displayed.
When a color “Red”, “Green” or “Blue” is ticked, it will be used to create the colored images. For
correct color rendering of images based on the selected color palette (see section 8.6.2, page 211)
ensure that all three colors (“Red”, “Green” and “Blue”) are ticked.
When “Neg” is ticked, the negative image will be displayed for the selected color palette.
8.6.2.
Palette
Available color palettes are listed in this section. Left click on one of the palette radio buttons (
select the palette.
) to
There are two types of palette:
o
True color – with this palette each color
component is displayed in its true color.
In the case of a video image, the three
components (red, green and blue) are
displayed in their individual colors to yield
a composite colored image.
In the case of a map image created from
a multidimensional spectral array the
cursor intensity image corresponds to the
cursor color. For example, the image
generated using the red map analysis
cursor will be displayed in a one color red
scale.
In the case of a score image created
from a multidimensional spectral array
the score image corresponds to the
reference component spectrum displayed
in the Model window. For example, the
score image for a red spectrum in the
Model window will be displayed in a one
color red scale.
This palette should be used for video
images, and map/score images where
multiple components are overlaid.
Page | 211
LabSpec 5 user manual
o
False color – with one of these palettes,
image pixels are displayed in different
colors depending on their intensity.
These palettes are useful when an image
has regions of both high and low
intensity, which can be hard to visualize
with a traditional true color palette.
These palettes should only be used for
representation of a single component
(e.g., a single cursor intensity map
image, or a single score image).
8.6.3.
Contrast and Brightness
Left click and drag the “Brightness” slider to adjust
the brightness for the image display.
Left click and drag the “Contrast” slider to adjust
the contrast for the image display.
If {All} is selected ( ), the brightness and contrast
adjustments will affect the complete RGB palette.
If one of {R}, {G} or {B} is selected ( ), the
brightness and contrast adjustments will only affect
the selected component (R, red; G, green; B, blue)
of the RGB palette.
Click on the Contrast and Brightness Initialization
icon to reset the brightness and contrast settings to
their default values. Note that this operation needs
to be done individually for {All}, {R}, {G} and {B}.
8.7.
Center Cursor
Left click on “Center cursor” to center the active cursor(s) in the active window.
This function is useful when cursors are not visible in a window, because their position lies outside the
range of the window. Right click and select “Center cursor” and the cursor(s) will be immediately
visible in the center of the window.
This function can also be activated with the Center Cursors icon (see section 4.4.3, page 92).
Available for:
Spectrum, Video, SpIm, Point, Map, Score, Model
Page | 212
LabSpec 5 user manual
8.8.
Axes
The Axes dialog window allows control over what axes are displayed, and how they are displayed
within the data window.
There are two Axes dialog windows, depending on the selected dimension (see section 8.1.1, page
204) of the data window. These two windows are discussed in turn below.
Available for:
Spectrum, Video, SpIm, Point, Map, Score, Model
8.8.1.
Axes Dialog Window for 1D and 2D Windows
8.8.1.1.
Options
The five possible display axes are listed, with tick boxes to select whether ticks, grid lines, axis values
and labels are shown.
The fives axes are indicated on the image shown
right.
TOP
R
I
G
H
T
L
E
F
T
20 µm
I
N
T
E
N
S
I
T
Y
BOTTOM
Page | 213
LabSpec 5 user manual
Ticks
When the “Ticks” box is ticked tick marks are displayed on the axis.
Grid
When the “Grid” box is ticked ‘main’ and ‘sub’ grid lines are displayed in the spectrum window. The
spacing of the grid lines are automatically calculated by LabSpec 5, but can be manually assigned
using the “Fix X grid to” and “Fix Y grid to” options in the Style section of the Axes dialog window (see
section 8.8.1.2, page 214)
Values
When the “Values” box is ticked axis values are displayed along the axis.
Labels
When the “Labels” box is ticked the axis title and units are displayed adjacent to the axis. Custom
labels can be used by typing in the desired axis label in the “Labels” text box.
To restore the default labels for an axis delete the text in the box.
8.8.1.2.
Style
The Style section allows the formatting of the axis components (frame, ticks, grid lines, values and
labels) to be set.
Frame
Select the line style for the axes frame using the “Frame” drop down box.
Main grid
Select the line style for the ‘main’ grid lines using the “Main grid” drop down box.
Sub grid
Select the line style for the ‘sub’ grid lines using the “Sub grid” drop down box.
Fix X grid to
When the “Fix X grid to” box is ticked the main grid lines for the X axis will be spaced at the interval
displayed in the box. To adjust the spacing type the desired grid line spacing into the text box.
3D look
When the “3D look” box is ticked the axes frame is displayed in a “3D” style.
Values
Select the font style for the axis values from the “Values” drop down box.
Labels
Select the font style for the axis values from the “Labels” drop down box.
Ticks
Select the line style for the ticks using the “Ticks” drop down box.
Fix Y grid to
When the “Fix Y grid to” box is ticked the main grid lines for the Y axis will be spaced at the interval
displayed in the box. To adjust the spacing type the desired grid line spacing into the text box.
Page | 214
LabSpec 5 user manual
8.8.2.
Axes dialog Window for 3D Windows
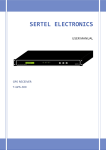
8.8.2.1.
Options
The schematic in the Options section illustrates the seven available axes (six surrounding the 3D
image, and one for intensity). Each axis is configured individually.
Select an axis by clicking the appropriate radio tag.
When the tick box is ticked the three forward axes are displayed, in front of the 3D image.
Ticks
When the “Ticks” box is ticked tick marks are displayed on the axis.
Values
When the “Values” box is ticked axis values are displayed along the axis.
Labels
When the “Labels” box is ticked the axis title and units are displayed adjacent to the axis. Custom
labels can be used by typing in the desired axis label in the “Labels” text box.
To restore the default labels for an axis delete the text in the box.
Swap X and Y
Click on [Swap X and Y] to reverse the positions of the X and Y axes in the 3D image display.
Re-center image
Click on [Re-center image] to return the image to its default position in the display window. This
function is useful if the image position has been modified using the Axes3D icon – see section 5.24,
page 193.
8.8.2.2.
Style
The Style section allows the formatting of the axis components (frame, ticks, values and labels) to be
set.
Frame
Select the line style for the axes frame using the “Frame” drop down box.
Page | 215
LabSpec 5 user manual
Ticks
Select the line style for the ticks using the “Ticks” drop down box.
Values
Select the font style for the axis values from the “Values” drop down box.
Labels
Select the font style for the axis values from the “Labels” drop down box.
8.9.
Legend
The Legend dialog window allows control of the legend display and formatting.
The legend is displayed for spectral windows, and
shows the data object name and its display color.
100
spectrum
spectrum2
Intensity (cnt)
80
60
40
20
0
500
1 000
Raman Shift (cm-1 )
1 500
Show
Tick the boxes for Single and Multi to activate the legend for single and overlay display modes
respectively.
Frame
Select the line style for the legend frame using the “Frame” drop down box.
Text
Select the font style for the legend text from the “Text” drop down box.
Available for:
Spectrum, SpIm, Point, Model
Page | 216
LabSpec 5 user manual
8.10.
Spectrum
The Spectrum dialog window allows control of the spectrum display format.
Style
Select the display style from the following options:
o
Line
o
Dot
o
Bar
Page | 217
LabSpec 5 user manual
Use same style for all spectra
When “Use same style for all spectra” is ticked all spectra in the current window will share a common
line style, based upon the current setting in the Spectrum dialog window.
If “Use same style for all spectra” is not ticked then the line style setting in the Spectrum dialog
window is applied to the active spectrum only. In this mode it is possible to have multiple spectra
displayed with different line styles.
Line
Select the spectrum display color and (where appropriate) line style for the spectrum using the “Line”
drop down box.
Point size
Select the point size for the “Dot” spectrum display. Note that the point color is set in the “Line” drop
down box.
Available for:
8.11.
Spectrum, SpIm, Point, Model
Cursor
The Cursor dialog window allows control of the cursor behaviour and display format.
Style
Select the cursor style from the “Style” drop down box. The following cursor styles are available:
Spectrum, Model windows
o Line – single vertical line cursor, displaying the X axis position (S) of the cursor and the
intensity (I) of the spectrum at the cursor position.
o Cross – cross hair cursor, displaying the X axis position (S) and Y axis position (I) of the
cursor.
o Level – cross hair cursor which tracks the intensity of the spectrum, displaying the X axis
position (S) and Y axis position (I) of the cursor. In this case, the Y axis position is
equivalent to the spectrum intensity at the cursor position.
o Double – two vertical cursors, displaying the X axis position (S) of each cursor and the width
between the two cursors (W).
o Peak – three linked vertical cursors, the central one locking to the maximum intensity pixel in
a peak, and the outer two locking to the pixels closest to the full width at half maximum
Page | 218
LabSpec 5 user manual
height (FWHM) of the peak. The Peak cursor displays the X axis position (S), intensity (I)
and approximate full width at half maximum height (W) of the peak at the cursor position.
Video, Map, Score windows
o Cross – cross hair cursor, displaying the X axis position (X) and Y axis position (Y) of the
cursor, and pixel intensity (I) at the cursor position. For the Map and Score windows, the
spectrum associated with the cursor position
position will be displayed in the Point window.
o Rect – rectangular cursor (resizeable by left clicking and dragging the drag points),
displaying the X axis position (X) and Y axis position (Y) of the bottom, right hand corner of
the rectangular cursor. For the
the Map and Score windows, the average spectrum from within
the rectangle is displayed in the Point window.
Selected
Select the display formatting for the cursor when it is selected (i.e., active), using the Selected drop
down box.
Deselected
Select the display formatting for the cursor when it is not selected (i.e., inactive), using the Deselected
drop down box.
Transparent
When “Transparent” is ticked the cursor is displayed in a transparent mode, allowing features behind
the cursor to be visualized.
Fixed width
When “Fixed width” is ticked the width between “Double” cursors is fixed to its current value. In this
mode, both cursors will move together when dragged by the mouse. To adjust the width of the
“Double” cursors ensure that “Fixed width” is unticked.
Allow selected points
When “Allow selected points” is ticked multiple discrete points within a map or score profile/image can
be selected.
When <CTRL> is held down the mouse cursor
changes to the Select Point cursor.
<CTRL>+click to select a position in the map or
score profile/image. Multiple positions can be
simultaneously selected by clicking additional
positions.
When <CTRL> is held down and the mouse cursor
is hovered over an existing selected point, the
mouse cursor changes to the Remove point cursor.
<CTRL>+click to delete an existing selected point.
The average spectrum from the selected points will
be displayed in the Point window.
Page | 219
LabSpec 5 user manual
Add position to custom info
When “Add position to custom info” is ticked the cursor values are included within the Custom tab of
the parameters information dialog window (see section 4.4.5, page 92).
Available for:
8.12.
Spectrum, Video, Map, Score, Model
Red Cursor
The Red Cursor dialog window allows control of the cursor behaviour and display format for the red
(SpImRed) map analysis cursor (see section 5.2, page 165).
The Red Cursor dialog window is identical to the standard Cursor dialog window described above
(see section 8.11, page 218).
The map analysis cursor should be operated in “Double” mode. It is advisable that the color is
retained as red to avoid confusion.
Available for:
8.13.
SpIm, Point
Green Cursor
The Green Cursor dialog window allows control of the cursor behaviour and display format for the
green (SpImGreen) map analysis cursor (see section 5.2, page 165).
The Green Cursor dialog window is identical to the standard Cursor dialog window described above
(see section 8.11, page 218).
The map analysis cursor should be operated in “Double” mode. It is advisable that the color is
retained as green to avoid confusion.
Available for:
8.14.
SpIm, Point
Blue Cursor
The Blue Cursor dialog window allows control of the cursor behaviour and display format for the blue
(SpImBlue) map analysis cursor (see section 5.2, page 165).
The Blue Cursor dialog window is identical to the standard Cursor dialog window described above
(see section 8.11, page 218).
The map analysis cursor should be operated in “Double” mode. It is advisable that the color is
retained as blue to avoid confusion.
Available for:
SpIm, Point
Page | 220
LabSpec 5 user manual
8.15.
Image
The Image dialog window allows the image color and smoothing options to be set.
Style
Select the smoothing interpolation style from the
available options:
o
o
o
o
No smoothing – image is displayed in
raw pixelated form.
X smoothing – image is displayed with
smoothing interpolation in the X
dimension.
Y smoothing – image is displayed with
smoothing interpolation in the Y
dimension.
XY smoothing – image is displayed with
smoothing interpolation in the X and Y
dimensions.
Color
Select the image display color for the active image component from the “Color” drop down box.
Note that the color selected is only displayed when the image is displayed in True Color mode – see
section 8.6, page 210) for full information about image colors.
When the color is changed for a DCLS modelling score image the reference component spectrum
display in the Model and Point windows will be automatically updated. Similarly, the score image
color will be automatically updated if the reference component spectrum color is modified in the Model
window.
Available for:
Video, Map, Score
Page | 221
LabSpec 5 user manual
8.16.
Scale Bar
The Scale Bar dialog window allows control of display formatting for the image scale bar.
Line
Select the line style from the “Line” drop down box for the line surrounding the scale bar.
Fill
Select the fill colour from the “Fill” drop down box for the scale bar.
Font
Select the font style from the “Font” drop down box for the scale display text. Note that the color of
the text is set through the “Color” drop down box.
Color
Select the color from the “Color” drop down box for the scale display text.
Available for:
8.17.
Video, Map, Score
Imposition
The Imposition dialog window allows information from the multidimensional spectral array Map and
Score windows to be superimposed on the active video camera image.
The display color is automatically assigned by LabSpec 5 to match the color of the object being
superimposed.
To start the selected superimposition click [OK] and then activate a Map or Score window.
Page | 222