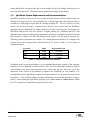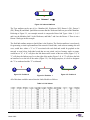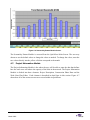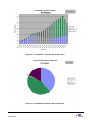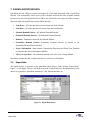
1
QUICK ZONE D ELAY ESTIMATION PROGRAM VERSION 0.99 USER GUIDE Prepared for: Federal Highway Administration Prepared by: March 2001 Table of Contents 1. INTRODUCTION ...................................................................................................1 1.1. 1.2. 1.3. 1.4. 1.5. 2. OVERVIEW OF QUICKZONE V 0.99 .................................................................................... 2 QUICKZONE USER GUIDE ORGANIZATION .......................................................................... 2 QUICKZONE SYSTEM REQUIREMENTS AND RECOMMENDATIONS ......................................... 3 QUICKZONE ORGANIZATION AND OPERATION .................................................................... 4 ADDITIONAL SOURCES OF INFORMATION ............................................................................ 5 QUICKZONE QUICK START...................................................................................6 Necessary Quick Start Data Elements ................................................................................................. 6 Quick Start Steps.................................................................................................................................. 6 3. NETWORK DESIGN...............................................................................................9 3.1. NODES ............................................................................................................................ 9 3.2. LINKS .............................................................................................................................10 3.3. INTERSECTIONS ..............................................................................................................12 At-Grade ............................................................................................................................................. 12 Grade Separated ................................................................................................................................ 12 3.4. DEMAND .........................................................................................................................13 3.5. DEMAND PATTERNS ........................................................................................................13 4. USER INPUT MODULES ..................................................................................... 15 4.1. 4.2. 4.3. 4.4. 4.5. 4.6. 4.7. NODES MODULE..............................................................................................................15 LINKS MODULE................................................................................................................16 INBOUND DEMAND PATTERN ............................................................................................18 OUTBOUND DEMAND PATTERN ........................................................................................19 DEMAND MODULE ...........................................................................................................21 SEASONALITY DEMAND PATTERN MODULE .......................................................................22 PROJECT INFORMATION MODULE .....................................................................................23 Project Information ............................................................................................................................. 25 Construction Phase Data ................................................................................................................... 26 Work Zone Plan Editor ....................................................................................................................... 27 4.8. LIFE CYCLE COSTING MODULE.........................................................................................32 5. PROGRAM CONTROLS ....................................................................................... 34 6. OUTPUTS ........................................................................................................... 35 6.1. 6.2. 6.3. 6.4. PROJECT DELAY SUMMARY .............................................................................................35 TRAVEL BEHAVIOR SUMMARY ..........................................................................................37 LIFE-CYCLE COSTING GRAPH ..........................................................................................39 SUMMARY TABLE ............................................................................................................39 QuickZone V 0.99 User Guide March 2001 Page i 7. SAVING QUICKZONE DATA ............................................................................... 43 7.1. EXPORT DATA .................................................................................................................43 7.2. IMPORT DATA..................................................................................................................44 8. SAMPLE NETWORK............................................................................................ 45 8.1. DEVELOPING THE KNOXVILLE, TN NETWORK ....................................................................46 9. FREQUENTLY ASKED QUESTIONS AND TROUBLESHOOTING ............................ 48 10. TECHNICAL SUPPORT, REPORTING BUGS & COMMENTS.................................. 50 APPENDIX 1—QUICKZONE DELAY ESTIMATION ALGORITHM APPENDIX 2— WISCONSIN DATA EXAMPLE APPENDIX 3—QUICKZONE SAMPLE NETWORKS QuickZone V 0.99 User Guide March 2001 Page ii Table of Figures FIGURE 2-1 QUICKZONE START................................................................................................... 7 FIGURE 2-2 QUICKZONE MAIN SCREEN ....................................................................................... 7 FIGURE 3-1 MINIMUM QUICKZONE NETWORK ............................................................................... 9 FIGURE 3-2 INBOUND ATTRIBUTE ................................................................................................11 FIGURE 3-3 POSITION 0 .............................................................................................................11 FIGURE 3-4 POSITION 1.............................................................................................................11 FIGURE 3-5 POSITION 2 .............................................................................................................11 FIGURE 3-6 FOUR-W AY .............................................................................................................12 FIGURE 3-7 "T"..........................................................................................................................12 FIGURE 3-8 GRADE SEPARATION ................................................................................................12 FIGURE 3-9 DIAMOND ................................................................................................................12 FIGURE 3-10 CLOVERLEAF .........................................................................................................12 FIGURE 4-1 NODE MODULE SCREEN...........................................................................................15 FIGURE 4-2 LINK MODULE SCREEN (KNOXVILLE EXAMPLE) ..........................................................17 FIGURE 4-3 INBOUND DEMAND PATTERN MODULE SCREEN .........................................................19 FIGURE 4-4 OUTBOUND DEMAND PATTERN MODULE SCREEN ......................................................20 FIGURE 4-5 DEMAND MODULE SCREEN ......................................................................................22 FIGURE 4-6 SEASONALITY PATTERN MODULE SCREEN ................................................................23 FIGURE 4-7 PROJECT INFORMATION MODULE FLOW DIAGRAM .....................................................24 FIGURE 4-8 PROJECT INFORMATION SCREEN ..............................................................................25 FIGURE 4-9 CONSTRUCTION PHASE DATA SCREEN .....................................................................26 FIGURE 4-10 W ORK ZONE INFORMATION TAB..............................................................................27 FIGURE 4-11 W ORK ZONE LINKS TAB .........................................................................................28 FIGURE 4-12 MITIGATION STRATEGIES TAB .................................................................................29 FIGURE 4-13 ROUTE TIMING SCREEN .........................................................................................30 FIGURE 4-14 LANE W IDENING SCREEN .......................................................................................30 FIGURE 4-15 RAMP METERING SCREEN ......................................................................................31 FIGURE 4-16 TRAVEL BEHAVIOR TAB ..........................................................................................32 FIGURE 4-17 LIFE CYCLE COSTING MODULE SCREEN ..................................................................33 FIGURE 6-1 DELAY GRAPH OPTION SCREEN ...............................................................................35 FIGURE 6-2 W EEKLY DELAY GRAPH ...........................................................................................36 FIGURE 6-3 DAILY DELAY GRAPH ...............................................................................................36 FIGURE 6-4 TRAVEL BEHAVIOR GRAPHING SELECTION SCREEN ...................................................37 QuickZone V 0.99 User Guide March 2001 Page iii FIGURE 6-5 TRAVEL BEHAVIOR SUMMARY BAR GRAPH SCREEN ...................................................38 FIGURE 6-6 TRAVEL BEHAVIOR SUMMARY PIE GRAPH SCREEN ....................................................38 FIGURE 6-7 LIFE-CYCLE DELAY COSTS OUTPUT..........................................................................39 FIGURE 6-8 SUMMARY TABLE SCREEN........................................................................................41 FIGURE 6-9 INPUT DATA TABLE SCREEN .....................................................................................42 FIGURE 7-1 EXPORT DATA SCREEN ............................................................................................43 FIGURE 7-2 IMPORT DATA SCREEN .............................................................................................44 FIGURE 8-1 KNOXVILLE REGION .................................................................................................45 FIGURE 8-2 KNOXVILLE, TN NETWORK .......................................................................................47 FIGURE 8-3 KNOXVILLE, TN QUICKZONE OUTPUT .......................................................................47 FIGURE 9-1 REFERENCE FILE DIALOG BOX .................................................................................48 QuickZone V 0.99 User Guide March 2001 Page iv 1. INTRODUCTION In all but a few high-visibility freeway construction and refurbishment projects, the “soft cost” of traveler delay is typically not considered when key decisions about project staging and duration are made. The 1998 Federal Highway Administration (FHWA) report “Meeting the Customer’s Needs for Mobility and Safety During Construction and Maintenance Operations” identifies this issue and recommends the development of an analytical tool to estimate and quantify work zone delays. To this end, the FHWA proceeded with the development of QuickZone, an easy-tomaster analytic tool that allows for quick and flexible estimation of work zone delay supporting all four phases of the project development process (policy, planning, design and operation). QuickZone allows users to: 1) Quantify corridor delay resulting from capacity decreases in work zones; 2) Identify delay impacts of alternative project phasing plans; and 3) Support tradeoff analyses between construction costs and delay costs. QuickZone is being developed using a rapid prototyping approach. As such, a series of prototypes with limited capability be released to a set of beta testers to evaluation. The betatesters respond not only in terms of look and feel of the product, but in terms of how they imagine using the tool. With beta-tester feedback provided in the early stages of development, the tool development effort reduces the risk of developing a product that does not fit the needs of the target user. In addition, a Tool Review Committee, drawn from a user base of contractors, DOT planners and local agency personnel, has been organized by FHWA to provide input on QuickZone. The following is the QuickZone project schedule: ! Version Beta 0.5—Distributed in July 2000 to the Tool Review Committee members. Members are expected to use the sample network and provide comments on the look, feel and usefulness of QuickZone. ! Version 0.9—Distributed in October 2000 to the Tool Review Committee members. Version 0.9 will incorporate comments from Beta 0.5 and will also allow members to input their own networks. ! Version 0.91—Distributed in late November 2000 to the Tool Review Committee members. This is a full functioning version and members are expected to use the sample network (Knoxville, TN) as well their own networks to thoroughly beta test the program before the final release. ! Version 0.99—Distributed in March 2001 to the Tool Review Committee members. Version 0.99 was also posted to the QuickZone web site for public download as well. This is a full functioning version that has gone through a comprehensive beta-testing effort. However, this version has not been calibrated nor validated. ! Version 1.0—Public release of QuickZone Spreadsheet Analysis Tool in October 2001. QuickZone V 0.99 User Guide March 2001 Page 1 The overall goal in terms of ease-of-use for QuickZone is less than three hours to prepare and input a QuickZone network, and less than three minutes to analyze the data and produce delay profiles over the project duration. Target users of QuickZone include state and local planners, traffic operations and construction staff as well as construction contractors. QuickZone is written as a small program within Microsoft’s spreadsheet program, Excel. Therefore, those users who have used or currently use Microsoft Excel should not have a problem using QuickZone. QuickZone will be distributed as an open-source software product so that anyone with programming skills will be able to modify and customize QuickZone as they see fit. 1.1. Overview of QuickZone V 0.99 QuickZone Beta Version 0.99 is being distributed to the Tool Review Committee members and to the public with full functionality and their continued review and comment. All of the functionality of QuickZone, including project phasing, mitigation strategies and results are available to be used. QuickZone V 0.99 now incorporates a number of user navigation enhancements that will aid in using the program. Other changes include better functionality in importing and exporting data, and converting the Construction Phases and Work Zone Plans from a monthly calendar to a weekly calendar. This modification makes it easier to enter construction phase information in a more realistic manner. Also, QuickZone V 0.99 now includes the ability to have full road closure along work zone links. 1.2. QuickZone User Guide Organization The QuickZone User Guide is divided into ten separate sections: Introduction, QuickZone Quick Start, Network Design, User Input Modules, Network Controls, Outputs, Import & Export QuickZone Data, Sample Network, Technical Support, and Frequently Asked Questions. There are three appendices as well. Appendix 1 includes the Quickzone Delay Estimation Algorithm. Appendix 2 is an example of hourly demand factors developed by the State of Wisconsin. Appendix 3 is the sample network from QuickZone Beta V 0.5. The Introduction provides the user with a background on QuickZone as well as the necessary system requirements. The Quick Start section is designed to allow users to quickly verify that the sample network is installed and to use the various capabilities of the QuickZone program. The Quick Start section tells users how to install the software, check the sample network and view results (all default data for the smaple network is from the Highway Capacity Manual, 1994 Special Edition). The section on Network Design provides a discussion and hints or tricks on how to develop and design a network for the QuickZone program. The User Input Modules, Network Control, and Outputs sections give the user detailed instructions on how to enter data, QuickZone V 0.99 User Guide March 2001 Page 2 change default data, run QuickZone and view the outputs. Finally, the Sample Network gives an overview of the Knoxville, TN network that is included as a sample in QuickZone. 1.3. QuickZone System Requirements and Recommendations QuickZone provides an easy-to-use, easy-to-learn tool that utilizes software interfaces that are familiar to the target user base. The assumption here is that the target users have Microsoft Excel available as a multi-purpose application on a desktop or laptop PC. The use of Excel as a basis obviates the need to develop a customized user interface from scratch and the Workbook application may be distributed free without royalties or license from Microsoft. The prospective QuickZone analyst need only have Excel97 or higher running on a Windows-based PC with minimal memory and processing speed requirements. In order to accomplish the goal of less than three minutes to analyze the data and produce delay profiles over the project duration, the following system requirements are needed: 1) PC running Microsoft Windows 95 or higher with monitor, mouse and keyboard and 2) Microsoft Excel 97. Refer to Table 1-1 for a listing of program run-times. Processor RAM Program Run-Time P166 32 MB ~ 3 minutes P233 32 MB ~ 2 minutes P400 64 MB ~ 1 minute Table 1-1 QuickZone Performance Guideline In addition to the system requirements, it is recommended that display settings of the computer monitor be set at a minimum resolution of 800 x 600. All of the QuickZone worksheets and the code modules have been password-protected to ensure that the user does not cause any unforeseen errors. Please do not attempt to unprotect the worksheets or code modules. It is recommended that the QuickZone program be opened after the Excel program has been started (File/Open…). This will help with the computer and memory resources that QuickZone requires. Finally, when opening the QuickZone program, user’s must ensure to enable macros within Excel 97; otherwise, the QuickZone program will not work. QuickZone V 0.99 User Guide March 2001 Page 3 1.4. QuickZone Organization and Operation QuickZone employs a range of Excel 97 dialog sheets and worksheets. A master control dialog sheet is used for navigation between the three major modules: User Input, Network Controls and Outputs. The User Input interface is a series of linked worksheet environments. The Network Controls are directly accessed from the master control dialog sheet and initiate QuickZone to begin running. The Outputs are displayed using a range of Excel charts and dialog sheets. Prior to QuickZone analysis, the user must have defined four critical data components: 1. Network Data—Describing the mainline facility under construction as well as adjacent alternatives in the travel corridor; 2. Project Data—Describing the plan for work zone strategy and phasing, including capacity reductions resulting from work zones; 3. Travel Demand Data—Describing patterns of pre-construction corridor utilization; and 4. Corridor Management Data—Describing various congestion mitigation strategies to be implemented in each phase, including estimates of capacity changes from these mitigation strategies. QuickZone takes these data and compares expected travel demand against proposed capacity by facility on an hour-by-hour basis for the life of the project to estimate delay and mainline queue growth. This hour-by-hour calculation is conducted for each project phase, taking into account both expected time-of-day utilization (e.g., morning peak vs. mid-day demand) and seasonal variation in travel demand (e.g., expected August vs. February travel demand). This hour-by-hour estimation is conducted using a simple deterministic queueing model for each link in the work zone impact area. Sections of the work zone that are downstream from bottlenecks see lower travel demand because vehicle flow is effectively metered at the upstream bottleneck. Queues on detour routes are also monitored. Delay is calculated at each bottleneck within the system by tracking the number of queued vehicles. System delay is calculated by summing delay across all bottlenecks. QuickZone first estimates total delay under the assumption that there will be no change to traveler behavior in response to capacity reductions associated with the project. This maximum delay profile is used to help characterize the likely behavioral response in the travel corridor. The type and magnitude of change to traveler behavior (as well as the mix of behaviors) will hinge on the severity and duration of delay across project phases. For example, a project generating limited delay on the mainline facility only during off-peak periods is likely to induce only small changes in travel behavior, primarily focused on a change of route on some alternative facility. Conversely, a project generating severe peak period delay will drive a QuickZone V 0.99 User Guide March 2001 Page 4 broader, more complex traveler response: a wider utilization of adjacent roadways, a shift in travel to non-peak periods, a switch to transit or other modes, or a simple reduction in corridor demand as prospective trips are simply cancelled or directed outside the travel corridor. Surveying a range of case studies on travel demand management effectiveness during major highway reconstruction projects (TRB Special Report #212, 1986), mainline demand reductions of up to 50% have been realized. This figure gives us an upper bound on the magnitude of traveler response. A summary of predicted traveler response (route changes, peak-spreading, mode shift, trip loss) is generated as an output of this process. Once traveler response is estimated, delays are recalculated (including delays on detour routes). Delays are summarized in four printable output screens: ! Project Delay Summary—Profiling expected delay by time-of-day in each phase, as well as other aggregated statistics such as total delay or mainline queue length; ! Travel Behavior Summary—Displaying expected change in volumes on both the mainline and adjacent facilities; ! Life-Cycle Delay Costs—Depreciating project cost over total expected life of the reconstruction; and ! Summary Table—Worksheet providing analysis of Queue, Delay, Travel Behavior, Cost and Inputs. 1.5. Additional Sources of Information For more information regarding work zone analysis, life-cycle cost analysis or other traffic engineering aspects of QuickZone, please refer to the following documents: ! Highway Capacity Manual, Special Report 209, Transportation Research Board, 1994 ! Work Zone Operations: Best Practices Guidebook, Federal Highway Administration & American Association of State Highway and Transportation Officials, March 31, 2000 ! Get In, Get Out, Stay Out! Proceedings of the Workshop on Pavement Renewal for Urban Freeways, February 16-19, 1998 ! Life-Cycle Cost Analysis in Pavement Design, Participant’s Notebook, Federal Highway Administration, August 1998 QuickZone V 0.99 User Guide March 2001 Page 5 2. QUICKZONE QUICK START The basic operation of QuickZone Beta V 0.99 is intended to be straightforward. QuickZone is pre-loaded with a sample network of Knoxville, TN and default values for all required parameters. All the user needs to do is copy the QuickZone program to the hard drive, run Microsoft Excel and open the QuickZone file (QZv099.xls). The Knoxville, TN sample network pre-loaded with QuickZone may be modified and used as needed as well as the default values. However, the user should either save a back-up copy of QuickZone file or export the Knoxville, TN data files with the default values for future reference. To perform a QuickZone analysis, the user will only need to verify that sample network has been installed. This can be accomplished using the QuickZone Quick Start steps. NECESSARY QUICK START DATA ELEMENTS The following data are necessary in order to conduct a QuickZone analysis. The Knoxville, TN sample network comes preloaded with all necessary values. 1. Network (Nodes and Links)—A complete network with Nodes, Links and AADT with the Mainline Inbound and Detour Inbound links identified. 2. Project Information—Project Starting Date & Project Duration. 3. Construction Phase Data—Duration and Infrastructure Cost. 4. Work Zone Plan—Start, End, Links affected by the construction, capacity decrease of each affected link, mitigation strategy to be used (optional), days of the week the construction is in effect. QUICK START STEPS The following steps will take the user through a primer on using the QuickZone program using the sample network. These are the basic steps necessary to: 1) Verify that the sample network is loaded correctly, 2) Run the program, and 3) View the results. Refer to Section 4 for more detailed descriptions of the attributes of the data elements as well as individual screen shots of each input screen (please note that you must enable macros within the Excel in order for QuickZone to work). 1. Run Microsoft Excel on your computer and then open the QuickZone file (File/Open…). The QuickZone file is named QZv099.xls. You will see the following screen (Figure 2-1). Click on Begin QuickZone V 0.99 which will open up the QuickZone Main Screen (Figure 2-2). QuickZone V 0.99 User Guide March 2001 Page 6 Figure 2-2 QuickZone Main Screen Figure 2-1 QuickZone Start 2. Click the tab labeled Input Data then Nodes and verify that there are X and Y coordinates for the network (refer to Nodes Module for more detailed information). 3. Click Return to Main. 4. Click on Links and verify that there is an A Node and B Node for each link. Next, verify that data is entered for the Number of Lanes, Capacity, Length, Freeflow Speed, Type, and Position (refer to Links Module for more detailed information Link data). 5. Click Return to Main. 6. Click on Demand and verify the AADT for each link defined in Step 4 (refer to Demand Module for more detailed information). 7. Click Return to Main. 8. Click on Project Information. You will receive the following message: “There is already Project Information entered. Would You like to use it?” Click Yes. Verify that a Project Description, Project Start Date, and Project Duration are entered. 9. Click Add Construction Phase Data (lower right of the Project Information screen). You will receive the following message: “There is already Phase Information for this Network. Would you like to use it?” Click Yes. Verify the Phase Description, Duration and Infrastructure Cost data are entered. 10. Click Work Zone Plan Editor. Verify the data is entered for both Work Zone Plan 1 and Work Zone Plan 2 (refer to the title bar to determine which Work Zone Plan you are using). QuickZone V 0.99 User Guide March 2001 Page 7 11. Click Return to Phases. 12. Click Close Construction Phase Data. You will receive the following message: “Finished with Entering the Phases?” Click Yes. 13. Click Life Cycle Costing. Verify that the information has been entered. 14. Click Return To Main. 15. Click the Program Controls tab then Generate Network. You will receive the following message: “Ready to Create Network.” Click Yes. After the network is generated, you will receive the following message: “Network Created.” Click OK. This generates the network diagram and only has to be done once. 16. Click View Network. This will bring up a diagram of the network. 17. Click Return to Main. 18. Click Calculate Phase Data. You will receive the following message: “Start Calculation Phase Data?” Click Yes. After the phase data is calculated (this will take up to three minutes), you will receive the following message: “Phase Calculations Complete.” Click OK. 19. Click the Output Data tab then Delay Graph. Click the radio button next to “Delay Graph Comparing up to Six Phases.” Click the radio button next to “Manually Choose Phase or Phases” and then select Phase 1 and click the double arrow pointing to the right and then select Phase 2 and click the double arrow pointing to the right. 20. Click Graph. This will bring up the Delay Graph showing delay by time of day for the phases selected. 21. Click Return to Main. 22. Click Summary Table. This will bring up the Summary Table. 23. Click Return to Main. 24. Click Life-Cycle Costing Graph. This will bring up the costs associated for the project. Click Return to Main. Modify as needed QuickZone V 0.99 User Guide March 2001 Page 8 3. NETWORK DESIGN The QuickZone program is a network flow model that analyzes individual segments at each time step (in this case, the time step is one hour). QuickZone relies on a network composed of nodes and links. The Minimum QuickZone Network (Figure 3-1) has a total of five nodes (circles with white lettering) and eight links. The Inbound direction is identified as left-to-right. This is the simplest QuickZone network. 5 7 9 6 4 1 10 8 5 2 1 11 6 3 2 4 3 7 12 Inbound Figure 3-1 Minimum QuickZone Network The following sections provide an introduction to designing a network that is optimized for QuickZone. The Minimum QuickZone Network (Figure 3-1) will be used as an example throughout this discussion. Sections 3.1 through 3.3 provide a basic understanding of the various components of a QuickZone network. Section 3.4 and 3.5 provide a discussion of where best to obtain, generate or calculate the Demand Patterns and Demand that are essential to getting good results from the QuickZone program. 3.1. Nodes Nodes are the simplest element of a QuickZone network. Nodes generally represent a roadway intersection and determine the beginning and end of a road or link. Referring to Figure 3-1, our example network is composed of five nodes. Each node has an X and Y value. Node data, along with link data, will also provide the application information to generate and graphically display the network. These three pieces of data Node Number, X value and Y value, would be entered in to the Nodes Module as follows: QuickZone V 0.99 User Guide March 2001 Page 9 Table 3-1 Node Values To determine the X and Y values it was assumed that node 6 was at X=0, Y=0. From then on, each node was considered to be 1 unit. In reality, the network will be based upon a scaled map and the X and Y coordinates can be developed based on a Cartesian Coordinate system that the user identifies. Node coordinates can be approximated using existing maps or gathered using most hand-held or vehicular mounted GPS receivers. 3.2. Links Links are the heart of the QuickZone network. Links include most of the attributes that are used within the QuickZone algorithm. QuickZone requires, at minimum, three types of links: Mainline, Workzone and Detour. A link is defined by its beginning node "A Node" and ending node "B Node". No two links may have the same "A Node" and "B Node". Links also have a number of other attributes associated with them—number of lanes, capacity, length, freeflow speed, jam density, direction, type and position. Most of these attributes are straightforward and not unique to QuickZone. For example, the number of lanes and freeflow speed can be determined by reviewing construction plans or conducting a site visit. The capacity and jam density can be obtained from a local traffic engineer or reviewing the Highway Capacity Manual which gives default values for some roadway types. Length can be determined from a map or driving the roadway segment if necessary. Three attributes that are unique to QuickZone include the Direction, Type and Position. The Direction of a link is determined by the labeled Inbound direction. QuickZone must have a direction associated with each link that is either labeled as Mainline or connects to the Mainline. This is a requirement for calculating the conservation of flow. It does not matter which direction is labeled as Inbound, so long as the direction is consistent throughout the entire network. Referring to Figure 3-2, the Inbound direction is labeled from left to right. This would define Link 3 as beginning at Node 3 (A Node) and ending at Node 4 (B Node) and be considered the Inbound (or "I" for the QuickZone attribute) direction. Whereas Link 6 would begin at Node 4 and end at Node 3 and be considered the Outbound (or "O") direction. QuickZone V 0.99 User Guide March 2001 Page 10 6 3 4 3 Inbound Figure 3-2 Inbound Attribute The Type attribute can be one of six—Mainline (M), Workzone (WZ), Detour 1 (D1), Detour 2 (D2), Ramp (R) and blank. QuickZone assumes that the Workzone links are part of the Mainline. Referring to Figure 3-1, our example network is composed of three link Types—links 1, 3, 4, 5 and 6 are the Mainline; link 2 is the Workzone; and links 7 and 8 are the Detour 1. There is not a Detour 2 link type in this example. The final link attribute unique to QuickZone is the Position. The Position attribute is used purely for generating a visual representation of the network. Paired links, such as those running east and west, would have either a "1" or "2" associated with each link and would be graphed on the network as seen below. Individual roads that are not paired, such as frontage roads or ramps, would have a "0". A "0" will place the link between the center of the two nodes (Figure 3-3). A "1" will place the link on top of or to the right of the nodes (Figure 3-4). A "2" will place the link on bottom of or to the left of the nodes (Figure 3-5). For design purposes, it is best to designate the "1" as outbound and the "2" as inbound. 4 7 2 5 Figure 3-3 Position 0 1 1 2 Figure 3-4 Position 1 2 1 Figure 3-5 Position 2 All of this data would be entered into the Links Module as follows: Table 3-2 Link Values QuickZone V 0.99 User Guide March 2001 Page 11 3.3. Intersections Intersections are a collection of Nodes and Links. The following two sections provide examples of how to represent various At-Grade and Grade Separated intersections. AT-GRADE QuickZone does not distinguish between the different types of At-Grade intersections. For example, QuickZone does not need to know whether the intersection has a yield sign, stop sign, or is signalized. Below is an example of how to model a Four Way Intersection (Figure 3-6) and a "T" Intersection (Figure 3-7). All of the QuickZone intersections are a modification of these two basic designs. 4 1 4 2 3 1 2 3 Figure 3-7 "T" 5 Figure 3-6 Four-Way GRADE SEPARATED Grade Separated intersections or interchanges as they are commonly called, are typically found on interstates or arterial highways. These types of interchanges come in many different configurations and it would be difficult to include examples of them all. Below are three examples of the most basic type—Grade Separation, Diamond and Cloverleaf. These three examples can be used as a foundation for a QuickZone network and modified as needed. 4 4 4 11 18 17 1 3 1 3 12 1 3 13 16 15 14 5 5 5 Figure 3-8 Grade Separation Figure 3-9 Diamond Figure 3-10 Cloverleaf ! Grade Separation—The Grade Separation has a total of four nodes and four links. This is basically a bridge with no entrance or exit ramps. QuickZone V 0.99 User Guide March 2001 Page 12 ! Diamond—The Diamond Interchange has a total of eight links within the four nodes. The four diagonal links are the ramps that allow the access among all the roads. ! Cloverleaf Interchange—These types of interchanges are found mostly in high-volume traffic areas. This type of design separates all of the traffic movement that is going north, south, east or west. Again, all of the diagonal links are the ramps. 3.4. Demand The demand is an essential part of the QuickZone program. Without an accurate demand, QuickZone will not generate usable results. The demand needs to be available in hourly counts for each day of the week. Accurate demand is required for the Mainline, Workzone and all links connecting to the Mainline so that QuickZone can perform Conservation of Flow calculations. If the demands are not available for other links within the QuickZone network, engineering judgment can be used to estimate them. Collecting or getting this data may seem daunting. However, many local traffic departments, state DOTs or planning agencies will have these volume counts available. The local traffic departments or state DOTs will have traffic detectors set up to automate the collection and analysis of traffic volume. If the traffic volume data is not available or must be collected specifically for QuickZone, one month of data is reasonable with which to generate daily and hourly volume counts that can then be used to generate Hourly and Daily Demand Patterns (or K-Factors). QuickZone also includes the ability to automatically calculate hourly demand patterns from the Average Daily Traffic using the default setting from the Highway Capacity Manual. Refer to Section 4.5 for more information regarding the Auto Calculate feature. 3.5. Demand Patterns Aside from the demand, the Hourly and Daily Demand Patterns are also vital to the QuickZone program. QuickZone will use the Hourly and Daily Demand Patterns as well as the Seasonality factors to generate accurate results for each day of the week. Most local traffic departments or state DOTs will have these numbers available just as they do the volume counts. However, generating these factors is straightforward. Below is an example of calculating the Daily Demand Factor (or K-Factor, see Section 4.3 Inbound Demand Pattern) using traffic volume data that was collected for four weeks in the month of August on Highway 24 (a hypothetical highway). Traffic counts were conducted on Highway 24 on the inbound direction for four weeks (28 days) during the month of August. In addition to Passenger Cars, the number of Trucks was counted as well. This data was used to calculate the Daily Demand Factor by dividing the August Average (32,648) by the daily average for each day of the week (Table 3-4). A truck K-Factor was also developed (Table 3-5). These factors would be entered as the Passenger Car and Truck K-Factors within the Inbound Demand Pattern Module. An identical calculation would be done for the QuickZone V 0.99 User Guide March 2001 Page 13 Outbound Demand Module as well. Finally, an Hourly K-Factor will need to be developed based upon hourly volume counts in similar fashion to the Daily K-Factors. Included in Appendix 2 is an example of volume count data this is regularly collected in the State of Wisconsin. The spreadsheet results are generated automatically by computers at traffic counting stations that have been installed alongside highways throughout the State of Wisconsin. This spreadsheet includes results for several months (March through August) from one traffic counting station. The results include explicit Hourly K-Factors for both directions of traffic, individual daily volumes for both directions of traffic and total daily volume counts. From this spreadsheet, Hourly K-Factors can be entered directly into QuickZone. In addition, Daily Demand K-Factors can be generated and entered into QuickZone. Table 3-3 Highway 24 Inbound Traffic Counts Day Date Passenger Cars Trucks Monday Tuesday Wednesday Thursday Friday Saturday Sunday Monday Tuesday Wednesday Thursday Friday Saturday Sunday Monday Tuesday Wednesday Thursday Friday Saturday Sunday Monday Tuesday Wednesday Thursday Friday Saturday Sunday 1-Aug 2-Aug 3-Aug 4-Aug 5-Aug 6-Aug 7-Aug 8-Aug 9-Aug 10-Aug 11-Aug 12-Aug 13-Aug 14-Aug 15-Aug 16-Aug 17-Aug 18-Aug 19-Aug 20-Aug 21-Aug 22-Aug 23-Aug 24-Aug 25-Aug 26-Aug 27-Aug 28-Aug 35,266 33,045 37,712 35,134 37,941 29,214 28,200 31,159 33,531 30,936 31,647 31,708 29,875 28,573 31,984 32,808 33,399 30,504 39,317 27,456 24,024 38,414 33,577 35,134 38,499 37,880 29,613 27,587 1,763 1,652 1,886 1,757 1,897 1,461 1,410 1,558 1,677 1,547 1,582 1,585 1,494 1,429 1,599 1,640 1,670 1,525 1,966 1,373 1,201 1,921 1,679 1,757 1,925 1,894 1,481 1,379 32,648 1,632 Average QuickZone V 0.99 User Guide March 2001 Table 3-4 Passenger Car K-Factor Day Daily Average Daily Demand K-Factor Monday 34,206 1.05 Tuesday 33,240 1.02 Wed 34,295 1.05 Thursday 33,946 1.04 Friday 36,711 1.12 Saturday 29,040 0.89 Sunday 27,096 0.83 Table 3-5 Truck K-Factor Day Daily Average Daily Demand K-Factor Weekday 1,724 1.06 Weekend 1,403 0.86 Page 14 4. USER INPUT MODULES The following section describes in detail how to enter a network as well as the steps needed to change and modify the QuickZone default values. A description of each User Input Module is given as well as a list of the data names, value(s) and a description in the following format: ! Data Name (units)—Description. Following the data descriptions is a QuickZone screen shot and instructions on how to enter in the required data or change the default values. User Input Modules are accessed from the QuickZone Main Screen under “Inputs” (Figure 2-2). The core of the QuickZone spreadsheet tool is the network that is described in terms of nodes, links and associated attributes. These attributes can be readily obtained from travel demand or traffic simulations models. However, a simple sketch network of nodes and links can be developed and entered into QuickZone. One such attribute, capacity, can be defined as Level of Service (LOS) “E” and can be estimated using methods outlined in the Highway Capacity Manual. 4.1. Nodes Module A node is required for the intersection of any two links or the ending/starting point in the network. The network can have a maximum of 100 nodes. Each node will consist of: ! Node Number (integer)—Integer value assigned to each X/Y coordinate pair. ! X/Y Coordinate (real value)—Integer or real values showing the location of each node in the network. The X/Y Coordinate is a scaling factor and does not need to have a unit value associated with it. Figure 4-1 Node Module Screen QuickZone V 0.99 User Guide March 2001 Page 15 The Node Module Screen (Figure 4-1) is accessed from the Input Data tab on the QuickZone Main Screen. Users enter the node coordinates into the columns “X” and “Y.” The unit value of the X/Y coordinate can be in miles or meters. QuickZone will scale the map as necessary when the network is viewed under the Network Controls and Output screens. 4.2. Links Module Links are a combination of two individual nodes. No two links may have the same origin node (A Node) and destination node (B Node). The network can have a maximum of 200 links. Please refer to Section 3 Network Design for more detailed information regarding designing a QuickZone network. Each link will consist of: ! Link Number (integer)—Integer value assigned to each unique A Node/B Node combination. ! A Node (Node Number)—Upstream node used to define the location and direction of an individual link. ! B Node (Node Number)—Downstream node used to define the location and direction of an individual link. ! Lanes (integer)—Number of full lanes used for travel in one direction. ! Capacity (vehicles per lane per hour)—Number of vehicles that can travel on one lane of the road for one hour. ! Length (miles)—Length of the link from A Node to B Node in miles. ! Free Flow Speed (miles per hour)—Speed at which vehicles travel on the link during Free Flow conditions ! Inbound or Outbound (I or O)—Indicates whether the direction of the link is Inbound or Outbound. An I or O designation is required on the Mainline links as well as any links entering or exiting the mainline. The I or O designation is used for the Conservation of Flow calculations. All links that do not have an I or O designation will default to an I and the Inbound Demand Pattern will be used. ! Jam Density (vehicles per mile per lane)—Number of standing vehicles that will fit on one lane of the road in one (1) mile length. ! Type (M, WZ, D1, D2 or R)—Links are defined as one of six types: Mainline, Workzone (WZ), Detour 1 (D1), Detour 2 (D2), Ramp (R) and blank (for links that are none of the five types). At minimum, a QuickZone network must include a Mainline, Workzone and Detour 1 designation. The Mainline cannot be the initial link on the network. Also, the WorkZone must be within two Mainline designations (see Figure 3-1). The Ramp designation is only used if Ramp Metering will used as one of the mitigation strategies. QuickZone V 0.99 User Guide March 2001 Page 16 Please refer to Section 3 Network Design for more detailed information regarding designing a QuickZone network. ! Position (0, 1, 2)—Defines whether the link is one-way (0) or a pair of links acting as a singular bi-directional link (1 and 2). The position attribute is used only for generating a visual representation of the network. It is not used within the QuickZone Algorithm. A "0" will place the link between the center of the two nodes. A "1" will place the link on top of or to the right of the nodes. A "2" will place the link on bottom of or to the left of the nodes. note: the 1 & 2 positions MUST be used in pairs. You cannot have a 1 without a 2 and vice-versa. ! Description (text)—Allows the user to add text descriptions to individual link. Figure 4-2 Link Module Screen (Knoxville Example) The Link Module Screen (Figure 4-2) is accessed from the Input Data tab on the QuickZone Main Screen. The user inputs all of the link information from the Links Module Screen. Each link consists of an A Node and B Node with all of the attributes listed above. Information can be entered directly into the yellow cells as needed. The Jam Density has a default value of 190 V/M/L. QuickZone V 0.99 User Guide March 2001 Page 17 4.3. Inbound Demand Pattern Inbound link travel demand volumes may be adjusted by up to seven different user-defined Inbound Demand Patterns for the Inbound direction based upon the Demand spread out over the entire 24-hour period. Two Truck Inbound Demand Patterns are also provided. A weekly default Inbound Demand Pattern is provided for each day of the week. ! Type of Graph (Normalized Daily %, Daily PC %, Daily Truck %, Daily PCE %)— Allows the user to visually see a graph of the Inbound Demand Pattern. Normalized Daily % includes all seven Inbound Demand Patterns but does not include the K-Value. Daily PC % includes all seven Inbound Demand Patterns as factored by the K-Value. Daily Truck % graphs both Truck Inbound Demand Patterns. Daily PCE % provides a graph of the seven Inbound Demand Patterns as well as the Truck Inbound Demand Pattern as a passenger car equivalent (PCE). ! Title (Text)—User defined title for the Inbound Demand Pattern. ! K-Val (Real Value)—Daily Demand Distribution Factor (Daily K-Factor) that is used on the Demand to increase or decrease each of the Inbound Demand Patterns. ! Hourly Demand Pattern (% of Vehicle Counts)—The percentage of Vehicle Counts (Hourly K-Factors) spread over a 24-hour period (the sum over the 24-hour period must equal 1). QuickZone requires a minimum of one Inbound Demand Pattern and has a maximum of seven Inbound Demand Patterns. Default values are from the Highway Capacity Manual (HCM) for Weekday. The Inbound Demand Pattern is needed primarily for the Mainline link. ! # PCE per truck (Integer)—Passenger car equivalent for each truck. ! Truck Demand Patterns—Same as the Inbound Demand Pattern only applied to the trucks. This is optional. QuickZone V 0.99 User Guide March 2001 Page 18 Figure 4-3 Inbound Demand Pattern Module Screen The Inbound Demand Pattern Module (Figure 4-3) is accessed from the Input Data tab on the QuickZone Main Screen. Seven default Inbound Demand Patterns are utilized in QuickZone. Each row represents one Inbound Demand Pattern. The user may choose to use the default Inbound Demand Patterns, change the default values within an individual Inbound Demand Pattern, or replace an existing Inbound Demand Pattern with one representing the specific location of application. To replace the demand for any of the seven default Inbound Demand Patterns, enter the new percentage directly into the appropriate cell. The Daily Demand Distribution Factor (Daily K-Factor) may be modified as well. Please note that if any of the Inbound Demand Patterns are exactly the same, only one line will show on the graph. 4.4. Outbound Demand Pattern Outbound link travel demand volumes may be adjusted by up to seven different user-defined Outbound Demand Patterns for the Outbound direction based upon the Demand spread out over the entire 24-hour period. Two Truck Outbound Demand Patterns are also provided. A weekly default Outbound Demand Pattern is provided for each day of the week. ! Type of Graph (Normalized Daily %, Daily PC %, Daily Truck %, Daily PCE %)— Allows the user to visually see a graph of the Outbound Demand Pattern. Normalized Daily % includes all seven Outbound Demand Patterns but does not include the K-Value. Daily PC % includes all seven Outbound Demand Patterns as factored by the K-Value. Daily Truck % graphs both Truck Outbound Demand Patterns. Daily PCE % provides a QuickZone V 0.99 User Guide March 2001 Page 19 graph of the seven Outbound Demand Patterns as well as the Truck Outbound Demand Pattern as a passenger car equivalent (PCE). ! Title (Text)—User defined title for the Outbound Demand Pattern. ! K-Val (Real Value)— Daily Demand Distribution Factor (Daily K-Factor) that is used on the Demand to increase or decrease each of the Outbound Demand Patterns. ! Hourly Demand Pattern (% of Vehicle Counts)—The percentage of Vehicle Counts (Hourly K-Factors) spread over a 24-hour period (the sum over the 24-hour period must equal 1. QuickZone requires a minimum of one Outbound Demand Pattern and has a maximum of seven Outbound Demand Patterns. Default values are from the Highway Capacity Manual (HCM) for Weekday. The Outbound Demand Pattern is needed primarily for the Mainline link; other links are optional. ! # PCE per truck (Integer)—Passenger car equivalent for each truck. ! Truck Demand Patterns—Same as the Outbound Demand Pattern only applied to the trucks. This is optional. Figure 4-4 Outbound Demand Pattern Module Screen The Outbound Demand Pattern Module (Figure 4-4) is accessed from the Input Data tab on the QuickZone Main Screen. Seven default Outbound Demand Patterns are utilized in QuickZone. Each row represents one Outbound Demand Pattern. The user may choose to use the default Outbound Demand Patterns, change the default values within an individual Outbound Demand QuickZone V 0.99 User Guide March 2001 Page 20 Pattern, or replace an existing Outbound Demand Pattern with one representing the specific location of application. To replace the demand for any of the seven default Outbound Demand Patterns, enter the new percentage directly into the appropriate cell The Daily Demand Distribution Factor (Daily K-Factor) may modified as well. Please note that if any of the Outbound Demand Patterns are exactly the same, only one line will show one the graph. 4.5. Demand Module For each link, the user specifies the average annual daily travel (AADT) in terms of vehicles. Using default time-of-day demand factors from the HCM or a user supplied profile, travel demand is distributed throughout the day in terms of vehicles per hour. To enhance the accuracy of the QuickZone spreadsheet tool, the HCM defaults should be replaced with specific State or MPO developed Demand Pattern and Seasonality Pattern data/factors. Seven separate Demands may be entered for each Inbound day of the week and each Outbound day of the week for a total of 14 unique Demands (this coincides with the Inbound and Outbound Demand Patterns available). Example data supplied by the Wisconsin Department of Transportation is included in the appendices. ! Link (Link Number)—Link number as defined in the Links input data requirements. ! AADT (volume count)—Average Annual Daily Traffic for a given link. Each link must have an AADT. AADT will be used by the AutoCaluclate to determine hourly counts based upon HCM methods. ! AutoCalculate (blank or X)—Indicates whether QuickZone should automatically calculate the hourly counts for the given link. If an X is placed in the cell and the AutoCalculate button is clicked, QuickZone will automatically calculate the hourly counts for the indicated links based upon HCM methods. This usually takes 3 to 5 minutes and needs to only be done once. ! Hourly Volume Counts (vehicles per day)—Number of vehicles travelling on a link during each hour of the day. The Hourly Volume Counts can either be entered in by hand or calculated automatically using QuickZone's AutoCalculate. note: each Link must have Hourly Volume Counts. Refer to the AutoCalulate above for more information. ! Base Year Annual demand Increase (percentage)—The percent increase in demand for each year from the base year of the data. Note that this increase represents change in demand from the base year of the AADT counts to the first year of the project. QuickZone V 0.99 User Guide March 2001 Page 21 Figure 4-5 Demand Module Screen The Demand Module Screen (Figure 4-5) is accessed from the QuickZone Main Screen. Each Link must correspond to the Link Number from the Link Module Screen. The AADT for each link may be entered directly into the yellow cells under the column labeled “AADT.” The default hourly volume counts (grey area in Figure 4-5) can either be entered by hand or automatically calculated (using the AutoCalculate feature) based upon methods used from the Highway Capacity Manual. Scrolling down the worksheet from column "C" accesses the seven Inbound Demands. Scolling across the columns provides access to the seven Outbound Demands. The Base Year Demand Increase can also be directly entered into the yellow cell in the upper right of the screen. 4.6. Seasonality Demand Pattern Module Link travel demand volumes may be adjusted by phase based upon the Seasonality Demand Pattern for each month in the year. Seasonal Pattern follows either a default pattern from the HCM (urban or inter-urban) or a user-defined pattern. ! Seasonality Pattern (Real Value)—The percentage (factor) of Vehicle Counts for each month. Default values are from the HCM. QuickZone V 0.99 User Guide March 2001 Page 22 Figure 4-6 Seasonality Pattern Module Screen The Seasonality Pattern Module is accessed from the QuickZone Main Screen. The user may choose to use the default values or change the values as needed. To change the values, enter the new values directly into the yellow cells that correspond to the month. 4.7. Project Information Module The Project Information Module is the where the user will be able to enter the data that defines how the work zone will reduce the capacity of the links in the network. The Project Information Module is divided into three elements: Project Description, Construction Phase Data and the Work Zone Plan Editor. Each element is described in detail later in this section. Figure 4-7 shows how all of the various screens are accessed within in QuickZone. QuickZone V 0.99 User Guide March 2001 Page 23 Project Information CONSTRUCTION PHASE 1 Work Zone Plan 1 Work Zone Plan 2 Work Zone Plan 3 Work Zone Plan 4 CONSTRUCTION PHASE 2 Work Zone Plan 1 Work Zone Plan 2 Work Zone Plan 3 Work Zone CONSTRUCTION PHASE 3 Plan 4 Work Zone Plan 1 Work Zone Plan 2 Work Zone Plan 3 Work Zone Plan 4 Figure 4-7 Project Information Module Flow Diagram The impact of various delay reduction strategies are coded by the analyst either as changes to link capacities or factors influencing the traveler response within the Work Zone Plan Editor. For example, the implementation of a variable message sign would encourage route diversion to signed alternative routes. Pre-trip traveler information provided over the internet would encourage travelers to consider trip retiming or trip cancellation. If information on alternative routes or modes were provided, travelers may be more likely to consider these responses as well. Changes to detour routes including lane widening, traffic signal control, etc., are all entered directly as increases to link capacities. In some cases the physical capacity is altered (e.g., widening or reversible lanes). In other cases the facility operation allows for an improvement in effective capacity (e.g., changes to signal control). These changes to capacity are user inputs, estimated outside the model using the HCM, detailed simulation modeling, or simply through engineering judgment and then entered by users into QuickZone. Changes to travel behavior resulting from work-zone related changes to mainline or alternative facility capacity are estimated internally by QuickZone. For example, a change in signal timing plans along a detour route to provide more effective capacity for detouring vehicles will engender a change in route choice depending on the amount of mainline delay that can be avoided. The user does not enter route diversion rates as a parameter, they are a result of QuickZone analysis. In some cases, like transit signal priority, changes in facility capacity are input along with factors that favor a particular traveler response. For the most dramatic management strategies (mainline closure and mainline conversion to HOV), a new set of traveler response factors are utilized. Even though these management strategies will reduce delay, the first order determinant of corridor delay is the project phasing data. If mainline capacity is reduced where (without QuickZone V 0.99 User Guide March 2001 Page 24 construction) recurrent delay is already present, then it is unlikely that steep reductions in delay can be obtained through any mitigation strategy. PROJECT INFORMATION Each QuickZone network must include Project Information data. The Project Information defines a set of global parameters that is later used within each Construction Phase. The Project Information consists of: ! Project Description (text)—Simple description of the work zone project. ! Project Start Date (moth/day/year)—Starting month, day and year of the project. note: QuickZone operates on a week schedule and if a project starts in the middle of a week, QuickZone will automatically start the project the previous Sunday. ! Adjusted Project Start Date and Duration (generated)—Start date and duration based upon the adjusted start date and the duration. ! Starting Year Demand Increase (%)—The Percent increase in demand based on the start year of the project. For project start in the same year this would 0%. ! Yearly Demand Increase (%)—The estimated percentage increase in demand for each year after the base year. ! Yearly Capacity Decrease (%)—Estimate of the percentage the road capacity reduction each year as a result of little or zero dollars being spent on maintenance activities. ! Project Duration (weeks)—Duration of the project in weeks. Project durations should be limited to 520 weeks (10 years). Figure 4-8 Project Information Screen QuickZone V 0.99 User Guide March 2001 Page 25 The Project Description Screen (Figure 4-8) is accessed from the QuickZone Main Screen. The Project Start Date is entered via a drop-down list and the Project Duration will always be stated in Weeks (QuickZone converts Years and Months to Weeks automatically). CONSTRUCTION PHASE DATA A Construction Phase is defined as an individual time segment (measured in weeks) of the Project Duration and describes a major capacity reducing activity. The user will define the Construction Phase Duration and QuickZone will automatically calculate the beginning week and ending week based upon the overall Project Duration (entered in the Project Information screen, Figure 4-8) and any other previous Construction Phases. The sum of all Construction Phase durations must equal the Project Duration. QuickZone will use the phase data to calculate delays on individual links of the Work Zone Impact Area. For example, Phase 1 may be the resurfacing of the Northbound lanes and Phase 2 is the resurfacing of the Southbound lanes. Phases are not allowed to overlap (in time) and must be sequential. Each Project must have at least one Construction Phase with a maximum of 15. In addition, each Construction Phase must include at least one Work Zone Plan. Each Construction Phase will consist of: ! Phase Description (text)—Simple description of the phase. ! Phase Duration (weeks)—Length of phase. Note: QuickZone will convert years and months to weeks. ! Infrastructure Cost ($ Millions)—Hard costs that include material, equipment, labor, and other costs not factored into the Delay Cost (see Life Cycle Costing section). Figure 4-9 Construction Phase Data Screen QuickZone V 0.99 User Guide March 2001 Page 26 The Construction Phase Data Screen (Figure 4-9) is accessed from the Project Information Screen (Figure 4-8). The user can enter information in the top portion of the screen. The bottom portion is a visual representation of the currently defined Work Zone Plans which includes the Starting Day & Time and the ending Day & Time. The Work Zone Plans are entered in the Work Zone Plan Editor by clicking on the "Work Zone Plan Editor" or one of the individual Work Zone Plan buttons. WORK ZONE PLAN EDITOR Work Zone Plans are a subset of the Construction Phase data and describe individual work tasks during the construction phase. Each Construction Phase must include at least one Work Zone Plan with a maximum of seven. Individual Work Zone Plan duration's must be consecutive and cannot overlap (Work Zone Plan 1 must end before Work Zone Plan 2 begins). Also, the Work Zone Plans must be in order where Work Zone Plan 2 cannot start on Tuesday if Work Zone Plan 1 ends on Wednesday. The Work Zone Plan essentially defines the capacity impact of a specific construction activity and how the traffic on individual links will react to the construction. Within each Work Zone Plan, a user can modify the demand, start/end day and time, links affected and define separate Mitigation Strategies to be used for each Work Zone Plan. Using the previous example, Phase 1, Resurfacing the Northbound lanes, may include the need to close the left, center and right lanes on weekends and evenings for resurfacing. Using the Work Zone Plans, Work Zone Plan 1 will be the closing of the left lane, Work Zone Plan 2 the center lane and Work Zone Plan 3 the right lane. A key element in the Work Zone Plan Editor is the Capacity Decrease which is the reduction in capacity on the specified link due to the construction activity or traffic control plan (i.e. reduced lane widths, lane restrictions, etc.). Work Zone Information Tab Figure 4-10 Work Zone Information Tab QuickZone V 0.99 User Guide March 2001 Page 27 ! Work Zone Plan Description (text)—Simple description of the Work Zone Plan. ! Work Zone Start Time (Sunday, Monday, Tuesday, Wednesday, Thursday, Friday, Saturday and 00:00 to 23:00)—Day of the week and the time when the Work Zone Plan will start. ! Work Zone End Time (Sunday, Monday, Tuesday, Wednesday, Thursday, Friday, Saturday and 00:00 to 23:00)—Day of the week and the time when the Work Zone Plan will end. Work Zone Links Tab Figure 4-11 Work Zone Links Tab ! Link Number Affected (Link)—Links that will be affected with current Work Zone Plan. note: Please see below for how to access and manipulate the Link Number Affected. ! Capacity Decrease (total vehicles)—Reduction in the total number of vehicles. ! Link Number List (Dropdown Selection)—Drop-Down menu to select either the Inbound or Outbound workzone. After selecting either Inbound or Outbound, the link numbers will show up in the Link Number Drop-Down menu. ! Link Number (Link)—The link to apply a Capacity Decrease to or Full Road Closure. ! Total Capacity Decrease (AADT)—Capacity amount to decrease the link by. ! Full Road Closure—The Full Road Closure option is designed to give users the flexibility to model a network where the entire work zone will need to be shut down for some reason. When the Full Closure button is used, two checks are made to ensure the full closure is setup is correctly in the network. The two checks are as follows: 1. Network Location Check—This check makes sure that there is a detour exiting the mainline at the point of closure and that there is a detour entering the mainline at the QuickZone V 0.99 User Guide March 2001 Page 28 end of the closure. This check is done to stop situations that would allow vehicles to get stuck in the network with no place to go. 2. Capacity Check—This makes sure that the capacity loss from the mainline can be handled by the detour route. The program checks to see if the total volume stopped during the closure is less then the total capacity of the detour for the entire week. If this error does occur, try increasing the travel behavior information for the Work Zone Information Tab or increase the capacity of the detour through mitigation strategies. To add a Link Affected by the Work Zone, select the Link Type from the Link Number List drop-down box. Next select an individual Link Number from the Link Number drop-down box. Enter the Capacity Decrease and click Add. Or, to apply the same capacity decrease to all links in the Link Type selected, click Add All. Mitigation Strategies Tab Figure 4-12 Mitigation Strategies Tab QuickZone includes the ability to implement up to six different traffic Mitigation Strategies. Route Re-Timing, VMS/HAR/Pre-Trip and Lane Widening can only be used for Detour Links. Ramp Metering, Media Campaign and Reversible Lanes can only be used on Mainline Links. The Mitigation Strategies available in QuickZone include: ! Route Re-Timing—This mitigation strategy includes the Link Number Affected and the percent increase in capacity as a result of signal re-timing. The user is able to specify the increase or decrease in link capacity through the Route Timing Screen (Figure 4-13). The Route Re-Timing Mitigation Strategy is only available for Detour Links. QuickZone V 0.99 User Guide March 2001 Page 29 Figure 4-13 Route Timing Screen ! VMS/HAR/Pre-Trip (toggle)—Indicates whether one of three Traveler Information mitigation strategy is utilized. The three traveler information services include Variable Message Signs (VMS), Highway Advisory Radio (HAR), Pre-Trip Traveler Information (Pre-Trip). The VMS/HAR mitigation strategy better utilizes the detour route by allowing the detour v/c ratio (which is normally 1) equal to the mainline v/c ratio. Without the Traveler Information Mitigation Strategy, the detour route is utilized up to 90% of capacity. With the Traveler Information Mitigation Strategy, the detour route is utilized at 100% capacity. VMS/HAR/Pre-Trip is only available for Detour Links. ! Lane Widening—Lane widening is similar to Route Re-Timing. The Lane Widening mitigation strategy includes the Link Number Affected and the percent increase in capacity due to Lane Widening. The user is able to specify the increase or decrease in link capacity through the Lane Widening Screen (Figure 4-14). Lane Widening is only available on the Detour Links. However, users can model lane widening on the Mainline links by increasing the capacity of the Mainline Links within the Links Module. Figure 4-14 Lane Widening Screen QuickZone V 0.99 User Guide March 2001 Page 30 ! Ramp Metering—Ramp Metering improves the capacity of the link it is feeding along the Mainline. The Ramp Metering mitigation strategy includes the Link Number Affected and the percent increase in capacity due to Ramp Metering. The user is able to specify the increase or decrease in link capacity through the Ramp Metering (Figure 4-15). Each link within the QuickZone network that uses Ramp Metering must terminate at a unique node. Ramp Metering is only available on the Mainline Links. Figure 4-15 Ramp Metering Screen ! Media Campaign—The Media Campaign evenly distributes those vehicles that time shift over the Work Zone time period. QuickZone will sum the total vehicles that will time shift (see Work Zone Plan Editor) and distribute those vehicles evenly over the entire Work Zone time period. Without the Media Campaign, QuickZone conducts a 50/50 split where half the vehicles will leave an hour earlier and half an hour later. Users can manipulate the effects of the Media Campaign to encourage mode shift or trip cancellation by making those Travel Behavior Inputs larger. Media Campaign is only available for the Mainline Links. ! Reversible Lane—Reversible Lanes will increase the Inbound direction by 1 lane and reduces the Outbound direction by 1 lane. Reversible Lanes applies only to the Mainline Links. QuickZone V 0.99 User Guide March 2001 Page 31 Travel Behavior Tab Figure 4-16 Travel Behavior Tab The Travel Behavior is separated into two separate categories: Start Demand and Excess Demand. The Start Demand will apply percent reductions to all vehicles regardless if they do or do not experience higher than baseline delay on the Mainline. The Excess Demand is applied only to those vehicles experiencing higher than baseline delay on the mainline link. ! Mode Shift Change (%)—Percentage of travelers who change mode during the project. ! Cancel Trip (%)—Percentage of travelers who cancel their trip during the project. ! Time Shift within One Hour (%)—Percentage of travelers that will not be on the affected links due to drivers choosing to change their departure time by up to an hour (applies only to Excess Demand). ! Endure the Mainline Traffic (%)—Percentage of travelers that will endure the mainline. note: This value is automatically calculated by QuickZone to insure that the sum of all four Travel Behavior Inputs equals 100%. This is accomplished by either clicking the "Normalize" button or automatically by going to another Work Zone Plan "<<<" or ">>>" or clicking on "Return to Phases". 4.8. Life Cycle Costing Module The Life Cycle Costing Module allows users to enter in cost data associated with the construction project. The data entered will be used to estimate delay costs that are a result of the construction project. ! Estimated Inflation Rate (%)—Estimate rate of inflation increase per year. Default is 6% ! Estimated Maintenance Cost ($ Thousands)—Maintenance cost for Work Zone project per year. QuickZone V 0.99 User Guide March 2001 Page 32 ! Estimated Delay Cost per Vehicle Hour ($ Dollars)—Estimated hourly cost for delay in dollars. Default $8.00 ! Estimated Life of improvement (years)—Approximated life of the improvement to be made. Figure 4-17 Life Cycle Costing Module Screen The Life Cycle Costing is accessed from the QuickZone Main Screen (Figure 2-2). All data can be modified as needed. QuickZone V 0.99 User Guide March 2001 Page 33 5. PROGRAM CONTROLS The Program Controls, found on the Main Screen (Figure 2-2) under the Program Controls tab, are used to run the QuickZone Program. There are four controls that are used: Generate Network, Calculate Phase Data, View Network and Clear Data. Each control, once the procedure associated with it has finished, will give a confirmation box indicating completion. The Network Control buttons do not show any results. In order to view the results of the QuickZone program, the user must utilize the Output buttons described in Section 6. ! Generate Network—Performs three actions: 1) Reads in the Node and Link data to create the visual network; 2) Sorts the links by flow order for the Inbound and Outbound Directions; and 3) Checks for Conservation of Flow only on the Mainline. If the conservation of flow calculation results in greater than 10% of the vehicles exiting or entering the mainline unaccounted for, QuickZone will give you an error and the user will have to re-examine the AADT for the links that were indicated in error. If the conservation of flow is greater than 10 vehicles and less than 10%, QuickZone will give you a warning indicating so. If the conservation of flow is less than 10% no error or warning will be given. Generate Network will need to be executed each time a new network is either created, imported or modified. ! Calculate Phase Data—Runs the QuickZone Delay Estimation Algorithm. After the algorithm has finished, the results and data are stored in various spreadsheets for use in the Outputs. This function needs to be performed after any input data is changed. ! View Network—Allows the user to view the network on the screen. Using the Excel Zoom functions, users can zoom in or zoom out of the visual network. The users can also identify individual links and nodes by selecting the link or node and viewing it's name in the Excel Name Box. However, the user must first unprotect the worksheet (Tools/Protection/Unprotect Worksheet…). ! Clear Data—This will clear all of the data from the QuickZone network. CAUTION— Be sure to either save a copy of the QuickZone network or export the data before clearing the network if you want to use the data and results at a later point. QuickZone V 0.99 User Guide March 2001 Page 34 6. OUTPUTS QuickZone provides four primary Outputs—Delay Graph, Travel Behavior Summary, LifeCycle Costing Graph and a Summary Table. The Outputs are accessed from the QuickZone Main Screen. In order to view the proper results, the QuickZone Program Controls must be performed each time data is changed in the network, demand or mitigation strategies. The following four sections describe each output. 6.1. Project Delay Summary The Project Delay Summary presents data in two chart types, the first comparing multiple construction phases and the other with just a single construction phase (Figure 6-1). The multiple phase selection will allow the user view up to six phases on one graph and make a visual assessment of the work zone delay. The single phase selection will present just one phase. Within each chart type, the user has two chart data options. The user has the option of which days to show on the graph. These options include: Whole Week, Sunday, Monday, Tuesday, Wednesday, Thursday, Friday, or Saturday. To select one or multiple days, click on the appropriate button. The cart data to be graphed can be automatically or manually chosen The first option, Choose Phase or Phases with the Highest Delay, will let the QuickZone program make the determination of which phases to view. The second option, Manually Choose Phase or Phases, allows the user to select which phase(s) to display. Figure 6-2 and Figure 6-3) are examples of the QuickZone Delay Graph output. This example selected the option Delay Graph Comparing up to Six Phase Totals for the Chart Type and Choose Phase or Phases with the Highest Delay as the Chart Data type. The Delay Graph has day and time (24-hour) as the X-axis and Delay Vehicle-Hour/Hour as the Y-axis. Figure 6-1 Delay Graph Option Screen QuickZone V 0.99 User Guide March 2001 Page 35 Figure 6-2 Weekly Delay Graph Figure 6-3 Daily Delay Graph QuickZone V 0.99 User Guide March 2001 Page 36 6.2. Travel Behavior Summary The Travel Behavior Graphing Selection Screen (Figure 6-4) presents a summary of the number of vehicles that choose one of the four travel behaviors determined for each phase: Cancel Trip, Mode Shift, Hour Time Shift and Takes Detours. The travel behavior summary is presented in either a bar graph (Figure 6-5) or as a pie graph (Figure 6-6). The bar graph allows the user to see the number of vehicles that modify their travel behavior on a hour-by-hour basis. The pie graph allows the user to see the percentage of vehicles throughout the entire day that modify their travel behavior. The user has the option of which days to show on the graph. These options include: Whole Week, Sunday, Monday, Tuesday, Wednesday, Thursday, Friday, or Saturday. To select one or multiple days, click on the appropriate button. The Travel Behavior Summary includes either one user-selected phase or all phases (selected via the Phase Number drop-down menu). Figure 6-4 Travel Behavior Graphing Selection Screen QuickZone V 0.99 User Guide March 2001 Page 37 Figure 6-5 Travel Behavior Summary Bar Graph Screen Figure 6-6 Travel Behavior Summary Pie Graph Screen QuickZone V 0.99 User Guide March 2001 Page 38 6.3. Life-Cycle Costing Graph The Life-Cycle Costing Graph (Figure 6-7) presents the user with a summary of the cost, both delay and infrastructure, for the project by year. A bar in the middle of the graph represents the costs associated with the project for each year. A summary of the total cost per year over a ten year period, including separate delay and infrastructure cost as well as a combined amount, is provided in a summary box at the bottom of the graph. Figure 6-7 Life-Cycle Delay Costs Output 6.4. Summary Table The Summary Table provides a convenient mechanism to view the more important input and output data of QuickZone. Two Summary Tables are provided that include data for all Construction Phases of the project and broken down further to each of the Work Zone Plans as defined in the Project Information Module. The Summary Table Screen (Figure 6-8) provides data on four key pieces of data relative to the construction project: Queue, Delay, Travel Behavior and Cost. The table includes the average, total, or maximum value for each Construction Phase (indicated with Italics and Bold font) as well as for the individual Work Zone Plans within each Construction Phase (indented underneath the Construction Phase). QuickZone V 0.99 User Guide March 2001 Page 39 Queue includes: ! Weekly Maximum (Miles)—Maximum queue experienced within each Work Zone Plan and within the Construction Phase. ! Weekly Total (Miles)—Sum of the queues for an average week within each Work Zone Plan. Also, the weekly average over all the days in the Construction Phase. Delay Includes: ! Weekly User Maximum (Vehicle Hours)—The maximum delay that occurred during each Work Zone Plan and within each Construction Phase. ! Weekly Average (Vehicle Hours)—The average weekly delay within each Work Zone Plan. Also, the average among all Construction Phases over the seven days of the week. ! Phase Total 1000 (Vehicle Hours)—Total delay for the duration of the Construction Phase. Phase Travel Behavior Includes: ! Take Detour (Vehicles)—The total number of vehicles, summed over each Work Zone Plan, that take the detour route. ! One-Hour Shifting (Vehicles)—The total number of vehicles, summed over Work Zone Plan within the construction phase, that take the delay their trip by up to one hour (This is defined in the Travel Behavior Inputs on the Work Zone Plan screen). ! Cancel Trip (Vehicles)—The total number of vehicles, summed over each Work Zone Plan within the construction phase, that cancel their trip due to the construction (This is defined in the Travel Behavior Inputs on the Work Zone Plan screen). ! Mode Shift (Vehicles)—The total number of vehicles, summed over Work Zone Plan within the Construction Phase, that change the mode of their trip due to the construction (This is defined in the Travel Behavior Inputs on the Work Zone Plan screen). Cost Includes: ! Infrastructure ($ millions)—Cost of infrastructure improvements for each Construction Phase. A total infrastructure cost is also provided among all Construction Phases. ! Delay ($ millions)—Total cost of delay due to the construction. A total delay cost is also provided among all Construction Phases. QuickZone V 0.99 User Guide March 2001 Page 40 Figure 6-8 Summary Table Screen The Input Data Summary Table (Figure 6-9) provides information on three key pieces of data relative to the construction project: General Data, Travel Behavior and Mitigation Strategies. The Input Data summary table allows the user to review the inputs used for the construction project without having to look through each input module. General Data Includes: ! Start Time (24-hour)—Time in which the Work Zone Plan begins. ! Ending Time (24-hour)—Time in which the Work Zone Plan stops. ! Day in Effect (S, M, T, W, Th, F, Sa)—Day of the week that the Work Zone Plan is in effect (Sunday, Monday, Tuesday, Wednesday, Thursday, Friday, Saturday respectively). ! Work Zone Links Affected (n/a)—The link number and change in capacity of all links for each Work Zone Plan within each Construction Phase. Travel Behavior Includes: ! Mode Shift (Percentage)—Percent of travelers that opt to change mode. ! Cancel Trip (Percentage)—Percent of travelers that cancel their trip. ! One-Hour Shifting (Percentage)—Percent of travelers that modify their trip either plus or minus one hours. ! Endure Mainline (Percentage)—Percent of travelers that will stay on the Mainline link irregardless of the length of delay due to construction. Mitigation Strategy Includes: ! Signal Retiming (n/a)—Detour number (as defined in the Work Zone Plan Editor) and the maximum percent increase in capacity of all links affected by the Signal Retiming. ! VMS (On/Off)—Indicates whether VMS is used as a mitigation strategy for each Work Zone Plan. QuickZone V 0.99 User Guide March 2001 Page 41 ! Lane Widening (On/Off)—Indicates whether Lane Widening is used as a mitigation strategy for each Work Zone Plan. ! Ramp Metering (On/Off)—Indicates whether Ramp Metering is used as a mitigation strategy for each Work Zone Plan. ! Media Campaign (On/Off)—Indicates whether Media Campaign is used as a mitigation strategy for each Work Zone Plan. ! Reversible Lanes (On/Off)—Indicates whether Reversible is used as a mitigation strategy for each Work Zone Plan. Figure 6-9 Input Data Table Screen QuickZone V 0.99 User Guide March 2001 Page 42 7. SAVING QUICKZONE DATA QuickZone has the ability to export and import all of the data associated with a QuickZone network. This functionality allows users to have multiple network data files available without having to save all of the QuickZone Excel VBA code. QuickZone will export all of the necessary data associated with QuickZone network which includes: ! Node Data—All of the data that was entered into the Node Module. ! Link Data—All of the data that was entered into the Link Module. ! Inbound Demand Pattern—All Inbound Demand Patterns. ! Outbound Demand Pattern—All Outbound Demand Patterns. ! Demand—Demand as entered in the Demand Module. ! Seasonality Demand Pattern—Seasonality Demand Patterns as entered in the Seasonality Demand Pattern Module. ! Project Information—Data includes Construction Phase data and Work Zone Plan data as entered in the Project Information Module. ! Life Cycle Cost Data—All of the data entered in the Life Cycle Costing Module. QuickZone exports this data as individual sheets to a new Excel Workbook. 7.1. Export Data The Export feature is accessed via the QuickZone Main Screen. Upon clicking "Export Data", Figure 7-1 will appear. The user will need to enter the location and a new document name for the data to be exported to. QuickZone defaults to C:\My Documents\data1.xls. Figure 7-1 Export Data Screen QuickZone V 0.99 User Guide March 2001 Page 43 7.2. Import Data The Import feature is accessed via the QuickZone Main Screen. Upon clicking "Import Data", Figure 7-2 will appear. The user will need to enter the location and workbook to be entered. Please note that importing a new QuickZone Network will clear the current network. Users should export the current network before importing new network. Upon importing a QuickZone network, the user will need to click the Generate Network on the Network Controls menu before viewing the networking or the outputs. Figure 7-2 Import Data Screen QuickZone V 0.99 User Guide March 2001 Page 44 8. SAMPLE NETWORK The sample network included with QuickZone V0.91 is of Knoxville, TN (Figure 8-1). This work zone is located just east of the junction of two of the nation's busiest truck routes: Interstate 40 and Interstate 75. The two interstate routes run concurrently through the heart of Knoxville, TN, carrying a total volume of more than 160,000 vehicles/day. The project described here involves the 1-40/75 interchange with Lovell Road, a major artery running north/south through west Knox County. The Tennessee Department of Transportation (TDOT) will completely reconstruct this interchange to meet the demands of the fastest growing sector in the urban area. The existing four-lane bridge with center turn lane will be replaced with a wider structure providing added turn lanes. Construction is scheduled in two stages, with half of the new bridge to be built and opened to traffic before the existing structure is demolished. All six lanes of 140/75 will be impacted by this work, with some periods where all six lanes are affected simultaneously, as outlined below. Figure 8-1 Knoxville Region Two of the approaches to this project - the segments of Lovell Road just north and south of the bridge - are part of a secondary work zone whose effects will overlap part of the interstate work. Knox County is widening Lovell Road, which is currently a four-lane facility. Improvements are nearly complete north of the bridge, but work will soon begin on the segment just south of the interchange where TDOT will be working. Queues are already common on the Lovell Road bridge and its approaches, due to the inadequately sized interchange, and will likely increase as interstate construction begins. With 1-40/75 traffic slowed due to the work zone, motorists may have greater difficulty merging and will probably back up on the ramps from Lovell Road during peak hours. Queues are also expected to form on 1-40/75 both east and west of the interchange. Extensive delays and complete blocking of traffic from the work zone can be expected on several occasions QuickZone V 0.99 User Guide March 2001 Page 45 when bridge beams must be brought in and installed, and when the existing structure is demolished. Rolling roadblocks were used by TDOT contractors on a similar bridge replacement project earlier this year in Knoxville. Delays of up to two hours were experienced by out-of-state travelers and truck drivers attempting to pass through the Knoxville urban area, as well as local motorists who rely on the route for cross-regional commutes to work. Parallel routes are limited. Because of the ridge and valley topography of East Tennessee, the Knoxville area has developed in a highly linear shape. The transportation network is dominated by a few heavily traveled east-west routes, including 1-40/75 and U.S. 70, locally known as Kingston Pike. There are very few north-south routes that link these east/west corridors. This makes it crucial to give motorists adequate warning if it becomes advisable to divert to one of the alternative east/west routes. For the Lovell Road/1-40/75 work zone, motorists could be diverted at the prior exit (Campbell Station Road for eastbound travel, Pellissippi Parkway/I-140 or Cedar Bluff Road for westbound travel). They would then follow U.S. 70 for a few miles, and return to the interstate at the next interchange. However, the U.S. 70 route is a heavily commercialized strip with signals spaced for an urban artery, inappropriate for truck diversions except in dire circumstances. 8.1. Developing the Knoxville, TN Network A sketch network of the Knoxville, TN was developed based upon the information gathered from a site visit and provided by the University of Tennessee and local MPO. The sketch network was developed in Microsoft PowerPoint (Figure 8-2). The network includes the mainline located along Interstates 40/75 and the work zone located at the intersection Lovell Road and Interstates 40/75. One detour route was identified as US 70 (Kingston Pike) for both the Inbound and Outbound direction. The interchanges were a mix of diamond and cloverleaf designs. Link and node information was gathered primarily through maps provided by the MPO. The MPO also provided AADT and seasonal demand characteristics. The network was developed and entered into QuickZone in approximately three hours. The results of the QuickZone program are shown in Figure 8-3. QuickZone V 0.99 User Guide March 2001 Page 46 Knoxville, TN QuickZone Network November 2000 North 12 140 18 Inbound 13 Harden Valley Road 9 11 14 19 21 ll ve Lo Cambell Station Interchange ad Ro 32 44 51 37 38 43 20 4075 23 17 16 50 49 35 30 34 31 15 39 42 22 52 41 40 7 29 26 28 33 48 24 8 10 Cedar Bluff Interchange 25 47 27 5 6 46 36 45 3 1 US 70 2 4 1 Node Work Zone Work Zone Detour 1 Inbound Detour 1 Outbound Link Figure 8-2 Knoxville, TN Network Figure 8-3 Knoxville, TN QuickZone Output QuickZone V 0.99 User Guide March 2001 Page 47 9. FREQUENTLY ASKED QUESTIONS AND TROUBLESHOOTING 1) When I start QuickZone, I get an error that states one of the following (or similar): After clicking "OK" the following screen appears: Figure 9-1 Reference File Dialog Box Answer: The underlying cause of this error is that the version of Microsoft Excel being used does not have the Microsoft Active X Control Component installed. In order for QuickZone to function properly the Microsoft Windows Common Controls 5.0 file within the Reference File Dialog Box (Figure 9-1) needs to point to the file c:\windows\system\comctl32.ocx. This is an easy error to fix as follows: 1) A file is included with the QuickZone V0.9 program called comctl32.ocx. Copy this file to the c:\windows\system directory. If the file already exists, do not copy over it. QuickZone V 0.99 User Guide March 2001 Page 48 2) Navigate to the Reference File Dialog Box (Figure 9-1) by opening the QuickZone program. Click on Begin QuickZone V0.9 to receive the error that will take you to the Reference File Dialog Box. Or, instead of clicking Begin QuickZone V0.9, on the Microsoft Excel Menu Bar click Tools→Macro→Visual Basic Editor. Once the Visual Basic Editor opened, on the Visual Basic Editor Menu Bar click Tools→References. 3) Under the Available References navigate to the reference "Microsoft Windows Common Controls 5.0". The location of the file should point to c:\windows\system\comctl32.ocx. If the reference points to a file other than the comctl32.ocx, you will need change the location of the reference by clicking Browse... and then selecting the comctl32.ocx file within the c:\windows\system directory. 4) Save the QuickZone program and exit. 5) The next time you use QuickZone it should function properly 2) When using QuickZone, why is it that nothing happens when I click on the buttons with my mouse or I cannot select the options that use a radio button control (such as the Delay Graph)? Answer: This is a difficult problem to identify and fix. On some computers it appears that the driver that controls the mouse is not fully compatible with Microsoft Excel. In other cases reinstalling Microsoft Excel or updating the mouse drivers fixed the problem. You may want to check with your computer manufacturer or mouse manufacturer. There is a work around to this problem. Using a combination of the mouse and keyboard or only the keyboard you can navigate through QuickZone and will function properly. The "Tab" key can be used to move from one button to another. The "Enter" key can be used as the mouse click. For example, to go to the Links Module, use the tab key so the Links Module button is highlighted and then hit enter. Also, for radio buttons, the space bar can used to select individual or multiple ones. 3) I tried to export my data, but it didn't work properly. What's going on? Answer: The Export feature copies the data on each individual spreadsheet from all eight Input Modules to a new Microsoft Excel Workbook. If you used the Filter capabilities of Microsoft Excel, you may have inadvertently left the data filters on thus hiding much of the data to be copied. Turn off the Filter capabilities and then export the data. QuickZone V 0.99 User Guide March 2001 Page 49 10. TECHNICAL SUPPORT, REPORTING BUGS & COMMENTS If you run into problems setting up the program or have other technical problems, call the Mitretek QuickZone Help Desk at 202-863-2978. The Help Desk is manned from 8:00 AM — 3:00 PM Eastern time on weekdays. If no answer, leave a message and someone from Mitretek will call you back during the Help Desk hours. Questions and comments can also be sent via email to [email protected]. If QuickZone crashes or reports clearly erroneous results, we’d like to know! Please send us bug reports via e-mail ([email protected]) with the following information: what you were trying to do when the error occurred, what menu or button caused the error, as well as any error message or error code generated by QuickZone. We will try and reproduce the bug and fix the problem. QuickZone V 0.99 User Guide March 2001 Page 50 APPENDIX 1— QUICKZONE DELAY ESTIMATION ALGORITHM (11 pages, dated 11/21/00) QuickZone Delay Estimation Algorithm Link Input File l ∈ L , the network of directed arcs: l: (a , b) link l defined as unidirectional arc from node a to node b fl facility type: mainline inbound/outbound (MI/MO), detour Inbound (DI/DO), other kl jam density (vehicles per km per lane) dl length (km) rl numb er of lanes c b (l, t ) before (no construction) capacity, (vehicles per hour) For each link c a ( l, t ) vb ( l, t ) after (with construction) capacity, (vehicles per hour) before (no construction) travel demand, (vehicles per hour) Work Zone Phasing Data T′ t0 Duration (in hours) when construction site is active. First time period in the 168-hour weekly clock that construction site is active. Mitigation Strategy Inputs z y VMS active indicator flag: 1 = Yes, 0 = No. Assume “No” unless activated by user. Publicity indicator flag: 1 = Yes, 0 = No. Assume “No” unless activated by user. Travel Behavior Inputs p1 p2 p3 p4 % of unsatisfied demand electing to change mode. (default = 10%) % of unsatisfied demand electing cancel trip until construction lifts. (default = 10%) % of unsatisfied demand leaving up to 1 hour earlier or later to avoid congestion. (default = 40%) % of unsatisfied demand making no change to trip timing p4 ≡ 1 − p1 − p2 − p3 Other Conventions SCS( n) designate the successor set of node n, that is, the set of links with node n as the a-node. Let ANODE( l) be a function that returns the a-node of a link and BNODE (l ) be a function that Let returns the b-node of a link. vb ( l, t ) v$b ( l, t ) v& b ( l, t ) v a (l, t ) v$ a (l , t ) v& a (l , t ) 11/21/00 base link demand constrained base link demand (constrained by upstream outflows) before case link outflow after case link demand constrained after case link demand (constrained by upstream outflows) after case link outflow Page 1 of 11 PROCEDURE A: Establish Constrained Demand, Delay for Baseline Conditions 1.0 Assemble the Mainline Inbound and Mainline Outbound links into two ordered sets: Create M i and M o , the ordered sets of mainline inbound and outbound links M i = {l 1 , l 2 ,Ll n −1 , l n } be the forward-ordered set of mainline inbound links. Let D 1 , D 2 be the two possible detours in the inbound direction with diversion points D D D D prior to l 1 and l 2 , respectively, and return points prior to ` l1 and ` l2 , respectively. Let 1.5 Check for conservation of flow (within 10%) along mainline nodes. l ∈M i , the ordered set of mainline inbound links. Let n ′ = BNODE (l ) . Let B n ′ be the set of links that terminate at n ′ . 1.51 Access the next link Let 1.52 A n ′ be the set of links that originate at n ′ . Let v b ( l) = Let x n′ = b l ′∈B n ′ b t ∑ v (l ′ ) − ∑ v (l ′ ) . l′∈ An ′ ∑ v ( l, t ) . b vb ( l) generate fatal error warning about conservation of flow at node n ′ . 10 vb ( l) If 0 < x n ′ < generate non-fatal warning about conservation of flow at node n ′ . 10 x n′ ≥ 1.53 If 1.54 Goto 1.51. l ∈M i , the ordered set of mainline links. Initialize Q (l,0) ≡ 0 . For each time period t ∈ T , the set of 168 weekly hours (1 AM Sunday to Midnight Saturday): 2.0 Access the next link b 2.1 Calculate travel demand on this link in the BEFORE case based on upstream outflows if l is the first link in the ordered set of mainline links then let v$b ( l, t ) = v b ( l, t ) + Q b ( l, t − 1) demand unconstrained by upstream outflows s l is not the first link the mainline set) Let l be the link just preceding l on the mainline list s s s with link outflow v& b l, t = min v$ b l, t , cb l, t . else (link [ ( ) ( )] ( ) Set constrained demand, s s v$b ( l, t ) = vb ( l, t ) − v b l, t + v& b l, t + Q b ( l, t − 1) ; ( ) ( ) 2.2 Calculate the number of cars in queue and delay in the BEFORE case Cars in Queue: 11/21/00 [ ] Q b (l, t ) = max v$ b (l, t ) − cb (l, t ) , 0 Page 2 of 11 2.3 IF l is the last link in the set of mainline links, advance to 2.3.1, ELSE return to 2.1 with r l = l , the next link the forward ordered set of mainline links. 2.3.1 Find maximum recurrent queue extent at each detour access point. l n , l n −1 ,Ll 2 , l1 be the reverse ordered set of Mainline Inbound links. n & b ( t ) = 0 , Q$ b ( t ) = 0 . Set l ′ = l , Q Let 2.3.1.1. Compute the standing queue on each link Qb (l ′ , t ) b & ( ) Q t = max − d ( l ′) + Q& b ( t ) ,0 k ( l ′) r ( l ′) D & b ( D1 , t ) = Q& b (t ) END IF IF l ′ = l 1 then set Q IF l ′ = l D2 then set Q& b ( D 2 , t ) = Q& b (t ) END IF Compute the total queue in the corridor: Q b ( t ) = Q b ( t ) + Q b ( l ′, t ) l ′ = l 1 then Goto s 2.4 Else Set l ′ = l , the next link on the reverse ordered set of links. 2.3.1.2 If Goto 2.3.1.1. 2.4 Set t = t + 1 , Set l = l1 . Goto 2.1. 3.0 Repeat Steps 1.5, 2 fo r links in the ordered set 11/21/00 Mo . Page 3 of 11 PROCEDURE B: Establish Constrained Volumes, Travel Behavior, and Delays in AFTER Case 0.1 Initialize 1.0 Let Q$ a ( l,0) ≡ 0 for all links. M i = {l 1 , l 2 ,Ll n −1 , l n } be the forward-ordered set of mainline inbound links. Let D 1 , D 2 be the two possible detours in the inbound direction with diversion points D D D D prior to l 1 and l 2 , respectively, and return points prior to ` l1 and ` l2 , respectively. 2.0 DETERMINE MAXIMUM EXPECTED QUEUES FROM WORKZONE For each time period t ∈ T , the set of 168 hours in the week from 1 AM Sunday to midnight Sunday. Establish what the maximum queue development from the work zone will be. Set t = 1 and the search toggle s = OFF . 2.0.1 IF s = OFF then a b IF c ( l, t ) = c ( l, t ) ∀ l ∈ M i then Set flows, queues and unmet demand equal to baseline values Set t = t + 1 Goto 2.0.1. ELSE ∀ l ∈M i sw = ON . t u = t , the time period where unmet demand first appears in this series END IF END IF 2.0.5 For each l ∈M i in forward order, we calculate travel demands and queues. Set l = l 1 . l is the first link in the ordered set of mainline links then let 2.1.1 v$a ( l, t ) = v b ( l, t ) + Q$ a ( l, t − 1) ELSE (link l is not the first link the mainline set) 2.1 IF 2.1.2 Determine change in upstream outflow with respect to base case, s l be the link just preceding l on the mainline list. Find: s s s v& a l, t = min v$ a l, t , ca l, t prior link outflow s s s ∆M ( t ) = v& a l, t − v b l, t . Change in prior link outflow Let ( ) 2.1.3 s ∆M ( t ) [ ( ) ( )] ( ) ( ) Set demand on the current mainline link, s v$ a (l, t ) = v b (l, t ) + ∆M (t ) + Q$ a (l, t − 1) ; END IF. 2.2 Calculate assigned mainline demand Calculate link queue, 11/21/00 va ( l, t ) = min[ v$ a ( l, t ) , ca ( l, t ) ] Q$ a ( l, t ) = v$a ( l, t ) − v a (l, t ) . Page 4 of 11 = l n (the last link in the set of mainline links) advance to 2.4.1, r ELSE return to 2.1 with l = l , the next link the forward ordered set of mainline links. 2.4 IF l 2.4.1 Find maximum recurrent queue extent at each detour access point. l n , l n −1 ,Ll 2 , l1 be the reverse ordered set of Mainline Inbound links. n & a (t ) = 0 , Q$ a (t ) = 0 , u a ( t ) = 0 . Set l ′ = l , Q Let 2.4.1.1. Compute the standing queue on each link Q$ a ( l ′, t ) a & Q (t ) = max − d (l ′ ) + Q& a (t ),0 k (l ′ )r (l ′ ) D & a ( D1 , t ) = Q& a (t ) END IF IF l ′ = l 1 then set Q IF l ′ = l D2 then set Q& a ( D2 , t ) = Q& a (t ) END IF Compute the total queue in the corridor Q$ a (t ) = Q$ a ( t ) + Q a (l ′ , t ) 2.4.1.2 If l ′ = l 1 then u a ( t ) = max Q$ a ( t ) − Qb (t ),0 [ Goto 2.5 Else 2.5 $ IF ( Q a Set IF ] s Set l ′ = l , the next link on the reverse ordered set of links. Goto 2.4.1.1. (t ) = Q b (t ) AND c a (l, t) = c b (l, t)∀l ∈M i ) then v t u = t , the time period where unmet demand dissipates, this series v$ a ( l, t ) = v$ b (l, t ) ∀l ∈M i Set s = OFF END IF END IF Set t = t + 1 . Goto 2.0.1. 11/21/00 Page 5 of 11 3.0 PEAK SPREADING For each time period t Set t = 1 , µ = 0 . 3.1 IF ∈ T , establish the impact of peak spreading on mainline travel demand u a ( t ) = 0 then Set t = t + 1 , Goto 3.1. ELSE IF y=1 IF v t < t u then a Set µ = µ + p3 u ( t ) ELSE µ w w w v v µtt′ = v w ∀ t ′ = t u − 2, t u − 1, t u ,L t u , t u + 1 tu − tu + 3 Set µ = 0 Set END IF ELSE µtt−1 = µtt+1 = p3 u a (t ) 2 END IF Set t = t + 1 , Goto 3.1. END IF 3.2 For each t = 1L T , let ∆µ( t ) = ∑ µtt ′ − p3 u a (t ) . t′ 11/21/00 Page 6 of 11 4.0 Recalculate flows and queues with post-spreading demand pattern. For each time period t ∈ T , the set of 168 hours in the week from 1 AM Sunday to midnight Sunday. Set t = 1 and search toggle s = OFF . 4.0.1 IF s = OFF then IF ∆µ( t ) = 0 then Set t = t + 1 Goto 4.0.1. ELSE s = ON . END IF END IF 4.0.5 For each l ∈M i in forward order, we calculate travel demands and queues. Set l = l 1 . l is the first link in the ordered set of mainline links then let 4.1.1 v$ a (l, t ) = v b (l, t ) + Q$ a (l, t − 1) + ∆µ( t ) ELSE (link l is not the first link the mainline set) 4.1 IF 4.1.2 Determine change in upstream outflow with respect to base case, (as in 2.1.2) Set demand on the current mainline link, (as in 2.1.3) 4.1.3 END IF. s ∆M ( t ) 4.2 Calculate assigned mainline demand and link queue (as in 2.2) 4.3 Allocate demand above capacity to mainline if BEFORE case oversaturated (as in 2.3) = l n (the last link in the set of mainline links) advance to 4.4.1, r ELSE return to 4.1 with l = l , the next link the forward ordered set of mainline links. 4.4 IF l 4.4.1 Find maximum recurrent queue extent at each detour access point. (as in 2.4.1) 4.4.1.1. Compute the standing queue on each link (as in 2.4.1.1) 4.4.1.2 If l ′ = l 1 then u a ( t ) = max Q$ a ( t ) − Qb (t ),0 [ Goto 4.5 Else 4.5 $ IF ( Q a ] s Set l ′ = l , the next link on the reverse ordered set of links. Goto 4.4.1.1. (t ) = Q b (t ) AND v$ a ( l, t ) = v$ b (l, t) ∀l ∈M i c a (l, t ) = c b (l, t )∀l ∈M i ) then Set s = OFF AND END IF Set t = t + 1 . Goto 4.0.1. 11/21/00 Page 7 of 11 5.0 DETOURS Set t = 1 . l D1 precedes or is identical to l D2 in M i . calculate diversion volumes. Set i = 1 and search toggle s = OFF . 5.05 For each detour in forward order, i.e., 5.1 IF ( z = 1) then Set k = 10 . . Set ∆Q& (D i , t ) = u a (t ) k ( l D )r ( l D ) ELSE u a ( t ) & a ( Di , t ) − Q& b ( Di , t ) . k = 0.9 . Set ∆Q& (D i , t ) = min , Q k (l D )r ( l D ) & (D i , t ) ≤ 0 then IF ∆Q Set 5.1a v (Di , t ) = 0 . If s = OFF then Goto 5.2. If s = ON then Goto 5.1.6. Set ELSE 5.1.1 5.1.2 Set s = ON . determine bottleneck link and diverted demand from mainline to detour arg min {c (l ′′, t ) − vb (l ′′, t )} l ′′ ∈ D i a &l = ( { bottleneck link on detour }) c( Di , t ) = k max c a (&l, t ) − vb (&l, t ) ,0 { v (D i , t ) = min ∆Q& ( Di , t ) k ( l D ) r ( l D ) , c D ( t ) 5.1.3 5.1.4 5.1.5 5.1.6 spare detour capacity } additional detour volume Assign detour volume along the links in the detour route Find l ′′ , the first ordered link in D i . v$ a (l ′′, t ) = vb (l′′, t ) + v( D i , t ) update detour link flow r IF l ′′ is not the last element of D i , Set l ′′ = l and Goto 5.1.4. Update all links on the mainline downstream of diversion point = 1 and l D1 = l D2 ) then Set i = 2 , u a ( t ) & & a ( D2 , t ) − Q& b ( Di , t ) − v (D1 , t ) . Set ∆Q (D 2 , t ) = min , Q k ( l D )r ( l D ) k (l D )r ( l D ) IF ( i Goto Step 5.1a. END IF Set l = l Di , v D = v(Di , t ) IF ( i = 2 and l D1 = l D2 ) then Set v D = v( D1 , t ) + v( D2 , t ) . END IF 11/21/00 Page 8 of 11 5.1.7 First Link Downstream of diversion point handling. v$ a (l, t ) = v b ( l, t ) + Q$ a (l , t − 1) + ∆µ( t ) − v D . Goto 5.1.9 Set 5.1.8 Other downstream links beyond diversion point handling. Set `vD = 0 IF IF l = ` l1 D then set `vD = v(D1 , t ) . l = ` l2 D then set `vD = v( D 2 , t ) . IF ( l = ` l1 D AND l = ` l2 D ) then set `vD = v( D1 , t ) + v( D2 , t ) . Determine change in upstream outflow with respect to base case, s l be the link just preceding l on the mainline list. Find: s s s v& a l, t = min v$ a l, t , ca l, t prior link outflow s s s ∆M ( t ) = v& a l, t − v b l, t . Change in prior link outflow Let s ∆M ( t ) [ ( ) ( )] ( ) ( ) ( ) s v$ a (l, t ) = v b (l, t ) + ∆M (t ) + Q$ a (l, t − 1) + `vD . 5.1.9 Calculate assigned mainline demand and link queue (as in 2.2) 5.1.10 Allocate demand above capacity to mainline if BEFORE case oversaturated (as in 2.3) 5.1.11 IF l 5.1.12 Find maximum recurrent queue extent at each detour access point. (as in 2.4.1) = l n (the last link in the set of mainline links) advance to 5.1.12, r ELSE return to 5.1.8 with l = l . 5.1.12.1. Compute the standing queue on each link (as in 2.4.1.1) 5.1.12.2 If l ′ = l 1 then u a ( t ) = max Q$ a ( t ) − Qb (t ),0 [ Goto 5.2 ] s Else Set l ′ = l , the next link on the reverse ordered set of links. Goto 5.1.12.1. 5.2 IF i = 1 , then set i = 2 , Goto 5.1. IF ( i = 2 and t < 168 ) then $ IF ( Q a (t ) = Q b (t ) AND v$ a ( l, t ) = v$ b (l, t) ∀l ∈M i c a (l, t ) = c b (l, t )∀l ∈M i ) then Set s = OFF AND END IF set i = 1 , t = t + 1 , Goto 5.1. END IF IF ( i = 2 and t = 168 ) then Goto 6.0. END IF 11/21/00 Page 9 of 11 6.0 MODE CHOICE/TRIP CANCELLATION For each time period t ∈ T , establish the impact of peak spreading on mainline travel demand Set t = 1 and search toggle s = OFF . 6.1 IF u a (t ) = 0 then Set ∆ρ(t ) = ρ1 (t ) = ρ2 ( t ) = 0 . If s = ON , Goto 6.4. If s = OFF , Goto 6.5. ELSE 6.2 s = ON . a Set ρ1 (t ) = p1 ( u ( t )) . Set Mainline trips that change mode p2 ( u (t ) ) . Set ρ2 ( t ) = a Cancelled mainline trips END IF 6.3 Let ∆ρ(t ) = ρ1 (t ) + ρ2 ( t ) . 6.4 For each l ∈M i in forward order, we calculate travel demands and queues. Set l = l 1 . 6.4.1 l is the first link in the ordered set of mainline links then let v$ a (l, t ) = v b (l, t ) + Q$ a (l, t − 1) + ∆µ(t ) − ∆ρ(t ) , Goto 6.4.3 ELSE (link l is not the first link the mainline set) Set `vD = 0 , v D = 0 , ∆v D = 0 IF 6.4.2 IF IF l = l D1 then set v D = v( D1 , t ) . l = l D2 then set v D = v( D2 , t ) . IF ( l IF IF = l D1 AND l = l D2 ) then set v D = v( D1 , t ) + v( D2 , t ) . l = ` l1 D then set `vD = v(D1 , t ) . l = ` l2 D then set `vD = v( D 2 , t ) . = ` l1 D AND l = ` l2 D ) then set `vD = v( D1 , t ) + v( D2 , t ) . Set ∆v D = `vD − v D . s Determine change in upstream outflow with respect to base case, ∆M ( t ) s Let l be the link just preceding l on the mainline list. Find: s s s v& a l, t = min v$ a l, t , ca l, t prior link outflow s s s ∆M ( t ) = v& a l, t − v b l, t . Change in prior link outflow IF ( l 6.4.3 ( ) [ ( ) ( )] ( ) ( ) s v$ a (l, t ) = v b (l, t ) + ∆M (t ) + Q$ a (l, t − 1) + ∆v D . END IF. 11/21/00 Page 10 of 11 6.4.4 Calculate assigned mainline demand and link queue (as in 2.2) 6.4.5 Allocate demand above capacity (as in 2.3) 6.4.6 IF l = l n (the last link in the set of mainline links) advance to 4.4.1, r ELSE return to 6.5.2 with l = l . 6.4.6.1 Find maximum recurrent queue extent. (as in 2.4.1) 6.5 Calculate aggregate mainline delay this time period: including recurrent delay: excluding recurrent delay: Let Q$ a (t ) + Q$ a (t − 1) 2 a u ( t ) + u a ( t − 1) ∆D(t ) = 2 D a ( t) = (vehicle-hours) (vehicle-hours) l * be the mainline link with the smallest capacity this time period. Calculate maximum user delay this time period: 6.6 including recurrent delay: Q$ a ( t ) D& a ( t ) = ca ( l * , t ) (hours) excluding recurrent delay: ∆D& a ( t ) = (hours) $ IF ( Q a u a ( t) ca ( l * , t ) (t ) = Q b (t ) AND v$ a ( l, t ) = v$ b (l, t) ∀l ∈M i c a (l, t ) = c b (l, t )∀l ∈M i ) then Set s = OFF AND END IF Set t = t + 1 , Set l = l1 . Goto 6.1. 7.0 Repeat Steps 1-6 for outbound mainline links. 11/21/00 Page 11 of 11 APPENDIX 2— WINSCONSIN DATA EXAMPLE Hourly Demand Factors Inbound ATR: I-39 - Endeavor; Class: Interstate-Recreation CPRP1: Cardinal direction proportion in hour 1, etc.; NCPRP(1): Noncardinal direction proportion in hour 1, etc. TVOLCX: Total volume in cardinal direction; TVOLNCX: Total volume in noncardinal direction; TVOL: Total Volume SITEIDMONTHDAYYEARCPRP1CPRP2CPRP3CPRP4CPRP5CPRP6CPRP7CPRP8CPRP9CPRP10CPRP11CPRP12CPRP13CPRP14CPRP15CPRP16CPRP17CPRP18CPRP19CPRP20CPRP21CPRP22CPRP23CPRP24 390105MAR SUN 1999 .010 .006 .005 .004 .004 .005 .012 .017 .028 .043 .063 .075 .076 .079 .083 .089 .090 .085 .070 .058 .041 .025 .020 .012 390105MAR MON 1999 .011 .007 .007 .007 .010 .019 .035 .055 .054 .058 .059 .065 .063 .063 .069 .080 .085 .075 .053 .037 .028 .024 .018 .016 390105MAR TUE 1999 .013 .008 .007 .009 .012 .016 .036 .054 .055 .053 .052 .056 .060 .061 .070 .083 .087 .078 .058 .038 .029 .028 .021 .019 390105MAR WED 1999 .013 .009 .006 .007 .010 .018 .033 .051 .054 .052 .055 .057 .059 .061 .067 .086 .087 .080 .057 .041 .030 .030 .021 .018 390105MAR THU 1999 .012 .008 .007 .007 .009 .016 .031 .048 .048 .048 .052 .050 .055 .065 .071 .081 .084 .082 .060 .045 .038 .036 .023 .022 390105MAR FRI 1999 .009 .005 .004 .005 .008 .012 .020 .031 .035 .037 .043 .048 .054 .065 .074 .085 .093 .096 .079 .067 .049 .037 .027 .019 390105MAR SAT 1999 .015 .009 .006 .005 .007 .010 .020 .041 .056 .069 .073 .074 .070 .065 .067 .070 .076 .069 .050 .042 .029 .031 .023 .021 390105APR SUN 1999 .011 .006 .004 .005 .004 .007 .012 .019 .034 .053 .068 .072 .062 .073 .079 .085 .092 .087 .078 .055 .042 .027 .014 .009 390105APR MON 1999 .009 .008 .006 .008 .012 .023 .039 .057 .060 .058 .058 .065 .064 .058 .065 .077 .084 .070 .056 .037 .028 .026 .019 .015 390105APR TUE 1999 .016 .007 .007 .009 .012 .016 .039 .051 .054 .051 .057 .060 .060 .062 .067 .082 .088 .077 .054 .040 .029 .026 .020 .016 390105APR WED 1999 .013 .007 .007 .009 .013 .018 .034 .054 .056 .053 .056 .056 .056 .056 .066 .080 .085 .084 .060 .040 .030 .030 .021 .017 390105APR THU 1999 .010 .007 .006 .007 .009 .015 .031 .044 .045 .049 .051 .053 .058 .061 .068 .079 .087 .084 .069 .053 .040 .034 .023 .017 390105APR FRI 1999 .007 .005 .004 .005 .007 .010 .021 .032 .036 .041 .049 .052 .056 .067 .076 .084 .089 .090 .086 .065 .047 .034 .023 .015 390105APR SAT 1999 .014 .008 .006 .007 .008 .011 .024 .039 .055 .070 .082 .080 .073 .071 .068 .069 .063 .060 .051 .042 .032 .028 .020 .017 390105MAY SUN 1999 .013 .008 .006 .004 .004 .007 .015 .027 .038 .059 .075 .078 .074 .068 .072 .072 .072 .073 .067 .056 .044 .034 .021 .014 390105MAY MON 1999 .010 .009 .006 .007 .007 .013 .026 .037 .042 .059 .071 .074 .067 .070 .076 .077 .076 .071 .057 .045 .033 .030 .021 .017 390105MAY WED 1999 .016 .012 .011 .010 .017 .021 .034 .047 .057 .054 .055 .051 .061 .056 .062 .078 .080 .073 .059 .039 .038 .031 .022 .017 390105MAY THU 1999 .016 .018 .018 .019 .020 .023 .030 .048 .043 .049 .048 .050 .050 .051 .057 .066 .066 .073 .059 .049 .043 .039 .034 .030 390105MAY FRI 1999 .009 .005 .005 .004 .005 .009 .019 .029 .036 .042 .047 .047 .048 .057 .067 .074 .080 .082 .087 .074 .060 .052 .039 .024 390105MAY SAT 1999 .018 .010 .009 .007 .010 .016 .032 .053 .067 .077 .084 .075 .069 .064 .063 .059 .060 .054 .048 .038 .030 .026 .018 .015 390105JUN SUN 1999 .012 .007 .005 .004 .003 .005 .011 .021 .035 .054 .072 .078 .080 .080 .079 .080 .076 .072 .070 .057 .041 .027 .019 .013 390105JUN MON 1999 .010 .007 .006 .008 .010 .021 .035 .046 .055 .063 .063 .067 .065 .068 .072 .075 .079 .066 .053 .039 .032 .025 .020 .015 390105JUN TUE 1999 .013 .008 .006 .007 .010 .019 .034 .050 .054 .058 .057 .060 .060 .063 .071 .077 .081 .075 .056 .042 .034 .027 .021 .016 390105JUN WED 1999 .012 .007 .006 .006 .009 .017 .034 .050 .052 .055 .058 .058 .061 .064 .067 .081 .081 .073 .057 .044 .037 .031 .024 .017 390105JUN THU 1999 .010 .007 .006 .006 .008 .016 .031 .045 .046 .054 .055 .054 .060 .061 .070 .075 .082 .072 .067 .053 .044 .037 .025 .017 390105JUN FRI 1999 .009 .005 .004 .004 .006 .011 .020 .029 .036 .043 .050 .053 .055 .066 .074 .081 .085 .088 .079 .069 .050 .038 .025 .017 390105JUN SAT 1999 .015 .008 .006 .006 .006 .014 .026 .045 .063 .081 .105 .091 .076 .069 .061 .058 .052 .047 .043 .038 .031 .024 .020 .017 390105JUL SUN 1999 .015 .011 .007 .004 .004 .006 .012 .023 .038 .057 .077 .089 .083 .078 .076 .072 .072 .069 .062 .050 .037 .026 .017 .014 390105JUL MON 1999 .010 .008 .007 .007 .008 .016 .026 .042 .048 .060 .069 .073 .071 .071 .071 .076 .075 .067 .056 .040 .036 .029 .019 .016 390105JUL TUE 1999 .012 .008 .006 .006 .010 .017 .033 .045 .053 .056 .062 .063 .064 .065 .068 .075 .079 .070 .058 .045 .038 .030 .022 .017 390105JUL WED 1999 .013 .007 .006 .005 .008 .016 .029 .041 .048 .058 .063 .063 .060 .065 .068 .078 .080 .073 .058 .046 .039 .034 .022 .017 390105JUL THU 1999 .010 .006 .004 .006 .007 .013 .024 .036 .043 .051 .058 .061 .060 .063 .068 .077 .079 .076 .067 .058 .049 .040 .026 .019 390105JUL FRI 1999 .008 .005 .004 .005 .005 .011 .020 .030 .037 .046 .053 .055 .061 .064 .071 .079 .080 .079 .076 .062 .059 .044 .027 .018 390105JUL SAT 1999 .015 .008 .007 .005 .007 .014 .029 .045 .067 .085 .101 .096 .084 .070 .063 .054 .050 .042 .039 .033 .029 .023 .017 .015 390105AUG SUN 1999 .012 .008 .005 .004 .003 .005 .011 .019 .031 .050 .068 .076 .077 .076 .079 .080 .080 .079 .068 .058 .044 .031 .020 .015 390105AUG MON 1999 .012 .009 .007 .007 .010 .019 .029 .044 .051 .058 .066 .067 .066 .069 .069 .073 .076 .073 .053 .039 .031 .027 .020 .024 390105AUG TUE 1999 .013 .008 .006 .007 .009 .014 .031 .043 .051 .057 .064 .066 .064 .064 .067 .077 .079 .075 .059 .043 .037 .030 .021 .016 390105AUG WED 1999 .012 .010 .007 .005 .007 .015 .028 .043 .052 .060 .061 .061 .062 .061 .065 .076 .082 .077 .061 .045 .037 .034 .022 .017 390105AUG THU 1999 .011 .007 .006 .006 .007 .012 .024 .035 .044 .052 .059 .058 .056 .061 .068 .073 .081 .081 .068 .058 .048 .039 .026 .018 390105AUG FRI 1999 .009 .005 .004 .005 .006 .009 .017 .027 .031 .042 .050 .053 .054 .062 .070 .078 .088 .088 .088 .072 .054 .042 .028 .018 390105AUG SAT 1999 .015 .009 .006 .005 .007 .010 .021 .038 .059 .080 .095 .093 .082 .072 .065 .058 .055 .052 .045 .038 .032 .027 .021 .016 Wisconsin Data Example Hourly Demand Factors Outbound ATR: I-39 - Endeavor; Class: Interstate-Recreation CPRP1: Cardinal direction proportion in hour 1, etc.; NCPRP(1): Noncardinal direction proportion in hour 1, etc. TVOLCX: Total volume in cardinal direction; TVOLNCX: Total volume in noncardinal direction; TVOL: Total Volume SITEIDMONTHDAYYEARNCPRP1NCPRP2NCPRP3NCPRP4NCPRP5NCPRP6NCPRP7NCPRP8NCPRP9NCPRP10NCPRP11NCPRP12NCPRP13NCPRP14NCPRP15NCPRP16NCPRP17NCPRP18NCPRP19NCPRP20NCPRP21NCPRP22NCPRP23NCPRP24 390105MAR SUN 1999 .004 .003 .002 .002 .003 .008 .010 .017 .029 .045 .059 .074 .087 .100 .099 .104 .095 .081 .060 .048 .031 .019 .012 .006 390105MAR MON 1999 .006 .006 .005 .007 .015 .043 .061 .064 .062 .066 .064 .064 .066 .067 .074 .065 .067 .058 .042 .029 .023 .021 .015 .010 390105MAR TUE 1999 .006 .005 .006 .009 .013 .038 .062 .067 .064 .060 .061 .058 .057 .065 .071 .071 .074 .061 .043 .030 .028 .022 .018 .010 390105MAR WED 1999 .007 .006 .006 .009 .013 .040 .059 .064 .061 .061 .056 .059 .055 .068 .070 .070 .076 .065 .046 .033 .029 .022 .016 .009 390105MAR THU 1999 .006 .007 .005 .008 .010 .034 .051 .061 .065 .067 .064 .058 .058 .066 .071 .067 .082 .066 .049 .032 .026 .021 .017 .008 390105MAR FRI 1999 .006 .004 .004 .006 .009 .027 .040 .047 .051 .055 .058 .061 .060 .072 .079 .078 .085 .080 .061 .041 .030 .020 .015 .009 390105MAR SAT 1999 .007 .005 .004 .006 .006 .018 .024 .040 .065 .082 .089 .085 .075 .075 .070 .073 .069 .056 .046 .034 .027 .020 .014 .009 390105APR SUN 1999 .004 .002 .002 .002 .003 .007 .012 .019 .032 .047 .059 .067 .069 .083 .096 .107 .103 .090 .071 .056 .032 .020 .011 .006 390105APR MON 1999 .006 .004 .007 .009 .020 .047 .063 .063 .061 .070 .068 .062 .060 .063 .067 .062 .065 .053 .043 .033 .025 .023 .016 .008 390105APR TUE 1999 .007 .005 .006 .010 .014 .041 .060 .066 .061 .061 .063 .061 .059 .064 .069 .071 .073 .059 .043 .031 .027 .022 .017 .010 390105APR WED 1999 .007 .005 .005 .008 .013 .040 .057 .064 .063 .061 .056 .056 .058 .063 .071 .066 .072 .061 .051 .036 .031 .026 .018 .011 390105APR THU 1999 .006 .005 .005 .008 .010 .036 .054 .058 .062 .065 .060 .061 .061 .064 .070 .072 .073 .067 .051 .036 .029 .023 .016 .009 390105APR FRI 1999 .006 .004 .004 .006 .010 .027 .038 .046 .051 .056 .059 .062 .065 .074 .080 .080 .079 .071 .062 .045 .032 .022 .013 .009 390105APR SAT 1999 .007 .005 .004 .004 .007 .019 .024 .045 .063 .079 .083 .079 .074 .074 .078 .076 .067 .054 .045 .038 .031 .020 .015 .009 390105MAY SUN 1999 .003 .003 .002 .002 .003 .006 .011 .017 .035 .050 .061 .071 .070 .075 .084 .088 .087 .082 .076 .061 .048 .034 .024 .008 390105MAY MON 1999 .006 .004 .004 .005 .010 .024 .033 .040 .047 .061 .070 .078 .080 .077 .078 .078 .074 .062 .054 .044 .031 .022 .013 .006 390105MAY WED 1999 .006 .006 .006 .009 .012 .033 .053 .058 .056 .060 .059 .057 .059 .072 .070 .073 .078 .059 .051 .035 .030 .025 .018 .014 390105MAY THU 1999 .008 .006 .005 .009 .011 .034 .050 .061 .058 .059 .061 .063 .070 .066 .067 .070 .075 .063 .050 .039 .026 .025 .016 .010 390105MAY FRI 1999 .006 .004 .003 .005 .010 .028 .037 .046 .049 .054 .057 .053 .058 .069 .072 .070 .081 .078 .066 .056 .040 .027 .018 .012 390105MAY SAT 1999 .007 .005 .005 .005 .007 .017 .024 .043 .059 .079 .085 .079 .073 .072 .069 .069 .064 .061 .047 .041 .035 .025 .019 .010 390105JUN SUN 1999 .005 .002 .002 .002 .003 .006 .011 .018 .032 .050 .066 .077 .080 .089 .090 .092 .087 .081 .069 .053 .040 .026 .013 .007 390105JUN MON 1999 .007 .005 .005 .007 .017 .040 .051 .054 .059 .069 .071 .067 .071 .072 .070 .064 .063 .055 .045 .036 .028 .023 .015 .008 390105JUN TUE 1999 .006 .005 .005 .007 .014 .035 .049 .055 .059 .067 .070 .068 .070 .073 .073 .070 .067 .057 .043 .035 .027 .023 .015 .009 390105JUN WED 1999 .006 .005 .005 .007 .012 .035 .050 .055 .058 .063 .065 .066 .065 .071 .078 .069 .070 .059 .044 .033 .029 .025 .017 .010 390105JUN THU 1999 .006 .004 .005 .006 .013 .034 .046 .053 .062 .071 .063 .065 .066 .074 .075 .068 .069 .058 .045 .035 .030 .025 .017 .010 390105JUN FRI 1999 .005 .004 .004 .004 .010 .024 .035 .039 .048 .056 .064 .063 .068 .076 .079 .077 .077 .069 .061 .047 .036 .025 .018 .010 390105JUN SAT 1999 .006 .005 .003 .004 .008 .015 .022 .038 .059 .079 .088 .089 .088 .083 .074 .065 .056 .049 .042 .038 .033 .025 .018 .011 390105JUL SUN 1999 .006 .004 .002 .002 .003 .006 .010 .018 .033 .047 .063 .073 .078 .084 .090 .090 .085 .075 .069 .056 .043 .029 .020 .013 390105JUL MON 1999 .008 .005 .005 .006 .012 .026 .034 .044 .050 .066 .077 .077 .075 .079 .077 .073 .068 .057 .046 .040 .032 .022 .015 .008 390105JUL TUE 1999 .006 .004 .005 .007 .013 .032 .044 .053 .059 .071 .073 .071 .071 .076 .075 .068 .067 .058 .043 .034 .027 .021 .015 .008 390105JUL WED 1999 .006 .005 .005 .006 .013 .031 .044 .048 .056 .068 .069 .069 .070 .077 .076 .069 .069 .057 .046 .034 .030 .025 .016 .009 390105JUL THU 1999 .006 .004 .005 .007 .012 .030 .039 .049 .056 .067 .065 .064 .069 .075 .078 .073 .071 .061 .049 .038 .032 .025 .017 .009 390105JUL FRI 1999 .004 .004 .004 .005 .010 .024 .031 .039 .048 .053 .062 .064 .070 .081 .082 .074 .072 .070 .062 .049 .037 .027 .018 .010 390105JUL SAT 1999 .006 .004 .004 .004 .007 .012 .017 .030 .053 .073 .093 .099 .095 .090 .079 .067 .057 .047 .042 .036 .032 .024 .017 .012 390105AUG SUN 1999 .005 .003 .002 .002 .002 .005 .008 .013 .027 .047 .063 .076 .081 .089 .094 .095 .090 .083 .071 .057 .042 .025 .013 .006 390105AUG MON 1999 .006 .005 .005 .006 .015 .033 .041 .046 .053 .064 .074 .073 .075 .077 .082 .073 .071 .056 .042 .032 .026 .020 .014 .008 390105AUG TUE 1999 .007 .005 .005 .007 .013 .033 .042 .051 .054 .065 .072 .068 .067 .077 .076 .071 .067 .059 .045 .036 .030 .024 .016 .009 390105AUG WED 1999 .007 .005 .004 .006 .012 .032 .044 .048 .059 .069 .074 .065 .069 .070 .072 .073 .071 .059 .047 .036 .030 .025 .015 .008 390105AUG THU 1999 .006 .005 .005 .006 .011 .030 .040 .045 .058 .069 .070 .072 .067 .073 .077 .068 .071 .061 .048 .038 .033 .024 .015 .009 390105AUG FRI 1999 .006 .005 .004 .005 .008 .022 .031 .039 .046 .057 .061 .068 .068 .077 .076 .080 .082 .067 .062 .048 .036 .026 .017 .010 390105AUG SAT 1999 .006 .004 .003 .004 .006 .012 .016 .028 .050 .076 .097 .098 .092 .095 .080 .070 .062 .051 .039 .033 .029 .024 .014 .009 Wisconsin Data Example Volume Counts ATR: I-39 - Endeavor; Class: Interstate-Recreation CPRP1: Cardinal direction proportion in hour 1, etc.; NCPRP(1): Noncardinal direction proportion in hour 1, etc. TVOLCX: Total volume in cardinal direction; TVOLNCX: Total volume in noncardinal direction; TVOL: Total Volu SITEIDMONTHDAYYEAR TVOLCXTVOLNCX TVOL 390105MAR SUN 1999 7044 8999 16043 390105MAR MON 1999 5561 6225 11786 390105MAR TUE 1999 5441 5558 10999 390105MAR WED 1999 5961 6003 11964 390105MAR THU 1999 6606 6587 13193 390105MAR FRI 1999 9860 8274 18134 390105MAR SAT 1999 7448 6675 14123 390105APR SUN 1999 7655 10791 18446 390105APR MON 1999 5945 6608 12553 390105APR TUE 1999 6016 6038 12054 390105APR WED 1999 6210 6175 12385 390105APR THU 1999 7644 6629 14273 390105APR FRI 1999 11571 8300 19870 390105APR SAT 1999 8036 7161 15197 390105MAY SUN 1999 7482 11338 18820 390105MAY MON 1999 6008 13681 19689 390105MAY WED 1999 6270 5936 12206 390105MAY THU 1999 7348 5985 13333 390105MAY FRI 1999 16765 8432 25197 390105MAY SAT 1999 10425 7444 17869 390105JUN SUN 1999 9500 14404 23904 390105JUN MON 1999 7892 8785 16677 390105JUN TUE 1999 7231 8261 15492 390105JUN WED 1999 7787 7597 15384 390105JUN THU 1999 9098 7893 16992 390105JUN FRI 1999 13885 9972 23857 390105JUN SAT 1999 11160 10080 21240 390105JUL SUN 1999 10025 14966 24992 390105JUL MON 1999 8028 12594 20622 390105JUL TUE 1999 7800 9307 17107 390105JUL WED 1999 8397 8339 16736 390105JUL THU 1999 11450 8550 20000 390105JUL FRI 1999 17225 10572 27797 390105JUL SAT 1999 13629 11484 25113 390105AUG SUN 1999 10109 16785 26894 390105AUG MON 1999 7862 9793 17655 390105AUG TUE 1999 7754 7998 15752 390105AUG WED 1999 8499 8467 16966 390105AUG THU 1999 10535 8999 19534 390105AUG FRI 1999 14638 10043 24681 390105AUG SAT 1999 11874 11471 23345 Wisconsin Data Example APPENDIX 3— QUICKZONE BETA V0.5 SAMPLE NETWORK Two sample networks are included with the QuickZone program: Simple Network and the Knoxville, TN example (default with Version 0.91). The data files are included which can be imported into QuickZone program. The Simple Network (QZsimplenetwork.xls) consists of 16 nodes and 31 links with a Mainline Inbound (MI), Mainline Outbound (MO), Detour Inbound 1 (DI1) and the Mainline Work Zone. Figure 1 Simple Network is a picture of the network. 7 11 8 9 6 3 2 1 14 4 5 13 12 10 16 15 Figure 1 Simple Network Sample Network Construction Information The proposed Construction Information for the sample network is the following: ! Construction Phase I—June 1, 2001 to September 1, 2001. There are two Work Zone Plans that consist of Weekdays 10 AM to 3 PM and Weekends 7 AM to 12:00 PM. The cost for Construction Phase I is $3.5 million and requires 40 hours per week in the roadway. ! Construction Phase II—September 1, 2001 to December 1, 2001. There are two Work Zone Plans that consist of Weekdays 1 Am to 7 AM and Weekends 6 AM to 3 PM. The cost for Construction Phase 2 is $2.7 million and requires 48 hours per week in the roadway. ! Note A—The night work premium is 20% and the weekend work premium is 25% (cummulative; day is 7 AM to 7 PM and night is 7 PM to 7 AM). ! Note B—There are not to be more than 20 minutes of additional construction delay to any traveler. Simple Network Questions The following questions were included as part the beta testing process for QuickZone Beta V 0.5 and can be used to help better understand the QuickZone program: 1. Which phases and work plans fail the performance criterion? 2. Can re-timing along the detour route (up to 20%) fix the problem? 3. Is there a feasible plan that does not increase costs? 4. What is the lowest cost you can find for a zero delay project plan? 5. Is it cost-effective to do Construction Phase 1—Weekday work as night work? Without changes to phasing or re-timing, how much demand reduction will have to be achieved to meet the performance criterion?