1
Describing Sample Data
13-5
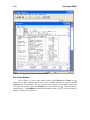
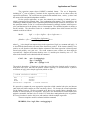
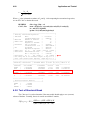
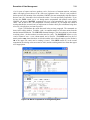
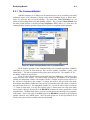
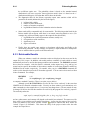
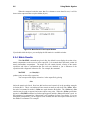
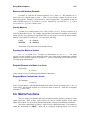
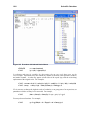
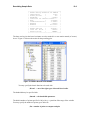
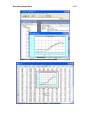
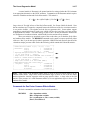
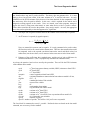
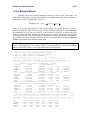
Figure 13.1 Histogram for a Continuous Variable
There are other ways to examine continuous data. One way is to use RECODE to change
your continuous variable into a discrete one. Alternatively, you may provide a set of interval limits
and request a count of the observations in the intervals you define. The command would be
HISTOGRAM ; Rhs = … ; Limits = l0,l1,…,lk $
where the limits you give are the left boundaries of the intervals. Thus, the number of limits you
provide gives the number of intervals. Intervals are defined as ‘greater than or equal to lower and
less than upper.’ For example, still using our income data,
HISTOGRAM ; Rhs = educ ; Limits = 0, .75, 2.5, 4, 6, 9, 12 $
defines five bins for the histogram, with the rightmost containing all values greater than or equal to
12. To request K equal length intervals in the range lower to upper, use
HISTOGRAM ; Rhs = variable ; Int = k ; Limits = lower,upper $
Finally, you can use HISTOGRAM to search for the interval limits instead of the frequency
counts. The command
HISTOGRAM ; Rhs = variable ; Bin = p $
where ‘p’ is a sample fraction (proportion), will obtain the interval boundaries such that each bin
contains the specified proportion of the observations.
NOTE: If the specified proportion does not lead to an even set of bins, then an extra, smaller bin is
created if the remaining proportion is more than p/2. For example, if p is .22, there will be four bins
with .22 and one at the right end with .12. But, if the extra mass is less than p/2, it is simply added
to the rightmost bin, as for p = .16, for which the sixth bin will contain .2 of the observations.