1
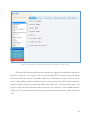
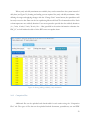
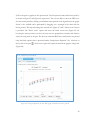
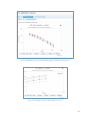
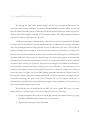
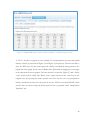
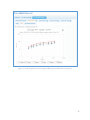
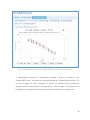
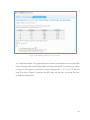
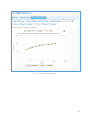
Figure 52. Updated IDF tables for future climate conditions – rainfall intensity in mm/h
2) “Plots”: the plots or graphs are also available for total precipitation (in mm) and rainfall
intensity (mm/h) as presented in Figure 53 and Figure 54, respectively. The user can hide or
show the IDF curve for each return period by clicking on individual return periods in the
legend below the graph. Zoom is also available and is performed by dragging out a rectangle
in the chart with the mouse pointer. The area selected is zoomed-in (Figure 47) and a “Reset
zoom” button will be visible. The “Reset zoom” option will revert the zoom level to the
original state. By hovering the mouse pointer over dots, the user can view precipitation,
intensity and duration values for each point on the plot. The dots are calculated IDF values
and the lines are plotted using the fitted equation that is presented under “Interpolation
Equations” tab.
46