1
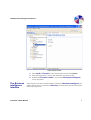
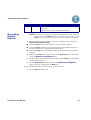
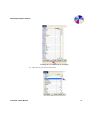
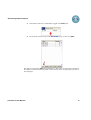
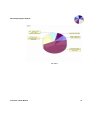
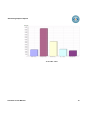
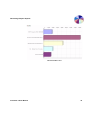
Generating Graphic Reports Number Name Description 8 Pie Chart The colorful, pie-shaped representation of your security and system data. Display also in a vertical and horizontal bar chat. Generating Graphic Reports NOTE: Visualizer works with a statistical file installed on your system. Therefore, all dates listed in the Date dimensions (the default opening setting) in the Data pane will be from when the first entries were made to your system. 1. Phrase the data you want to display in this form: (examples). This is known as a Business Intelligence query. Date according to user (a particular user’s entries covering all dates) Server according to function (a particular function’s entries broken down into a list of the different servers that performed that function) Result according to IP (an IP address listed by how many entries were allowed/ rejected) 2. Make sure the Filter pane is empty, then click the Dimension tab of the second part of the Business Intelligence query. 3. Find the specific data in the list and select it. Note that the Filter pane immediately displays this information. 4. Click the Dimension tab of the first part of the Business Intelligence query. Your query is displayed in the Data pane. The first example listed, date according to user, is shown this way. 1. Click the User Dimension tab. Visualizer 3 User Manual 10