1
Design and Implementation of a simulator
in support of WirelessHART-based control
systems development
Author: Kunjesh Shah
THESIS WORK 2009
SUBJECT: Embedded Systems (Electrical Engineering)
Postal Address:
Box 1026
Gjuterigatan 5
551 11 Jönköping
Telephone:
036-10 10 00
Design and Implementation of a simulator
in support of WirelessHART-based control
systems development
Author: Kunjesh Shah
This thesis work is performed at Jönköping Institute of Technology within the
subject area of Embedded Systems within Electrical Engineering.
The authors are responsible for the given opinions, conclusions and results.
Supervisor: Tiberiu Seceleanu (ABB)
Examiner: Professor Youzhi Xu (JTH)
Credit points: 30 points (D-level)
Date:
Archive number:
Postal Address:
Box 1026
Gjuterigatan 5
551 11 Jönköping
Telephone:
036-10 10 00
iv
Acknowledgement
Acknowledgement
Fist of all I would like to be deeply grateful to efforts of my supervisor in ABB,
Tiberiu Seceleanu- who always followed me with patience and new motivations. I
would like to express my deep gratefulness and lot of respect to my university
(Jönköping University, School of engineering) supervisor, Professor Youzhi Xu,
who followed me with his great vision during my entire master study and allowing me
to work with him in summer project as well as suggesting me to work for the ABB for
my master thesis. I would also like to express my thanks to my university program
coordinator, Alf Johansson, for giving his all kinds of support and vision during my
entire study. My special thanks to Mikael Gidlund (ABB) for his time, motivation
and new ideas and suggestions during my thesis work. I would also like to say my
thanks to my colleagues in ABB- Saad, Dejen, Sebastian and Laura for offering
their help to me with new ideas and also being great to me.
I would like to express my special thanks to entire ABB (corporate research) who
gave me opportunity to work in the amazing work environment.
I can not go ahead without saying my lot of thanks, love and respect to my parents,
Mayuriben B. Shah and Bhupendrakumar R.Shah, who have always motivated me
for my career and also bearing my entire expense till now since my birth, are the ideal
people of my life. I would also like to say my thanks from the bottom of my heart to
my child hood friend- Krishna Darji who has always motivated me for my
capabilities and inspiring me all the time to work hard to be great person in the world.
I would not forget to my sister- Jayna R. Shah and her entire family for giving me all
kinds of support during my master studies.
Last but not the least my big regards and thanks to entire Sweden for providing such
an amazing study environment to the international students.
v
Abstract
Abstract
In Industrial automated process plants, the wired communication system is being
replacing by the newly developed wireless communication system as it is easy to use,
scalable, simple, reliable, and provide more flexibility for installing and operating
process automation equipments. The WirelessHART network is becoming popular
for wireless communication system in industrial automation plant system. However
this network works on the TDMA bus arbitration technique. Each network device
needs to be scheduled by the user (network operator) to allow the communications
between the field devices and a gateway. Some companies like DUST have already
manufactured the device hardware to implement this wireless communication system
on industrial automation plant. A Simulator of this system is necessary to imitate the
system performance on computer using the computer programming to simulate the
result of each timeslot. Purpose of designing this simulator is to use the timeslots
more efficiently and to offer collision free communications between network devices.
It is may be time taking process to build the simulator in the beginning but at the end
it provides cost and time effective solutions.
This report describes how the simulator has been designed for the system at various
phases e.g. architecture, design, and implementation etc.
vi
Summary
Summary
Inom Industrial automatiserad process växter är trådbundna kommunikationssystem
som ersätts av den nyutvecklade trådlösa kommunikationssystem som det är lätt att
använda, skalbar, enkel, pålitlig och ger mer flexibilitet för installation och drift av
utrustning processautomation. Den WirelessHART protokollet har blivit populär för
trådlös kommunikation system inom industriell automation växt system. Men detta
protokoll fungerar på TDMA bussen skiljedom teknik. Varje nätverksenhet måste
planläggas av användaren (operatör) för att möjliggöra kommunikation mellan fältet
enheter och en gateway. Några företag som damm har redan tillverkat enheten
hårdvara för att genomföra detta trådlöst kommunikationssystem för industriell
automation anläggning. Simulator med detta system är nödvändigt för att imitera
systemets prestanda på datorn med hjälp av datorprogrammering att simulera
resultatet av varje timeslot. Syftet med utformningen av denna simulator är att
använda timeslots mer effektivt och erbjuda kollision fri kommunikation mellan
nätverksenheter. Det kan vara dags att processen att bygga simulatorn i början men i
slutet är av kostnaderna och tiden effektiva lösningar.
Denna rapport beskriver hur simulatorn har utformats för att systemet i olika faser,
t.ex. arkitektur, design och implementering etc.
vii
Key Words
Key Words
WirelessHART network
SuperFrame
Scheduling
Time slot
Sensor/Actuator
Gateway
Controller
Health Report
Dust Network
Simulator
viii
Definition
Definition
Timeslot
Fixed small portion of time of SuperFrame
Network devices
Sensors, actuators, and gateway are called here as network
devices
SuperFrame
Set of series of timeslot which keeps the link information
for each timeslot
Health Report
Contains the status of current scheduling method
containing error, warning messages if any.
Dependency input
Each control loop depends on inputs from certain sensors.
These sensors area called dependency input for the
belonged control loop.
Dependency output
Calculated control signal by each control loop has to be
sent to certain actuators. These actuators are called
dependency output for the belonged control loop
Link
The full communication specification between adjacent
nodes in the network,
i.e., the communication parameters necessary to move a
packet one hop.
ix
Table of Contents
Table of Contents
Acknowledgement .......................................................................... v 1 Introduction............................................................................... 1 1.1 1.2 1.3 1.4 BACKGROUND ................................................................................................................................ 1 PURPOSE AND AIMS ........................................................................................................................ 2 DELIMITS........................................................................................................................................ 3 OUTLINE ......................................................................................................................................... 4 2 Theoretical background ........................................................... 5 2.1 WIRELESSHART NETWORK........................................................................................................... 5 2.1.1 Key Features ........................................................................................................................ 5 2.1.1.1 Reliability: ...................................................................................................................... 6 2.1.1.2 Security ........................................................................................................................... 7 2.1.1.3 Power .............................................................................................................................. 7 2.1.2 Network Architecture .......................................................................................................... 7 2.1.3 Network Layer ................................................................................................................... 14 2.1.4 Application Layer .............................................................................................................. 15 2.2 INTRODUCTION TO TRUETIME SIMULATOR ................................................................................. 15 2.3 BASIC PRINCIPLE OF TRUETIME SIMULATION MODEL ................................................................. 15 3 Design and Implementation of a simulator ......................... 19 3.1 RESEARCH METHODOLOGY ......................................................................................................... 19 3.1.1 Choice of topic and delimitation of problem .................................................................... 20 3.1.2 Literature Search ............................................................................................................... 20 3.1.3 Plan the Writing ................................................................................................................ 20 3.1.4 Limit problem to specific questions .................................................................................. 20 3.1.5 Plan how to carry out investigation .................................................................................. 20 3.1.6 Plan data collection ........................................................................................................... 20 3.1.7 Carry out data collection .................................................................................................. 20 3.1.8 Describe/Interpret data ..................................................................................................... 21 3.1.9 Write the complete thesis report ....................................................................................... 21 3.1.10 Finishing touch ............................................................................................................. 21 3.2 ARCHITECTURE OF SCHEMATIC NETWORK DIAGRAM .................................................................. 21 3.3 DESIGN AND IMPLEMENTATION OF NETWORK DEVICES AND USER INTERFACE ........................... 24 3.3.1 Configuration of different Network Devices ..................................................................... 24 3.3.2 Simulink model of Network Design ................................................................................... 39 3.4 DESIGN AND IMPLEMENTATION OF USER INTERFACE ................................................................. 44 3.4.1 Algorithm to show Statistics of each timeslot for all SuperFrame on User Interface ..... 44 4 Testing and Results ................................................................. 49 4.1 TESTING ....................................................................................................................................... 49 4.2 RESULTS ....................................................................................................................................... 51 4.2.1 Study the scheduling plots ................................................................................................. 51 5 Conclusions and Future Work .............................................. 59 5.1 CONCLUSIONS AND LIMITATIONS ................................................................................................ 59 5.1.1 Conclusion and Analysis ................................................................................................... 59 5.1.2 Key Features of Simulator................................................................................................. 59 5.1.3 Answers to research questions .......................................................................................... 59 5.1.4 Limitations of the simulator .............................................................................................. 60 5.2 FUTURE WORK ............................................................................................................................. 61 x
Table of Contents
6 References ............................................................................... 63 7 Attachments ............................................................................ 65 xi
List of Figures
List of Figures
FIGURE 1: ELEMENTS OF THE TYPICAL WIRELESSHART INSTALLATION ............................................ 8 FIGURE 2: STRUCTURE OF THE DLPDU.................................................................................................. 10 FIGURE 3: ADDRESS SPECIFIER ............................................................................................................... 10 FIGURE 4: CONSTRUCTION OF THE 8 BYTE EUI-64 ADDRESS ............................................................... 11 FIGURE 5: DLPDU SPECIFIER ................................................................................................................. 11 FIGURE 6: DATA LINK TABLE RELATIONSHIPS ...................................................................................... 12 FIGURE 7: DATA LINK LAYER SUPERFRAME ......................................................................................... 13 FIGURE 8: TRUETIME LIBRARY OF SIMULINK BLOCKS ........................................................................ 16 FIGURE 9: RESEARCH PROCESS ............................................................................................................... 19 FIGURE 10: BASIC BLOCK DIAGRAM OF WIRELESS NETWORK SYSTEM ............................................ 21 FIGURE 11: ARCHITECTURE OF USER INTERFACE ................................................................................. 23 FIGURE 12: THE EXECUTION OF USER CODE IS MODELED BY A SEQUENCE OF SEGMENTS EXECUTED
IN ORDER BY THE KERNEL .............................................................................................................. 25 FIGURE 13: FLOW CHART TO INITIALIZE THE SENSOR NODE ............................................................... 26 FIGURE 14: FLOW CHART OF APERIODIC SENSOR TASK ....................................................................... 27 FIGURE 15: FLOW CHART TO INITIALIZE THE GATEWAY ..................................................................... 28 FIGURE 16: FLOW CHART OF EVENT DRIVEN TASK OF GATEWAY ........................................................ 30 FIGURE 17: FLOW CHART OF PERIODIC TASK OF GATEWAY ................................................................ 31 FIGURE 18: FLOW CHART TO INITIALIZE THE CONTROLLER ............................................................... 32 FIGURE 19: FLOW CHART OF PERIODIC TASK OF CONTROLLER .......................................................... 33 FIGURE 20: FLOW CHART TO INITIALIZE THE ACTUATOR .................................................................... 34 FIGURE 21: FLOW CHART OF EVENT DRIVEN TASK OF ACTUATOR ...................................................... 35 FIGURE 22: FLOW CHART- PROCESS PLANT WORKING INFORMATION................................................ 37 FIGURE 23: FLOW CHART OF ONE COMPLETE COMMUNICATION CYCLE............................................. 38 FIGURE 24: SCREEN SHOT OF SIMULINK MODEL OF WIRELESSHART BASED NETWORK SYSTEM .... 39 FIGURE 25: SCREEN SHOT OF INTERNAL DESIGN OF WNET BLOCK OF SIMULINK MODEL .................. 40 FIGURE 26: FUNCTION BLOCK PARAMETERS OF TRUETIME WIRELESS NETWORK BLOCK ............... 41 FIGURE 27: INTERNAL DESIGN OF PROCESS PLANT ............................................................................... 42 FIGURE 28: INTERNAL STRUCTURE OF SENSOR NODE OF SIMULINK MODEL ........................................ 43 FIGURE 29: FUNCTION BLOCK PARAMETER FOR SENSOR NODE ........................................................... 43 FIGURE 30: SCREEN SHOT OF USER INTERFACE LAY OUT ..................................................................... 46 FIGURE 31: SCREEN SHOT OF HEALTH REPORT WITH STATUS OF SCHEDULING ................................. 47 FIGURE 32: SCREEN SHOT OF USER INTERFACE FOR TABLE 3.............................................................. 52 FIGURE 33: SCREEN SHOT OF HEALTH REPORT FOR TABLE 3 .............................................................. 53 FIGURE 34: SCREEN SHOT OF SCHEDULING SIMULINK PLOT FOR TABLE 3 .......................................... 54 FIGURE 35: SCREEN SHOT OF USER INTERFACE FOR TABLE 4 .............................................................. 55 FIGURE 36: SCREEN SHOT OF HEALTH REPORT FOR TABLE 4 .............................................................. 55 FIGURE 37: SCREEN SHOT OF USER INTERFACE FOR TABLE 5 .............................................................. 56 FIGURE 38: SCREEN SHOT OF HEALTH REPORT FOR TABLE 5 ............................................................. 57 FIGURE 39: SCREEN SHOT OF SCHEDULING SIMULINK PLOT FOR TABLE 5 .......................................... 58 FIGURE 40: USER INTERFACE .................................................................................................................. 69 FIGURE 41: HEALTH REPORT WINDOW .................................................................................................. 70 FIGURE 42: SIMULINK MODEL OF NETWORK DESIGN ........................................................................... 71 xii
List of Tables
List of Tables
TABLE 1: THESIS OUTLINE ......................................................................................................................... 4
TABLE 2: SUMMARY TO INITIALIZE THE NETWORK DEVICES AND CONTROLLER ................................ 36
TABLE 3: TEST TABLE TO SHOW COLLISION .......................................................................................... 49
TABLE 4: TEST TABLE TO SHOW DEPENDENCY INPUT AND OUTPUT ERROR ......................................... 50
TABLE 5: TEST TABLE WITH RIGHT SCHEDULING METHOD .................................................................. 50
xiii
xiv
Introduction
1 Introduction
This thesis develops the software (simulator) which simulates the performance of the
WirelessHART based wireless communication system. WirelessHART is a newly
developed industrial standard network by the Hart Communication Foundation
(HCF), which is being currently replacing the existing HART network in the
industries. WirelessHART is becoming more popular because of its superior capacity
and high performance at low over all cost. This simulator evaluates the performance
of the physical system on each timeslot, based on the input arguments, on the
computer.
The TrueTime simulator provides the necessary base to develop this simulator.
The backbone of this system is a schematic diagram of the entire network which
includes all the network devices in the network, and is built using the Matlab simulink
and using the TrueTime simulator library. Each device in the network is supported by
the Matlab programming, which configures the performance of the each node.
The second important part of the system is a User interface, which allows user
defining size of the network and necessary input arguments for each device in the
network. The User interface is built in Matlab Guide.
1.1 Background
Thesis work has been carried out at ABB. Thesis work is the part of the EU projectService-Oriented Cross-Layer Infrastructure for Smart Embedded Devices
(SOCRADES), which is a European research and advanced development project. Its
primary objective is to develop a design, execution and management platform for next
generation industrial automation systems. SOCRADES plans to develop new
methodologies, technologies, and tools for modeling, design and implementation, and
operation of wired or wireless networked system. There are 15 companies/universities
of 6 different countries are involved in the project. The SOCRADES project integrates
two harmonizing technological approaches:
•
One that focuses on functionality of devices at the lowest level of embedded
device hierarchy, i.e. sensors, actuators, controller, gateway etc. Major
concerns at this level are to provide reliable, safe, secure and real time
communication between network devices.
•
One that adopts a service oriented perspective. Objectives in this framework
are to allow devices to directly communicate amongst themselves as well as
with applications, to aggregate devices into subsystems and to integrate
subsystems with enterprise-level applications.
Automatic control is a modern way of process and manufacturing industry.
Traditionally information flows between sensors, actuators and control units with hard
wired asynchronous communication. There has been a transition from communication
buses to field bus and Ethernet technologies, over the last decade for the control
system. Currently there is a major trend to replace the wired communication system
1
Introduction
with newly developed wireless communication system as it is more efficient and
offers low cost for installation and commissioning. The wireless communication
system is highly flexible and provides reliable and secure communication between
network devices.
HART communication foundation (HCF) offers the specification of wireless
communication network system which is known as WirelessHART. Most industries
are replacing their wired communication system with the WirelessHART based
wireless communication system. Major reason behind this is that there are already
more than 26 million HART devices exist in industries with more than 1000 different
devices and 220 different manufactures. WirelessHART is a backward compatible to
its HART devices, which reduces the installation cost of new devices and time to
implement the wireless system. Moreover, WirelessHART offers simple, reliable and
secure communication between the network devices.
WirelessHART uses TDMA and CSMA/CA bus arbitration technique for the
communication between the network devices. WirelessHART is build using std. IEEE
802.15.4. It is obvious to schedule the all network devices on TDMA time frame such
that there shall not have any collision of messages and also very efficient at the same
time. For the network operator who schedules the network devices, the most
challenging task is to assign time slots to each device in the network for 2-way
collision free communication as there can exist max 255 network devices in a
confined network. Any lost data can be hazardous in the industries specially treating
with the critical data. At the same time scheduling should be such that it uses
available time slots in most efficient manner to have maximum communication
between devices and low power consumption. So we need to find the way which
suggests the user with the best possible scheduling method between devices [12].
We planned to design a simulator which meets the above requirement, i.e. suggesting
user (network operator) with the best possible scheduling method. So in the report we
will see the methodologies to design and implement the simulator for the industrial
automation plant based wireless communication system.
1.2 Purpose and aims
Purpose of design and implementation of a simulator is to meet the communication
requirements of the network devices of the wireless communication system in the
most efficient manner for the mesh topology based network.
Before we move further we realized possible research questions to which we should
answer by developing tool for the simulator. The possible research questions created
are mentioned below:
•
•
•
•
•
How to control the timeslot allocation in WirelessHART network for each
network device?
How to configure the WirelessHART network devices in the simulator?
What kind of input arguments should be offered by user interface?
Design the algorithm to get the statistic of each timeslot.
How and what kind of result should be achieved?
The user requirements from the simulator are defined below:
2
Introduction
User Requirements:
1. Allow user defining the size of the network and the placement of each
network device on user defined location.
2. Calculate the best possible optimized scheduling automatically for the current
user arguments and present the result on User interface and on Simulink plot.
From the above user requirements, functional requirements can be generated as
follows:
Functional Requirements:
1. Show one way communication between the field devices and gateway with
single hop with one channel offset.
2. Show one way, multi hop communication between field devices and gateway
with one channel offset.
3. Show two way communications between field devices and gateway with all 15
channel offsets.
4. Allow user to choose size of the network and location of each field device.
5. Develop algorithm to find the best possible scheduling method based on user
defined size of the network and location of the network devices.
6. Provide automatically best possible scheduling method on user defined
arguments (e.g. size of the network and placement of each field device).
1.3 Delimits
As the design of the simulator is in the preliminary phase, thesis work has been
limited to some extent. From the above functional requirements, requirements from
the thesis work have been broken down and limited as follows:
1. Get the theoretical back ground of WirelessHART and hands on experience
with the programming on TrueTime simulator.
2. Make the simple single-hop communication between the field device (sensor)
and gateway and from gateway to field device (actuator) considering only one
channel offset
3. Make single-hop communication between more than one field devices
(sensors) and gateway and from gateway to field devices (actuators)
considering only one channel offset.
4. Design and implement the User interface, which adds flexibility to the
simulator design.
5. Design the User interface for the simulink model, which allows user to define
the size of the network (i.e. number of SuperFrames, sensors, actuators,
control loops) and to define the communication time slot for each device of
interested SuperFrame.
6. Show Table which gives the statistics of each time slot of each SuperFrame.
7. Show scheduling plot of simulink model with user defined inputs.
3
Introduction
1.4 Outline
Table 1: Thesis Outline
Chap No.
Key Words
2
Theoretical background, WirelessHART, Physical layer, Data
link layer, Network layer, Application layer, Key features,
Architecture, Reliability Security, Power, TDMA SuperFrame
3
Theoretical background, TrueTime tool box, Basic principle,
Network parameters
Design and Implementation, Schematic diagram, Flow chart,
User Interface
4
Test Tables, Results, Health
Conclusions and Future work
5
Conclusion and future work
6
List of references
7
Attachments
Report,
Scheduling
Plot,
Rest of the report is constructed as follows:
Chapter 2 provides the necessary theoretical back ground of WirelessHART network
system describing key features of it, advantages, and its architectural OSI layers.
Chapter 2 also provides the theoretical back ground of TrueTime simulator describing
basic principle and different network parameters defined by it.
Chapter 3 provides the main body of the thesis work, which tries to explain the design
and implementation of the simulator as per the functional requirements, and provides
the flow chart of each network device to initialize them. This chapter also includes the
schematic diagram of the entire network system and the detail algorithm of User
interface.
Chapter 4 includes the Test tables to test the implemented simulator and also includes
results. Chapter 5 includes conclusions and some suggested future work on designing
simulator as well as discussion regarding the design of User interface and schematic
diagram. Finally Chapter 6 includes the list of references which are used to carry out
the thesis work. Chapter 7 lists the attachments.
4
Theoretical background
2 Theoretical background
This chapter provides the theoretical back ground of WirelessHART network and
TrueTime simulator.
.
2.1 WirelessHART network
WirelessHART offers network specifications of wireless mesh network for industrial
automation process plant application.
HART Communication Foundation (HCF) has designed the specification of
WirelessHART network to provide the simple, reliable and secure wireless
communication between wireless devices for the automated process plant industries
after the existing HART network (which provides wired communication technique
between network devices). WirelessHART operates in the 2.4 GHZ ISM band at
physical layer and utilizes IEEE 802.15.4 standard compatible DSSS radios
modulation technique with channel hopping on a packet by packet and node by node
basis. WirelessHART is designed such that it is backward compatible to the existing
HART devices, which work on the wired communication system. WirelessHART
uses Time Division Multiple Access (TDMA) technology at the Data Link Layer to
arbitrate and co-ordinate communications between the network devices. TDMA Data
Link Layer specifies the Links by establishing time slots and channel offsets. These
links are arranged in SuperFrame which are assigned to each network devices and
repeated periodically in the same devices. Link can be dedicated (to assure the
delivering of data in guaranteed time slot with minimal latency) or shared which
allows elastic utilization of communication bandwidth using CSMA/CA technique
[1].
2.1.1
•
•
•
•
•
•
•
Key Features
IEEE STD 802.15.4 - compatible physical layer and MAC PDU.
Designed to satisfy the process automated industrial needs.
Allows one way (to transmit process or control values) and two way (to
accommodate ad-hoc-request/response) communications, and auto segmented
block transfer of large data sets.
Provides highly secure communication with AES-128 block ciphers and by
providing different verification keys i.e. join key, Session key and Network
key to all the network devices in the field.
WirelessHART network devices are exceedingly reliable, self healing,
redundant path mesh networking, simple and easy to install and operate.
Clear channel assessment, channel hopping to avoid interference, black listing,
time synchronized communication and adjustable transmit power is supported
to maximize the co-existence of WirelessHART network devices and other
ISM band equipments [1] [2].
Dedicated bandwidth and time slots are used to high priority and periodic
communication tasks while shared bandwidth is provided to event driven tasks
such as alarm system, ad-hoc request/response maintenance and network
health report or diagnostic report.
5
Theoretical background
•
•
•
•
•
Robust, high security by providing authentication to users and new joining
device in the network, industry approved standard data encryption technique
[2]. Highly accurate and robust which entails low risk probability.
Provides cost and time effective implementation for users as there is no more
need of complex wired system.
Wide variety of device types available by different manufacturers.
Specifically designed for process automation industries by considering
different industrial aspects. So network is fully interoperable with other
networks in industry and reliable.
User friendly as it supports fully mesh network by providing features like self
organizing and self healing [1].
Let us discuss the three main features of the WirelessHART one by one.
2.1.1.1 Reliability:
To accommodate with the reliable communication in plant environment against dense
infrastructure, the movement of large vehicles or equipment, changing conditions and
electromagnetic interference WirelessHART includes several features, which are
described below in brief:
Redundant mesh routing (space diversity)
Redundant routing is a must key in real world RF environment. Conditions change
often in industrial plants due to weather, obstacles in the communication path.
Redundant mesh routing re-routes the transmission if it founds the communication
path is interrupted to maintain the long-term, hands-off reliability and robustness in
the network [4-5].
Channel hopping (frequency diversity)
WirelessHART could have suffered from interference from several sources from other
networks, as in industry generally there exists more than one network which uses the
same 2.4 GHZ ISM band. WirelessHART avoids this problem by the means of
channel hopping which allows choosing dynamically any channel across the 16
channels defined by the IEEE standard 802.15.4. Channel hopping helps to overcome
from interference with alertness rather than brute force.
WirelessHART also offers clear-channel assessment and channel black listing to
avoid or minimize the interference at specific areas in the WirelessHART as well as in
other wireless networks [5].
Time synchronized communication (time diversity)
WirelessHART allocates pre-scheduled time window to each device in the network
for the device-to-device communication which offers reliable (collision free), power
efficient (by avoiding collisions and re-transmissions) and scalable communication,
promoting interoperability and ease of use. Defined priority to each message ensures
Quality of Service (QoS) delivery. Fixed time slots enable network manager to create
optimal network for any application by self configuration approach without any user
intervention.
6
Theoretical background
DSSS and adjustable power transmission help WirelessHART to provide reliable and
power efficient communication even in the presence of other wireless networks [5].
2.1.1.2
Security
WirelessHART offers highly secured network by applying the industrial standards of
security. These measures include:
•
•
•
•
•
Encryption: All the messages in the network are being encrypted by 128-bit
encryption key before they are sent to transmission medium.
Verification: Message Integrity Codes verify each packet.
Robust Operation: Channel hopping and mesh infrastructure alleviate effects
of jamming and rejection of service attacks.
Key management: WirelessHART provides different keys to each device in
the network e.g. network key, join key, session key to join and communicate
in the network. These keys are periodically rotating to prevent unauthorized
devices from joining the network.
Authentication: Devices can join the network only with the authorized
network ID and join key [5].
2.1.1.3 Power
WirelessHART offers adjustable transmission power feature to select the best power
option for their needs. Wireless devices offer greatest flexibility and lower installation
costs, but at the same time as being “truly wireless” energy usage becomes the
constraint to extend the battery life.
WirelessHART applies two features for device-to-device and device-to-user
communication to apply low power operation i.e. Smart Data Publishing and
Notification by Exception.
Smart Data Publishing
Smart Data Publishing technique enables transmission of message only when process
conditions change or the information is needed by the user’s application. This avoids
unnecessary message transmission and greatly improves the communication
requirement as well as power efficiency.
Notification by Exception
Device or process status changes automatically generate notification message to the
application [5].
2.1.2
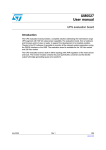
Network Architecture
Figure 1 shows the typical WirelessHART devices installation architecture
WirelessHART specifies three key elements in the wireless network field. They are as
following:
7
Theoretical background
Figure 1: Elements of the typical WirelessHART Installation
•
•
•
WirelessHART Field Devices (WFD) those are connected to the process plant
and reads process values from the plant periodically.
WirelessHART gateway that enables the communication between clients
(Host Applications) and WFDs in the WirelessHART network. Gateway
supports one or more access points which directly communicate with the
WFDs and the gateway.
WirelessHART network manager is responsible for the design (configuration)
of the network, scheduling (forecasting) communications between different
network devices, administration of the routing table, monitoring and reporting
the health status of the current WirelessHART network periodically. There can
not be more than one active network manager in the network. Network
manager may or may not be part of the gateway [1].
8
Theoretical background
WirelessHART network supports four OSI layers e.g. Physical layer, Data Link
Layer, Network Layer and Application Layer. They are as following:
2.1.2.1
Physical Layer
WirelessHART physical layer supports IEEE STD 802.15.4 with the maximum data
rate of 250 kbps. Operating frequency in WirelessHART is 2400-2483.5 MHZ and
applies Direct Sequence Spread Spectrum (DSSS) modulation technique on
information signal. Nominal transmission power is 10 dBM which is adjustable in
discrete steps. Maximum length of the payload data is 127 bytes [1].
WirelessHART uses radio frequencies to communicate with devices with maximum
range of 100 meters with 0 dB transmitting power. WirelessHART devices may be
either battery powered, line powered, solar powered or combination of them.
2.1.2.2
Data Link Layer
Data Link Layer (DLL) provides long (64 bit) and short (nick name-16 bit) addresses
to each devices in the network. Long address contains device type (3 byte), device ID
(2 byte) and HCF OUI (0x1B1E00). DLL uses TDMA bus arbitration technique that
provides guaranteed time slots to each device to communicate with desired devices.
Shared slots are allocated to have the elastic use of available bandwidth between
multiple devices to route the packets to the destination with low power consumption
and low latency. DLL maintains the one or more SuperFrame which is a frame of
sequence of time slots. Each time slot is 10 ms long which means 1s long SuperFrame
has 100 time slots. SuperFrame can be of different length, e.g. 1s, 2s, 4s, 8s, 16 s etc.
At a time only one SuperFrame can be active in a device [1].
DLL is responsible to provide highly secure, reliable and error free communication of
data between WirelessHART devices. DLL provides service to the upper network
layer.
Logical Link Control
In this section we will discuss the different fields of Data-link packet data unit
(DLPDU). Figure 2 shows the structure of the DLPDU.
• A single byte set to 0x41
• A 1-byte address specifier;
• The 1-byte Sequence Number;
• The 2 byte Network ID
• Destination and Source Addresses either of which can be 2 or 8-bytes
long;
• A 1-byte DLPDU specifier
• The DLL payload
• A 4-byte keyed Message Integrity Code (MIC), and
• A 2-byte ITU-T CRC16 [2].
9
Theoretical background
Figure 2: Structure of the DLPDU
Let us discuss each field one by one:
Sequence number
Sequence number is generally least significant byte of Absolute Slot Number (ASN).
Network ID
All the network should be identified using 2 –byte network ID. Received packet is
discarded by the device if the network ID of that device does not match with that
specified in DLPDU.
Destination and Source Address
WirelessHART supports 2 types of address to the network devices. One is 2 byte long
network ID called as ‘nicked name’ and the other is IEEE EUI-64 address which is 8
byte long. DLPDU contains 8 byte long source address if the bit 6 in address specifier
field is set and if bit 2 is set then DLPDU contains 8 byte long destination address.
Network manager assigns and manages the 2 byte nick name for each device. 2 byte
nick name indicates a specific network device or broadcast address (i.e., 0xFFFF). 3
byte of a EUI-64 address consists of a “Organizationally unique identifier”, which is
assigned by the IEEE. Out of remaining 5 bytes, 3 bytes are used as device ID and 2
bytes are indicating device type code. Device type code is allocated by the HCF.
1
0
0
1
0
0
Destination Address
1 = EUI-64 address
Source Address
1 = EUI-64 address
Figure 3: Address Specifier
10
Theoretical background
LSB
MSB
LSB
Device ID
MSB
0X1E
Expanded
Device Type
Code
0X1B
0X00
HCF OUI (0x001B1E)
Figure 4: Construction of the 8 byte EUI-64 Address
DLPDU specifier:
Priority
Packet type
11 Command
10 Process Data
01 Normal
00 Alarm
000 Acknowledgement
001 Advertise
001 Keep Alive
011 Disconnect
111 Data
Network Key
Figure 5: DLPDU Specifier
Figure 3 shows the address specifier field of DLPDU. While figure 4 shows the
construction of 64-bit long address of each WirelessHART field device. First three
bits in DLPDU specifier (in figure 5) are used to indicate the type of packet type (e.g.
ACK, Advertise, Keep Alive, Disconnect, and Data). Bit 3 is set to indicate the
communication is from the network device, which has been authenticated by the
confidential network key. Fourth and fifth bits are used to show the message priority.
Bit 6 and 7 are used for future use, which should be masked for current use [2].
DLL Payload
Size of the DLL payload depends on the DLPDU type. For example, ACK type
DLPDU contains the time adjustment information measured by the destination device,
while data type DLPDU contains the header and payload data for network layer.
Keyed Message Integrity Code
It is used to authenticate DLPDU by the destination device to make sure that DLPDU
has been originated from the authenticated network device.
Cyclic Redundancy Check
11
Theoretical background
All data frame contains the 16-bit CRC field which can be represented as shown
below in its polynomial form:
G16(x) = x16+x12+x5+1
All the receivers perform a CRC operation on received data to detect error. If device
fails CRC operation, source device is informed by the destination device about the
error in the received message.
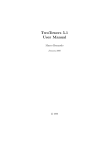
Communication tables and buffers
Figure 6, Shows the relationships of different data link tables. All devices maintain
data tables to control the communication by each device and collect the statistic of
each communication by the devices. Received packets are buffered, processed and
forwarded (if needed). Each network device maintains three kinds of tables as defined
below:
Graph
ID
Destination UniqueID
Destination nick name
Link
Superframe
ID
NumSlots
Active
ID
Link Option
Link Type
Slot Number
Channel Offset
Neighbor
UniqueID
Nickname
TimeSourceFlag
Status
TimeLastCommunicated
BackOffCounter
BackOffExponent
Statistics
Figure 6: Data Link Table relationships
SuperFrame and Link tables: there can be more than one SuperFrame in the
network defined by the network manager. Each device supports more than one
SuperFrame. At a time maximum one SuperFrame can be active for each device.
There can be multiple links supported by each SuperFrame to specify the
communication with desired device.
Neighbor table: each device maintains a list of devices with which it has direct
connection to communicate with it.
Graph table: all the devices maintain complete route information for all devices to
forward message successfully from the source device to destination device [2].
12
Theoretical background
Medium Access Control
Medium Access Control (MAC) is the data communication protocol and it is the sub
layer of the data link layer which is defined in the WirelessHART network
Architecture [8]. In WirelessHART sensor/actuator networks access of the shared
channels between sensors, gateway, and actuators are controlled by the MAC
protocol. MAC protocol uses TDMA and CSMA/CA bus arbitration technique for the
each network device to access the medium for data communication. Below we discuss
the Bus arbitration technique used by the WirelessHART MAC protocol.
WirelessHART TDMA
Unlike SuperFrame which is suggested by the IEEE standard 802.15.4,
WirelessHART has suggested its own style of SuperFrame. SuperFrame is nothing
but the collection of time slots repeated at constant rate. Each slot may have several
links associated with it. Slot sizes for the all the SuperFrame are fixed and
synchronized with each other. SuperFrame is repeated continuously after the
execution of all the time slots in it.
Figure 7 shows the structure of data link layer SuperFrame and characteristics of the
timeslot.
Figure 7: Data Link Layer SuperFrame
At least two devices are associated with the given time slot in unicast communication,
one at the source end and the other in the destination end. A designated destination
device remains in the listen mode from the start of dedicated time slot till certain
amount of time. If device does not listen to any message during that time, device goes
in sleep mode. If the device receives message successfully then it sends back positive
acknowledgement to the sender telling message is successfully received. If the device
receives message with some errors then receiver sends acknowledgement signal to the
sender telling that message was received with errors.
13
Theoretical background
Communicating devices are assigned to communication link for the communication.
Communication link can be formed by assigning SuperFrame, time slot, direction of
the communication (transmit / receive), link characteristic (dedicated / shared) and
channel offset. All the network devices should support multiple links. Number of
possible links for each device in the network is number of time slots in SuperFrame
multiply by number of channels (15). So if the device has SuperFrame with 100 time
slots then number of possible link for the same device is 100*15=1500 links.
Channel hopping allows having multiple links with different channel offsets in the
same time slot for different nodes. To use the channel hopping feature, all the devices
in the network should have one common list which provides the list of channel offsets
currently in use [2].
CSMA/CA
CSMA/CA (Carrier Sense Multiple Access with Collision Avoidance) protocol uses
random delay to reduce the probability of collision. Three variables are being used in
this protocol, e.g. NB, CW, and BE. NB counts the number of backoffs, CW indicates
the size of the current congestion window, and BE is the backoff exponent. When any
node has data to transmit, these variables are initialized for the particular node as
NB=0, CW=2, and BE=macMinBE, respectively. Device waits for the r = [0,2BE-1]
backoff period and listens the channel (Clear Channel Assessment (CCA)). If the
channel is idle, the device decrements CW, waits till the next backoff period and
senses the channel again. If the channel is still idle, device has won the contention and
devices starts transmitting data. If either of the CCA operation fails to find the channel
idle, the numbers of backoffs NB and the backoff exponent BE is incremented and
CW is set to 2. If the device reaches to maximum number of backoffs, device drops
the packet and declares a failure in finding the medium. All the above steps are
repeated on each transmission [13].
2.1.3 Network Layer
WirelessHART allows full wireless mesh network in which all the devices are able to
source, sink and route packets on behalf of other network devices. The network layer
also provides upstream and downstream redundant path packet routing with high
reliability and managed latency from the source to the destination. Dynamic
bandwidth allocation to field devices based on the communication requirements is the
key feature of WirelessHART network. Each device in a network can support one or
more SuperFrame which defines the schedule of individual device to communicate
with the other network devices. All devices in a network listens for new and
disconnected or dropped devices in the network and reports about statistics to their
parent network device [1].
WirelessHART network layer has defined two kinds of routing:
Graph: The graph routing techniques offer flexible communication path between the
source and destination devices. Generally device keeps the complete picture of
network system and other devices allocation in the network. Redundant paths are
possible from source to destination. Communication path between source and
destination is decided on the conditions of network.
14
Theoretical background
Source: The source route offers the static single communication path between each
source and destination device. Source route is defined generally in the packet itself.
There is a high probability of packet loss with this route if the network traffic is high
in the defined route for the packet [7].
How the new device joins the network:
All devices who wish to join the network are provided with the network ID and the
join key. Join key works as a password for the particular network device. New devices
are provided with the network ID and join key by the network operator which is a
manual process.
Devices then begin listening to the network traffic and adjust its local clock to
synchronize with other network devices. Once the joining device receives advertise
packet from its neighbor, joining device sends its network ID and join key to the
parent device. Parent device sends this information to the network manager for further
credential. Once the device is authenticated by the network manager it is provided
with two more keys i.e. network key and session key. After the joining device is
credited, network manager proceeds to integrate the device in to the network by
providing it SuperFrame and link for further communication [7].
2.1.4 Application Layer
WirelessHART uses command based standard data types and procedures. This layer
provides standard device specific status for all process variables. Deals with Smart
publishing of process data periodically and provides smart alarm system on crossing
user defined threshold [1].
2.2 Introduction to TrueTime Simulator
TrueTime is a Matlab / Simulink-based simulator for real-time control systems, which
facilitates co-simulation of controller task execution, network transmission and
continuous plant dynamics. This is accomplished by models of real time kernels and
networks as a simulink blocks. It is written in C++ MEX language, uses event based
simulation and external interrupts.
TrueTime is a small library of simulation blocks which enhance usability of Matlab /
Simulink library to simulate discrete network process model. User code in the form of
tasks and interrupt handlers is modeled by MATLAB or C-code which also enables to
call simulink block diagrams [6].
2.3 Basic principle of TrueTime simulation model
To simulate the network model with TrueTime toolbox we should include at least
three vital parts of TrueTime toolbox: 1) TrueTime kernel, which allows initializing
each node in the network with the number of I/O, acquiring network data and
processing on acquired data. TrueTime kernel is a wit of every device as it realizes a
control algorithm for each device in the network. This control algorithm can be
realized in M-file of Matlab. There can be more than one task (periodic, nonperiodic) in a kernel and several M-files which can cooperate desired target. 2)
TrueTime network, which defines the network model (e.g. 802.11 b/g, WLAN,
15
Theoretical background
802.15.4 ZigBee or WirelessHART etc.) and its parameters which can be changed. 3)
Controlled process [3].
Figure 8: TrueTime Library of Simulink Blocks
TrueTime Network (or TrueTime Wireless Network) block simulates message
transfer in a confined network. When device needs to transfer a message in a network,
a ‘transfer started’ signal is send to the appropriate input channel of the network
block. After the signal being sent, actual data can be transferred through the network
and ‘transfer finished’ signal is sent to the output channel of network block when the
transfer of message is finished. Transferred messages are stored in a buffer of a device
until acknowledgement or timeout (whichever comes first) occurs. A general message
contains information about sender and receiver, actual message data, length of
message and message priority (optional). Generally long messages are split in to the
packets and transferred packet by packet basis through network. Message
transmission delay is ignored in a confined network as being very small. TrueTime
wireless network also allows to choose x, y and z input to denote the true location of
the nodes [6].
Figure 8 shows the TrueTime Library of Simulink Blocks.
The subsequent network parameters are common to all network models:
Network type determines the MAC protocol to be used. There exists three kind of
MAC protocol e.g. 802.11 b/g (WLAN), 802.15.4 (Zigbee) and WirelessHART.
Network number the number of the network block. Default network number is ‘1’
and networks must be numbered from 1 and upwards as there can be more than one
16
Theoretical background
network in the field. Wired and wireless networks can not share the same network
number.
Number of nodes defines the number of network devices in one network, which
determine the size of the Snd, Rcv and Schedule input and outputs of the block.
Data rate (bits/s) the speed of the network.
Minimum frame size (bits) determines the minimum length of the message or frame.
Frame which is shorter than this size will be padded.
Pre-processing delay (s) the time by which a message is delayed by the network
interface on the sending end.
Post-processing delay (s) the time by which a message is delayed by network
interface to receiving end.
Transmit power determines the strength of the radio signal of transmitting message,
which defines the maximum range of it.
Receiver signal threshold medium is accounted busy if the received energy is above
this threshold.
ACK timeout the time for which sending node will wait for ACK signal from the
receiver before concluding that packet has been lost and retransmission of message is
required.
Error coding threshold determines number in the interval [0, 1] which defines the
percentage of block errors which the code can handle.
Path loss exponent is modeled as 1/da where d is the distance in meters and
environment variable which is generally between 2 and 4 [6].
17
18
Design and Implementation of a simulator
3 Design and Implementation of a
simulator
This chapter describes the how the actual work is being carried out by describing all
the phase of work e.g. architecture, design and implementation, Testing, conclusion
and future work.
Before we start our actual implementation we have put some constraints in our
system. We are assuming that we have currently star topology in the network and
currently there is only one active channel. This means all the wireless field devices are
only one hop away from the gateway device.
3.1 Research Methodology
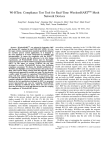
The finishing touch…
Write the complete Thesis Report
Describe/interpret data
Carry out data collection
Plan data collection
Plan how to carry out the investigation
Limit problem to specific questions
Plan the writing
Literature search
Choice of topic and delimitation of problem
Figure 9: Research Process
Research methodology used during the thesis work was same as suggested by Nyberg,
2000. Research process can be seen below:
19
Design and Implementation of a simulator
3.1.1 Choice of topic and delimitation of problem
Before selecting the thesis topic, it was necessary to find out the interesting and
challenging area for the thesis work. Topic chosen for the thesis work was falling
under wireless sensor network field which was of-course challenging in general and
interesting personally, as I have already worked in the same area for 4 months in year
2008. Research area was restricted to design and implementation of Simulator for
WirelessHART based wireless communication system.
3.1.2 Literature Search
Literature search was mainly not the big part here as the literatures were mainly
known.
We followed the WirelessHART specification documents (developed by HCF), User
manual from Dust Networks and User manual of the TrueTime Simulator. These all
the documents were used to gain the enough theoretical back-ground for our work.
3.1.3 Plan the Writing
As the work was mainly dependent on the iterative process and results, we plan to
write the report after finishing the entire work. Purpose of writing the report at the end
was just to write final most efficient design methods for the simulator.
3.1.4 Limit problem to specific questions
Task was to design and implement the Simulator in general. Purpose of the simulator
was limited to provide the way to handle the time slot of each SuperFrame to be used
in most efficient way with highly reliable communication between network devices,
for all available 15 channels in the network. Originally created requirements from the
simulator can be seen in section 1.3 (functional requirements). These requirements
were further broken down as shown in section 1.4.
3.1.5 Plan how to carry out investigation
Our research plan was mainly based on iterative process. We planned to carry out the
investigations in logical and analytical way. Simulator was aimed to be most users
friendly.
3.1.6 Plan data collection
Primary data collections were planned through observations only. Error and warning
messages were planned to be most visible. At the same time timeslot allocation for
each interdependent device were also planned to be visible in some manner.
Secondary data collection was done through literature review.
3.1.7 Carry out data collection
Data were collected through observations only. Observation was made on the data
from the uitable, status from the health report and scheduling plot from Matlab
simulink model. Observation on uitable and on Health report window was made to see
if there any error or warning messages. Observation on scheduling plot was made to
see if there is any overlap between the two device’s execution time, and also to see if
any packet loss message on the Matlab command prompt during the compilation of
current network performance for the given scheduling method.
20
Design and Implementation of a simulator
3.1.8 Describe/Interpret data
Data can be seen on four different screens. 1) uitable cell data on User Interface, 2)
Health report screen, 3) scheduling plot, and 4) Matlab command prompt.
Data collected on the User Interface shows which device has reserved which timeslot.
Moreover device IDs which can be seen in the same colors indicates interdependent
devices. Health Report screen shows the status of current scheduling method with
error and/or warning or success messages. Each error can be seen in detail in this
screen. Moreover each error type has been shown in different colors so the debugging
of error messages becomes easy. Warning messages has been shown only when any
network device is not schedule for the communication.
Scheduling plot can be seen after running the simulink network model. Scheduling
plot provides communication time of all the devices with their execution time, which
gives more clear idea to make scheduling method more efficient and reliable. At the
same time we can also check the message on Matlab command prompt if there is any
packet loss at some devices and communication range for the given transmission
power.
3.1.9 Write the complete thesis report
After designing and implementation of the simulator finished we start writing the
thesis report. Structure of the thesis report can be seen in section 1.5.
3.1.10 Finishing touch
Thesis report has been modified and re-corrected after the feedback from the
supervisor.
3.2 Architecture of schematic network diagram
Sensor Node
Gateway
Device
2)
3)
Controller
4)
1)
5)
Process
Plant
Actuator
6)
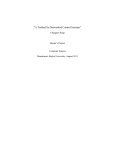
Figure 10: Basic Block Diagram of Wireless Network System
Figure 10 shows the basic block diagram for modeling the simulink block for
WirelessHART simulator. Sensor Node reads the process variable value which needs
to be controlled from the process plant and then transmits to the gateway device.
Gateway device receives the data from the sensor node and then writes this value to
21
Design and Implementation of a simulator
the controller to compute the control signal required to perform control operation in
the process plant. Controller calculates the value of the control signal and writes this
value to the gateway device. Gateway reads this value from the controller and then
transmits to the actuator. Actuator receives the control signal value form the gateway
device and writes it to the process plant. Process plant performs control operation
based on received control signal value. Then this process repeats over and over.
Period and priority for the each task can be defined during the initialization of each
device.
Note: 1) WirelessHART has suggested maximum of 255 wireless field devices in a
network. 2) Numbers in Figure 10 indicates sequence of communication link
generated between network devices in one complete communication cycle.
Before we simulate the performance of the network, we should be able to provide user
inputs to the network through user interface. Below figure 11 shows the brief flow
chart of user interface which needs to be designed.
Architecture of the User Interface was carried out after the long discussion. After
reading the specification documents from the HCF about WirelessHART and DUST
user manual we analyze the different user inputs and outputs for our simulator system
which can be seen in the flowchart below.
22
Design and Implementation of a simulator
Start
Allow user Definining the number of
SuperFrame and length of each
SuperFrame in the network
Allow user Definining the number of
sensors, actuators and control loops in
the network.
Allow user Definining the dependency
input and output for each control loop
Allow user assigning time slot for each
sensor, actuator and control loop in user
defined SuperFrame
Show status and details of all the time
slots of all SuperFrame, in the table
Show health report describing errors,
warnings or success of scheduling
End
Figure 11: Architecture of User Interface
In above Figure 11 first process block allows the user defining number of
SuperFrames and length of each SuperFrame in the network. All the SuperFrames are
of different length. Second process block allows the user defining number of sensors,
actuators in the network and number of control loops in the controller. Third process
block allows user defining dependency input (sensor id) and dependency output
(actuator id) for each control loop. Dependency input is the sensor data from any
sensor device for which control signal needs to be calculated. Dependency output is
the wireless device to which calculated control signal needs to be transmitted. Fourth
process block allows user scheduling each device in the network by assigning time
slot on the appropriate SuperFrame. Fifth process block allows user having status and
23
Design and Implementation of a simulator
details of each time slot of all the SuperFrames, on the table. Sixth process block
allows user having the scheduling information e.g. successful or errors and/or
warnings.
3.3 Design and implementation of network devices and
user interface
To start with the design and implementation, it is necessary to get use to of
programming in TrueTime simulator as we will build our simulator using the platform
provided by it. TrueTime simulator is open source and can be downloading from the
source website (http://www.control.lth.se/truetime/). The TrueTime simulator is more
efficient, easy to work with, capable of simulating complex network system and real
time control parameters. [6] Can be studied to learn –how to write executable code,
how to configure kernel and network blocks, and what compilation needs to be
performed to get an executable simulation.
3.3.1 Configuration of different Network Devices
Keeping the reference of Figure 10, we tried to explore each block in detail. This
entire subsection is the detailed design of Figure 10.
In our system four kinds of device exist i.e. Sensor, Gateway, Controller, and
Actuator. Each device needs to be initialized before it can be used in the network.
Initialization of each device can be done as following:
We will discuss here initialization of each device in True Time simulator, one by one.
Initialization of the device can be carried out by writing peace of code in separate mfile for each device. To initialize the sensor node in the network, we need to define
number of analog inputs and outputs for the node and scheduling policy of the
function i.e. fixed priority, deadline monotonic or earliest deadline first. This can be
achieved by calling and initializing the function ‘ttInitKernel’ e.g. writing
ttInitKernel(nbrOfInputs, nbrOfOutputs, scheduling policy). Then collect all time
slots selected by user for each SuperFrame for the particular sensor node one by one.
And then define the channel offset, destination address, communication direction
(transmit/receive), link characteristic (normal, shared) and frame ID for each time slot
and create a data table matrix containing these all information for the sensor node.
Create periodic task which wakes up after every 0.01s (same as SlotSize) by calling
the function ‘ttCreatePeriodicTask’. To call this function we need to define different
parameters which are shown below:
ttCreatePeriodicTask ('task name', offset, period, prio, 'function name', data);
Let us discuss each parameter one by one. ‘task name’ parameter asks to provide the
name to the each task. There is no possibility of having same task name in a network.
‘offset’ is the time offset here, which can be used to delay the execution of task after it
wakes up. ‘period’ is defined in second, which is used to wake up task periodically.
‘function name’ parameter used to provide the name of function which needs to be
called when this task is waken up. ‘data’ is optional if user wishes to pass any
parameter to called function. Then we need to call the interrupt handler function to
handle the event driven interrupts for a node. Interrupt handlers may be associated
with timers to handle periodic task, the network receive channel (to handle event
24
Design and Implementation of a simulator
driven tasks such as waking up the task when node receives message over the wireless
network), external interrupt channels (when value at any channel changes on wired
connection), or attached to tasks as overrun handlers. To use the interrupt handler
function we need to create interrupt handler task, define the priority of the function
and function name which should be executed when interrupt occurs. This can be
achieved as following:
ttCreateInterruptHandler(handler name, priority, function name );
In our case, for the sensor node we use interrupt handler to wake up the periodic task
as it finishes its timer of period.
It is necessary to provide each node a specific node number. This numbers should be
in ascending order from the sensor nodes to the gateway and then actuator nodes. The
gateway and the controller will share the same node number as they are the part of the
one device as per the WirelessHART standard. Node number can be assigned by the
function ttInitNetwork(Node number, handler name). Wireless devices can not share
the node number in a network.
Now let us talk about the sensor task which is periodically called by the sensor node.
The period of the sensor task should be no longer than the size of the slot. The
periodic sensor task first calculates the absolute slot number which gives the current
slot number from the start of network simulation. The Absolute slot number can be
calculated from the following equation:
AbsSlotNum=mod(floor((Sim_time+eps)/SlotSize),SuperframeSize)+1;
(1)
Sim_time= current simulation time,
SlotSize= 0.01s,
SuperframeSize= length of the longest SuperFrame in the network,
eps= execution time of the segment (defined more below)
Figure 12: The execution of user code is modeled by a sequence of segments executed in order by
the kernel
The sensor task is executed in segments. The segment is incremented after the
execution of the current segment. The Execution time is given ‘-1’ to finish the
execution of entire task. The execution of the sensor task can be modeled as shown in
below Figure 12.
25
Design and Implementation of a simulator
Sensor Initialization
Start
Define number of Analog inputs and
outputs for the device
Get the array of time slots selected
by the user
Create a data table containing information of channel
offset, destination address, communication direction, link
characteristic for each time slot
Create a periodic task which periodically senses the
value from Process Plant and transmits the same value
to the Gateway
Create interrupt handler which invokes the
periodic task based on defined internal or
external events
Assign appropriate node number
End
Figure 13: Flow Chart to initialize the Sensor node
The sensor task is divided into three segments. In the first segment we try to read the
status of process plant if the time slot is reserved by the sensor node. And then
segment is executed for user defined time. The segment is incremented when the
execution time of current segment is finished. In the next segment we transmit the
data containing status of process plant to the gateway using WirelessHART MAC
layer protocol. The MAC layer protocol of WirelessHART can be used by calling the
function ttWirelessHART_MAC. Arguments to this function are data table matrix
26
Design and Implementation of a simulator
which is defined in the initialization script, destination device address, execution time
of the case segment and the caller ID (in this case current sensor node ID).
Sensor Task
Start
Calculate the Absolute Slot
Number
Current Slot is reserved
to Transmit data
?
Yes
Read the process Value (analog form)
from the Process Plant
No
Transmit this data (in digital form) to
the Gateway
End
Figure 14: Flow Chart of Aperiodic sensor task
The message is transmitted to the gateway if the conditions become true for the
WirelessHART MAC protocol, e.g. current time slot is reserved for the destination
device and source device defined in the ttWirelessHART_MAC arguments to transmit
data. Before message is transmitted, type of message is also needed to be defined in
its message field for the destination device to differentiate easily messages from
different devices. The message transmitted over the wireless network is in the digital
form. In the third and last segment, the execution time of the segment is given ‘-1’ to
finish the execution of the entire sensor task.
27
Design and Implementation of a simulator
Figure 13 and 14 shows the flowchart to configure the sensor devices. The flowchart
to initialize the sensor device can be seen in figure 13. The figure 14 shows the
flowchart of the periodic sensor task.
Figure 15: Flow Chart to initialize the Gateway
Now let us see the initialization of Gateway, which is almost similar to sensor node
except few. Figure 15, 16, and 17 show the flowchart to configure the gateway during
the communication.
28
Design and Implementation of a simulator
Initialization of the gateway can be carried out by defining the number of analog
inputs, and outputs, scheduling policy in the ttInitKernel function, creating periodic
and aperiodic task, interrupt handler, events etc. for the gateway simulation. In
addition for the gateway initialization, we need to create mailbox for each sensor
node. The mailboxes work as buffer for the device. Messages are put in appropriate
mailbox based on ‘message type’.
Then collect the time slot array defined by the user to receive/ transmit data to/ from
gateway. After collecting the time slot array design the data table matrix defining
frame ID, channel number, destination address, communication direction, link
characteristic for the each time slot. Creating interrupt handler and initializing
network kernel for the gateway can be done same as sensor node. The gateway has
two tasks-periodic, and aperiodic. Aperiodic task is event driven. When gateway
receives any message over the wireless network, interrupt to the device occurs and
calls the interrupt handler function, which wakes up the aperiodic task.
29
Design and Implementation of a simulator
Gateway as receiver
Start
Calculate the Absolute Slot
Number
Current Slot is reserved
to Receive data
?
Yes
Read data received from sensor node,
from mailbox
No
Write the same data to the controller
(in analog form)
End
Figure 16: Flow Chart of event driven task of Gateway
The “Gateway as receiver” is event driven task of gateway which wakes up when
gateway receives any message on the network as defined earlier. This task also
calculates the Absolute Slot Number as per equation (1). The task is divided in three
segments. In the first segment we check if the time slot is reserved for the gateway
receiver. If yes then we try to fetch data from the mailbox and in the next segment we
write the data to the controller to get back the required control signal from the
received data value over the network. In the third and last segment we finish the
execution of the current task.
30
Design and Implementation of a simulator
Gateway as Transmitter
Start
Calculate the Absolute Slot
Number
Current Slot is reserved
to Transmit data
?
Yes
Read analog data from controller
No
Transmit this data to the appropriate
actuator device
End
Figure 17: Flow Chart of periodic task of Gateway
The “Gateway as transmitter” is the periodic task of the gateway which wakes up
after every 0.01s. It is segmented same as defined for the sensor task. The “Gateway
as transmitter” task reads data from controller and transmits it to the either of Actuator
nodes.
Initialization of the controller is same as the sensor node except that the controller
shares the node number with gateway.
31
Design and Implementation of a simulator
Controller Initialization
Start
Define number of Analog inputs and
outputs for the device
Get the array of start time slot for each control
loop selected by the user
Create a periodic task which periodically wakes up and
check for the reserved time slot to read data from
Gateway and to write calculated control signal value to
the Gateway itself
Create interrupt handler which invokes the
periodic task based on defined internal or
external events
Assign appropriate node number
End
Figure 18: Flow Chart to initialize the Controller
Figure 18 and 19 show the flowchart to configure the controller in the network during
communication.
The Controller task is segmented in the three case segments. In the first segment
controller reads data from the gateway channel (depending on dependency input
signal array from the user) and in the second segment controller calculates the control
signal for the received data and writes the control signal back to the gateway channel
(depending on dependency output signal array from the user).
32
Design and Implementation of a simulator
Controller
Start
Calculate the Absolute Slot
Number
Current Slot is reserved
By controller
?
Yes
Find which control loop has
reserved the slot
Get the dependency input and
dependency output array for the same
control loop
Read process value from the gateway
as per the dependency input array
No
Calculate the control signal form
the received Process Value
Write the value of control signal to the
Gateway as per the dependency output
array
End
Figure 19: Flow Chart of Periodic task of Controller
Figure 20 and 21 contains the flowchart to configure the actuator device during the
communication.
33
Design and Implementation of a simulator
Figure 20: Flow Chart to initialize the Actuator
Initialization of actuator is same as the sensor node, except actuator has a mailbox
and an event driven task to receive data from the gateway. Interrupt handler functions
same as for the gateway as receiver task.
Actuator task is also segmented in the three case segments. Same as “Gateway as
receiver” task in the first segment actuator task fetches data from the mailbox if the
34
Design and Implementation of a simulator
current time slot is reserved by the actuator node. In the next segment actuator writes
data to the process plant in the analog form. The process plant performs control
operation depending on the received control signal. In the third segment actuator task
quits.
Actuator
Start
Calculate the Absolute Slot
Number
Current Slot is reserved
to Receive data
?
Yes
Read the control signal value received
from the Gateway, form mail box
No
Write the same data to the Process
Plant (in analog form)
End
Figure 21: Flow Chart of event driven task of Actuator
Figure 22 shows the flowchart explaining the function of the process plant during
communication.
Initialization of network devices and controller can be summarized as shown in
following table:
35
Design and Implementation of a simulator
Table 2: Summary to initialize the network devices and controller
No. Analog I/O
Sensor
Yes
Gateway
Yes
Controller
Yes
Actuator
Yes
Create Mailbox
No
Yes
No
Yes
Get the array of
timeslots selected by
the user for the
device
Yes
Yes
Yes
Yes
Create a data matrix
containing
information of
DestAdd, ChOff,
LinkDirn, LinkChar
for each reserved
timeslot
Yes
Yes
Yes
Yes
Tasks
Periodic
Periodic
aperiodic
Yes
Periodic and
aperiodic
Yes
Yes
Yes
Yes
Yes
Interrupt
Handler
Assign node number
Shares the
node number
with gateway
Yes
Process plant reads data from the actuator node, performs control operation, and
writes data to the sensor node.
36
Design and Implementation of a simulator
Process Plant
Start
Read control signal value from the
actuator and perform control operation
Write the current process data value to
the sensor device
End
Figure 22: Flow Chart- Process Plant working information
Figure 23 shows the flowchart of one complete communication cycle starting from the
sensor reads data from the process plant to actuator writes the value of control signal
to the process plant.
37
Design and Implementation of a simulator
START
Sensor Node reads the process value from the
process plant periodically.
Sensor node transmits the
process value to the gateway.
Gateway receives the process value from the
sensor node and writes the same value in analog
for to controller.
Controller reads the analog signal form the
Gateway and writes the calculated control
signal back to the Gateway
Gateway reads the control signal from controller
and transmits to the belonged Actuator device
Actuator receives the control signal and
writes to the Proce Plant
Process plant reads the
control signal and performs
control operation.
END
Figure 23: Flow Chart of one complete communication cycle
38
Design and Implementation of a simulator
3.3.2
Simulink model of Network Design
Figure 24: Screen shot of Simulink model of WirelessHART based network system
Figure 24 is the schematic diagram of entire network system with 5 sensors, a
gateway, a controller and 5 actuators. Diagram is made in matlab / Simulink
environment. Upper right hand side blocks represent the sensor nodes and they are
labeled as sensor1, sensor2… sensor5. Upper left hand side blocks represent actuator
nodes and are labeled as Actuator1, Actuator2…Actuator5. Block with labeled ’Wnet’
is defined more in its low level which is shown in below Figure 25.
The TrueTime wireless Network block is the block from the TrueTime simulink
library. The diagram represents that there are 11 nodes in the network. Input signal to
the ‘Snd’ represents, wireless signals which are being transmitting. All the sensors
and the gateway transmits signal over the wireless network which can be seen in the
below figure 25. In the figure 25 x, y and z can be used to represent the location of
each node in 2-D and 3-D. the TrueTime wireless Network also allows us to define
the amount of noise from the each device in the wireless network. ‘Rcv’ output
indicates number of signals which has to reach at its destination node through the
wireless network. Output of the scheduling shows the scheduling of the entire
WirelessHART network. Through the Loss signal we can find out the number of lost
signal during wireless communication.
39
Design and Implementation of a simulator
Figure 25: Screen shot of internal design of Wnet block of simulink model
Drilling down the TrueTime Wireless Network block we get the User interface which
allows us to choose different network model i.e. IEEE 802.11 b/g or ZigBee or
WirelessHART. After selecting the network model we can set the different parameters
for the network model as shown in the below Figure 26.
40
Design and Implementation of a simulator
Figure 26: Function Block parameters of TrueTime Wireless network block
Figure 27 is representing the example of process plant, where various kinds of control
operations are being performing.
41
Design and Implementation of a simulator
Figure 27: Internal design of Process Plant
Drilling down the any sensor node in schematic diagram designed in Matlab
Simulink, we get sub- simulink blocks as shown below in Figure 28. TrueTime kernel
is the block from the TrueTime Simulink library, in which we can define various
signals for the node for example analog inputs and outputs, Interrupts on external
channel, wireless message in (Rcv), wireless message out (Snd), scheduling plot for
the device etc.
42
Design and Implementation of a simulator
Figure 28: Internal structure of sensor node of simulink model
Drilling down the TrueTime kernel block opens the Function Block Parameters for
the sensor node, can be seen in Figure 29. We can write the name of m-file written in
Matlab in the field of ‘Name of Init function’ to configure the node as per our code in
the same file. Init function argument allows us passing parameter value to the
function. Battery checkbox field can be checked to track the amount of power
remained in the node. Clock drift field can be used to define the time drift in the local
clock to the reference clock. Clock offset field allows us defining the time offset in
the local clock to the reference clock.
Figure 29: Function Block parameter for sensor node
43
Design and Implementation of a simulator
gateway, controller, and actuators simulink blocks are the same as defined above for
the sensor node.
3.4 Design and Implementation of User Interface
Before we run the simulink model we need to create user interface to provide various
user defined inputs to the simulink blocks. We thought that the lay out of user
interface should be very brief and simple which makes easy for the user to use the
Simulator. Finally we plan to design the user interface which allows user to define
sequence of input arguments as following:
•
•
•
•
•
•
•
•
•
•
•
•
Allow the user to choose number of SuperFrames in the network without any
constraints
Allow the user to define the length (number of time slots) of each SuperFrame.
Allow user to define number of sensors, actuators and control loops in the
network.
Allow user to reserve time slots for each sensor in any SuperFrame.
Allow user to reserve time slots for each actuator in any SuperFrame.
Allow user to reserve time slots for each control loop in any SuperFrame.
More than one time slots can be reserved by any sensor, actuator or control
loop in more than one SuperFrame.
There should be also possibility to remove the selected time slots by any
device in the network.
Allow user to define and delete dependency input and dependency output for
each control loop.
Allow user to define the duration (time slots) of each control loop.
Allow user to see statistics of time slots in each SuperFrame.
Allow user to see detailed statistics of over all scheduling errors and warnings
by each device in the network
User input fields are provided as pop-up menu or list box or edit text box in Matlab
Guide.
With the input arguments through the user interface we design the algorithm to show
the scheduling of each device time slot by time slot on the uitable, which follows as
below:
3.4.1 Algorithm to show Statistics of each timeslot for all SuperFrame
on User Interface
• Read number of SuperFrame in the network
• Read the length of each SuperFrame
• Find out the maximum length among all SuperFrame
• Maximum length becomes number of columns and number of SuperFrame
becomes number of rows on uitable
• Read the time slot for each SuperFrame for each Sensor
• Write the sensor id in uitable cell based on time slot number and SuperFrame
to which it belongs to.
• Read the time slot for each SuperFrame for each actuator
44
Design and Implementation of a simulator
•
•
•
•
•
•
•
•
•
•
•
Write the actuator id in uitable cell based on time slot number and SuperFrame
to which it belongs to
Show collision message if more than one device tries to use the same time slot
disregarding SuperFrame
Read the start time slot and duration for each SuperFrame for each Control
loop
Write the control loop id in uitable cell based on start time slot number and
SuperFrame to which it belongs to.
Each control loop id should be written with unique color.
Read the dependency input and dependency output for each control loop
Show all the device id in same color which are inter related to each other
Show ‘Collision’ message if more than one control loop besides in same time
slot disregarding SuperFrame
If any control loop misses its dependency input and/or output, message should
be displayed providing appropriate error information.
If any sensor and/or actuator is not connected to any control loop then their ids
should be displayed with red colors on appropriate uitable’s cell
Show health report, which gives the status and error information of scheduling
of entire network devices.
Most challenging task with the above algorithm was to write in different colors in
uitable’s cells. The reason behind this is that MATLAB Guide does not offer to write
with the different colors in uitable’s cells. However, this problem was solved by using
HTML code, which can be seen in and studied from Gui.m file.
Another challenge was to show error messages if the scheduling of network devices is
not done properly for a complete communication cycle. This has been carried out by
checking for the scheduling of dependency inputs and dependency outputs for each
communication cycle for each control loop. If the scheduling of dependency input and
dependency output devices is not done for a complete communication cycle for any
control loop, error messages can be seen on uitable as well as on health report
window.
Figure 30 shows the screen shot of User Interface. Each field on User interface can be
studied from the User manual document, which can be found in attachment.
45
Design and Implementation of a simulator
Figure 30: Screen shot of User interface lay out
Below Figure 31 descript the health report containing errors and warnings in
scheduling the device in network. When there is no device scheduled in the network,
message is displayed ‘No Device Allocated’. When there is successful scheduling of
all devices message ‘Scheduling Successful’ can be seen. Scheduling is considered as
successful when there are no errors and warnings. Let us see when simulator gives
errors and warnings:
Warnings:
•
When any device not scheduled for any communication in the network
Errors:
•
•
When more than one network device try to communicate in the same time slot.
When more than one control loop try to execute in the same time slot.
Note: sensors, actuators and gateway are considered as network device but not the
controller.
•
•
When there is no scheduling of dependency input or dependency output
devices for any control loop for each execution.
When scheduled device is not connected to any control loop.
46
Design and Implementation of a simulator
Figure 31: Screen shot of Health Report with status of scheduling
47
48
Testing and Results
4 Testing and Results
4.1 Testing
To test the designed simulator we need to schedule the devices for the communication
with each other. Simulator has passed through various tests. Some of tests are shown
here:
Number of SuperFrame= 3,
Length of each SuperFrame is 10, 20, 40 respectively,
Number of sensors, actuators and control loops= 5,
Duration of each control loop =1 time slot,
Table 3: Test Table to show collision
Device ID
Time slot / SuperFrame
Transmit / receive
S1
S2
S3
S4
S5
G
G
G
G
G
G
G
G
G
G
A1
A2
A3
A4
A5
1/1
1/1
3/1
4/1
5/1
1/1
1/1
3/1
4/1
5/1
6/1
7/1
8/1
9/1
10 / 1
6/1
7/1
8/1
9/1
10 / 1
1/0
1/0
1/0
1/0
1/0
0/1
0/1
0/1
0/1
0/1
1/0
1/0
1/0
1/0
1/0
0/1
0/1
0/1
0/1
0/1
Control Loop
Start time slot /
SuperFrame
Dependency input /
dependency output
CL1
CL2
CL3
CL4
CL5
2/1
2/1
4/1
5/1
6/1
S1 / A1
S2 /A2
S3 /A3
S4 /A4
S5 /A5
49
Testing and Results
Test table 3 suggests the scheduling of network devices and controller. Scheduling of
the network devices and the control loops have done such that we be able to see error
on uitable on user interface and also on scheduling Matlab /simulink scheduling plot.
Error has intentionally created at time slot 1 and 2 in SuperFrame 1.
Table 4: Test Table to show dependency input and output error
Device ID
Time slot / SuperFrame
Transmit / receive
S1
S2
S3
S4
S5
G
G
G
G
G
G
G
G
G
G
A1
A2
A3
A4
A5
2/1
3/1
4/1
5/1
1/1
1/1
3/1
4/1
5/1
6/1
7/1
8/1
9/1
10 / 1
7/1
8/1
9/1
10 / 1
1/0
1/0
1/0
1/0
0/1
0/1
0/1
0/1
0/1
1/0
1/0
1/0
1/0
1/0
0/1
0/1
0/1
0/1
Control Loop
Start time slot /
SuperFrame
Dependency input /
dependency output
CL1
CL2
CL3
CL4
CL5
2 /1
2/1
4/1
5/1
6/1
S1 / A1
S2/A2
S2/A2
S4 /A4
S5 /A5
Test table 4 suggests the scheduling of the network devices and control loops.
Scheduling suggestions are given such that we see the dependency input and
dependency output error and some warnings as well.
Table 5: Test Table with right scheduling method
Device ID
Time slot /
SuperFrame
Transmit / receive
S1
1/2
1/0
50
Testing and Results
S2
S3
S4
S5
G
G
G
G
G
G
G
G
G
G
A1
A2
A3
A4
A5
2/1
3/1
4/1
5/1
1/2
2/1
3/1
4/1
5/1
6/1
7/1
8/1
9/1
10 / 1
6/2
7/1
8/1
9/1
10 / 1
1/0
1/0
1/0
1/0
0/1
0/1
0/1
0/1
0/1
1/0
1/0
1/0
1/0
1/0
0/1
0/1
0/1
0/1
0/1
Control Loop
Start time slot /
SuperFrame
Dependency input /
dependency output
CL1
CL2
CL3
CL4
CL5
2 /2
3/1
4/1
5/1
6/1
S1 / A1
S2 /A2
S3 /A3
S4 /A4
S5 /A5
Test table 5 has suggested the scheduling which offers no error and no warnings.
Scheduling is considered as ‘successful’ when there are no errors and no warnings.
4.2 Results
4.2.1
Study the scheduling plots
This sub section discusses the results of different test tables. Different results can be
studied through User Interface uitable, Health Report and from the simulink plot.
51
Testing and Results
Figure 32: Screen Shot of User interface for Table 3
Figure 32 shows the result of scheduling devices as suggested in table 3. As we can
see when more than one network devices try to occupy the same time slot we see the
‘Collision’ message on uitable and also on pop up (shown in the screen shot topcenter).
We can also see the selected (highlighted) dependency input and output on the list box
for each control loop.
52
Testing and Results
Health Report
As can be seen in the below Figure 33, Health Report describes the error in detail.
Health report gives the device ID which is involved in causing error and also
describes error type, and time slot number as well as corresponding SuperFrame
number.
Figure 33: Screen shot of Health Report for Table 3
53
Testing and Results
Scheduling Plot
Scheduling plot can be seen in Figure 34 below. Simulator aborts simulation when
there is more than one device try to communicate in the same time slot and this can be
also seen from the plot below. When more than one device tries to transmit data at the
same node or device, device (receiver) drops all packets. Number of packet loss at
each device can be seen on Matlab command prompt.
Figure 34: Screen shot of scheduling simulink plot for Table 3
----- Sensor Signal
----- Gateway receiver signal
User Interface
Error can be seen at the control loop 1 in Figure 35 for the Table 4. Control loop is
dependant on sensor node 1 and actuator node 2, but both devices are not scheduled.
So simulator shows error for the scheduling of control loop 1 with the error of
dependency input and dependency output.
54
Testing and Results
Figure 35: Screen shot of User interface for Table 4
Health Report
Detailed error description can be seen in the Figure 36 for the scheduling of devices
suggested as in Table 4. Each error types are displayed with different colors which
help to debug errors easily.
Figure 36: Screen shot of Health Report for Table 4
55
Testing and Results
User Interface
An ideal kind of scheduling can be seen in Figure 37 for the Table 5, where there is no
time slot where more than one device tries to occupy the same time slot.
Network device and control loop can share the same time slot.
Figure 37: Screen shot of User Interface for Table 5
Health Report
When there is no error or warnings ‘Scheduling Successful’ message can be seen as in
Figure 38.
56
Testing and Results
Figure 38: Screen Shot of Health Report for Table 5
Scheduling Plot
Scheduling plot in Figure 39 shows the start time and total execution time of each
device. Execution time of each device is not user defied and it is fixed in this case.
Task of the gateway / actuator to receive data from the sensor / gateway device are
event driven. So the task starts execution after the completion of execution of
corresponding transmitting device.
57
Testing and Results
Figure 39: Screen shot of scheduling simulink plot for Table 5
------ Sensor Signal
------ Gateway Receiver Signal
------ Control loop signal
------ Gateway Transmitter Signal
------ Actuator Signal
58
Conclusions and Future Work
5 Conclusions and Future Work
5.1 Conclusions and Limitations
5.1.1
Conclusion and Analysis
Test results show that simulator works as per the requirements in chapter 1.4. After
defining the size of the network, user can assign SuperFrame and link to each network
device as per the communication requirements. Error and warning messages can be
seen for the invalid input arguments. Current simulator supports star topology based
network. Test results also show that user is able to see the results on the scheduling
plot, uitable, and Health Report window.
5.1.2
•
•
•
•
•
•
•
•
•
•
•
•
5.1.3
Key Features of Simulator
After defining the size of the network, user can assign the SuperFrame and
link to each network device as per the communication requirements.
Simulator also allows defining the time slot and dependency input as well as
dependency output for each control loop.
Statistics of each time slot of each SuperFrame can be seen on uitable.
Error and warning messages (if any) can be seen in detail on Health Report
window.
Each error and warning message type can be seen in different color.
Inter dependant devices can be seen with the same color on the uitable.
Network device which are not connected to any control loop can be seen with
red color on uitable.
Simulator also allows removing the selected time slot for the device.
Reset option is also available to reset the entire SuperFrame for all network
device and controller.
Each SuperFrame is repeated continuously after finishing its current
execution.
Length of the longest SuperFrame becomes the number of columns on the
uitable.
Number of superframes in the network defines the number of rows on the
uitable.
Answers to research questions
a. How to control the timeslot allocation in WirelessHART
network for each network device to have the collision
free communications?
The time slot allocation for each device can be controlled by designing the simulator
which provides the statistics of each time slot on User interface (explaining each error
and warning in detail if any) as well as on scheduling plot on simulink model. If
59
Conclusions and Future Work
simulator finds the successful scheduling method then the same scheduling method
can be used for the real physical system.
b. How to configure the WirelessHART network devices in
the simulator?
Configuration of network devices can be done by writing peace of code in Matlab mfile and calling required C++ files of TrueTime Toolbox in the same Matlab m-file for
each device, which defines the nature of the device. Configuration of the device
contains the information like when to wake up by each device to transmit or receive
data over the network and how to proceed to the received data over the network or
how to transmit data to the desired destination over the network. Configuration also
contains the interrupt handler functions, which can be used to define the event driven
activities by the device.
c. What kind of input arguments should be offered by user
interface?
User Interface offers following different arguments to be entered by the user.
Number of SuperFrames in the network.
i.
ii.
Length of each SuperFrame.
Number of sensors, actuators and control loops in the network.
iii.
iv.
Allowing user to reserve time slot for any device or control loop on
any SuperFrame.
v.
Allowing user to define dependency input and output for each control
loop.
d. Design the algorithm to get the statistic of each timeslot.
Results shows that we are able to get the statistics of each time slot on User Interface
calculating the latest user input arguments. Algorithm has been explained in section
3.4.1
e. How and what kind of result should be achieved?
We are able to see two kinds of results, one on the User Interface and one on the
scheduling plot of simulink model. Results on the user interface provide the statistics
of each time slot of all Superframes containing the error and the warning messages if
any. Results on the scheduling plot show the square signal. Width of the square signal
defines the execution time of that device.
5.1.4
Limitations of the simulator
Limitations of the simulator is that we can see only 10 different colors on uitable to
show the inter relationships between each network device and control loop. Reason
behind this is that working with more colors is not appropriate to differentiate
different colors easily. Another limitation of the simulator is that if any device (sensor
and/or actuator) belongs to more than one control loop then that particular device will
60
Conclusions and Future Work
be written with the same color as the control loop with higher number to which it
belongs to.
5.2 Future Work
Simulator which is designed here is still in its preliminary stage. There is lot more that
needs to be done. Some of them are mentioned here.
•
•
•
•
Simulator currently offers single hop communication, which should be
extended by its functionality to offer multi hop communication.
Need to find out the way to use all 15 channels in a single time slot, to
increase the efficiency of the time slot utilization.
Multi-hop communication and many links in a single time slot lead the User
Interface to be modified such that it gives error and warning messages in a
more efficient and advanced way.
There is also need to design an algorithm which calculates the best possible
scheduling method automatically based on the current network type. After
getting the best possible scheduling method, simulator should show results on
uitable automatically.
.
61
62
6 References
1) Hart Communication Foundation. WirelessHART Technical data
sheet. 2007. “HART Communication Foundation”.
2) HART Communication Foundation, TDMA Data Link Layer.
HCF_SPEC-075, Revision 1.0. Release date: 30 august 2007
3) Dan Henriksson, Anton Cervin, Martin Ohlin, Karl-Erik Årzén.
“TrueTime: Real-time Control System Simulation with
MATLAB/Simulink”. Department of Automatic Control, Lund
University, Sweden
4) Dust Networks. 2009. Retrieved July 29, 2009.
http://www.dustnetworks.com/technology/technology_overview/fu
lly_redundant_mesh_routing
5) HART Communication Foundation. 2009. Retrieved July 29, 2009.
http://www.hartcomm2.org/hart_protocol/applications/white_paper
s/why_wirelesshart.html
6) Anton Cervin, Dan Henriksson, Martin Ohlin. “TrueTime 1.5Reference Manual”. Department of Automatic Control, Lund
University, Sweden.
7) HART Communication Foundation, Network Management
Specification. HCF_SPEC-085, Revision 1.0. Release date: 27
august- 2007
8) Retrieved July 18, 2009.
http://en.wikipedia.org/wiki/Media_Access_Control
9) HART Communication Foundation, Wireless Devices Specification.
HCF_SPEC-290, Revision 1.0. Release date:5 september, 2007
10) Dust Networks-SmartMesh IA-510™Manager XML API Guide,
Document Number: 040-0044 rev 6 SmartMesh IA-510 Manager
XML API Guide, Revised: June 27, 2008
11) Nyberg, R. (2000) Nyberg, R. (2000) Skriv vetenskapliga rapporter
och avhandlingar, Studentlitteratur, Lund.
12) Retrieved August 6, 2009.
http://www.socrades.eu/Project/Presentation/default.html
13) Holger Karl, Andreas Willig. 2007. Protocols and Architectures:
for Wireless Sensor Networks. John Wiley & Sons Ltd, The
Atrium, Southern Gate, Chisester, West Sussex PO19 8SQ,
England: John Wiley & Sons.
63
64
Attachments
7 Attachments
Attachment 1
User Manual
65
Attachments
66
Attachments
USER MANUAL
FOR
WIRELESSHART BASED WIRELESS
COMMUNICATION SYSTEM SIMULATOR
67
Attachments
8 Introduction
This manual describes the use of MATLAB / Simulink based wireless communication
system simulator which uses a WirelessHART MAC layer protocol to communicate
with network devices. This Simulator facilitates co-simulation of controller task
execution in real time kernels (designed in TrueTime Toolbox), network
transmissions, and continuous plant dynamics.
The manual describes the required steps in sequence to simulate the desired network
performance. This includes how to run the simulink file and how to input data through
user interface.
9 Getting Started
9.1 Software Requirements
Simulator requires MATLAB 6.1 (R12.1) or later with Simulink 4.1 or later.
9.2 Installation
In order to run simulator, the environment variable TTKERNEL must be defined to
point the directory with the TrueTime kernel files to install TrueTime toolbox inside
your computer, $DIR/kernel. In later version of MATLAB, this can be done using e.g.
the command
setenv (‘TTKERNEL’ , ‘C:\MyFiles\truetime1.5_2\kernel’)
In older versions of MATLAB, the setenv command is not available, so the
environment variable must be defined in the operating system:
•
•
Unix/Linux: export TTKERNEL=$DIR / kernel
Windows: use Control Panel / System / Advanced / Environment
Variables
Then add the following lines to your MATLAB startup.m file. This will set up all
necessary paths to the TrueTime kernel files.
Getpath = getenv(‘TTKERNEL’);
addpath(Getpath);
init_truetime;
10 Using the Simulator
Before we run our simulator we need to provide data through user interface to check
the performance of the system with given input data.
68
Attachments
To input the data, open the ‘WirelessHART_Simulator_Gui.fig’ file Located at
‘C:\Documents and Settings\SEKUSHA\Desktop\WirelessHART Simulator’, which
is a user interface as shown in Fig.40.
Figure 40: User Interface
Below is the description of each user input data field in Fig.1.
1) Starting from the top, first user input will be to have the number of
Superframes in the network.
2) Provide the length of each SuperFrame by selecting the SuperFrame from the
popup menu.
3) Define the number of sensors in the network.
Note: This input is auto defined, but still can be changed.
4) Define the number of actuators in the network.
Note: This input is auto defined, but still can be changed.
5) Define number of control loops in controller.
6) Press the ‘Reset’ button to reset the old values.
7) Select the SuperFrame for each sensor and set the time slots for the same
sensor.
8) Select the SuperFrame for each control loop and set the duration and start of
time slot.
9) Select the dependency input and dependency output for each control loop.
10) Repeat step no.7 for the Actuator.
11) ‘Remove’ button erases the selected timeslots or start of time slot for the each
sensor, control loop or actuator for specific SuperFrame.
12) By pressing the button ‘show TimeSlots in Table’ shows the reserved slots by
each device in each SuperFrame, in the table.
69
Attachments
13) ‘Health Report’ button opens the window which shows the status of
scheduling method containing error and/or collision messages or successful
message of current scheduling.
Figure 41: Health Report Window
Figure 41 shows the Health Report window which contains the status of the current
scheduling. ‘Refresh’ button is used to get the latest status of the scheduling. ‘OK’
button simply closes the window
Open the file ‘WirelessHART_Simulator.mdl’ located at ‘C:\Documents and
Settings\SEKUSHA\Desktop\WirelessHART Simulator’. This will look like as shown
in below Fig.42
70
Attachments
Figure 42: Simulink Model of Network Design
Clicking the icon, shown with red round mark in tools window in Fig.2 simulates the
user data for the available network type and devices. Results can be seen by double
clicking on the scope named ‘Scheduling sensor, gateway, Controller, actuator’ in
‘WirelessHART_Simulator.mdl’ file.
71