1
CA Performance Management for
OpenVMS
Performance Manager Administrator Guide
r3.1
This documentation and any related computer software help programs (hereinafter referred to as the
“Documentation”) is for the end user’s informational purposes only and is subject to change or withdrawal by CA at
any time.
This Documentation may not be copied, transferred, reproduced, disclosed, modified or duplicated, in whole or in
part, without the prior written consent of CA. This Documentation is confidential and proprietary information of CA
and protected by the copyright laws of the United States and international treaties.
Notwithstanding the foregoing, licensed users may print a reasonable number of copies of the documentation for
their own internal use, and may make one copy of the related software as reasonably required for back-up and
disaster recovery purposes, provided that all CA copyright notices and legends are affixed to each reproduced copy.
Only authorized employees, consultants, or agents of the user who are bound by the provisions of the license for
the product are permitted to have access to such copies.
The right to print copies of the documentation and to make a copy of the related software is limited to the period
during which the applicable license for the Product remains in full force and effect. Should the license terminate for
any reason, it shall be the user’s responsibility to certify in writing to CA that all copies and partial copies of the
Documentation have been returned to CA or destroyed.
EXCEPT AS OTHERWISE STATED IN THE APPLICABLE LICENSE AGREEMENT, TO THE EXTENT PERMITTED BY
APPLICABLE LAW, CA PROVIDES THIS DOCUMENTATION “AS IS” WITHOUT WARRANTY OF ANY KIND, INCLUDING
WITHOUT LIMITATION, ANY IMPLIED WARRANTIES OF MERCHANTABILITY, FITNESS FOR A PARTICULAR PURPOSE
OR NONINFRINGEMENT. IN NO EVENT WILL CA BE LIABLE TO THE END USER OR ANY THIRD PARTY FOR ANY
LOSS OR DAMAGE, DIRECT OR INDIRECT, FROM THE USE OF THIS DOCUMENTATION, INCLUDING WITHOUT
LIMITATION, LOST PROFITS, BUSINESS INTERRUPTION, GOODWILL, OR LOST DATA, EVEN IF CA IS EXPRESSLY
ADVISED OF SUCH LOSS OR DAMAGE.
The use of any product referenced in the Documentation is governed by the end user’s applicable license
agreement.
The manufacturer of this Documentation is CA.
Provided with “Restricted Rights.” Use, duplication or disclosure by the United States Government is subject to the
restrictions set forth in FAR Sections 12.212, 52.227-14, and 52.227-19(c)(1) - (2) and DFARS Section 252.2277014(b)(3), as applicable, or their successors.
All trademarks, trade names, service marks, and logos referenced herein belong to their respective companies.
Copyright © 2008 CA. All rights reserved.
Contact Technical Support
For online technical assistance and a complete list of locations, primary service
hours, and telephone numbers, contact Technical Support at
http://ca.com/support.
Contents
Contents
Chapter 1: Introduction
5
13
CA Performance Management for OpenVMS .................................................... 13
Performance Manager ......................................................................... 14
Performance Manager Features ................................................................ 15
Knowledge Base and Rules Compiler ....................................................... 15
Analysis and Reporting Facility ............................................................. 15
Real-time Displays of Performance Data .................................................... 16
Graphing Facility .......................................................................... 17
Data EXPORT Facility ...................................................................... 17
DECwindows Interface ........................................................................ 17
What to Expect from Performance Manager .................................................... 18
Cross-Platform Support ................................................................... 19
Chapter 2: Analyze Performance
21
Analysis Reports .............................................................................. 21
Interpret the Analysis Reports ............................................................. 22
Brief Analysis Reports ......................................................................... 30
Interpret the Brief Analysis Report ......................................................... 30
Chapter 3: Evaluate Performance in Detail
33
Performance Evaluation Report ................................................................ 33
Interpret the Process Statistics ............................................................ 34
Interpret Pool Statistics ................................................................... 50
Interpret CPU Mode Statistics .............................................................. 51
Interpret SCS Statistics ................................................................... 52
Interpret cluster-wide Lock Statistics ....................................................... 54
Interpret cluster-wide CI, NI, and Adapter Statistics ........................................ 55
Interpret cluster-wide Disk Statistics ....................................................... 56
Interpret cluster-wide Tape Statistics ...................................................... 58
Interpret cluster-wide Hot File Statistics .................................................... 61
Interpret cluster-wide Summary Statistics .................................................. 62
Histograms ................................................................................... 64
Image Residence Histograms .............................................................. 64
Contents 5
Tabular Report Sections ....................................................................... 71
System Configuration Data ................................................................ 72
Summary Statistics Sections............................................................... 74
System Communication Service Rates ...................................................... 85
Disk and Server Statistics Section .......................................................... 88
Process Metrics Data ...................................................................... 90
Cluster Summary Statistics (with By Node Breakout) ........................................ 93
Cluster Disk and Server Statistics (with By Node Breakout) .................................. 99
Chapter 4: Generate Historical Graphs
107
Generate Predefined Graphs .................................................................. 107
Generate Graphs from the DCL Level ...................................................... 108
Generate Graphs in Command Mode ...................................................... 108
Generate Multiple Graphs .................................................................... 111
Components of Graphs ....................................................................... 111
Composite Graphs ........................................................................... 113
Stacked Graphs ............................................................................. 113
Create Typical Time Period Graphs ............................................................ 113
Scheduling .................................................................................. 114
Use Binary Graph Data ....................................................................... 114
Components of Pie Charts .................................................................... 115
Pie Chart Presentation of CPU Utilization ...................................................... 116
Format Graphs and Pie Charts ................................................................ 116
Refresh a ReGIS Graph with New Characteristics ........................................... 117
Output Formats .......................................................................... 118
Data Resolution with X_POINTS ........................................................... 123
Generate Custom Graphs .................................................................... 126
Graph System Metrics .................................................................... 127
Graph Process Metrics by User ............................................................ 130
Graph the Hot File Activity ................................................................... 133
Chapter 5: Customize the Knowledge Base
135
The Knowledge Base ......................................................................... 135
Investigate Rule Firing ....................................................................... 136
Components of Rules ........................................................................ 137
Rules File Constructs ..................................................................... 137
Rule Construct Elements ................................................................. 148
Data Cell Types and Use ..................................................................... 156
Boolean Data Cell ........................................................................ 158
Numeric Data Cell ....................................................................... 159
String Data Cell .......................................................................... 159
6 Performance Manager Administrator Guide
Time Data Cell ........................................................................... 159
Scan Routine Data Cell ................................................................... 159
Tally Data Cell ........................................................................... 160
Index Specifier Data Cell ................................................................. 162
Implement Changes ......................................................................... 163
Disable an Existing Rule .................................................................. 164
Modify an Existing Rule................................................................... 164
Add a New Rule .......................................................................... 166
Change a Threshold Value ................................................................ 167
Change a Rule Literal Value .............................................................. 170
Build an Auxiliary Knowledge Base ............................................................ 172
Use an Auxiliary Knowledge Base for Reporting and Archiving .................................. 173
Chapter 6: Performance Manager Commands
175
ADVISE PERFORMANCE ...................................................................... 175
ADVISE PERFORMANCE COMPILE ............................................................. 176
ADVISE PERFORMANCE DISPLAY ............................................................. 178
ADVISE PERFORMANCE EXPORT .............................................................. 182
ADVISE PERFORMANCE GRAPH ............................................................... 191
ADVISE PERFORMANCE PIE_CHART ........................................................... 232
ADVISE PERFORMANCE REPORT .............................................................. 234
ADVISE PERFORMANCE SHOW VERSION ...................................................... 238
Chapter 7: Use Command Mode Commands
239
ADVISE PERFORMANCE ...................................................................... 239
SELECT ..................................................................................... 240
LOAD ....................................................................................... 245
GRAPH ...................................................................................... 245
PIE_CHART.................................................................................. 248
REPORT ..................................................................................... 249
SAVE ....................................................................................... 255
SPAWN ..................................................................................... 255
EXIT ........................................................................................ 256
@(Execute Procedure) ....................................................................... 256
Chapter 8: Use the DECwindows Motif Interface
257
Start the DECwindows Motif Interface ......................................................... 257
Use the Main Window .................................................................... 258
Main Window Status Information .......................................................... 259
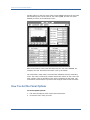
How You Control the DECwindows Interface ................................................... 260
Contents 7
Save the Reports ........................................................................ 261
Monitor the Work in Progress ............................................................. 263
Read the Parameter File .................................................................. 264
Write the Parameter File ................................................................. 264
Load the Binary Graph Data .............................................................. 264
Save the Binary Graph Data .............................................................. 265
Quit the Session ......................................................................... 266
How You Select Data for Analysis ............................................................. 266
Select Today's Data ...................................................................... 266
Select Specific Data ...................................................................... 267
Select the Last Hour ..................................................................... 277
Use Custom Default Settings ............................................................. 277
How You Display Analyzed Data .............................................................. 278
Brief Analysis Report ..................................................................... 278
Full Analysis Report ...................................................................... 279
Performance Evaluation Report ........................................................... 280
Process Statistics ........................................................................ 282
Tabular Report Sections .................................................................. 284
Graphs .................................................................................. 286
How You Customize .......................................................................... 296
Customize the Data Collection ............................................................ 296
Customize the PSDC$DATABASE Definition ................................................ 305
Customize Parameters ................................................................... 306
Workload Definitions ..................................................................... 308
Workload Family Definitions .............................................................. 313
History File Descriptors ................................................................... 316
Parameter Settings ...................................................................... 319
View the Main Window ....................................................................... 320
Chapter 9: Use the DECwindows Motif Real-time Display
321
Start the Real-time Display ................................................................... 321
Control the Real-time Display ................................................................ 322
Navigate Within the Default Panels ........................................................... 323
Use the Panel Commands Menu .............................................................. 324
Default Panel Descriptions.................................................................... 324
System Overview ........................................................................ 324
Default Panel Hierarchy .................................................................. 325
CPU Utilization Panel Descriptions ......................................................... 325
CPU Queue Panel Descriptions ............................................................ 329
Hard Fault Rate Panel Descriptions ........................................................ 330
Disk Rate Panel Descriptions .............................................................. 335
Review Data in Playback Mode................................................................ 337
8 Performance Manager Administrator Guide
Set the Thresholds and Ranges ............................................................... 338
Change the Colors and Patterns .............................................................. 339
Chapter 10: Customize the DECwindows Motif Real-time Display
341
Access the Panel Manager .................................................................... 341
Specify Actions on Panels .................................................................... 342
Terminate the Session ....................................................................... 345
How You Edit the Panel Instruments .......................................................... 345
Enable the Build Mode.................................................................... 346
Modify the Instruments .................................................................. 346
How You Set the Panel Options ............................................................... 366
Set the Panel Status ..................................................................... 367
Specify the Panel Background ............................................................ 367
Specify a Panel Title ..................................................................... 368
Specify the Panel Node and Metric Instance Data .......................................... 369
Remove Panel Menu ..................................................................... 370
Save the Panel .......................................................................... 371
Close the Panel .......................................................................... 371
Chapter 11: Use the Character-Cell Real-time Display
373
Character-Cell Display Functions .............................................................. 373
Prerequisites ............................................................................ 373
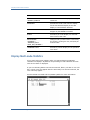
Start the Character-Cell Displays ............................................................. 374
Control the Displays ......................................................................... 374
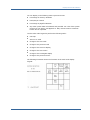
Display Multi-node Statistics.................................................................. 376
Display Single-Node Statistics ................................................................ 378
Display CPU Utilization ................................................................... 379
Display Top Processes Statistics .......................................................... 380
Display Top Device Statistics ............................................................. 381
Display Process Information .................................................................. 381
Display Disk Information ..................................................................... 384
Display Rules Information .................................................................... 385
Display RESOURCE Information ............................................................... 385
RESOURCE Keypad ...................................................................... 386
Balance Cluster System Utilization Using the Resource Display .............................. 386
Lower (Common) Resource Display ....................................................... 387
Memory Display ......................................................................... 388
Disk Display ............................................................................. 389
CPU Display ............................................................................. 390
The INVESTIGATE Command ................................................................. 391
INVESTIGATE Command Options ......................................................... 391
Contents 9
INVESTIGATE Keypad .................................................................... 392
Evaluate Performance Using the Investigate Displays .......................................... 392
Investigate a Memory Limitation .......................................................... 394
Investigate an I/O Limitation ............................................................. 395
Investigate a CPU Limitation .............................................................. 396
Isolate the Cause of a Memory Limitation .................................................. 397
Isolate the Cause of an I/O Limitation ..................................................... 399
Isolate the Cause of a CPU Limitation ..................................................... 400
Exit the Character-Cell Displays .............................................................. 401
Appendix A: Performance Manager Messages and Recovery Procedures
403
Sample Performance Manager Message ....................................................... 403
Severity Codes .............................................................................. 403
Appendix B: Performance Manager Logical Names
405
PSPA$DISPLAY_PROCESS_CPU_UNNORMALIZED .............................................. 405
PSPA$DNS_NAMES .......................................................................... 406
PSPA$EXAMPLES ............................................................................ 406
PSPA$GIVE_DEVICE_SERVICE ................................................................ 406
PSPA$GRAPH_CHARS ........................................................................ 406
PSPA$GRAPH_FILE_DEVICE .................................................................. 407
PSPA$GRAPH_FILE_DIRECTORY .............................................................. 407
PSPA$GRAPH_LEGEND_FONT_POINT ......................................................... 407
PSPA$GRAPH_PATH.......................................................................... 407
PSPA$HLS................................................................................... 407
PSPA$PIE_FONT_POINT ...................................................................... 408
PSPA$PS_RGB_1 through PSPA$PS_RGB_6 ................................................... 408
PSPA$SKIP_DISK_FILTER .................................................................... 409
PSPA$SKIP_PIE_PERCENT .................................................................... 409
PSPA$SUPRESS_TAPE_STATS_BY_VOLUME ................................................... 409
PSPA$UNNORMALIZE_CUSTOM_CPU .......................................................... 409
Appendix C: Performance Manager Data Cells
411
Data Cell Navigation Table ................................................................... 412
Performance Manager Data Cells ............................................................. 413
Appendix D: Estimate Virtual Memory Needs
535
How Performance Manager Uses Virtual Memory ............................................... 535
For Graphs .................................................................................. 536
10 Performance Manager Administrator Guide
For Reports ................................................................................. 537
For Integrity Servers and Alpha Systems ...................................................... 537
Appendix E: Output Format for ASCII-CSV Data
539
Record Header .............................................................................. 540
Version Data Record ......................................................................... 541
Memory Statistics Data Record ............................................................... 541
CPU Statistics Data Record ................................................................... 543
Secondary CPU Statistics Data Record ........................................................ 544
Page Statistics Data Record .................................................................. 545
I/O Statistics Data Record .................................................................... 547
XQP Statistics Data Record ................................................................... 548
System Communication Services Data Record ................................................. 549
Lock Statistics Data Record................................................................... 551
Device Statistics Data Record ................................................................ 553
Disk Statistics Data Record ................................................................... 553
Server Statistics Data Record................................................................. 555
Process Metric Statistics Data Record ......................................................... 556
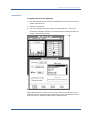
Appendix F: How You Graph Seven or More CPUs
559
Step 1: Create a CSV file ..................................................................... 559
Step 2: Create More CSV Files as Necessary ................................................... 560
Step 3: Create a Single CSV File .............................................................. 560
Resulting File After Merge and Edits ....................................................... 561
Step 4: Send the CSV File to a Windows Machine .............................................. 562
Step 5: Create the Graph in Excel ............................................................ 562
Glossary
565
Index
577
Contents 11
Chapter 1: Introduction
This chapter introduces CA Performance Management for OpenVMS and
discusses its features, supported configurations, and system requirements.
This section contains the following topics:
CA Performance Management for OpenVMS (see page 13)
Performance Manager (see page 14)
Performance Manager Features (see page 15)
DECwindows Interface (see page 17)
What to Expect from Performance Manager (see page 18)
CA Performance Management for OpenVMS
CA Performance Management for OpenVMS includes layered products designed
to reduce the time and effort required to manage and monitor system
performance and to plan for future resource requirements. These products can
be used with standalone and with OpenVMS cluster systems.
CA Performance Management for OpenVMS includes the following products:
■
Performance Manager
■
Performance Agent
■
Accounting Chargeback
Performance Manager and Performance Agent share a common database and
basic set of utilities. Any one component may provide these utilities on behalf
of the other components of the same version, as shown in the following items:
■
Performance Agent gathers, manages, classifies, and archives OpenVMS
system data. It provides the following functions:
–
Data collection and storage
–
Data archiving
–
Dump reports
–
Disk analysis
–
PC sampling
–
Real-time file activity display
Chapter 1: Introduction 13
Performance Manager
■
Performance Manager makes recommendations for improving system
performance. It does this by analyzing system data through the
application of expert system technology, identifying specific conditions
causing performance degradation, and presenting detailed evidence to
support its conclusions. It also provides real-time displays of performance
data using either DECwindows Motif or character cell displays. The user
can interactively view and investigate system performance problems and
resource usage. The following functions are included in this component:
–
Performance knowledge base and rules compiler
–
Performance analysis and reports
–
Real-time displays of performance data
–
Graphing
–
Data export facility
The common utilities that are shared by all components provide the capability
for managing and interrogating the files in the database. These include a
workload parameter editor, a schedule file editor, a data archive, and a data
file dump utility.
Performance Manager
To deal with system performance effectively, you must understand the
workload and the capabilities and limitations of system resources. Generally,
any attempt to improve system performance requires specific performance
goals stated in measurable terms.
Performance Manager provides the tools you need to analyze, graph, and
present performance data on standalone systems or clusters running
OpenVMS. Performance Manager analyzes statistics and parameters collected
by Performance Manager from each node in a configuration to determine
whether specific conditions are contributing to system performance
degradation. Based on its findings, Performance Manager recommends ways to
improve system performance and provides evidence to support its conclusions.
Performance Manager can organize your information into several different
reports that can do the following actions:
■
Identify system resource limitations when they exist for the workload
■
Identify system parameter settings that may be adding to system
overhead or degrading system performance
■
Evaluate trends in system performance
■
Evaluate the effects of changes in workload and configuration
characteristics
14 Performance Manager Administrator Guide
Performance Manager Features
Performance Manager Features
Performance Manager has the following major features:
■
Performance knowledge base and rules compiler
■
Performance analysis and reports
■
Real-time displays of performance data
■
Graphing
■
Data export facility
Knowledge Base and Rules Compiler
The Performance Manager knowledge base consists of rules and thresholds
used to evaluate system performance. The rules, provided at installation time,
are known as factory rules. When Performance Manager produces an Analysis
Report, by default it uses the factory rules.
Performance Manager also provides the capability to define your own rules.
User-defined rules are identified using a text editor to create a file that
contains rule definitions. The chapter Customizing the Knowledge Base (see
page 135) explains the syntax of user-defined rules. In addition to writing new
rules, you can disable any factory rules.
After you define your site-specific rules, you must compile them before
Performance Manager can use them. The compiled version of your rules is
called an auxiliary knowledge base. After the rules have been compiled, they
can be used, along with Performance Manager factory rules, to create an
Analysis Report. You can have an auxiliary knowledge base used
automatically or can specify it when requesting an Analysis Report.
Analysis and Reporting Facility
The analysis and reporting facility generates the Analysis Report, the Brief
Analysis Report, the Performance Evaluation Report, the Tabular Report and
histograms. The Analysis Report identifies the effects of system parameter
settings, hardware configurations, workload mixes, and applications when they
degrade the performance of individual nodes in the cluster or the entire cluster
system. Conclusions and recommendations are based on data collected.
The Brief Analysis Report is a synopsis of the Analysis Report. It contains a
one-line description of each rule fired. For more detail, produce a full Analysis
Report.
Chapter 1: Introduction 15
Performance Manager Features
You can also request a Performance Evaluation Report or Tabular Report to
help you determine improved or degraded system performance. You can also
request histograms that consist of chronological charts that show peak
resource use. You can select a specific set of items (disks or processes) for
reporting.
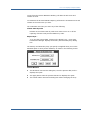
The ADVISE PERFORMANCE REPORT command invokes analysis of
performance data to generate Performance Manager reports.
You can specify five types of reports:
■
Analysis Report-Consists of conclusions for each node and includes
cluster-wide conclusions for a clustered system. You can request the
conditions that caused a rule to fire and the supporting evidence.
■
Brief Analysis Report-Is a brief version of the analysis report. It includes
a one-line synopsis of each rule firing.
■
Histograms-Consists of chronological charts that show peak resource use.
■
Performance Evaluation Report-Consists of metrics for measuring
performance improvement or degradation. Use these metrics to evaluate
the recommendations made by Performance Manager and to measure
results against baseline models.
■
Tabular Report-Provides a consolidated summary of some of the
performance metrics related to system-wide activity, process activity and
disk activity.
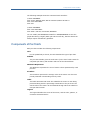
Generating Daily Reports Automatically
You can generate daily reports automatically by submitting a Performance
Manager batch command procedure at night. The Performance Manager
software kit contains a sample daily command procedure
(PSPA$EXAMPLES:PSPA$DAILY.COM) that you can use as a template. You can
use the OpenVMS Mail Utility to send the brief analysis to you directly.
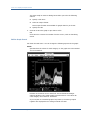
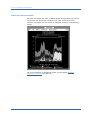
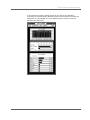
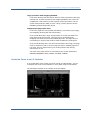
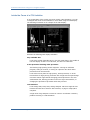
Real-time Displays of Performance Data
The real-time feature provides continuously updated displays of data.
You can produce and customize three-dimensional bar graphs, strip charts and
digital meters to evaluate and investigate performance data using Performance
Manager Motif real-time display.
16 Performance Manager Administrator Guide
DECwindows Interface
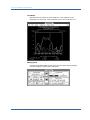
You can also produce tabular and graphical displays to evaluate and
investigate performance data by using the Character Cell interface with
optional ReGIS graphics.
Using Playback mode, you can view displays of data recorded earlier in either
a continuous flow or step mode.
Graphing Facility
To graph chronologically any group of metrics stored in the database, use the
ADVISE PERFORMANCE GRAPH command to produce a wide range of
predefined graphs. You can also define your own custom graphs if the
predefined graphs do not meet your specific needs. You can select a specific
set of items (disks or processes) for graphing. For more information on
graphing see the chapter Generate Historical Graphs (see page 107).
Data EXPORT Facility
The performance data from Performance Manager files can be written out to a
file for subsequent processing with third-party software tools. The desired
classes of data, as well as the time period of interest can be specified. The
data can be averaged into a series of records representing whatever time
interval the user wishes, as long as it is a multiple of the collection interval.
For instance, data collected every two minutes can be averaged into half hour
records. You can select a specific set of items (disks or processes) for output.
An ASCII or binary file can be created. Either daily or archived data can be
exported.
DECwindows Interface
Performance Manager includes DECwindows Motif Interfaces for real-time
displays and for analysis and graphing. These interfaces are installed only if
the necessary windowing libraries are found in SYS$LIBRARY and the
necessary DECwindows directories are accessible.
Chapter 1: Introduction 17
What to Expect from Performance Manager
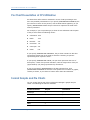
What to Expect from Performance Manager
Performance Manager analyzes collected system data required for determining
whether a specific resource is causing a performance problem. The data
collected at your site may cause Performance Manager rules to fire. To fire
means that when all the data has been processed, Performance Manager
examines the count of a rule's occurrences, and if there are enough
occurrences for a particular rule, that rule is said to fire. This causes an entry
for that rule to be placed in the report file in the form of a conclusion.
However, you can modify or disable Performance Manager rules or threshold
values, which govern performance analysis.
When you request an Analysis Report, you may receive advice about
performance problems for some of the following reasons:
■
Inefficient setting of SYSGEN or UAF parameters
■
Excessive demand
■
Excessively long device queues
■
Insufficient system resources
■
Inefficient application design
■
Insufficient hardware for the workload
Before you follow any Performance Manager recommendations, ask the
following questions:
■
Is the problem caused by a temporary condition?
Performance Manager does provide summary analysis for extended time
periods, such as weeks or months.
■
How frequently does the problem occur?
■
Is there a difference in the workload before and during the time the
problem occurs? (Occasionally, the problem may be caused by the
inherent characteristics of an application or workload.)
If Performance Manager recommends that you need additional hardware, keep
track of this recommendation over a period of time. If system performance
degrades, this recommendation occurs more frequently. You must decide
whether the problem is serious enough to warrant additional hardware.
18 Performance Manager Administrator Guide
What to Expect from Performance Manager
Never rely solely on Performance Manager recommendations. As you become
familiar with the workload on your system, you develop your own ideas on
how to recognize and alleviate performance problems. Use the Performance
Manager as a tool to help you discover and resolve performance problems.
Although you need the information Performance Manager provides for
investigating any perceived performance problem, this information is not
infallible. Occasionally, Performance Manager recommendations do not
improve performance. Additional expertise, analysis, hardware, and tuning
may be required to solve a specific performance problem.
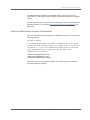
Cross-Platform Support
If you run Performance Analysis across platforms between r3.1 and a VAX or
Alpha system running prior releases of Performance Agent, you need to be
aware of the following situations:
■
CA does not support using an older Performance Manager (r3 or older)
with the new Performance Agent (r3.1).
■
The Performance Manager r3.1 runs performance analysis on Alpha and
VAX data from prior releases. However, the results might be different from
those generated on prior releases due to the updated and new rules.
■
The VAX Performance Manager does not analyze r3.1 data.
Chapter 1: Introduction 19
Chapter 2: Analyze Performance
This chapter contains example Performance Manager Analysis Reports and
information to help you interpret them. The chapter Performance Manager
Commands (see page 175) explains how to generate these reports.
This section contains the following topics:
Analysis Reports (see page 21)
Brief Analysis Reports (see page 30)
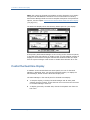
Analysis Reports
When you request an Analysis Report, the Performance Manager analyzes data
for the requested time period and nodes against the rules in the knowledge
base.
The Analysis Report consists of conclusions for each node and includes
cluster-wide conclusions for a cluster system. Each conclusion is caused by a
rule firing. When a rule fires, the Performance Manager reports the problem
condition and makes a recommendation for improving performance. All rules
are identified with a unique five-character alphanumeric code, such as
{M0010}. A rule identifier appears with each conclusion.
In addition to the conclusions, you can request that the Performance Manager
list the rule conditions that satisfied the rule firing. The Performance Manager
also provides supporting evidence. By default, the Performance Manager
provides conditions and evidence when you specify an output file or when you
run the analysis process in batch mode. To suppress the conditions and
evidence in the report, use the /NOEXPLAIN qualifier.
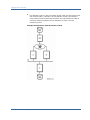
The conclusions in the Analysis Report for a cluster system are listed in the
following order by node:
■
Each node's local analysis and conclusions, which may include the
following conclusions:
–
■
Memory-related
I/O-related
–
CPU-related
–
Miscellaneous
–
Auxiliary
Chapter 2: Analyze Performance 21
Analysis Reports
■
Cluster-wide analysis and conclusions, which may include the following
conclusions:
–
HSC limitation
–
Disk-related
–
Lock-related
–
Auxiliary
If you request a Performance Evaluation Report along with an Analysis Report,
the performance data for each node follows that node's local analysis. The
performance data for the cluster appears after the cluster-wide analysis.
Factory analysis reports can be produced only from data collected by the
primary data collector, namely that which is associated with the CPD
definition.
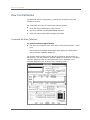
Interpret the Analysis Reports
This section explains excerpts from example Analysis Reports. The explanation
follows each excerpt.
The header at the top of each page in the report includes the version number
of the Performance Manager used to generate the report. This version number
does not necessarily correspond to the version number of the Performance
Agent that collected the data being analyzed.
22 Performance Manager Administrator Guide
Analysis Reports
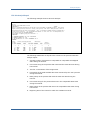
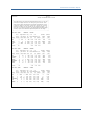
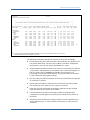
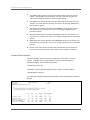
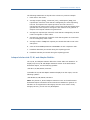
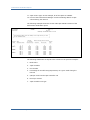
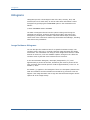
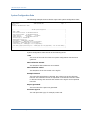
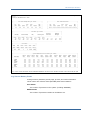
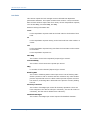
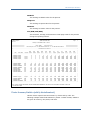
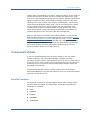
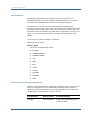
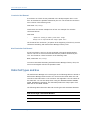
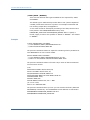
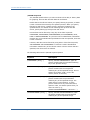
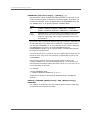
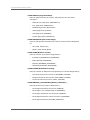
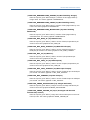
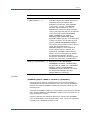
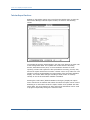
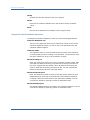
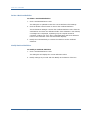
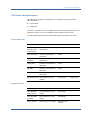
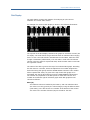
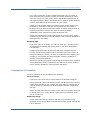
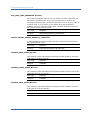
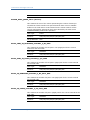
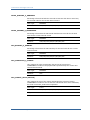
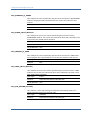
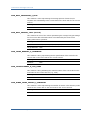
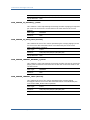
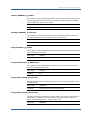
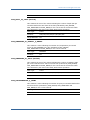
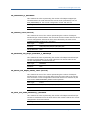
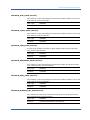
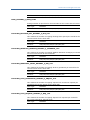
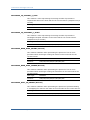
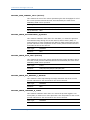
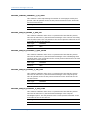
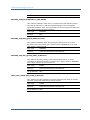
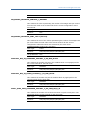
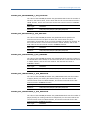
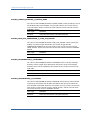
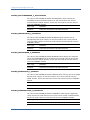
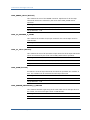
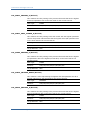
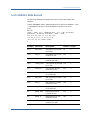
Memory Rule Report
The following example shows a Memory Rule report:
Full Analysis
PA
NODE01 (VAXstation 3100)
Page
1
Vx.x
Thursday 20-FEB-1997 00:00 to 23:59
CONCLUSION 1.
While excessive page faulting was occurring, there were some users running images which
seemed to want more memory than their WSEXTENTS allowed. If the WSEXTENTS for these
users were larger, there may have been less page faulting.
Increase the WSEXTENT for the following users.
If batch queue settings for working
set extents are causing the limitation, increase those.
If detached processes are
causing the problem, increase the working set extents specified in either the
"RUN/PROCESS" commands, or the calls to the $CREPRC System Service or LIB$SPAWN Runtime
Library Routine. As a last resort for detached processes, increase the
PQL_DWSEXTENT SYSGEN parameter if it is responsible for establishing the working set extent
value for the detached process.
Total number of users needing an increase :
2
User name(s)
-----------SMITH
CORREY
CONDITIONS
1.
SOFT_FAULT_RATE .GE. 100.00 * SOFT_FAULT_SCALING .OR. HARD_FAULT_RATE .GE. 10.00 *
HARD_FAULT_SCALING
2. IMAGE_ACTIVATION_RATE .LT. 0.50 * IMG_ACT_RATE_SCALING
3. SYSGEN_MPW_HILIMIT + SYSGEN_FREEGOAL .LT. MEMORY_PAGES_NOT_ALLOC_TO_VMS * ( 0.04 +
PAGES_ON_FREELIST .GE. SYSGEN_FREEGOAL .OR. HARD_FAULT_RATE .GE. 10.00 *
HARD_FAULT_SCALING
4. SYSGEN_MPW_HILIMIT + SYSGEN_FREEGOAL .GE. MEMORY_PAGES_NOT_ALLOC_TO_VMS * 0.05 .OR.
SOFT_FAULT_RATE .GE. 100.00 * SOFT_FAULT_SCALING
5. PROCESSES_NEED_MORE_EXTENT .EQ. 1.00
6. OCCURRENCES .GE. 1
EVIDENCE
Working Set Time range
Avg
Image
Faults
Avg sz
No
User
------------ (batch jobs
Image
W.Set flts/ ----------of Free of
Name
Quota Extent
are flagged) Name
Size cpusc Hrd
Soft
List
Tims
--------------------------------------------1
2
3
4
5
6
7
8
SMITH
200
200
11:34-13:34 LOGINOUT
163
288
1 288 12262
4
11:34-15:14
TEST31
195
268
0 268 12468
5
11:34-13:30
SET
179
363
2 363 12765
2
CORREY
2048
4000 (batch)
13:16-13:18
TEST33
4000
2046
0 2046
11162
0.05 ).OR.
---9
10
2
Chapter 2: Analyze Performance 23
Analysis Reports
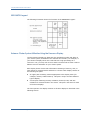
The following statements are keyed to the columns in the previous Memory
Rule report:
1.
User name associated with a process.
2.
Working set quota and working set extent.
3.
Time range for which selected image records for this process are
summarized.
4.
The first 12 characters of the image name string associated with the user's
process.
5.
Average working set size (in pages) for the user's process while running
the specified image.
6.
Total number of page faults for the user's process while running the
specified image, divided by the CPU seconds for the same period.
7.
Average system-wide hard page fault rate during the major sampling
intervals when the user's process ran the specified image.
8.
Average system-wide soft page fault rate during the major sampling
intervals when the user's process ran the specified image.
9.
Average size of the free page list (in pages) during the periods when the
user's process ran the specified image.
10. Number of times that a Performance Manager process or image record
supports the evidence.
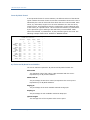
In the previous Memory Rule report example, the total number of page faults
per CPU second are in the range of 268 to 363 for user Smith, and 2046 for
user Correy. This high rate of page faulting probably contributed to the
system-wide soft page fault rate (ranging from 106 to 791), which exceeded
the threshold of 100. This occurred 13 times (4+5+2+2) because Smith's
WSEXTENT was too low at the current value of 200 and Correy's WSEXTENT
was too low at its value of 4000.
24 Performance Manager Administrator Guide
Analysis Reports
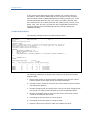
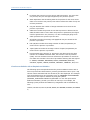
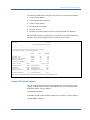
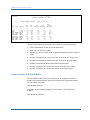
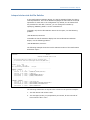
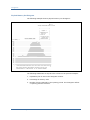
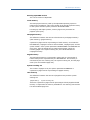
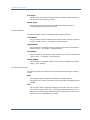
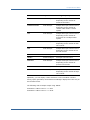
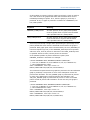
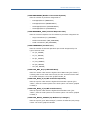
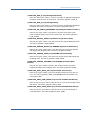
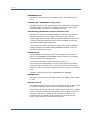
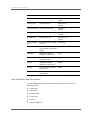
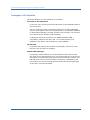
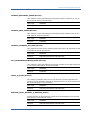
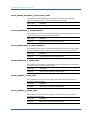
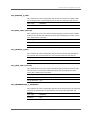
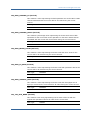
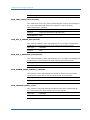
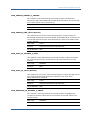
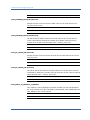
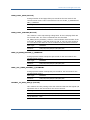
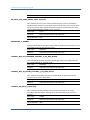
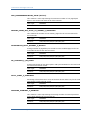
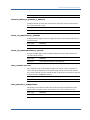
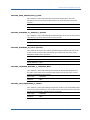
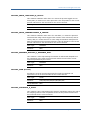
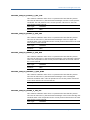
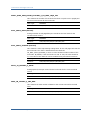
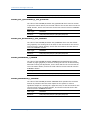
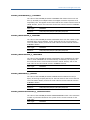
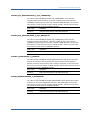
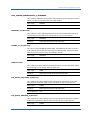
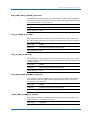
CPU Rule Analysis Report
The following example shows a CPU Rule analysis:
Full Analysis
SUPPLY (VAX-11/780)
Page
2
PA Vx.x
Saturday 01-OCT-2006 00:00 to 23:59
CONCLUSION 2.
{C0010}
There is an apparent bottleneck at the CPU due to the large number of COM/COMO processes. There exists
higher priority process(es) which are causing lower priority COM and/or COMO processes to wait for
the CPU which may be the cause of the problem.
This is considered a LOCKOUT condition. Examine and or
review process priorities.
For an equitable distribution of CPU time over the COM processes, be
sure they all have the same BASE PRIORITY.
Total number of samples giving this conclusion: 4
CONDITIONS
1. COMPUTABLE_PROCESSES .GE. 5.00 * COM_SCALING
2. PRIORITY_LOCKOUT .EQ. 1.00
3. TOP_CPU_PROC_CPU .GT. 7.00 4. OCCURRENCES .GE. 4
EVIDENCE
# Proc
Process receiving most CPU
COM Process
in COM
----------------------------------------------Time of
or COMO USERNAME
IMAGE
%CPU PRIB USERNAME
PRIB
occurrence
----------------- --------- ---- ---- ------------ ---- ---------------1
2
3
4
5
6
7
8
8
SMITH
GAME
83
8 JONES
4
1-OCT 00:04:00
20
JOHN
TIME
83
8 DOE
4
1-OCT 00:06:00
20
TOM
LIFE
83
8 MACK
4
1-OCT 00:08:00
20
JERRY
MEGA
83
8 HALL
4
1-OCT 00:10:00
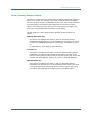
The following statements are keyed to the columns in the previous CPU Rule
analysis report:
1.
Average number of processes in computable or computable outswapped
state during the interval.
2.
User name string of the process that consumed the most CPU time during
the interval.
3.
The first 12 characters of the image name.
4.
Percentage of the total available CPU time consumed by the user's process
during the interval.
5.
Base priority of the process that used the most CPU time during the
interval.
6.
User name string for the process that was in the computable state most
during the interval.
7.
Base priority of the process that was in the computable state most during
the interval.
8.
Beginning time of the interval in which the condition occurred.
Chapter 2: Analyze Performance 25
Analysis Reports
In the previous CPU Rule analysis report example, the average number of
processes in either COM or COMO state is five or greater on four occasions,
with the actual number of COM/COMO processes ranging from 8 to 20. These
blocked computable processes (for users Jones, Doe, Mack, and Hall) each
have a base priority of 4. Other processes with a base priority of 8 (for users
Smith, John, Tom, and Jerry) prevent the other computable processes from
executing because of their elevated base priority, thereby creating the
LOCKOUT condition.
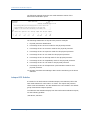
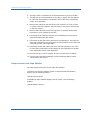
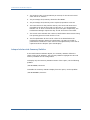
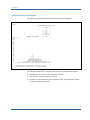
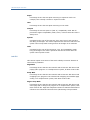
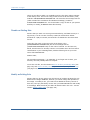
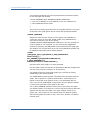
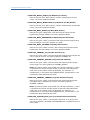
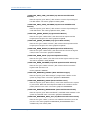
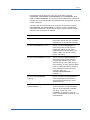
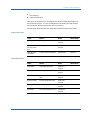
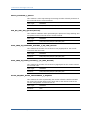
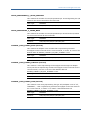
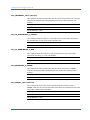
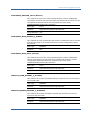
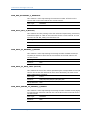
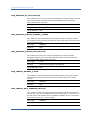
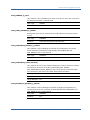
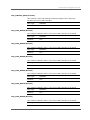
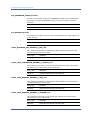
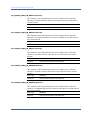
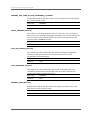
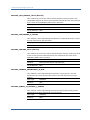
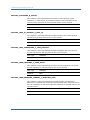
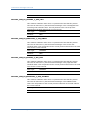
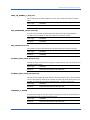
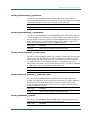
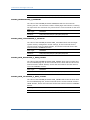
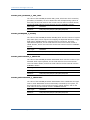
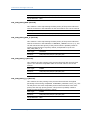
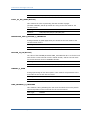
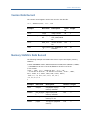
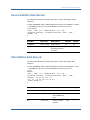
I/O Rule Analysis Report
The following example shows an I/O Rule analysis report:
Full Analysis
SUPPLY (VAX-11/780)
Page
3
PA Vx.x
Saturday 01-OCT-2006 00:00 to 23:59
CONCLUSION 3.{I0060}
Swapping or modified page writing is creating an excessive load on the noted disk. This may be a
memory related problem, however if the swapping file is on a shared system disk, the situation can
be improved by moving it to a less utilized disk.
Total number of samples supporting this conclusion: 4
CONDITIONS
1.
ANY_DISK_OVER_QL_THRESHOLD .EQ. 1.00
2.
PERCENT_CPU_TIME_IN_FILE_SYSTEM .LT. 30.00
3.
EXEC .LT. 35.00
4.
DISK_SWAPPING_IO_RATE ( DISK_OVER_QL_THRESHOLD_X ).GT. DISK_IO_RATE ( DISK_OVER_QL_THRESHOLD_X ) /
.00
5.
OCCURRENCES .GE. 4
EVIDENCE
Volume w/Highest Queue Length
%tim %tim
-------------------------------------------- file EXEC
Name
IOs/sec Pag.IOs/sec Swp.IOs/sec sys. mode Time of occurrence
------------ ------- ----------- ----------- ---- ---- -----------------1
2
3
4
5
6
7
BRANDY1
34
5
20
10
10
1-OCT 09:04:00
BRANDY1
29
3
23
8
9
1-OCT 09:06:00
BRANDY1
31
5
22
3
3
1-OCT 09:08:00
BRANDY1
32
4
27
11
0
1-OCT 09:10:00
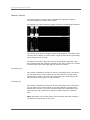
The following statements are keyed to the columns in the previous I/O Rule
Analysis report:
1.
Name of the volume on which excessive swapping occurred. This volume
had the highest queue length during the interval exampled.
2.
Average number of I/Os per second to the volume from the node currently
being analyzed (SUPPLY).
3.
Number of paging I/Os per second to the volume. The value of paging I/Os
per second is a subset of the total I/Os per second as described above.
4.
Number of swapping I/Os per second to the volume. This value is also a
subset of the total I/Os per second.
5.
Percentage of CPU time spent in the file system.
6.
Percentage of CPU time spent in executive mode.
7.
Beginning time of the interval in which the condition occurred.
26 Performance Manager Administrator Guide
Analysis Reports
In the previous example I/O Rule Analysis report, the disk queue length on
volume BRANDY1 exceeded its threshold on four occasions during the
reporting interval. In each occurrence, less than 30 percent of the CPU time
was spent in the file system and less than 20 percent of the CPU time was
spent in executive mode. Swapping I/Os per second have values of 20, 23, 22,
and 27, thereby contributing to more than 50 percent of the total operations
to volume BRANDY1.
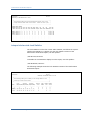
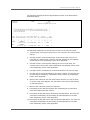
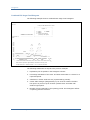
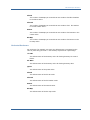
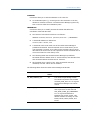
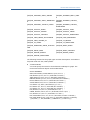
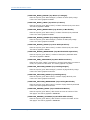
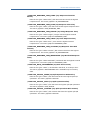
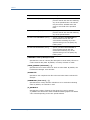
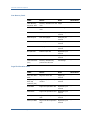
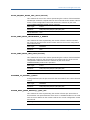
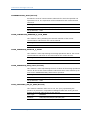
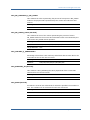
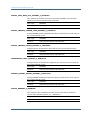
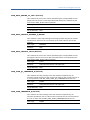
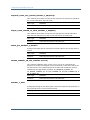
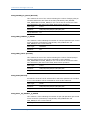
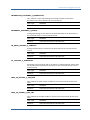
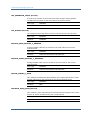
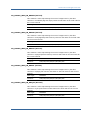
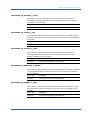
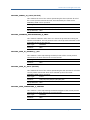
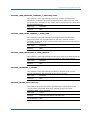
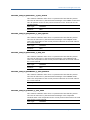
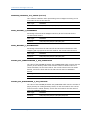
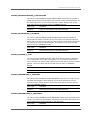
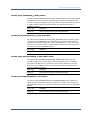
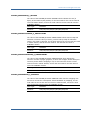
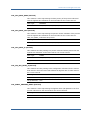
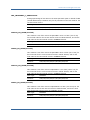
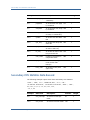
Miscellaneous Rule Analysis Report
The following example shows a Miscellaneous Rule Analysis report:
Full Analysis
SUPPLY (VAX-11/780)
Page
4
PA Vx.x
Saturday 01-OCT-2006 00:00 to 23:59
CONCLUSION 4.
{R0010}
The system fault rate for VMS is over 2 faults per second for the following time periods.
Performance can be improved for the whole system if the VMS fault rate can be reduced.
Increase the working set size for VMS (SYSMWCNT) to reduce the system fault rate. Do this by adding
an entry in MODPARAMS.DAT similar to "ADD_SYSMWCNT = 100", and running AUTOGEN.
The "100" is
just an initial guideline.
Total number of samples giving this conclusion:
Current setting of this system parameter: 730
CONDITIONS
12
1. SYSTEM_FAULT_RATE .GE. 3.00
2. OCCURRENCES .GE. 4
EVIDENCE
System fault
rate
-----------1
5
5
5
5
5
5
5
5
5
5
5
5
Time of occurrence
------------------
1-OCT
1-OCT
1-OCT
1-OCT
1-OCT
1-OCT
1-OCT
1-OCT
1-OCT
1-OCT
1-OCT
1-OCT
2
00:04:00
00:54:00
02:02:00
02:10:00
10:20:00
10:44:00
11:08:00
13:26:00
15:12:00
15:36:00
16:20:00
16:34:00
Chapter 2: Analyze Performance 27
Analysis Reports
The following statements are keyed to the columns in the Miscellaneous Rule
analysis report:
1.
Average number of times per second that a page fault (hard or soft)
occurred for the OpenVMS system working set.
2.
Beginning time of the interval in which the condition occurred.
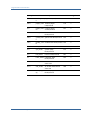
Analysis Summary Report
The following example shows an Analysis Summary report:
Full Analysis
SUPPLY (VAX-11/780)
Page
5
PA Vx.x
Saturday 01-OCT-2006 00:00 to 23:59
ANALYSIS SUMMARY
for node SUPPLY
Number of Records Processed.......................720 1
Number of Records satisfying rule conditions......33
2
Number of Records not satisfying rule conditions..687 3
Number of Conclusions.............................4
4
The following statements are keyed to the rows in the previous Analysis
Summary report:
1.
Number of Performance Manager records analyzed for the specified
reporting period.
2.
Number of Performance Manager records that satisfied rule conditions.
This number does not necessarily equal the number of rules that fired, due
to rule threshold values. Although a record may satisfy a rule condition,
the number of occurrences required to fire the rule may not be sufficient
during the reporting period.
3.
Number of Performance Manager records that did not satisfy any rule
conditions.
4.
Number of conclusions generated for the node being analyzed.
Although records may have satisfied a specific rule, the number of occurrences
of records satisfying a specific rule may not have reached the occurrence
threshold. This means the number of conclusions may be zero while the
number of records satisfying the rule conditions is greater than zero.
28 Performance Manager Administrator Guide
Analysis Reports
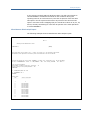
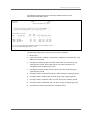
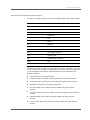
Cluster Rule Analysis Report
The following example shows a Cluster Rule analysis report:
Full Analysis
CLUSTER
Page
6
PA Vx.x
Saturday 01-OCT-1996 00:00 to 23:00
CONCLUSION 1.
Queues are
form.
forming
on
heavily
used
disks.
{L0050}
Longer delays will be experienced when longer queues
Suggested Remedies:
1.
If the disk is fragmented (use the command $ ADVISE
order to check on this), backup and restore the disk using
/PHYSICAL qualifier.
2.
If possible, assign all new work during the noted
3.
If possible, attempt to lower the future usage of
Volume name(s)
-------------PROBLEM_DISK
COLLECT REPORT DISK_SPACE devicename in
the BACKUP utility without the
times to other disk volumes.
the noted disk volumes.
Number of Samples
----------------4
CONDITIONS
1.
DISK_QUEUE_AT_SERVER .GE. 1.00 .OR. ( MAXIMUM_DISK_QUEUE .GE. 1.00 AND.DISK_IS_SERVED .EQ.
0.00 )
2.
CW_DISK_IO_RATE .GE. DISK_IO_RATE_THRESHOLD .OR. CW_DISK_THRUPUT_RATE .GE.
DISK_THRUPUT_RATE_THRESHOLD
3.
OCCURRENCES .GE. 1
EVIDENCE
Disk Volume
Srv Node
Time of Occ
Shdw Rbld
\
Avg I/O
Avg
IO Sz
\Src Node
per
sec Que Pages
Hottest File
-------------------------------------------------------------------------------1
2
3
4
PROBLEM_DISK MARCUS
25-JUN 00:06:00
*
5
6
7
8
9
SUPPLY
25.80 2.17
6.0 [PSCP]PSCP010.B;9
DEMAND
32.80 1.64
16.0 [PSALL]BIGFILE.DAT
PROBLEM_DISK MARCUS
25-JUN 00:12:00
SUPPLY
20.59 1.60
5.6 [PSDC]PSDC010.B;21
DEMAND
16.55 1.73
5.6 [PSDC]PSDC010.B;21
PROBLEM_DISK MARCUS
25-JUN 00:16:00
SUPPLY
28.59 1.64
5.6 [PSDC]PSDC010.B;21
DEMAND
31.33 1.87
6.3 [PSPA]PSPA010.B;14
PROBLEM_DISK MARCUS
25-JUN 00:26:00
SUPPLY
24.59 1.55
5.6 [PSDC]PSDC010.B;21
DEMAND
29.58 1.97
6.2 [SMITH.WORK.PSCP]PSCP$MAIN.EXE;67
The following statements are keyed to the previous Cluster Rule analysis
report example:
1.
Name of the disk experiencing heavy use.
2.
Name of the node that actually services requests.
3.
Beginning time of the interval in which the condition occurred.
4.
An asterisk indicates that a disk is a shadow set and the disk underwent a
COPY operation.
Chapter 2: Analyze Performance 29
Brief Analysis Reports
5.
Name of the node in the cluster that shares the heavily used disk.
6.
Average number of operations per second to the volume, during the given
interval, by the contributing node.
7.
Average size of the queue during the interval exampled, measured by the
number of requests.
8.
Average size, in pages, of all I/O requests during the interval.
9.
When hot file data exists, the hottest file (highest I/O rate)is listed.
In the previous Cluster Rule analysis report example, the queue length on
volume PROBLEM_DISK exceeds the value of 1.0 on four occasions. During
those four occasions, the total operations per second for each interval
exceeded the device threshold.
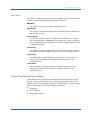
Brief Analysis Reports
The Brief Analysis Report is a synopsis of the Analysis Report. It contains the
following information:
■
Rule identifiers.
■
The percentage of time there were instances of rule occurrences during
the reporting period. This field is blank if the rule reflects an analysis of a
summary of the over-all analysis period.
■
The number of records supporting the rule occurrence. This field is blank if
the rule reflects an analysis of a summary of the over-all analysis period.
■
A brief (one line) synopsis of the problem statement.
The Brief Analysis Report provides a synopsis for each node in the cluster
system, followed by a cluster-wide synopsis.
Until you are familiar with the long version of the conclusions, you should not
rely solely on the Brief Analysis Report. In many instances, the one-line
synopsis is not sufficient to convey the meaning of the problem.
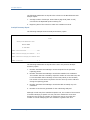
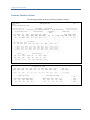
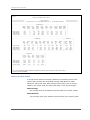
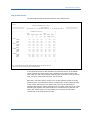
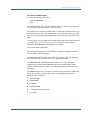
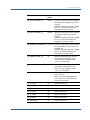
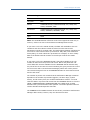
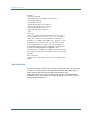
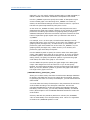
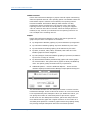
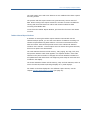
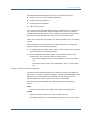
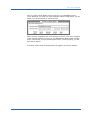
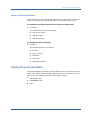
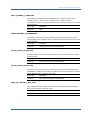
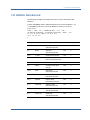
Interpret the Brief Analysis Report
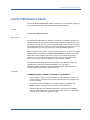
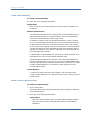
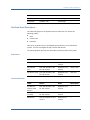
The following example is an example of a Brief Analysis Report. A description
of each item in the report headings follows the example.
30 Performance Manager Administrator Guide
Brief Analysis Reports
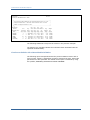
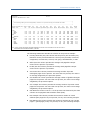
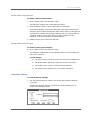
The following statements are keyed to the columns in the report example:
1.
Rule identifier.
2.
For this reporting period, the percentage of time that the conditions of a
rule were satisfied.
3.
Number of records satisfying rule occurrences.
Rules in Summary domain do not provide data in columns 2 and 3 because
their conditions are based on data averaged over the entire analysis period.
Brief Analysis
CLUSTER
Page
1
PA Vx.x
Saturday 01-OCT-2006 00:00 to 23:00
NODE: DEMAND
ID %oftime Recds
----- ----- ---1
2
3
M0010
0.3
1
M0500
0.3
1
R0270
0.6
2
I0160
1.2
4
R0070
R0300
0.3
1
One Line Description
-----------------------------------Application program pagefaults very heavily.
Heavy paging, increase the working set extent for user(s).
Process(es) hung in AST. (See full report.)
Window turns are too high, alleviate file fragmentation.
More resources than hash table entries; increase RESHASHTBL.
Lots of contention for distributed locks.
Summary for DEMAND: 6 rules fired; of 337 records, 8 satisfied conditions.
NODE: SUPPLY
ID %oftime Recds
----- ----- ---R0095
6
22
R0300
0
1
One Line Description
-----------------------------------Low hit ratio, high attempt rate on the file header cache.
Lots of contention for distributed locks.
Summary for SUPPLY: 2 rules fired; of 338 records, 23 satisfied conditions.
Summary for VOLTY: 0 rules fired; of 337 records, 1 satisfied conditions.
ID %oftime Recds
----- ----- ---L0050
1
CLUSTER
One Line Description
-----------------------------------I/O bottleneck on disk; reduce or redistribute load.
Summary for CLUSTER:
1 Rules fired.
Chapter 2: Analyze Performance 31
Chapter 3: Evaluate Performance in
Detail
This chapter contains example Performance Manager statistical reports and
information to help you interpret them. For more information about obtaining
Performance Manager reports, see the chapter Performance Manager
Commands (see page 175).
This section contains the following topics:
Performance Evaluation Report (see page 33)
Histograms (see page 64)
Tabular Report Sections (see page 71)
Performance Evaluation Report
The Performance Evaluation Report provides statistics on system use,
component use, and process activity. It also provides metrics for performance
improvement or degradation, to use when evaluating the impact of
recommendations made by the Performance Manager.
The Performance Evaluation Report has the following sections:
■
Process statistics by primary and secondary keys
■
Pool statistics
■
CPU mode statistics
■
SCS statistics
■
Lock statistics
■
CI, NI, and adapter statistics
■
Disk statistics
■
Tape statistics
■
Hot file statistics
■
Summary of node's CPU and memory statistics
■
Histograms of CPU and memory utilization, and terminal and disk I/O
Chapter 3: Evaluate Performance in Detail 33
Performance Evaluation Report
To display the Performance Evaluation Report, specify the ADVISE
PERFORMANCE REPORT PERFORMANCE_EVALUATION command. The /FILTER
qualifier lets you select a subset of data for reports. For more information, see
the chapter Performance Manager Commands (see page 175).
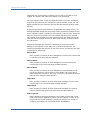
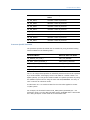
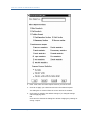
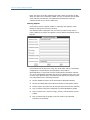
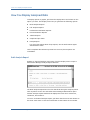
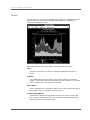
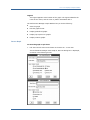
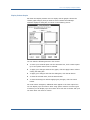
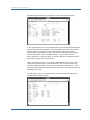
Interpret the Process Statistics
The following example illustrates the default process statistics section of the
Performance Evaluation Report.
The /PROCESS_STATISTICS qualifier allows you to tailor the process statistics
section of the Performance Evaluation Report. You can specify the focus of the
report to obtain different sets of statistics that pertain to the focus area. The
grouping, merging, and sorting of the process data is controlled with the
primary and secondary key settings.
The following list shows the primary and secondary keys:
■
MODE
■
USERNAME
■
IMAGENAME
■
UIC_GROUP
■
PROCESS_NAME
■
WORKLOAD_NAME
■
ACCOUNT_NAME
■
PID
For more information on how to specify the /PROCESS_STATISTICS qualifier,
see the chapter Performance Manager Commands (see page 175).
To display only the process statistics section of the Performance Evaluation
Report, use the following qualifier:
/INCLUDE=PROCESS_STATISTICS
To disable the process statistics display from the Performance Evaluation
Report, use the following qualifier:
/INCLUDE=NOPROCESS_STATISTICS
Because process classification by PID or PROCESSNAME results in virtual
memory requirements, these reports keys are disabled by default and require
you to specifically enable them. For more information on virtual memory
requirements, see the appendix Estimate Virtual Memory Needs (see
page 535).
34 Performance Manager Administrator Guide
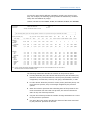
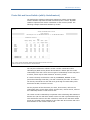
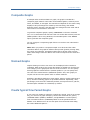
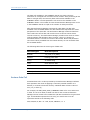
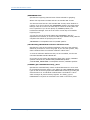
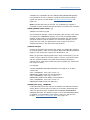
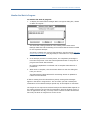
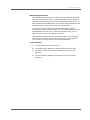
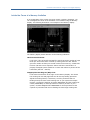
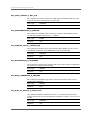
Performance Evaluation Report
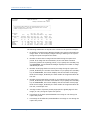
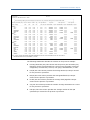
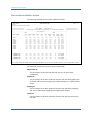
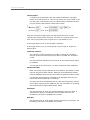
The following example shows a Performance Evaluation Report, Process
Statistics by Image for Interactive, Batch, Detached, and Network Jobs:
Performance
Evaluation
YQUEM (VAX 6000-440)
Page
1
PA Vx.x
Tuesday 26-JAN-1997 09:00 to 10:00
+--------------------------------------------------------------------+
| The table below lists observed workload characteristics of all the |
| interactive images that were run during the given interval. Note
|
| that Diskio, Bufio and Cputim are percentage contributions of the |
| respective images to the total system load. Working set size and |
| working set faults are the average for the respective images. In |
| the case of 0 image activations, the Uptime/image and Cputim/image |
| actually report the cumulative Uptime and Cputim for the image.
|
+--------------------------------------------------------------------+
Node Name: YQUEM
MODE:
INTERACTIVE
# of
Page Faults Avg. % of
% of
activ- per Actvtn
Ws
Direct Buffered % of
Image
ations -Soft--Hard size
I/O
I/O
Cputim
-------- ------- ------ ---- ------ ------ ------ -----1
2
3
4
5
6
7
8
(dcl)
0
830
0
492
0.05
0.23
0.11
ACS
1
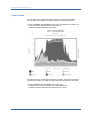
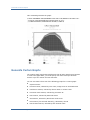
242
13
818
0.00
0.01
0.00
CDU
1
8531
5
2168
0.01
0.01
0.01
CLR
1
68
7
345
0.00
0.01
0.00
CMS
5
522
31
509
0.12
0.13
0.06
COPY
5
124
3
540
0.33
0.15
0.02
DEBUGSHR
2
1739
44
1938
0.01
0.06
0.03
DECPRESENT
2
17125 138
5185
2.34
4.04
1.95
.
.
.
.
.
.
.
.
.
.
.
.
.
.
.
.
.
.
.
.
.
.
.
.
.
.
.
.
.
.
.
.
VMOUNT
1
107
13
520
0.00
0.18
0.00
VMSHELP
4
132
7
660
0.04
0.11
0.01
VTX$CLIENT_C
3
540
20
916
0.13
0.17
0.03
---------- ------- -----Totals
197
24.70
29.94 12.30
11
12
13
14
Uptime/
image
(sec)
------9
142470
2
3
6
48
16
724
1774
.
.
.
.
361
31
98
Cputim/
image
(sec)
-------10
16.54
0.29
2.00
0.36
1.59
0.43
2.10
140.73
.
.
.
.
0.62
0.40
1.62
Chapter 3: Evaluate Performance in Detail 35
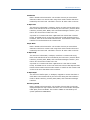
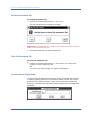
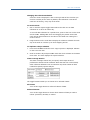
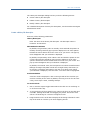
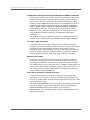
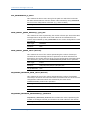
Performance Evaluation Report
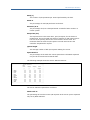
Performance
Evaluation
YQUEM (VAX 6000-440)
Page
PA Vx.x
Tuesday 26-JAN-1997 09:00 to 10:00
5
+------------------------------------------------------------------------+
| The following table summarizes the workload characteristics on a per
|
| image activation basis. Note that values would be zeros if total
|
| number of image activations is zero.
|
+------------------------------------------------------------------------+
PrimaryKey:
Mode
Secondary Key:
None
-------------15
INTERACTIVE
BATCH
NETWORK
DETACHED
# of
processes
activ/inact
----- ----16
17
32
53
1
1
5
2
31
38
Avg.
Avg.
Soft
WSiz/ flts/
image image
----- ----18
19
1905 830.8
4144
0.0
671 367.4
1855 1592.0
Avg.
Avg.
Hard Direct
flts/ IO/
image image
----- -----20
21
15.7 122.8
0.0
0.0
4.6
35.0
9.0 5295.3
Avg.
Buff'd
IO/
image
-----22
473.3
0.0
114.9
15542
Avg.
Images
Cputim/
per
image
Second
------- -------23
24
8.99
0.0547
0.33
0.0000
1.19
0.0389
124.73
0.0036
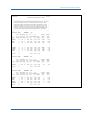
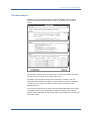
The following statements are keyed to the columns in the previous example:
1.
By default, the Performance Manager displays the process information by
image name. In this example, images running or waiting on the system
during the report time period are shown.
2.
Number of times that an image was activated during the report time
period. If an image has zero activations, than it has been activated
previously (before the reporting period). If you specify the secondary key
as USERNAMES, the Performance Manager displays the number of image
activations per user.
3.
Number of soft page faults incurred by an image during the report time
period, divided by the number of activations. If you specify the secondary
key as USERNAMES, this column displays the total number of soft page
faults for all images, divided by the total number of image activations for
the user.
4.
Number of hard page faults incurred by an image during the report time
period, divided by the number of activations. If you specify the secondary
key as USERNAMES, this column displays the total number of hard page
faults for all images, divided by the total number of image activations for
the user, invoked per user.
5.
Average number of process private pages plus the global pages for this
image (or user) during the report time period.
6.
Percentage of all direct I/O attributable to an image or user during the
report time period.
7.
Percentage of all buffered I/O attributable to an image or user during the
report time period.
36 Performance Manager Administrator Guide
Performance Evaluation Report
8.
Percentage of all CPU time attributable to an image or user during the
report time period.
9.
Total elapsed time (wall clock, in seconds) of an image or user, divided by
the number of its activations. If the number of image activations is zero,
this measurement represents the total residence time of all activations of
the image (or all images if the USERNAMES option was specified).
10. Total amount of CPU seconds used by processes running an image (or by a
user if the USERNAMES option was specified) during the report time
period, divided by the number of its activations, unless the number of
activations is zero.
11. Total number of image activations due to interactive, batch, or network
processes, calculated for the report time period. This example shows 197
interactive image activations.
12. Percentage of all direct I/O due to interactive, batch, or network processes
during the report time period. In this example, 24.70 percent of all direct
I/O was due to interactive processes.
13. Percentage of all buffered I/O due to interactive, batch, or network
processes during the report time period. In this example, 29.94 percent of
all buffered I/O was due to interactive processes.
14. Percentage of all CPU time used by interactive, batch, or network
processes during the report time period. In this example, interactive
processes consumed 12.30 percent of all CPU time.
15. Process type: interactive, batch, network or detached, or name of
workload when primary key options are used or /CLASSIFY_BY.
16. Average number of active processes. In this example, there is an average
of 32 active interactive processes during the 30 intervals.
17. Average number of inactive processes. In this example, there is an
average of 53 inactive interactive processes during the 30 intervals.
18. Average number of private and global pages in the process's working set
for the active processes.
19. Average number of soft page faults calculated by dividing the total number
of soft page faults (for this type) by the number of image activations. A
soft page fault is the total number of times that processes reference a
virtual page that is not in its working set but is in memory.
20. Average number of hard page faults calculated by dividing the total
number of hard page faults (for this type) by the number of image
activations. A hard page fault is the total number of times that processes
reference a virtual page that is not in its working set and requires a read
operation from disk.
21. Average number of direct I/O operations per image. Calculated by dividing
the total number of direct I/O operations (for this type of process) by the
total number of image activations.
Chapter 3: Evaluate Performance in Detail 37
Performance Evaluation Report
22. Average number of buffered I/O operations per image. Calculated by
dividing the total number of buffered I/O operations by the total number of
image activations. Buffered I/O operations use intermediate system
buffers rather than process context buffers.
23. Average CPU time used per image. Calculated by dividing the total CPU
time accrued by processes, in seconds, by the total number of image
activations.
24. Images per second. Total number of image activations divided by the total
elapsed wall-clock time during which processes were active, resulting in
the average number of images completed per second.
Interpreting Process Statistics by Image Name and User Name
The process statistics in the Performance Evaluation Report can be presented
in a number of ways. The previous example showed the default presentation of
process statistics. The following example shows the data presented by image
and user. This report was generated with the
/PROCESS_STATISTICS=(FOCUS=TRADITIONAL,
PRIMARY_KEY=IMAGE,SECONDARY_KEY=USERNAME) qualifier.
The following statements are keyed to the columns in following example:
1.
Identifies the image name. The Performance Manager displays process
statistics for each image executed.
2.
Identifies all of the users who activated the image.
3.
The imagename, with a summarization of its overall usage.
38 Performance Manager Administrator Guide
Performance Evaluation Report
Performance
Evaluation
YQUEM (VAX 6000-440)
Page
PA Vx.x
1
Tuesday 26-JAN-1997 09:00 to 10:00
+--------------------------------------------------------------------+
| The table below lists observed workload characteristics of all the |
| interactive images that were run during the given interval. Note
|
| that Diskio, Bufio and Cputim are percentage contributions of the |
| respective images to the total system load. Working set size and |
| working set faults are the average for the respective images. In |
| the case of 0 image activations, the Uptime/image and Cputim/image |
| actually report the cumulative Uptime and Cputim for the image.
|
+--------------------------------------------------------------------+
1
Node Name: YQUEM
IMAGENAME:
(dcl)
# of
Page Faults Avg. % of
% of
2
activ- per Actvtn
Ws
Direct Buffered % of
User
ations -Soft--Hard size
I/O
I/O
Cputim
------ ------ ------ ---- ------ ------ ------ -----ARROYO
0
60
0
486
0.00
0.01
0.01
BHAT
0
127
0
500
0.02
0.06
0.00
FORD
0
14
0
553
0.00
0.00
0.00
.
.
.
.
.
.
.
.
.
.
.
.
.
.
.
.
.
.
.
.
.
.
.
.
STEWART
0
0
0
492
0.00
0.00
0.00
SYSTEM
0
59
0
360
0.00
0.01
0.01
TORREY
0
0
0
472
0.00
0.00
0.00
VOBA
0
0
0
483
0.00
0.00
0.00
------------- -----Totals
0
0.07
0.24
0.13
Node Name: YQUEM
IMAGENAME:
IMAGENAME:
Cputim/
image
(sec)
-------0.94
0.64
0.36
.
.
.
0.49
1.41
0.19
0.29
Uptime/
image
(sec)
------48
Cputim/
image
(sec)
-------1.59
Uptime/
image
(sec)
------2
3
43
17
1
Cputim/
image
(sec)
-------0.43
0.42
0.79
0.26
0.29
CMS
# of
Page Faults Avg. % of
% of
activ- per Actvtn
Ws
Direct Buffered % of
User
ations -Soft--Hard size
I/O
I/O
Cputim
------- ------ ------ ---- ------ ------ ------ -----SELOSKY
5
522
31
509
0.12
0.13
0.06
------------ ------- -----Totals
5
0.12
0.13
0.06
Node Name: YQUEM
Uptime/
image
(sec)
------5778
2316
2227
.
.
.
10800
6753
3360
7080
COPY
# of
Page Faults Avg. % of
% of
activ- per Actvtn
Ws
Direct Buffered % of
User
ations -Soft--Hard size
I/O
I/O
Cputim
------- ------ ------ ---- ------ ------ ------ -----ARROYO
1
166
3
584
0.01
0.08
0.00
BHAT
1
154
3
571
0.04
0.06
0.00
FORD
1
61
3
640
0.25
0.00
0.01
QUANG
2
119
3
407
0.02
0.01
0.00
VERRIER
1
150
3
416
0.01
0.04
0.00
------------ ------- -----Totals
6
0.33
0.19
0.02
Chapter 3: Evaluate Performance in Detail 39
Performance Evaluation Report
Performance
YQUEM (VAX 6000-440)
Evaluation
Tuesday 26-JAN-1997 09:00 to 10:00
Page
PA Vx.x
29
+------------------------------------------------------------------------+
| The following table summarizes the workload characteristics on a per
|
| image activation basis. Note that values would be zeros if total
|
| number of image activations is zero.
|
+------------------------------------------------------------------------+
3
PrimaryKey:
Avg. Avg.
Avg.
Avg.
Image
# of
Avg.
Soft Hard Direct Buff'd
Avg.
Images
Secondary Key:
processes
WSiz/ flts/ flts/ IO/
IO/
Cputim/
per
None
activ/inact image image image image image
image
Second
---------------- ----- ----- ----- ----- ----- ------ ------ ------- -------(dcl)
18
23
486 950.0
0.0
73.0 760.0
19.05
0.0000
CMS
0
0
509 522.4 30.8
23.6
80.6
1.59
0.0014
COPY
0
0
539 128.0
3.0
54.5
98.3
0.41
0.0017
CSP
1
0
396
0.0
0.0
0.0
64.0
4.42
0.0000
DEBUGSHR
0
0
1938 1739.0 44.0
6.5
89.5
2.10
0.0006
DECW$BOOKREAD
0
1
4886
0.0
0.0
0.0
0.0
0.00
0.0000
DECW$CLOCK
2
0
2696
3.0
0.0
0.0 125.0
2.04
0.0000
DECW$DWT_FONT
0
1
1753
0.0
0.0
0.0
0.0
0.00
0.0000
.
.
.
.
.
.
.
.
.
.
.
.
.
.
.
.
.
.
.
.
.
.
.
.
.
.
.
.
.
.
Interpret Process Statistics by Workload
The following example illustrates the process statistics section displayed by
workload. This report displays process statistics for each workload definition in
the workload family supplied with the /CLASSIFY_BY qualifier. In this example,
the Performance Manager uses the workload family MODEL_TRANSACTIONS
including the workload definitions SYSMAN, UTILITIES, EDITORS, and so forth.
40 Performance Manager Administrator Guide
Performance Evaluation Report
Performance
Evaluation
YQUEM (VAX 6000-440)
Page
1
PA Vx.x
Tuesday 26-JAN-2006 09:00 to 10:00
+--------------------------------------------------------------------+
| The table below lists observed workload characteristics of all the |
| interactive images that were run during the given interval. Note
|
| that Diskio, Bufio and Cputim are percentage contributions of the |
| respective images to the total system load. Working set size and |
| working set faults are the average for the respective images. In |
| the case of 0 image activations, the Uptime/image and Cputim/image |
| actually report the cumulative Uptime and Cputim for the image.
|
+--------------------------------------------------------------------+
Node Name: YQUEM
Image
-----EDT
EMACS
LSEDIT
TPU
Totals
WORKLOAD:
EDITORS
# of
Page Faults Avg. % of
% of
activper Actvtn
Ws
Direct Buffered % of
ations -Soft--Hard size
I/O
I/O
Cputim
------- ------ ---- ------ ------ ------ -----4
372
5
705
0.09
0.33
0.04
0
0
0
3578
0.00
0.00
0.00
3
3896
17
5993
1.27
0.45
0.11
8
2267
24
5574
3.50
3.79
0.64
--------------- -----15
4.87
4.56
0.79
Node Name: YQUEM
WORKLOAD:
WORKLOAD:
Cputim/
image
(sec)
-------1.57
0.00
5.32
11.44
Uptime/
image
(sec)
------1285
3600
3600
3600
161
3600
611
Cputim/
image
(sec)
-------9.43
0.12
3.13
29.86
0.18
0.03
0.43
Uptime/
image
(sec)
------3
6
48
3600
3600
3600
.
.
.
Cputim/
image
(sec)
-------2.00
0.36
1.59
2.29
4.42
0.64
.
.
.
NETWORK
# of
Page Faults Avg. % of
% of
activper Actvtn
Ws
Direct Buffered % of
Image
ations -Soft--Hard size
I/O
I/O
Cputim
------ ------- ------ ---- ------ ------ ------ -----FAL
4
43
2
508
0.82
2.11
0.26
FILESERV
0
0
0
215
0.00
0.00
0.00
LATSYM
0
0
0
221
0.00
0.15
0.02
NETACP
0
0
0
8817
0.01
0.62
0.21
NETSERVER
44
45
2
409
0.43
0.12
0.06
REMACP
0
0
0
154
0.00
0.00
0.00
RTPAD
4
79
5
473
0.04
0.15
0.01
------------ ------- -----Totals
52
1.30
3.17
0.56
Node Name: YQUEM
Uptime/
image
(sec)
------258
10800
1375
1796
SYSMAN
# of
Page Faults Avg. % of
activper Actvtn
Ws
Direct
Image
ations -Soft--Hard size
I/O
------ ------- ------ ---- ------ -----CDU
1
8531
5
2168
0.01
CLR
1
68
7
345
0.00
CMS
5
522
31
509
0.12
CONFIGURE 0
0
0
265
0.00
CSP
0
0
0
396
0.00
ERRFMT
0
0
0
241
0.03
.
.
.
.
.
.
.
.
.
.
.
.
.
.
.
.
.
.
% of
Buffered % of
I/O
Cputim
------ -----0.01
0.01
0.01
0.00
0.13
0.06
0.00
0.02
0.02
0.03
0.01
0.00
.
.
.
.
.
.
Chapter 3: Evaluate Performance in Detail 41
Performance Evaluation Report
Performance
YQUEM (VAX 6000-440)
Evaluation
Tuesday 26-JAN-2006 09:00 to 10:00
Page
PA Vx.x
5
+------------------------------------------------------------------------+
| The following table summarizes the workload characteristics on a per
|
| image activation basis. Note that values would be zeros if total
|
| number of image activations is zero.
|
+------------------------------------------------------------------------+
1
PrimaryKey:
Avg. Avg.
Avg.
Avg.
Workld
# of
Avg.
Soft Hard Direct Buff'd
Avg.
Images
Secondary Key:
processes
WSiz/ flts/ flts/ IO/
IO/
Cputim/
per
None
activ/inact image image image image image
image
Second
------------------ ----- ----- ----- ----- ------ ------ ------- -------EDITORS
1
7
4755 2087.2 17.5 317.7 947.0
7.59
0.0042
NETWORK
5
4
1394
47.3
2.2
24.5 189.7
1.55
0.0144
OTHER
51
70
1741 1879.0 27.7 1101.8 3228.2
42.17
0.0186
SYSMAN
7
3
865 1967.6 22.1 241.0 661.3
31.10
0.0022
UTILITIES
6
12
1952 290.4
6.9
77.6 316.0
1.40
0.0578
The following statement is keyed to the column in the previous example:
The Primary Key: Workld indicates the workload names associated with the
specified workload family.
View Process Statistics with a Generalized Set of Metrics
The following report example illustrates the process statistics section with a
focus on CPU, memory, and IO data, primarily presented as rates. Some UAF
parameters are also provided. This format of the report is obtained by using
the qualifier /PROCESS_STATISTICS=FOCUS=GENERAL.
42 Performance Manager Administrator Guide
Performance Evaluation Report
To view the report with a different orientation, provide your choice of sort
keys. For example, the following syntax presents the statistics by workload
family with a breakdown by image:
/PROCESS_STATISTICS=(FOCUS=GENERAL,PRIMARY_KEY=WORKLOAD,SECONDARY_KEY=IMAGENAME)
Performance
Evaluation
YQUEM (VAX 6000-440)
Page
PA Vx.x
1
Tuesday 26-JAN-1997 09:00 to 10:00
+------------------------------------------------------------------------------------------------------------------------+
| The following table gives the average general statistics for processes during the selected time frame.
|
+------------------------------------------------------------------------------------------------------------------------+
Primary/Secondary Key
Img Cpu time DirI/O BufI/O SftFlt HrdFlt
Ave
Max
Ave
WS
WS
WS
Pid/ Image
Pri State Cnt
(Min)
/Sec
/Sec
/Sec
/Sec
WSsize WSsize Global Default Quota
Extent
--------------------- ----- ----- ----- -------- ------- ------- ------- ------- ------- ------- ------- ------- ------- ------29400201
Swapper
16/16
HIB
0
0.021
0.00
0.00
0.00
0.00
0
0
0
1
1
1
29400206
CONFIGURE
10/ 8
HIB
0
0.038
0.00
0.00
0.00
0.00
265
265
0
512
1636
75000
29400209
ERRFMT
7/ 7
HIB
0
0.011
0.01
0.01
0.00
0.00
241
241
0
512
1636
75000
.
.
.
.
.
.
.
.
.
.
.
.
.
.
.
.
.
.
.
.
.
.
.
.
.
.
.
.
.
.
.
.
.
.
.
.
.
.
.
.
.
.
.
.
.
294004C0
(dcl)
4/ 4
CUR
0
0.017
0.00
0.01
0.02
0.00
452
474
52
818
2048
10000
CMS
4/ 4
CUR
5
0.133
0.03
0.11
0.73
0.04
509
862
58
818
2048
10000
DIRECTORY
4/ 4
CUR
1
0.005
0.01
0.02
0.02
0.00
477
477
64
818
2048
10000
MAIL
5/ 4
LEF
2
0.046
0.03
0.10
0.37
0.01
1115
1317
311
818
2048
10000
29400A41
(dcl)
4/ 4
CUR
0
0.022
0.00
0.01
0.02
0.00
379
554
39
818
2048
9216
DELETE
5/ 4
CUR
1
0.002
0.00
0.00
0.03
0.00
308
308
28
818
2048
9216
DIRECTORY
4/ 4
CUR
1
0.002
0.00
0.00
0.02
0.00
495
495
97
818
2048
9216
SEARCH
5/ 4
CUR
1
0.006
0.00
0.01
0.04
0.00
325
325
30
818
2048
9216
SHOW
5/ 4
CUR
1
0.002
0.00
0.00
0.09
0.00
375
375
35
818
2048
9216
TPU
6/ 4
CUR
5
0.164
0.09
0.19
2.17
0.04
1167
1497
308
818
2048
9216
User Command: ADVISE PERF REPORT PERF/NODE=YQUEM/BEG=26-JAN-1997 09:00:00.00/END=26-JAN-1997 10:00:00.00 /INCLUDE=PROC/PROC=FOCU=GEN/OUT=EXAMPLE_3_GEN.
The following statements describe the columns in the previous report:
■
Primary/Secondary Key-This column lists the primary and secondary key
identifiers for the process detail lines. The keys may be Mode, Username,
Imagename, Processname, Account, UIC group, Workloadname, or PID.
■
Pri-This column shows the process's current priority and base priority. For
more than one process, they are averages weighted by the process's
uptime.
■
State-This column represents the scheduling state of the process for the
most recent data. For more than one process, this column reflects the
state of only one of these processes.
■
Img Cnt-This column provides the number of image activations as a count
for the process or processes.
■
Cpu time (Min)-This column provides the amount of CPU time consumed
by the process or processes in minutes.
Chapter 3: Evaluate Performance in Detail 43
Performance Evaluation Report
■
DirI/O /Sec-This column provides the average Direct I/O rate per second
for the process or processes.
■
BufI/O /Sec-This column provides the average Buffered I/O rate per
second for the process or processes.
■
SftFlt /Sec-This column provides the average soft pagefault rate per
second for the process or processes.
■
HrdFlt /Sec-This column provides the average hard pagefault rate per
second for the process or processes.
■
Ave WSsize-This column provides the average working set size (private
pages + global pages) for the process. For more than one process, the
value is an average weighted by the processes' uptime.
■
Max WSsize-This column provides the maximum working set size (private
pages + global pages) of any one process, for any one recording example.
■
Ave Global-This column provides the average number of global workingset
pages for the process. For more than one process, the value is an average
weighted by the processes' uptime.
■
WS Default-This column provides the WSDEFAULT value for the process.
For more than one process, the value is an average weighted by the
processes' uptime.
■
WS Quota-This column provides the WSQUOTA value for the process. For
more than one process, the value is an average weighted by the
processes' uptime.
■
WS Extent-This column provides the WSEXTENT value for the process. For
more than one process, the value is an average weighted by the
processes' uptime.
View Process Statistics with an Emphasis on CPU Metrics
The following report example illustrates the process statistics section with a
focus on CPU related statistics. The default primary and secondary keys are
USERNAME and IMAGENAME. This format of the report is obtained by using
the qualifier /PROCESS_STATISTICS=FOCUS=CPU_RELATED. To view the
report with a different orientation, provide your choice of sort keys. For
example, the following syntax presents the statistics by imagename with a
breakdown of who is using those images:
/PROCESS_STATISTICS=(FOCUS=CPU_RELATED,PRIMARY_KEY=IMAGENAME,SECONDARY_KEY=USERNA
ME)
44 Performance Manager Administrator Guide
Performance Evaluation Report
Performance
YQUEM (VAX 6000-440)
Evaluation
Tuesday 26-JAN-1997 09:00 to 10:00
Page
PA Vx.x
1
+----------------------------------------------------------------------------------------------------------------+
| The following table gives the average CPU related statistics for processes during the selected time frame.
|
+----------------------------------------------------------------------------------------------------------------+
Primary/Secondary Key
%CPU
Cpu time Uptime Response Terminal Terminl
Img COM
SftFlt DskI/O TapeI/O Process
User/ Image
Utilizatn (Min)
(Min) tim(sec) Inpt/Sec Chrs/sec Pri State Cnt Prct
/Sec
/Sec
/Sec
Mwait
--------------------- --------- -------- ------- -------- -------- -------- ----- ----- ----- ----- ------- ------- ------- ----<dfs$comacp>
DFS$COM_ACP
0.00
0.000
60.00
0.00
0.00
0.00 10/ 8
HIB
0
0.0
0.00
0.00
0.00
ARROYO
(dcl)
0.01
0.016
96.30
0.01
0.00
0.00
4/ 4
CUR
0 14.6
0.02
0.01
0.00
COPY
0.00
0.007
0.03
0.00
0.00
0.00
4/ 4
CUR
1
0.0
0.05
0.01
0.00
DECPRESENT
0.47
1.127
17.08
0.00
0.00
0.00
5/ 4
CUR
0
3.9
0.60
0.09
0.00
DIRECTORY
0.01
0.024
0.17
0.02
0.00
0.00
6/ 4
CUR
1
0.0
0.04
0.00
0.00
MAIL
0.05
0.128
6.44
0.02
0.04
0.00
5/ 4
CUR
2
1.3
1.07
0.08
0.00
BEYH
(dcl)
0.00
0.004
59.10
0.00
0.00
0.00
4/ 4
CUR
0 38.2
0.00
0.00
0.00
DECW_QUOTE
0.03
0.078
60.00
0.00
0.00
0.00
4/ 4
LEF
0
0.1
0.00
0.01
0.00
DQS$CLIENT
0.01
0.012
0.26
1.85
0.00
0.00
4/ 4
CUR
2 64.1
0.08
0.01
0.00
MAIL
0.20
0.486
14.61
0.05
0.03
16.08
5/ 4
CUR
1
1.1
0.70
1.64
0.00
Scs
VUE$MASTER
0.00
0.006 120.00
0.00
0.00
0.00
4/ 3
LEF
0
0.0
0.00
0.00
0.00
.
.
.
.
.
.
.
.
.
.
.
.
.
.
.
.
.
.
.
.
.
.
.
.
.
.
.
.
.
.
.
.
.
.
.
.
.
.
.
.
.
.
User Command: ADVISE PERF REPORT PERF/NODE=YQUEM/BEG=26-JAN-1997 09:00:00.00/END=26-JAN-1997 10:00:00.00 /INCLUDE=PROC/PROC=FOCU=CPU/OUT=EXAMPLE_3_CPU.INFO
The following statements describe the columns in the previous example:
■
Primary/Secondary Key-Lists the primary and secondary key identifiers for
the process detail lines. The keys may be Mode, Username, Imagename,
Processname, Account, UIC group, Workloadname, or PID.
■
%CPU Utilizatn-Provides the amount of CPU time consumed by the process
(or processes) represented as a percentage of the node's total capacity. If
this is a cluster report (/PROCESS=CLUSTER), then the figure is a
percentage of the cluster's total capacity. The process CPU time is scaled
by the node's VUP rating (power rating).
■
Cpu time (Min)-Provides the amount of CPU time consumed by the process
or processes in minutes.
■
Uptime (Min)-Provides the total amount of wall-clock time during which
the process(es) were resident on the system, in minutes.
■
Response tim(sec)-Represents the average response time per terminal
input operation for the process or processes.
■
Terminal Inpt/Sec-Provides the average number of Terminal Inputs
(completion of a read QIO to the terminal) per second for the process or
processes.
■
Terminl Chrs/sec-Provides the average number of bytes (characters) per
second transferred to, or received from the terminal, for the process or
processes.
Chapter 3: Evaluate Performance in Detail 45
Performance Evaluation Report
■
Pri-Shows the process's current priority and base priority. For more than
one process, they are averages weighted by the process's uptime.
■
State-Represents the scheduling state of the process for the most recent
data. For more than one process, this column reflects the state of only one
of these processes.
■
Img Cnt-Provides the number of image activations as a count for the
process or processes.
■
COM Prct-Provides the percent of time that a process is observed in the
COM scheduler state. If more than one process is represented, this figure
could be greater than 100, however, it is still a meaningful gauge as to
which processes are queued up at the CPU.
■
Sft Flt/Sec-Provides the average soft pagefault rate per second for the
process or processes.
■
Dsk I/O/Sec-Provides the average number of disk I/O operations per
second for the process or processes.
■
Tape I/O/Sec-Provides the average number of tape I/O operations per
second for the process or processes.
■
Process Mwait-If the process (or processes) was observed by the data
collector in an MWAIT scheduler state, the resource name is provided
(RSN). The low numbered resource states have precedence if more than
one state was recorded. The order of precedence starting with the highest
is: RWAST, MAILBOX, NPDYNMEM, PGFILE, PGDYNMEM, BRKTHRU,
IACLOCK, JQUOTA, LOCKID, SWPFILE, MPLEMPTY, MPWBUSY, SCS, CLU.
View Process Statistics with an Emphasis on IO Metrics
The following report example illustrates the process statistics section with a
focus on process IO related metrics, primarily presented as rates. Up to 3 top
volume names associated with the IO activity are also displayed. The example
uses the default primary and secondary keys of USERNAME and IMAGENAME.
This format of the report is obtained by using the qualifier
/PROCESS_STATISTICS=FOCUS=IO_RELATED. To view the report with a
different orientation, provide your choice of sort keys. For example, the
following syntax presents the statistics by imagename with a breakdown by
user:
/PROCESS_STATISTICS=(FOCUS=IO_RELATED,PRIMARY_KEY=IMAGENAME,SECONDARY_KEY=USERNAM
E)
46 Performance Manager Administrator Guide
Performance Evaluation Report
Performance
YQUEM (VAX 6000-440)
Page
1
Evaluation
PA Vx.x
Tuesday 26-JAN-1997 09:00 to 10:00
+--------------------------------------------------------------------------------------------------------------------+
| The following table gives the average I/O statistics for processes during the selected time frame.
|
+--------------------------------------------------------------------------------------------------------------------+
Primary/Secondary Key DirI/O BufI/O HrdFlt Img
Dsk Ops KB Thru -----Top Disk------ ---2nd Top Disk---- ---3rd Top Dsk----User/ Image
/Sec
/Sec
/Sec
Cnt
/Sec put/sec Volume Name IO/sec Volume Name IO/sec Volume Name IO/sec
--------------------- ------- ------- ------- ----- ------- ------- ------------ ------ ------------ ------ ------------ -----ARROYO
(dcl)
0.00
0.01
0.00
0
0.01
0.0
TRAINING
0.00
SYSPACK
0.00
0.00
COPY
0.00
0.07
0.00
1
0.01
0.1
TRAINING
0.00
SYSPACK
0.00
0.00
DECPRESENT
0.08
1.06
0.00
0
0.09
0.2
TRAINING
0.08
SYSPACK
0.00
0.00
DIRECTORY
0.00
0.01
0.00
1
0.00
0.0
SYSPACK
0.00
0.00
0.00
MAIL
0.06
0.14
0.02
2
0.08
0.8
TRAINING
0.05
SYSPACK
0.03
PAGER
0.00
BEYH
(dcl)
0.00
0.00
0.00
0
0.00
0.0
SYSPACK
0.00
0.00
0.00
DECW_QUOTE
0.01
0.00
0.00
0
0.01
0.0
PAGER
0.01
0.00
0.00
DQS$CLIENT
0.00
0.02
0.01
2
0.01
0.1
SYSPACK
0.01
PAGER
0.00
0.00
MAIL
0.23
3.07
0.02
1
0.28
1.5
SWDEV
0.26
SYSPACK
0.01
PAGER
0.00
NOTES$MAIN
0.08
9.47
0.00
0
0.08
0.3
SWDEV
0.08
0.00
0.00
RTPAD
0.00
0.00
0.00
1
0.00
0.0
0.00
0.00
0.00
BHAT
(dcl)
0.00
0.05
0.00
0
0.01
0.0
SYSPACK
0.00
ADMIN
0.00
0.00
COPY
0.01
0.05
0.00
1
0.01
0.4
ADMIN
0.01
SYSPACK
0.00
0.00
DECPRESENT
0.56
2.44
0.07
2
0.64
3.8
ADMIN
0.39
SYSPACK
0.25
0.00
DIRECTORY
0.00
0.00
0.00
1
0.00
0.0
0.00
0.00
0.00
MAIL
1.63
0.43
0.01
1
1.64
8.2
ADMIN
1.61
SYSPACK
0.03
PAGER
0.00
QUOTE_V0
0.00
0.01
0.00
1
0.00
0.0
ADMIN
0.00
SYSPACK
0.00
0.00
SET
0.00
0.00
0.00
2
0.00
0.0
0.00
0.00
0.00
SUBMIT
0.00
0.00
0.00
1
0.00
0.0
SYSPACK
0.00
0.00
0.00
VMSHELP
0.01
0.09
0.01
4
0.02
0.4
SYSPACK
0.02
0.00
0.00
User Command: ADVISE PERF REPORT PERF/NODE=YQUEM/BEG=26-JAN-1997 09:00:00.00/END=26-JAN-1997 10:00:00.00 /INCLUDE=PROC/PROC=FOCU=IO/OUT=EXAMPLE_3_IO.INFO
The following statements describe the columns in the previous example:
■
Primary/Secondary Key-This column lists the primary and secondary key
identifiers for the process detail lines. The keys may be Mode, Username,
Imagename, Processname, Account, UIC group, Workloadname, or PID.
■
DirI/O /Sec-This column provides the average Direct I/O rate per second
for the process or processes.
■
BufI/O /Sec-This column provides the average Buffered I/O rate per
second for the process or processes.
■
HrdFlt /Sec-This column provides the average hard pagefault rate per
second for the process or processes.
■
Img Cnt-This column provides the number of image activations as a count
for the process or processes.
■
Dsk Ops /Sec-This column provides the average number of disk I/O
operations per second for the process or processes.
Chapter 3: Evaluate Performance in Detail 47
Performance Evaluation Report
■
KB Thruput/sec-This column provides the average number of Kilobytes
transferred to or from disks, per second, for the process or processes.
■
Top Disk-Volume Name IO/sec
This column provides both the volume name and average I/O rate, for the
disk which this process or processes access most. Note that the I/O rate
might be understated, and that some other disk might be accessed heavily
but not reported, because the primary data collector is only capturing the
top two devices that the process uses, each two minute interval. If an
alternate collection is used, these columns show no data, since the data is
not provided by an alternate collector.
■
2nd Top Disk-Volume Name IO/sec
See previous paragraph.
■
3rd Top Dsk-Volume Name IO/sec
See previous paragraph.
View Process Statistics with an Emphasis on Memory Metrics
The following report example illustrates the process statistics section with a
focus on process memory related metrics. Some relevant UAF parameters are
also displayed. The example uses the default primary and secondary keys of
IMAGENAME and USERNAME. This format of the report is obtained by using
the qualifier /PROCESS_STATISTICS=FOCUS=MEMORY_RELATED. To view the
report with a different orientation, provide your choice of sort keys. For
example, the following syntax presents the statistics by user with a breakdown
by image:
/PROCESS_STATISTICS=(FOCUS=MEMORY_RELATED,PRIMARY_KEY=USERNAME,SECONDARY_KEY=IMAG
ENAME)
48 Performance Manager Administrator Guide
Performance Evaluation Report
Performance
YQUEM (VAX 6000-440)
Evaluation
Tuesday 26-JAN-2006 09:00 to 10:00
Page
PA Vx.x
1
+---------------------------------------------------------------------------------------------------------------------+
| The following table gives the average memory statistics for processes during the selected time frame.
|
+---------------------------------------------------------------------------------------------------------------------+
Primary/Secondary Key SftFlt HrdFlt
Ave
Ave
Ave
Obs
Max
Max
Ave
Ave
WS
WS
WS
Uptime
Image/ User
/Sec
/Sec Private Global VA Spac PFW VA Spac WSsize WSsize WSlist Default Quota
Extent
(min)
--------------------- ------- ------- ------- ------- ------- --- ------- ------- ------- ------- ------- ------- ------- -------(dcl)
ALAM
0.00
0.00
426
61
6338
N
6338
767
487
834
818
2048
16384
16.18
ARROYO
0.02
0.00
421
65
4960
N
4996
504
486
818
818
2048
9216
96.30
BEYH
0.00
0.00
657
102
6227
N
6227
759
759
1024
1024
2048
16384
59.10
CMS
SENDLOSKY
0.73
0.04
451
58
11922
Y
12141
862
509
962
818
2048
10000
3.96
COPY
ARROYO
0.05
0.00
489
95
5618
N
5618
584
584
818
818
2048
9216
0.03
BHAT
0.04
0.00
476
95
5618
N
5618
571
571
818
818
2048
10000
0.04
FORD
0.02
0.00
496
144
5560
N
5560
640
640
918
818
2048
50000
0.71
QUANG
0.07
0.00
317
90
5824
N
5824
426
407
818
818
2048
9216
0.55
VERRIER
0.04
0.00
359
57
5618
N
5618
416
416
1024
1024
2048
16384
0.02
.
.
.
.
.
.
.
.
.
.
.
.
.
.
.
User Command: ADVISE PERF REPORT PERF/NODE=YQUEM/BEG=26-JAN-2006 09:00:00.00/END=26-JAN-2006 10:00:00.00 /INCLUDE=PROC/PROC=FOCU=MEM/OUT=EXAMPLE_3_MEM.INFO
The following statements describe the columns in the previous example:
■
Primary/Secondary Key-This column lists the primary and secondary key
identifiers for the process detail lines. The keys may be Mode, Username,
Imagename, Processname, Account, UIC group, Workloadname, or PID.
■
SftFlt /Sec-This column provides the average soft pagefault rate per
second for the process or processes.
■
HrdFlt /Sec-This column provides the average hard pagefault rate per
second for the process or processes.
■
Ave Private-This column provides the average number of private
workingset pages for the process. For more than one process, the value is
an average weighted by the processes uptime.
■
Ave Global-This column provides the average number of global workingset
pages for the process. For more than one process, the value is an average
weighted by the processes uptime.
■
Ave VA Spac-This column provides the average number of process virtual
pages for the process. For more than one process, the value is an average
weighted by the processes uptime.
■
Obs PFW-This column is set to a Y if the process was observed by the data
collector in the pagefault wait scheduler state (PFW).
■
Max VA Spac-This column provides the maximum number of virtual
address space pages for any one process, for any one recording example.
■
Max WSsize-This column provides the maximum working set size (private
pages + global pages) of any one process, for any one recording example.
Chapter 3: Evaluate Performance in Detail 49
Performance Evaluation Report
■
Ave WSsize-This column provides the average working set size (private
pages + global pages) for the process. For more than one process, the
value is an average weighted by the processes uptime.
■
Ave WSlist-This column provides the average working set list size for the
process. For more than one process, the value is an average weighted by
the processes uptime.
■
WS Default-This column provides the WSDEFAULT value for the process.
For more than one process, the value is an average weighted by the
processes uptime.
■
WS Quota-This column provides the WSQUOTA value for the process. For
more than one process, the value is an average weighted by the processes
uptime.
■
WS Extent-This column provides the WSEXTENT value for the process. For
more than one process, the value is an average weighted by the processes
uptime.
■
Uptime (min)-This column provides the total amount of wall-clock time
during which the process(es) were resident on the system, in minutes.
Interpret Pool Statistics
The pool statistics follow the process statistics for each node in a cluster
system. To display only the pool statistics section of the Performance
Evaluation Report, use the following qualifier:
/INCLUDE=POOL_STATISTICS
To disable the pool statistics display from the report, use this qualifier:
/INCLUDE=NOPOOL_STATISTICS
The following example shows the pool statistics of the Performance Evaluation
Report:
Performance
SUPPLY (VAX-11/78)
Evaluation
Wednesday 14-JAN-1997 00:00 to 12:16
Page
PA Vx.x
3
+------------------------------------------------------------------------+
| The following table gives the average pool resources used and
|
| allocated on this node. N/A means not applicable.
|
+------------------------------------------------------------------------+
LRP
IRP
SRP
NP-POOL
LOCKS RESOURCES
------------------------------------------------------------------------------1
2
3
4
5
6
Avg number in use
17
756
1745
499518
864
776
Max number in use
41
839
2122
516976
1052
968
Number of intvls w/expansns
0
0
0
0
0
N/A
Allocation (xRPCOUNT)
40
881
1249
799744
1184
1024
Virtual Alloc (xRPCOUNTV)
160
3524
4996
2399744
N/A
N/A
50 Performance Manager Administrator Guide
Performance Evaluation Report
The following statements are keyed to the columns in the previous example:
1.
Large request packets
2.
Intermediate request packets
3.
Small request packets
4.
Nonpaged pool (in bytes)
5.
Number of locks
6.
Number of named resources known by the Distributed Lock Manager
For OpenVMS Versions 6.0 and higher, the metrics for LRP, IRP, and SRP are
obsolete. The following sample shows an example of this report:
Performance
Evaluation
MUMMS (VAXstation 3100/GPX)
Page
PA Vx.x
Saturday 19-MAR-2006 23:00 to 23:59
1
+------------------------------------------------------------------------+
| The following table gives the average pool resources used and
|
| allocated on this node. N/A means not applicable.
|
+------------------------------------------------------------------------+
NP-POOL
LOCKS
RESOURCES
-------------------------------------------------------------------------Avg number in use
2449519
940
916
Max number in use
2456128
940
916
Number of intvls w/expansns
0
0
N/A
Allocation (xRPCOUNT)
962048
535
512
Virtual Alloc (xRPCOUNTV)
4810240
N/A
N/A
Virtual I/O Cache
Pages
Rate per second
------------------------------------------------------------------------Average Total Size
6663
Average Read I/O
0.00
Average Free
5567
Average Read Hit
0.00
Average in Use
1096
Average Write I/O
0.00
Maximum Size (SPTEs)
20315
I/O Bypassing the Cache
0.00
------------------------------------------------------------------------Average Files Retained
87
Cache Effectiveness
80.0 %
User Command: ADVISE PERF REP PERF/INCLU=POOL/BE=19-MAR-2006 23:00:00.00/NOD=MUMMS/OUT=A.A
Interpret CPU Mode Statistics
The CPU mode statistics follow the pool statistics for each node in a cluster
system. To display only the CPU mode statistics section of the Performance
Evaluation Report, use the qualifier:
/INCLUDE=MODE_STATISTICS
To disable the CPU mode statistics display from the report, use the qualifier:
/INCLUDE=NOMODE_STATISTICS
Chapter 3: Evaluate Performance in Detail 51
Performance Evaluation Report
The following example shows the CPU mode statistics section of the
Performance Evaluation report:
Performance
Evaluation
SUPPLY (VAX-11/78)
Page
4
PA Vx.x
Wednesday 14-JAN-2006 00:00 to 12:16
+------------------------------------------------------------------------+
| The following table gives the average percent of time in each of the
|
| various CPU modes for each active processor in the local node.
|
| "Samples" is the record count contributing to the summary line.
|
+------------------------------------------------------------------------+
CPU
No. Kernel Exec Supervisor User Interrupt Compat Null MP Synch Samples
--- ------ ---- ---------- ---- --------- ------ ---- -------- ------1
2
3
4
5
6
7
8
9
10
1
6.8
1.6
0.6
5.9
4.5
0.0 80.6
0.0
432
The following statements are keyed to the previous example:
1.
Physical processor identification
2.
Percentage of time in kernel mode for this physical processor
3.
Percentage of time in executive mode for this physical processor
4.
Percentage of time in supervisor mode for this physical processor
5.
Percentage of time in user mode for this physical processor
6.
Percentage of time in interrupt stack for this physical processor
7.
Percentage of time in compatibility mode for this physical processor
8.
Percentage of time in null mode for this physical processor
9.
Percentage of time in multiprocessor synchronization mode for this
physical processor
10. Number of Performance Manager data records contributing to the above
statistics
Interpret SCS Statistics
If included in the Performance Evaluation Report, SCS statistics, follow the
CPU mode statistics for each node in a cluster. This report also presents
cluster-wide SCS statistics. The SCS statistics are not included in the default
group of Performance Report options.
To enable the SCS statistics display from the Performance Evaluation Report,
use the following qualifier:
/INCLUDE=SCS_STATISTICS
52 Performance Manager Administrator Guide
Performance Evaluation Report
The following statements are keyed to the columns in the SCS Statistics
report:
1.
Other nodes in cluster. The Performance Manager reports SCS message
and transfer rate statistics as seen by node NODE2 to the other nodes
listed here.
2.
Port name if multiple paths are possible.
3.
Physical circuit connecting all nodes on a common interconnect.
4.
Datagram send rate per second.
5.
Datagram receive rate per second.
6.
Datagram discard rate per second.
7.
Message send rate.
8.
Message receive rate.
9.
Block send rate.
10. Block request rate.
11. Kilobyte send rate.
12. Kilobyte receive rate.
13. Kilobyte map rate.
14. Send credit waits.
15. Buffered descriptor waits.
The following example shows the Performance Evaluation report, SCS
Statistics:
Performance
NODE02 (VAX-11/78)
Evaluation
Wednesday 14-JAN-2006 00:00 to 23:59
Page
PA Vx.x
9
+------------------------------------------------------------------------+
| The following table gives the SCS message and transfer rates from
|
| this node to all other nodes in the cluster. Values are rates (/sec). |
+------------------------------------------------------------------------+
CLUSTR
NODE
-----1
DEFEND
NODE3
AGRIC
SUPPLY
Total
.
.
.
PATH
PORT
---2
PAA0
PAA0
PAA0
PAA0
PAA0
.
.
.
CIR- DGS DGS DGS MGS MGS BLKS BLKS
KB
KB
KB
CUIT SND RCD DSD SND RCVD SEND RQSTD SEND RCVD MAPPED
---- --- --- --- --- ---- ----- ----- ---- ---- -----3
4
5
6
7
8
9
10
11
12
13
CI-0
0
0
0
0
0
0
0
0
0
0
CI-0
0
0
0
2
1
0
0
0
0
0
CI-0
0
0
0
3
3
0
0
0
0
5
CI-0
0
0
0
4
2
0
0
0
0
0
CI-0
0
0
0
8
6
0
0
0
0
5
.
.
.
.
.
.
.
.
.
.
.
.
.
.
.
.
.
.
.
.
.
.
.
.
.
.
.
.
.
.
.
.
.
CRD
WAI
---14
0.00
0.00
0.00
0.00
0.00
.
.
.
BDT
WAI
---15
0.00
0.00
0.00
0.00
0.00
Chapter 3: Evaluate Performance in Detail 53
Performance Evaluation Report
Performance
CLUSTER
Evaluation
Wednesday 14-JAN-2006 00:00 to 23:59
Page
PA Vx.x
12
+------------------------------------------------------------------------+
| The following table gives the SCS message and transfer rates to the
|
| target node from other nodes in the cluster. Values are rates (/sec). |
+------------------------------------------------------------------------+
TARGET
SOURCE
NODE
-----NODE2
SUPPLY
NODE3
Total
.
.
.
NODE: DEFEND
PATH CIR- DGS
PORT CUIT SND
---- ---- --PAA0 CI-0
0
PAA0 CI-0
0
PAA0 CI-0
0
PAA0 CI-0
0
.
.
.
.
.
.
.
.
.
DGS
RCV
--0
0
0
0
.
.
.
DGS
DSD
--0
0
0
0
.
.
.
MGS
SND
--0
1
0
1
.
.
.
MGS BLKS
RCVD SEND
---- ---0
0
1
0
0
0
1
0
.
.
.
.
.
.
BLKS
RQSTD
----0
0
0
0
.
.
.
KB
SEND
---0
0
0
0
.
.
.
KB
RCVD
---0
0
0
0
.
.
.
KB
MAPPED
-----0
1
0
2
.
.
.
CRD
WAI
---0.00
0.00
0.00
0.00
.
.
.
BDT
WAI
---0.00
0.00
0.00
0.00
Interpret cluster-wide Lock Statistics
The lock statistics are the first cluster-wide statistics, and follow the systemspecific SCS statistics. To display only the lock statistics section of the
Performance Evaluation Report, use this qualifier:
/INCLUDE=LOCK_STATISTICS
To disable the lock statistics display from the report, use this qualifier:
/INCLUDE=NOLOCK_STATISTICS
The following example shows the lock statistics section of the Performance
Evaluation Report:
Performance
Evaluation
CLUSTER
Page 14
PA Vx.x
Wednesday 14-JAN-2006 00:00 to 12:16
+-----------------------------------------------------------------------+
| The following table gives a summary of the average amount of lock
|
| traffic per second in the cluster
|
+-----------------------------------------------------------------------+
Node
-------1
NODE01
------Total
Local
ENQ/CVT/DEQ
----------2
24/ 23/ 24
--- --- --24/ 23/ 24
Incoming
ENQ/CVT/DEQ
----------3
13/ 3/ 13/
--- --- --13/ 3/ 13/
Outgoing
ENQ/CVT/DEQ
----------4
0/ 1/ 0/
--- --- --0/ 1/ 0/
Waiting
locks
------5
0
--0
LOCKDIRWT
----6
2
54 Performance Manager Administrator Guide
Deadlk
find
-----7
0
--0
Deadlk
search
-----8
0
--0
Performance Evaluation Report
The following statements are keyed to the columns in previous example:
1.
Each node in the cluster.
2.
Average enqueue (ENQ), conversion (CVT), and dequeue (DEQ) lock
requests per second for locks that are managed by the node requesting
the lock. An enqueue lock request queues a new lock resource. A
conversion lock request occurs when a lock of one mode has already been
granted and a lock request to change the lock mode is to be granted. A
dequeue lock request releases the granted lock.
3.
Average lock requests per second for locks that are managed by the local
node but originate on other nodes.
4.
Average lock requests per second for locks that originate on a local node
but are managed by other nodes.
5.
Average number of ENQ lock requests per second that had to wait in the
wait queue.
6.
Value of the SYSGEN parameter LOCKDIRWT on each respective node.
7.
Deadlock detections per second during the reporting period.
8.
Deadlock searches per second during the reporting period.
Interpret cluster-wide CI, NI, and Adapter Statistics
The CI, NI, and adapter statistics follow the cluster-wide Lock statistics. To
display only the CI, NI and adapter statistics section of the Performance
Evaluation Report, use the following qualifier:
/INCLUDE=CI_NI_AND_ADAPTER_STATISTICS
To disable the CI, NI and adapter statistics display from the report, use the
following qualifier:
/INCLUDE=NOCI_NI_AND_ADAPTER_STATISTICS
Note: The phrase CI, NI and adapter statistics is seen in the Performance
Evaluation Report to describe cluster interconnect statistics in general. CI
hardware is not supported on HP Integrity Servers. On a cluster of only
Integrity Servers, you will see only NI adapters.
Chapter 3: Evaluate Performance in Detail 55
Performance Evaluation Report
Performance
Evaluation
Circuit
---1
PAA0
PAB0
PAA0
PAA0
PAA0
PAA0
PAB0
PAA0
PAB0
CLUSTER
Page
PA Vx.x
Wednesday 14-JAN-2006 00:00 to 12:16
7
+------------------------------------------------------------------------+
|
CI, NI, and Adapter Statistics
(values are rates/sec)
|
+------------------------------------------------------------------------+
Block
DataMessDisk
Disk
Transfers
Node
Component
grams
ages
Operations KB Thruput
KB Thruput
------ -------------------------- ------------------2
3
4
5
6
7
8
** total **
0.0
101.9
17.8
47.2
56.1
** total **
0.0
0.0
0.0
0.0
0.0
DEFEND CIBCA-A
0.0
16.9
5.0
7.1
13.8
SUPPLY CI780
0.0
39.2
0.0
0.0
16.6
AGRIC
CIBCA-A
0.0
33.7
12.7
40.0
42.2
SUPPLY BCI750
0.0
75.0
12.2
38.9
38.9
TAYLOR CIBCA-A
0.0
0.0
0.0
0.0
0.0
NODE2
CI780
0.0
39.1
5.7
8.3
8.2
NODE2
CI780
0.0
0.0
0.0
0.0
0.0
The following statements are keyed to the columns in the previous report:
1.
Device identification of path to remote SCS nodes.
2.
Node name of the cluster node.
3.
Adapter type for the cluster node (all Ethernet adapter types are reported
as NI).
4.
Number of datagrams per second sent and received by this node's port.
5.
Number of messages per second sent and received by this node's port.
6.
Number of disk IOs per second delivered through this port.
7.
Number of kilobytes per second delivered through this port to disks.
8.
Number of kilobytes per second total delivered through this port.
Interpret cluster-wide Disk Statistics
The disk statistics follow the cluster-wide CI, NI, and adapter statistics. To
display only the disk statistics section of the Performance Evaluation Report,
use the following qualifier:
/INCLUDE=DISK_STATISTICS
To disable the disk statistics display from the report, use the following
qualifier:
/INCLUDE=NODISK_STATISTICS
56 Performance Manager Administrator Guide
Performance Evaluation Report
The following report shows an example of the disk statistics section of the
Performance Evaluation report:
Performance
Evaluation
CLUSTER
Page
PA Vx.x
Wednesday 14-JAN-2006 13:00 to 14:00
8
+-----------------------------------------------------------------------+
| The following table gives the summary of all disk activity as seen
|
| by the indicated node. An "*" for service node indicates that more
|
| than one was detected.
|
+-----------------------------------------------------------------------+
Disk
Volume
-----1
ARNOLD
BARRY
Avg I/O Avg
Avg
per Sec Queue Kb/sec
------- ----- -----2
3
4
($2$DJA4)
0.00 0.00
0.0
0.00 0.00
0.0
0.00 0.00
0.0
0.00 0.00
0.0
($2$DUA15)
0.66 0.03
2.3
0.00 0.00
0.0
0.66 0.03
2.3
0.00 0.00
0.0
CLEM
IOsz Source Service %
% IO % IO
# of
in pgs Node
Node
Busy Read Split Type Samples
------ ------ ------ ------ ---- ----- ---- ------5
6
7
8
9
10 11
12
0.0
NODE1
0.0 SUPPLY
0.0 DEMAND
0.0 NODE1
0
0
0
0
0
0
0
0
RA60
0.00
0.00
0.00
7.0
0.0 SUPPLY
7.0 DEMAND
0.0 NODE1
ERNIE
100
0
100
0
4
0
4
0
RA81
0.00
1.97
0.00
ERNIE
83
98
82
81
1
0
2
0
RA82
0.35
3.89
1.15
30
30
30
30
30
30
2.02
0.14
1.46
0.42
($2$DUA5)
0.06
5.0
0.00
0.3
0.04
3.8
0.01
1.0
4.9
3.6 SUPPLY
5.2 DEMAND
4.6 NODE1
3.86
0.00
1.98
1.88
($2$DUA10)
0.14 16.5
0.00
0.0
0.08
9.1
0.06
7.4
8.6
BERT
0.0 SUPPLY
9.2 DEMAND
7.9 NODE1
86
0
84
89
15
0
13
17
RA81
0.00
7.31
5.66
8.93
0.04
8.36
0.53
($2$DUA7)
0.40 28.5
0.01
1.6
0.35 22.0
0.04
5.0
6.4
BERT
74.4 SUPPLY
5.3 DEMAND
19.0 NODE1
93
15
95
79
0
0
0
0
RA82
0.26
18.73
2.15
DUFIS
ELLIE
30
30
30
30
30
30
30
30
30
The following statements are keyed to the columns in the previous example:
1.
Volume name of the disk to which one or more nodes in the cluster directs
activity.
2.
Average number of I/O operations per second to the disk volume. For each
disk, the total I/O per second is reported, followed by a breakdown of this
activity from contributing nodes, when applicable. In this example, there
was an average of 2.02 I/O operations per second to disk volume CLEM,
with node SUPPLY contributing an average of 0.14 I/O operations per
second, node DEMAND contributing 1.46, and node NODE1 accounting for
the remaining 0.42 I/O operations per second.
3.
Average number of I/O requests waiting for service to the disk. The
average queue size for each disk is followed by a breakdown of this value
from contributing nodes, when applicable.
Chapter 3: Evaluate Performance in Detail 57
Performance Evaluation Report
4.
Average number of kilobytes per second transferred to or from the disk.
5.
Average size of the I/O operations to the disk, in pages. The average size
for each disk is followed by a breakdown of this value from contributing
nodes, when applicable.
6.
Name of the node that uses the various disk volumes. For rows in which
no source node name appears, the data refers to the cluster-wide activity
on the disk volume.
7.
Name of the node that services I/O requests. An asterisk denotes that
more than 1 server existed for this disk.
8.
Percentage of time that I/O requests are outstanding to the volume for
each node utilizing the disk volume.
9.
Percentage of total I/O activity devoted to read operations. This value for
each disk is followed by the percentage of read operations to the disk from
contributing nodes, when applicable.
10. Percentage of total I/O activity that were split I/O operations. This value
for each disk is followed by the percentage of read operations to the disk
from contributing nodes, when applicable.
11. Disk volume type. In this example, all but one of the disks are RA81s.
12. Count of the Performance Manager records containing data for a disk
volume during the interval.
Interpret cluster-wide Tape Statistics
The tape statistics follow the cluster-wide disk statistics.
To display only the tape statistics section of the Performance Evaluation
Report, use the following qualifier:
/INCLUDE=TAPE_STATISTICS
To disable the tape statistics display from the report, use the following
qualifier:
/INCLUDE=NOTAPE_STATISTICS
58 Performance Manager Administrator Guide
Performance Evaluation Report
The following example shows the tape statistics section of the Performance
Evaluation Report:
Performance
Evaluation
CLUSTER
Page
1
PA Vx.x
Wednesday 14-JAN-2006 09:00 to 19:20
+-----------------------------------------------------------------------+
| The following table gives the summary of all tape activity as seen
|
| by the indicated node. An "*" for service node indicates that more
|
| than one was detected.
|
+-----------------------------------------------------------------------+
Tape
Volume
-----1
8JUL02
ABC
Avg I/O Avg
Avg
IOsz
per Sec Queue Kb/sec in pgs
------- ----- ------ -----2
3
4
5
($2$MUA43)
3.76 20.14 119.1
63.3
($2$MUA43)
99.21 61.30 270.5
5.5
Source Service %
% IO % IO
# of
Node
Node
Busy Read Split Type Samples
------ ------ ------ ---- ----- ---- ------6
7
8
9
10
11
12
LATOUR JULIO
15.46
0
0
TA90E
9
LATOUR JULIO
39.62
0
0
TA90E
9
The following statements are keyed to the columns in the previous report:
1.
Volume name of the tape to which one or more nodes in the cluster directs
activity.
2.
Average number of I/O operations per second to the tape volume. For
each tape, the total I/O per second is reported, followed by a breakdown
of this activity from contributing nodes, when applicable.
3.
Average number of I/O requests waiting for service to the tape. The
average queue size for each tape is followed by a breakdown of this value
from contributing nodes, when applicable.
4.
Average number of kilobytes per second transferred to or from the tape.
5.
Average size of the I/O operations to the tape, in pages. The average size
for each tape is followed by a breakdown of this value from contributing
nodes, when applicable.
6.
Name of the node that uses the various tape volumes. For rows in which
no source node name appears, the data refers to the cluster-wide activity
on the tape volume.
7.
Name of the node that services I/O requests.
8.
Percentage of time that I/O requests are outstanding to the volume for
each node utilizing the tape volume.
9.
Percentage of total I/O activity devoted to read operations. This value for
each tape is followed by the percentage of read operations to the tape
from contributing nodes, when applicable.
10. Percentage of total I/O activity that was split I/O operations. This value for
each tape is followed by the percentage of read operations to the tape
from contributing nodes, when applicable.
Chapter 3: Evaluate Performance in Detail 59
Performance Evaluation Report
11. Tape volume type. In this example, all of the tapes are TA90Es.
12. Count of the Performance Manager records containing data for a tape
volume during the interval.
The following example shows the cluster-wide tape statistics section of the
Performance Evaluation report:
Performance
Evaluation
CLUSTER
Page
2
PA Vx.x
Wednesday 14-JAN-2006 09:00 to 19:20
+-----------------------------------------------------------------------+
| The following tables gives the summary of all tape activity as seen
|
| by the indicated node.
|
+-----------------------------------------------------------------------+
Cluster
Node
------1
SUPPLY
DEMAND
NODE01
Tape
controller
---------2
MFA
MUA
MUA
MUA
MUA
MFA
MUA
MUA
Unit
---3
0
0
1
0
1
0
0
1
Percent
of records
with activity
------------4
0.813
0.000
0.000
0.000
0.000
0.000
0.000
0.000
Metrics during active records
----------------------------- Device
I/Os/sec
Errors/sec
Type
----------- ----------------5
6
7
0.325
0.000
TU78
0.000
0.000
TA78
0.000
0.000
TA78
0.000
0.000
TA78
0.000
0.000
TA78
0.000
0.000
TU78
0.000
0.000
TA78
0.000
0.000
TA78
The following statements are keyed to the columns in the previous example:
1.
Node name
2.
Tape controller
3.
Unit number
4.
Percentage of records having tape activity on a given node during the
interval
5.
I/Os per second to the tape controller unit
6.
Errors per second
7.
Tape controller unit type
60 Performance Manager Administrator Guide
Performance Evaluation Report
Interpret cluster-wide Hot File Statistics
In the Performance Evaluation Report, the hot file statistics follow the clusterwide tape statistics. The hot file statistics highlight the files with the most I/O
operations for each disk in the configuration. By default, the 20 hottest files
are provided for each disk; however, you can change this number by
specifying /HOTFILE_LIMIT=n on the command line.
To display only the hot file statistics section of the report, use the following
qualifier:
/INCLUDE=HOTFILE_STATISTICS
To disable the hot file statistics display from the Performance Evaluation
Report, use the following qualifier:
/INCLUDE=NOHOTFILE_STATISTICS
The following example shows the hot file statistics section of the Performance
Evaluation report:
Performance
Evaluation
CLUSTER
Page
1
PA Vx.x
Wednesday 04-JAN-2006 11:00 to 11:45
+-----------------------------------------------------------------------+
| The following table gives a summary of the top 20 hottest files
|
| as collected for disks with a queue higher than the /HOT_QUEUE value. |
+-----------------------------------------------------------------------+
IO Rate %
%
Peak
--------- Ops Ops
Time
Rec
Dev Avg Peak Rds Spl DD-HH:MM Cnt
File spec
--- ---- ---- --- --- -------- --- -----------------------------------------BORDEAUX ($3$DUA29)
1
2
3
4
5
6
7
8
0.03 0.03
0 33 4-11:46
1 [VAXMAN.OSF] PROJECT_PLAN.TXT;5
0.02 0.02
0 50 4-11:46
1 (40672,3,0)
0.01 0.02 100
0 4-11:44
2 [VAXMAN.REMINDER] WRK.DIR;1
0.01 0.01 100
0 4-11:46
1 [LANGELO] CIRRUS_ROM.DIR;1
.
.
.
.
.
.
.
.
.
.
.
.
.
.
.
.
.
.
.
.
.
ZINFANDEL ($3$DUA30)
3.25 3.42 55
0 4-11:44
2 (Non Virtual QIO)
0.03 0.03 40
0 4-11:46
2 [DECPS.DATABASE] PSDC$YQUEM_1991OCT04.CPD;1
0.02 0.03 100 50 4-11:44
2 [DECPS.DATABASE] PSDC$SCHEDULE.DAT;1
0.02 0.02 100
0 4-11:44
1 [DECPS] DATABASE.DIR;1
The following statements are keyed to the columns in the previous example:
1.
The disk device and volume name.
2.
The average I/O rate, in I/O operations per second, for the intervals of
time when the file is “hot.”
Chapter 3: Evaluate Performance in Detail 61
Performance Evaluation Report
3.
The peak I/O rate, in I/O operations per second, for the interval record
when the file is “hottest.”
4.
The percentage of I/O activity devoted to file READs.
5.
The percentage of I/O activity where a split I/O operation occurred.
6.
The interval time for the peak file activity. The hours and minutes are
preceded by the day of the month. In this case, 4--11:46 represents
October 4 at 11:46 a.m. Because this report can span multiple days, the
Performance Manager reports the day as well as the time in this field.
7.
The record count indicates the number of Performance data records during
the reporting period in which the file is “hot.”
8.
The file specification for the hot file. If the file is deleted before the
Performance Manager detects its specification, the FID is provided in
parentheses instead of its name. All non-virtual QIO activity to the disk is
reported under the filespec “(Non Virtual QIO).”
Interpret cluster-wide Summary Statistics
In the Performance Evaluation Report, the summary statistics follow the
cluster-wide hot file statistics. The summary statistics highlight the CPU and
memory utilization for the configuration.
To display only the summary statistics section of the report, use the following
qualifier:
/INCLUDE=SUMMARY_STATISTICS
To disable the summary statistics display from the report, use this qualifier:
/INCLUDE=NOSUMMARY_STATISTICS
62 Performance Manager Administrator Guide
Performance Evaluation Report
The following example shows the summary statistics section of the
Performance Evaluation report:
Performance
Evaluation
CLUSTER
Page
PA Vx.x
Tuesday 26-JAN-2006 09:00 to 10:00
1
+-----------------------------------------------------------------------+
| The following table gives a summary of the average CPU and MEMORY
|
| utilization, and average number of jobs by type for each node.
|
+-----------------------------------------------------------------------+
Average number of processes
Node
-----1
LATOUR
YQUEM
GALLO
Hardware Type
---------------------2
VAX 8700
VAX 6000-440
VAX 8700
CPU
%Util
----3
29.4
32.4
27.9
MEM
%Util
----4
50.3
62.6
85.1
---------------------------Intractv Batch Netwrk Detach
-------- ----- ------ -----5
6
7
8
35.38 0.16
4.13 40.02
115.05 3.00
6.34 41.00
30.66 1.00
4.48 56.01
User Command: ADVISE PERF REPORT PERF/BEG=26-JAN-2006 09:00:00.00/END=26-JAN-2006 10:00:00.00/INCLUDE=SUMMARY/OUT=EXAMPLE_3_13.INFO
9
The following statements are keyed to the previous example:
1.
Node name.
2.
Type of processor. LATOUR is a VAX 8700, YQUEM is a VAX 6000-400, and
GALLO is a VAX 8700.
3.
Average percentage of time that each node's CPU was used during the
reporting time period. On an SMP system, all active processors are
considered when computing this value.
4.
Average percentage of each node's memory that was used during the
reporting time period.
5.
Average number of interactive jobs, by node, during the reporting period.
6.
Average number of batch jobs, by node, during the reporting period.
7.
Average number of network jobs, by node, during the reporting period.
8.
Average number of detached jobs, by node, during the reporting period.
9.
Command line used to generate the requested report.
Chapter 3: Evaluate Performance in Detail 63
Histograms
Histograms
Histograms provide a chronological view of the CPU, memory, disk, and
terminal I/O use for each node, as well as node status information. Select
histograms by specifying the HISTOGRAM option in the command line as
follows:
$ ADVISE PERFORMANCE REPORT HISTOGRAMS
The data in histograms shows how the system is being used during the
specified time interval. A shorter reporting period alters the scale of the
histograms, providing finer resolution. This information helps you doublecheck some of the conclusions reached by the Performance Manager, including
CPU and memory limitations.
Image Residence Histograms
You can also plot the residence time for a specified interactive image. The
residence time is the time, in seconds, between image activation and image
termination. This information can help you track images that consume a fixed
amount of resources, such as a database update. Changes in the affect the
residence time of jobs that use a fixed amount of resources.
In the CPU Utilization histogram, interrupts (designated by “X”) used
approximately 5 percent of the CPU, interactive jobs used 10 percent of the
CPU, and batch jobs used 85 percent of CPU at approximately 11:30 a.m. on
October 1, 2007.
An asterisk (*) appears in the histogram if there is a discrepancy between the
total CPU utilization and the utilization accounted for by processes. This can
happen if the image activation rate is high and the Performance Agent cannot
capture all of the image activity.
64 Performance Manager Administrator Guide
Histograms
CPU Utilization Histogram
The following example shows a CPU Utilization histogram:
Histograms
DEMAND (VAX 8700)
Page
1
PA Vx.x
Wednesday 01-OCT-2007 00:00 to 12:16
*--------------------*
|
Legend: 1
|
|
|
| D DECnet jobs
|
| I interactive
|
| B batch
|
| O overhead
|
|
(swapper+netacp)|
| X intrupt & mpsync|
| * other
|
*--------------------*
CPU utilization
%used 2
--------------100 !
BBB
95 !
BBB
B
90 ! D
BBB
B
85 ! BB
BBB
BB
80 ! BB
BBB
BB
75 ! BB
BBB
B BBB
70 ! BB
BBB
B BBBB
65 ! BB
BBB
B BBBB
60 ! BB
BBB
B BBBB
55 ! BB
BBB
B BBBB
50 ! BBB
BBB
B BBBB
45 ! BBB
BBB
B BBBB
40 ! BBBB
BBB
II B BBBB
35 ! IBBB BB
BBBB
II BB BBBI
30 ! IBBBBBB
BBBB
II BB BBBII
25 ! IBBBBBB
BBBB
I II BBBBBBII
20 ! IBBIBBB
BBBB
IIIIIBIIIIBBIII
15 ! IBIIBBB
B
BBBB
I
IIIIIIIIIIBIIII
10 ! IIIIIIIB
B
BBBB
IIIII IIIIIIIIIIIIIIII
5 ! XXXXXXXB
B
B
B
B
B
XIBXI IXXXXXXXXXXXXXXXXXXXXXXXX
! -----01----02----03----04----05----06----07---08----09----10----11----12
3
Each Column represents approximately 10 minutes starting from
1-OCT 00:00:00 to 1-OCT 12:16:44. An "N" indicates NO DATA.
The following statements are keyed to the CPU Utilization histogram example:
1.
Explanatory list of symbols in the histogram columns.
2.
Percentage of CPU time used by categories of processes and system
overhead.
3.
Number of hours spanned by the reporting period. This histogram reflects
a reporting period of 12 hours.
Chapter 3: Evaluate Performance in Detail 65
Histograms
Physical Memory Use Histogram
The following example shows a physical memory use histogram:
Histograms
DEMAND (VAX 8700)
Page
6
PA Vx.x
Tuesday 06-SEP-2005 00:00 to 23:59
*-------------------*
|
Legend: 1
|
|
|
| m Modified List
|
| . Free List
|
| u User Ws
|
| s Tot Wss For All |
|
'System' Users |
PHYSICAL MEMORY USAGE
| v VMS Allocated
|
% of memory 2
--------------------*-------------------*
100 ! ...........................................u............................
95 ! ..................................uuuuuuuuuu..uuu.......................
90 ! ................................uuuuuuuuuuuuuuuuu.......................
85 ! ..............................uuuuuuuuuuuuuuuuuuuu......................
80 ! ..............................uuuuuuuuuuuuuuuuuuuuu.....................
75 ! ..............................uuuuuuuuuuuuuuuuuuuuu.....................
70 ! .............................uuuuuuuuuuuuuuuuuuuuuuu....................
65 ! ............................uuuuuuuuuuuuuuuuuuuuuuuuuuuuu...............
60 ! ...........................uuuuuuuuuuuuuuuuuuuuuuuuuuuuuu...............
55 ! ..........................uuuuuuuuuuuuuuuuuuuuuuuuuuuuuuu...............
50 ! .........................uuuuuuuuuuuuuuuuuuuuuuuuuuuuuuuu...............
45 ! ........................uuuuuuuuuuuuuuuuuuuuuuuuuuuuuuuuuuu.............
40 ! ..............uu.......uuuuuuuuuuuuuuuuuuuuuuuuuuuuuuuuuuuuu............
35 ! u....uuuuuuuuussuuuuuuuuuuuussssssssssssssssuuuuuuuuuuuuussuuuuuuuuuuuuu
30 ! ssssssssssssssssssssssssssssssssssssssssssssssssssssssssssssssssssssssss
25 ! vvvvvvvvvvvvvvvvvvvvvvvvvvvvvvvvvvvvvvvvvvvvvvvvvvvvvvvvvvvvvvvvvvvvvvvv
20 ! vvvvvvvvvvvvvvvvvvvvvvvvvvvvvvvvvvvvvvvvvvvvvvvvvvvvvvvvvvvvvvvvvvvvvvvv
15 ! vvvvvvvvvvvvvvvvvvvvvvvvvvvvvvvvvvvvvvvvvvvvvvvvvvvvvvvvvvvvvvvvvvvvvvvv
10 ! vvvvvvvvvvvvvvvvvvvvvvvvvvvvvvvvvvvvvvvvvvvvvvvvvvvvvvvvvvvvvvvvvvvvvvvv
5 ! vvvvvvvvvvvvvvvvvvvvvvvvvvvvvvvvvvvvvvvvvvvvvvvvvvvvvvvvvvvvvvvvvvvvvvvv
! ---01-02-03-04-05-06-07-08-09-10-11-12-13-14-15-16-17-18-19-20-21-22-233
Each Column represents approximately 20 minutes starting from
6-SEP 00:00:00 to 6-SEP 23:59:00. An "N" indicates NO DATA.
The following statements are keyed to the columns in the previous example:
1.
Explanatory list of units in the histogram columns.
2.
Percentage of memory used.
3.
Number of hours spanned by the reporting period. This histogram reflects
a reporting period of 24 hours.
66 Performance Manager Administrator Guide
Histograms
Disk I/O Per Second Histogram
The following example shows a disk I/O per second histogram:
Histograms
PA Vx.x
DEMAND (VAX 8700)
Page
7
Tuesday 06-SEP-2005 00:00 to 23:59
IOs
150
145
100
95
90
85
80
75
70
65
60
55
50
45
40
35
30
25
20
15
10
5
*---------------*
|
Legend: 1 |
|
|
| * user io
|
| P pag+swping |
*---------------*
DISK I/O PER SECOND
per sec 2
------------------!
!
!
!
!
!
!
!
!
!
!
!
!
!
!
!
**
!
**
!
*
**
* **
!
*
****PP** * ** * *
!
*
* * ****PP***P*P**** *****
!
P*
*****PP*PPPPP*PPPPPPP*PPPP** *** *
! *P*P**PPPP****P**PP*PPP*PPPPPPPPPPPPPPPPPPPPPPPPPPPPPPPPPPPPP*P**PP*PPPP
! ---01-02-03-04-05-06-07-08-09-10-11-12-13-14-15-16-17-18-19-20-21-22-233
Each Column represents approximately 20 minutes starting from
6-SEP 00:00:00 to 6-SEP 23:59:00. An "N" indicates NO DATA.
The following statements are keyed to the previous example:
1.
Explanatory list of units in the histogram columns.
2.
The number of disk I/Os per second attributable to either user I/O or
paging and swapping.
3.
Number of hours spanned by the reporting period. This histogram reflects
a reporting period of 24 hours.
Chapter 3: Evaluate Performance in Detail 67
Histograms
Terminal I/O Per Second Histogram
The following example shows a terminal I/O per second histogram:
Histograms
PA Vx.x
IOs
100
95
90
85
80
75
70
65
60
55
50
45
40
35
30
25
20
15
10
5
DEMAND (VAX 8700)
Page
8
Tuesday 06-SEP-2005 00:00 to 23:59
*---------------*
|
Legend: 1 |
|
|
| L = LTx
|
| T = TTx
|
| X = TXx
|
| V = NVx
|
| W = WTx/TWx |
TERMINAL I/O PER SECOND
| R = RTx
|
----------------------*---------------*
per sec 2
!
!
!
!
!
!
!
!
!
!
!
!
!
L
!
L
!
L LL
!
L L LL
L
LL
!
L LLLLL RLLL LLLL LL L L
!
LLLLLLLLLRLLLLLLLLLLLLLL LL
!
LLLLLLLLLLLRLLLLLRLLLLLLLLLLLL
!
LLLLLLLLRLLRLLLLLLLRLLLLLRRLRLLLLRLLLLLLLLLLLLLL
LL
! ---01-02-03-04-05-06-07-08-09-10-11-12-13-14-15-16-17-18-19-20-21-22-233
Each Column represents approximately 20 minutes starting from
6-SEP 00:00:00 to 6-SEP 23:59:00. An "N" indicates NO DATA.
The following statements are keyed to the columns in the previous example:
1.
Explanatory list of units in the histogram columns.
2.
The number of terminal I/Os per second.
3.
Number of hours spanned by the reporting period. This histogram reflects
a reporting period of 24 hours.
68 Performance Manager Administrator Guide
Histograms
System Uptime Chart Histogram
The following example shows a system uptime chart histogram:
Histograms
PA Vx.x
CLUSTER
Page
13
Tuesday 06-SEP-2005 00:00 to 23:59
+-------------------------------------------------------------------------+
| The following chart presents the status of each node in the cluster
|
| over the report time period.
|
+-----------------------------------------+
Legend: 1
|
|
|
| "." Node up with data
|
| "n" Node up (no data wanted) |
| "N" Node up (no data found) |
| "d" Node down
|
| "u" unknown (and no data)
|
+-------------------------------+
2
DEMAND |........................................................................
TWIST |........................................................................
OLIVER |........................................................................
|---01-02-03-04-05-06-07-08-09-10-11-12-13-14-15-16-17-18-19-20-21-22-23
3
Each Column represents approximately 20 minutes starting from
6-SEP 00:00:00 to 6-SEP 23:59:00.
The following statements are keyed to the columns in the previous example:
1.
Explanatory node status.
2.
List of node names in the cluster.
3.
Number of hours spanned by the reporting period. This histogram reflects
a reporting period of 24 hours.
Chapter 3: Evaluate Performance in Detail 69
Histograms
Combined CPU Usage Chart Histogram
The following example shows a combined CPU usage chart histogram:
Histograms
PA Vx.x
CLUSTER
Page
17
Friday 18-SEP-2005 00:00 to 23:59
*----------------------------------*
|
Legend: 1
|
|
|
|
a = SUPPLY
b = DEMAND
|
|
c = NODE01
|
|
O = Cluster Utilization
|
|
(Scaled by CPU speed)
|
*----------------------------------*
COMBINED CPU USAGE CHART
% utilized 2
-----------------------100 !
.
.
.
70 !
65 !
aa
60 !
aa
a..a
55 !
a..3
....
50 !
...
a....a
45 !
a...a
a......
40 !
.....
.......
35 !
a.....a
a.......a
30 !
aaaaa
.......
a.........
25 ! aaaaaaaaaaaaaaaa.....aaaaa aa.......a
aa..........a
20 ! ..........................a.....OOOO. a.............
15 ! ...OOOO.......................OO....OOaOOOOOOOOOOOO..a
c
10 ! ..O....O...............OOOOOOO........O............OO.aaaaaOOOa O 4
5 ! OO bbbbbOOOOOOOOOOOOOOObbbbbbbbbbbbb...bbbbb..bbbbbb.OOOOOObbbO
OO OOO
0 !
bbbbbbbbcccccbb
bbb
bb
bbbb
O
! ---01-02-03-04-05-06-07-08-09-10-11-12-13-14-15-16-17-18-19-20-21-22-235
Each Column represents approximately 20 minutes starting from
18-SEP 00:00:00 to 18-SEP 23:59:00. An "N" indicates NO DATA.
The following statements are keyed to the previous example:
1.
Explanatory list of symbols in the histogram columns.
2.
Percentage utilizations of the most- and least-used nodes in a cluster for a
requested period.
3.
Imbalance in cluster-wide CPU use (represented by periods).
4.
cluster-wide averages (designated by O) for all of the nodes included in
the report. Os print on top of all other symbols when coincident with
another legal symbol.
5.
Number of hours spanned by the reporting period. This histogram reflects
a reporting period of 24 hours.
70 Performance Manager Administrator Guide
Tabular Report Sections
Tabular Report Sections
The Tabular Report provides statistics summarized by classes of metrics.
These classes include CPU, DISK, IO, LOCK, MEMORY, PAGING, PROCESS,
SCS, and CACHE. The report classes are accessed by using the SECTION
qualifier.
The sections include the following classes:
■
Configuration Section
Overview section listing node, collection interval and reporting interval
information
■
Summary Section
Presents classes CPU, IO, LOCK, MEMORY, PAGING, SCS, and CACHE.
■
Disk Section
Presents the DISK metrics class.
■
Process Section and Extended Process Section
Presents the PROCESS metrics class.
Because the Tabular Process Metrics displays the information by PID,
IMAGENAME, PROCESSNAME, ACCOUNT, and USERNAME, you must specify all
these key levels when selecting data in either command mode or via the
DECwindows interface.
The Tabular report can be requested in either a final form, which presents the
data summarized over the entire reporting period specified, or in an interval
form, which presents a series of sub-reports for the reporting interval
specified. For example, if the overall time period indicated by the /BEGIN and
/END qualifiers is one hour, and the /INTERVAL qualifier is used with a value of
600 seconds, each requested report section is produced 6 times, summarizing
successive 10 minute periods.
The Interval reports (all sections) are available from the DCL command line
interface. Command mode does not provide access to the Interval reports. The
DECwindows Motif interface allows viewing of interval data with the exception
of the Process Section.
Examples of final tabular reports are shown in the following sections.
To display the Tabular Report, specify the ADVISE PERFORMANCE REPORT
TABULAR command.
Chapter 3: Evaluate Performance in Detail 71
Tabular Report Sections
System Configuration Data
The following example shows a tabular report with system configuration data:
Tabular Report
PA Vx.x
Tuesday 26-JAN-2006 09:00 to 10:00
YQUEM (VAX 6000-440)
Page
1
+------------------------------------- VAX VMS System Configuration -------------------------------------+
!
!
! Node : YQUEM
!
! Data collection started : 26-JAN-2006 09:00:00.00
!
! Data collection ended :
26-JAN-2006 09:02:00.00
!
! Sample interval :
120 seconds /
2.0 minutes
!
! Report generated :
12-FEB-2006 17:08:14.35
!
! Processor type is : VAX 6000-440
!
! Running VMS version V5.4-3
!
! Total memory : 524288 pages = 256.00 MB
!
! Non-paged memory =
70012 pages (13.4 % of total memory)
!
! Paged memory = 454276 pages (86.6 % of total memory)
!
! System working set = 16384 pages ( 3.6 % of paged memory)
!
! User memory (paged-system working set) = 437892 pages (96.4 %of paged memory : 83.5 %of total memory) !
!
!
+--------------------------------------------------------------------------------------------------------+
System configuration data consists of the following items:
Node
The name of the node for which the system configuration data has been
gathered.
Data collection started
The date/time data collections were started.
Data collection ended
The date/time of the last record in the log file.
Example interval
The interval at which data is collected, also referred to as the collection
interval. The collection interval is expressed in seconds and minutes. Data
is collected during each interval and written to the log file at the specified
intervals.
Report generated
The time when the report was generated.
Processor type is
The VAX processor type, for example, 6000-440.
72 Performance Manager Administrator Guide
Tabular Report Sections
Running OpenVMS version
The current version of OpenVMS.
Total memory
The total physical memory used by the OpenVMS operating system in
pages and in megabytes. This is the smaller of the actual physical memory
on the system and the system parameter PHYSICALPAGES.
For Integrity and Alpha systems, memory figures are presented as
pagelets (512 bytes).
Nonpaged memory
The difference between the amount of total memory and paged memory:
(total memory)-(paged memory)
expressed in pages and as a percentage of total memory. It includes the
PFN database, nonpaged executive code and data, nonpaged pool, and the
system header. If the system parameters POOLPAGING or SYSPAGING are
set to zero, then the paged pool or paged system pages, which are
normally paged in the system working set, are instead allocated as
nonpaged memory.
Paged memory
The total paged memory is expressed in pages and as a percentage of
total memory and is represented by the PFN database. This memory is
consumed by the user working sets, the system working set, and the page
cache (free and modified page lists).
System working set
The number of pages set by the system parameter SYSMWCNT is
expressed in pages and as a percentage of paged memory.
User memory
The difference between the amount of paged memory and the system
working set:
(paged memory) - (system working set)
These are expressed in pages and as percentages of both paged and total
memory. It represents the memory available for user working sets and the
free and modified page lists.
Chapter 3: Evaluate Performance in Detail 73
Tabular Report Sections
Summary Statistics Sections
The following example shows the Summary Statistics sections:
Tabular Report
PA Vx.x
Tuesday 26-JAN-2006 09:00 to 10:00
************************
************************
YQUEM (VAX 6000-440)
Page
Node: YQUEM
Final Statistics
Data Analyzed: from 26-JAN-2006 09:00:00.00 to 26-JAN-2006 10:00:00.00
1
***********************
***********************
+--- Avg Process-Memory Counts ---+------- Memory Utilization -------+- Avg Mem/CPU -+------------- Swapper Counts --------------+
!
!
!
Queues
!
!
! Proc
Balset
Free
Modify !
Total
Paged
User
Modify !
!
Header Header Swapper !
! Count
Count
Pages
Pages ! MEMutl MEMutl MEMutl MEMutl ! Mem
CPU ! InSWP
OutSWP InSWP
OutSWP
CPU %
!
! ------ ------ ------- ------ ! ------ ------ ------ ------ ! --------- ! ------ ------ ------ ------ -----!
!
164
162
180700
15491 !
65.5 % 56.6 % 58.7 %
3.5 % !
0
0 !
0
0
0
0
0.0 % !
+---------------------------------+----------------------------------+---------------+-------------------------------------------+
+----------------------------- CPU Statistics --------------------------+------------------+
! CPU
Total
MP
Inter
!
!
!
ID
Idle Synch
Stack
Kernel
Exec
Super
User
Compat ! System
Task
!
! --- ------ ------ ------ ------ ------ ------ ------ ------ ! ------ ------ !
!
1
64.4 %
0.7 % 18.7 %
2.7 %
0.9 %
0.0 % 12.7 %
0.0 % !
22.9 % 12.7 % !
!
4
70.3 %
2.9 %
0.7 % 11.1 %
2.9 %
0.0 % 12.2 %
0.0 % !
17.5 % 12.2 % !
!
5
68.4 %
3.0 %
0.7 % 12.0 %
3.0 %
0.1 % 12.9 %
0.0 % !
18.6 % 12.9 % !
!
6
67.3 %
2.9 %
0.7 % 11.8 %
3.3 %
0.1 % 14.0 %
0.0 % !
18.7 % 14.0 % !
+-----------------------------------------------------------------------+------------------+
+-------- Lost CPU --------+----------- CPU and I/O Overlap ----------+
!
Page
!
!
!
Page
Swap
or Swp ! CPU+IO
CPU
I/O
Multi
CPU+IO !
!
Wait
Wait
Wait
!
Idle
Only
Only
I/O
Busy
!
! ------ ------ ------ ! ------ ------ ------ ------ ------ !
!
3.4 %
0.0 %
3.5 % !
0.0 %
0.0 % 64.3 % 82.5 % 35.7 % !
+--------------------------+------------------------------------------+
+--------------------------------------- Paging Rates (per second) ----------------------+
!
!
! Page
System
Pages
Read
Pages
Write
Free
Modify Dzero
Gvalid WritIn !
! Faults Faults
Read
I/Os
Writen
I/Os
List
List
Faults Faults
Prog !
! ------ ------ ------ ------ ------ ------ ------ ------ ------ ------ ------ !
!
69.0
0.0
13.6
1.1
0.4
0.0
9.8
15.3
23.3
19.4
0.0 !
+----------------------------------------------------------------------------------------+
+--------- I/O Rates (per second) ---------+
!
!
! Direct Buffrd Lognam Mailbx Mailbx !
!
I/Os
I/Os
Trans
Reads Writes !
! ------ ------ ------ ------ ------ !
!
27.3
86.6
22.7
13.3
13.3 !
+------------------------------------------+
74 Performance Manager Administrator Guide
+----------------+
!
!
! Hard
Soft
!
! Faults Faults !
! ------ ------ !
!
1.7 % 98.3 %!
+----------------+
+------ File I/O Rates (per second) -----+
!
!
! Window Window
Split
Erase
File !
! Hits
Turns
I/Os
I/Os
Opens !
! ------ ------ ------ ------ ------ !
!
26.4
1.0
0.4
0.0
0.8 !
+----------------------------------------+
+----------+
!
AVE
!
!
Open
!
!
Files !
! ------ !
!
990.2 !
+----------+
Tabular Report Sections
Tabular Report
PA Vx.x
Tuesday 26-JAN-2006 09:00 to 10:00
YQUEM (VAX 6000-440)
+---------- File Cache Attempt Rate (per second) ----------+
!
!
!
Dir
Dir
File
File
Bit
!
!
FCB
Data
Quota
Id
Hdr
Extent
Map
!
! ------ ------ ------ ------ ------ ------ ------ !
!
1.7
4.8
0.1
0.1
2.9
0.5
0.1 !
+----------------------------------------------------------+
Page
2
+----------------- File cache Effectivness ----------------+
!
!
!
Dir
Dir
File
File
Bit
!
!
FCB
Data
Quota
Id
Hdr
Extent
Map
!
! ------ ------ ------ ------ ------ ------ ------ !
!
98.9 % 94.2 % 40.0 % 99.8 % 90.9 % 96.1 % 28.2 % !
+----------------------------------------------------------+
+------------------------------------ Lock Rates (per second) -----------------------------------+
!
!
!
Directory
Deadlock
!
!
New ENQ
Converted ENQ
DEQ
Blocking AST
Functions
Messages
!
! -------------- -------------- -------------- -------------- -------------- -------------- !
! Local
29.4
Local
10.4
Local
7.1
Local
27.0
!
!
In
15.1
In
9.1
In
29.2
In
10.4
In
7.1
In
0.0 !
!
Out
0.0
Out
0.0
Out
2.5
Out
2.5
Out
0.0
Out
0.0 !
+------------------------------------------------------------------------------------------------+
+----------------- Lock Counts ----------------+
!
!
! ENQ
ENQ
Dlock
Dlock
Total
Total !
! Wait
NotQD
Search
Find
Locks
Resrcs!
!------ ------ ------ ------ ------ ------!
!
697
865
1
0
17745
13322!
+----------------------------------------------+
+--------------------------------------- System Communication Service Rates (per second) ----------------------------------------+
!
!
!
Data G
Data G
Data G
Msgs
Msgs
Snd Cr
Send
K Byte
Reqst
K Byte
K Byte
Buf Dsc !
!
Node Name
Sent
Recvd
Discd
Sent
Recvd
Queued
Data
Sent
Data
Reqd
Mapd
Queued
!
!
--------------------------------------------------------------------!
!
YQUEM
0.0
0.0
0.0
0.0
0.0
0.0
0.0
0.0
0.0
0.0
0.0
0.0
!
!
BLUE
0.0
0.0
0.0
7.9
7.9
0.0
0.0
0.0
0.0
0.0
34.4
0.0
!
!
LATOUR
0.0
0.0
0.0
22.3
28.8
0.0
0.0
0.0
0.0
0.0
0.0
0.0
!
!
GALLO
0.0
0.0
0.0
23.5
23.1
0.0
0.0
0.0
0.0
0.0
0.0
0.0
!
!
ERNEST
0.0
0.0
0.0
15.0
15.0
0.0
0.0
0.0
0.0
0.0
31.1
0.0
!
!
NUN
0.0
0.0
0.0
0.1
0.2
0.0
0.0
0.0
0.0
0.0
0.0
0.0
!
!
JULIO
0.0
0.0
0.0
5.8
5.8
0.0
0.0
0.0
0.0
0.0
12.8
0.0
!
+--------------------------------------------------------------------------------------------------------------------------------+
User Command: ADVISE PERF REPORT TAB/SECT=SUMM/NODE=YQUEM/BEG=26-JAN-2006 09:00:00.00/END=26-JAN-2006 10:00:00.00/OUT=TAB_SUM.YQUEM
Avg Process-Memory Counts
Average memory statistics provide page, process, and cache information.
These metrics are collected from OpenVMS performance statistics.
Proc Count
The number of processes in the system (including SWAPPER).
Balset Count
The number of processes resident in the balance set.
Chapter 3: Evaluate Performance in Detail 75
Tabular Report Sections
Free Pages
The free page list size that is based upon the average number of pages in
the free list for the reporting interval.
Modify Pages
The modified page list size that represents the average number of
modified pages for the reporting interval.
Memory Utilization
This section reports memory utilization for the reporting interval.
Total MEMutl
The percentage of total available memory that is being utilized, computed
as (total system memory - free pages) / (Total Memory).
Paged MEMutl
The percentage of pageable memory utilized in the interval, computed as
(paged memory - free pages) / (Paged Memory).
User MEMutl
The percentage of user memory being utilized in the interval, computed as
(user memory - free pages) / (User Memory).
Modify MEMutl
The percentage of modified memory being utilized, computed as (modify
pages) / (user memory).
Avg Mem/CPU Queues
This section reports the number of times processes were waiting for memory
or CPU.
Mem
The average number of processes waiting for available memory.
Equivalent to the count of processes in the computable outswapped queue
(COMO).
CPU
The average number of processes waiting for the CPU. There is a queue if
this number is greater than one (1) (the process that would have run in
absence of the Performance collection process). Equivalent to the sum of
processes in the computable queue (COM).
76 Performance Manager Administrator Guide
Tabular Report Sections
Swapper Counts
This section reports the metrics of the swapper process.
InSWP
The number of process inswaps performed during the reporting interval.
OutSWP
The number of process outswaps performed during the reporting interval.
Header
The number of process headers swapped in during the reporting interval.
Header OutSWP
The number of process headers swapped out during the reporting interval.
A process body may be swapped out without outswapping the
corresponding header.
Swapper CPU %
The percentage of CPU time used by the SWAPPER process. This includes
time for swapping, modified page writing, and process working set
trimming activities. Also some of the swapper activity may be reported as
MP_SYNCH time.
CPU Statistics
In a multiprocessor system, the statistics for the additional processors are
included for the following metrics:
CPU ID
A unique number distinguishing one processor from another.
Total Idle
The percentage of time that the CPU was idle.
MP_SYNCH Wait
The time a CPU spends waiting to acquire a spinlock in kernel mode. This
metric is always 0 on a single processor system.
Inter Stack
Percentage of CPU time spent executing on the interrupt stack.
Kernel
Percentage of CPU time spent executing in kernel mode (for example,
while in the OpenVMS executive) but not on the interrupt stack.
Exec
Percentage of time the CPU spent executing in executive mode. For
example, RMS is usually executed in executive mode.
Chapter 3: Evaluate Performance in Detail 77
Tabular Report Sections
Super
Percentage of time the CPU spent executing in supervisor mode. For
example, DCL normally executes in supervisor mode.
User
Percentage of time the CPU spent executing in user mode.
Compat
Percentage of CPU time spent in (PDP-11) compatibility mode. Not all
processors support compatibility mode; hence, in these cases this value is
always zero.
System
Computed as the sum of the interrupt, busy wait, kernel, and executive
CPU Busy percentages. This metric represents the amount of CPU time the
system uses to keep itself running and can be thought of as overhead.
Task
Computed as the sum of the supervisor, user, and compatibility mode
busy percentages. This metric represents the amount of CPU time the
system uses to perform work.
Lost CPU
This section reports occurrences of the CPU's inability to execute because of
some memory limitation.
Page Wait
Percentage of time that the CPU was idle and at least one disk device had
paging I/O in progress. In a multiprocessor system, all CPUs must be idle.
Swap Wait
Percentage of time that the CPU was idle and at least one disk device had
swapping I/O in progress. This includes both swapping and modified page
writing. In a multiprocessor system, both CPUs must be idle.
Page or Swp Wait
Percentage of time that the CPU was idle and at least one disk device had
either page I/O or swap I/O in progress. In a multiprocessor system, both
CPUs must be idle. Page and swap data is based on statistics Performance
collects at 100-millisecond intervals from I/Os waiting to be processed.
78 Performance Manager Administrator Guide
Tabular Report Sections
CPU and I/O Overlap
This section reports the CPU and I/O overlap statistics collected by the
PSDCTIMER.EXE timer driver.
CPU+IO Idle
The percentage of time that the CPU and all disk devices were idle.
CPU Only
The percentage of time (non-overlapped CPU time) that a CPU was busy,
and no disk device was busy.
I/O Only
The percentage of time that the CPU or all CPUs in a multiprocessor
system were idle and at least one disk device
Multi I/O
The percentage of time that two or more of the disk devices were busy.
CPU+IO Busy
The percentage of time (overlapped CPU and I/O time) that both the CPU
(at least one CPU in a multiprocessor system)and at least one disk device
were busy.
Note: CPU and I/O overlap statistics are not available if the PSDCTIMER.EXE
driver was not loaded when data was collected.
Paging Rates
This section reports paging subsystem or memory management metrics. This
data is collected from OpenVMS performance statistics.
Page Faults
The total number of page faults per second (both hard and soft) during the
reporting interval. This includes system faults.
System Faults
The number of page faults incurred in system space per second during the
reporting interval. The following are examples of system components that
are pageable in system space: XQP caches, logical name tables, process
page tables, global page table, and some OpenVMS executive code, for
example, RMS. System Fault is a special designation for a page fault, in
addition to the types of faults described below.
Chapter 3: Evaluate Performance in Detail 79
Tabular Report Sections
Pages Read
The number of pages read per second to resolve page faults during the
reporting interval. Note that this may be from a page file, an image file, or
a file-backed global section.
Read I/Os
The number of page read I/O operations per second during the reporting
interval.
Pages Written
The number of pages written per second to disk during the reporting
interval, including pages written to the swapping file, to mapped image
sections, and to the paging file for modified page writing. Not included are
pages written to user files (RMS).
Write I/Os
The number of page write I/O operations per second during the reporting
interval.
Free List
The number of page faults per second resolved from the free list during
the reporting interval.
Modify List
The number of page faults per second resolved from the modified list
during the reporting interval.
Dzero Faults
The number of page faults per second resolved as demand zero pages
during the reporting interval.
Gvalid Faults
The number of page faults per second resolved as valid global pages
(already in memory) during the reporting interval.
WritIn Prog
WritIn Prog faults are the number of page faults per second resolved from
pages currently being written to disk.
Hard Faults
The percentage of Page Faults that required a read from disk. This is (read
I/Os)/(page faults) expressed as a percentage.
Soft Faults
The percentage of page faults that were resolved from memory, that is,
without reading from disk. This is equal to (100 - hard faults) percent.
80 Performance Manager Administrator Guide
Tabular Report Sections
I/O Rates
This section describes the I/O subsystem collected from OpenVMS
performance data.
Direct I/Os
The number of direct I/O operations performed per second during the
reporting interval, exclusive of page and swap I/O. This system-wide
statistic is also exclusive of I/O to mapped image sections, but includes
RMS I/O.
Buffrd I/Os
The number of buffered I/O operations system-wide, performed per
second during the reporting interval.
Lognam Trans
The number of logical name translations system-wide, performed per
second during the reporting interval.
Mailbx Reads
The number of mailbox reads system-wide, performed per second during
the reporting interval.
Mailbx Write
The number of mailbox writes performed per second during the reporting
interval.
File I/O Rates
This section reports file system metrics (XQP) collected from OpenVMS
performance statistics.
Window Hits
The number of times the executive I/O subsystem successfully maps a
virtual to logical segment, without needing to invoke XQP services.
Window Turns
The number of times the XQP updates the Window Control Block (WCB).
Window turns occur when the executive I/O subsystem fails to map a
virtual-to-logical segment using the current contents of the Window
Control Block (WCB). The XQP updates the WCB with virtual-to-logical
mapping information by reading a new portion of the file's header from
disk or cache and reissues the I/O transfer. A large number of window
turns usually indicate that a file or volume is fragmented. If the WCB is
regarded as a cache of file mapping pointers, each window turn indicates a
cache miss.
Chapter 3: Evaluate Performance in Detail 81
Tabular Report Sections
A very large file may cause excess window turns due to its size, even if the
file is contiguous. This is because the maximum size of a window control
block pointer is 65K blocks. If you encounter this case, you should provide
a larger default window size when mounting the disk.
Split I/Os
The number of times the executive must map and queue a segment in a
multi-segment request to a driver. A split I/O occurs when the executive
I/O subsystem cannot map a single logical I/O request as a single
physically contiguous request and must split the logical request into
multiple physical segments. Usually Split I/Os result from transfers
occurring on fragmented disks.
Erase
The number of disk erase I/O operations per second (for example, when
the DCL commands DELETE/ERASE or PURGE/ERASE are used).
File Opens
This is the number of file open requests during the reporting interval.
AVE Open Files
This section reports open files.
AVE Open File
This is the average number of open files on any disk device during the
reporting interval.
File Cache Attempt Rate
This section reports the file system cache statistics. System caches hold
frequently accessed disk blocks of various types. Blocks in file cache do not
require disk I/O; therefore, the use of caches expedites I/O requests.
Dir FCB
The number of attempts per second that were made to find directory file
control blocks in the directory cache.
Dir Data
The number of attempts per second that were made to find directory data
in the directory cache.
Quota
The number of attempts per second that were made to find entries in the
quota cache.
82 Performance Manager Administrator Guide
Tabular Report Sections
File Id
The number of attempts per second that were made to find file identifiers
in the file ID cache.
File Hdr
The number of attempts per second that were made to find
in the file header cache.
file headers
Extent
The number of attempts per second that were made to find extents in the
extent cache.
Bit Map
The number of attempts per second that were made to find entries in the
bit map cache.
File Cache Effectiveness
For each item (for example, Dir FCB), the effectiveness is computed as the
ratio of (item hits)/(item hits + item misses) expressed as a percentage.
Dir FCB
The effectiveness of the directory cache for finding directory file control
blocks.
Dir Data
The effectiveness of the directory cache for finding directory data.
Quota
The effectiveness of the quota cache.
File Id
The effectiveness of the file ID cache.
File Hdr
The effectiveness of the file header cache.
Extent
The effectiveness of the extend cache.
Bit Map
The effectiveness of the bit map cache.
Chapter 3: Evaluate Performance in Detail 83
Tabular Report Sections
Lock Rates
This section reports the lock manager metrics collected from OpenVMS
performance statistics. This report contains three columns: Local, In and Out.
Each of these columns report rates for a variety of lock manipulation requests,
such as New ENQ, Converted ENQ, and DEQ.
Rates for locking information are:
Local
Lock manipulation requests made at the local node for the benefit of that
node.
In
Lock manipulation requests coming to the local node from other nodes in a
cluster.
Out
Lock manipulation requests being sent from the local node to other nodes
in the cluster.
Lock manipulation requests are:
New ENQ
The number of new locks requested (enqueued) per second.
Converted ENQ
The number of lock conversion requests per second.
DEQ
he number of locks released (dequeued) per second.
Blocking AST
The number of blocking ASTs received per second. Use of blocking ASTs
allows a process to lock a resource and then release it only when another
process requests that resource. When another process requests a lock on
the resource, a blocking AST is delivered to the process currently holding
the lock.
Directory Functions
The number of messages per second for directory operations. There are
three categories: the rate for lookups in a directory, the rate for inserts in
a directory, and the rate for deletes from a directory.
Deadlock Messages
The number of messages per second required for deadlock detection.
84 Performance Manager Administrator Guide
Tabular Report Sections
Lock Counts
This section reports lock statistics. With the exception of the Total Resrcs field,
all data is collected from OpenVMS performance statistics.
ENQ Wait
The number of times lock requests were forced to wait.
ENQ NotQD
The number of times a lock request was not granted (process failed to get
lock and did not wait).
DLock Search
The number of times a search for deadlocks was initiated by the system.
The system parameter, DEADLOCK_WAIT, defines the number of seconds
that a lock request must wait before the system initiates a deadlock search
on behalf of that lock.
DLock Find
The number of times a deadlock was found. The system selects a victim of
the deadlock and does not grant the new lock or lock conversion request.
Total Locks
The total number of locks taken out on all resources. This number is an
average of the examples taken at each recording interval over the
reporting interval.
Total Resrcs
The total number of resources that can be locked. This number is an
average of the examples taken at each recording interval over the
reporting interval.
System Communication Service Rates
These statistics are collected from OpenVMS performance statistics for each
node in a cluster that was present during the reporting interval. Each line of
statistics gives the name of the node that is sending data to, or receiving data
from, the local node. There are three types of messages:
■
Datagrams
■
Block transfers
■
Sequenced messages
Chapter 3: Evaluate Performance in Detail 85
Tabular Report Sections
Datagrams are used primarily by DECnet, the CI, and by the HSC for error
logging. The delivery and order of messages is not guaranteed.
For block transfer mode, if I/Os are targeted to disks on an HSC, the Kbytes
mapped by the local node are recorded, but not the transfer counts, nor the
Kbytes transferred. This is because the HSC actually initiates the block mode
transfer.
If I/Os are targeted to disks hosted on an OpenVMS node (MSCP server), the
hosting OpenVMS node shows the transfer counts, and Kbytes mapped as I/O
that it initiated to satisfy requests for data made by a remote node. This is the
only time numbers for transfer counts and Kbytes transferred are reported.
The initiator of the transfer is not the node that issues the initial QIO but the
node that issues the SCS directive for block mode transfer services to satisfy
the I/O request.
Sequenced messages are used by the Distributed Lock and Connection
Managers, also implicitly in disk I/O to set up block mode transfers. For
sequenced messages SCS imposes its own flow control, and delivery and order
of messages is guaranteed.
Data G Sent
Rate (number per second) at which datagrams are sent to the named node
by the local node doing the data collection.
Data G Recvd
Rate (number per second) at which datagrams are received from the
named node by the local node doing the data collection.
Data G Discd
Rate (number per second) at which datagrams are discarded by the CI
port driver because a receive buffer is not available. This is the rate at
which datagrams are sent to, but never received by, the named node from
the local node doing the data collection.
Msgs Sent
Rate (number per second) at which sequenced messages are sent to the
named node by the local node doing the data collection.
Msgs Recvd
Rate (number per second) at which sequenced messages are received
from the named node by the local node doing the data collection.
Snd Cr Queued
Metric related to sequenced messages. The number of times that a local
node Sysap (system application) had to wait for sufficient “credits” on the
target node to become available to complete a transfer. The number of
credits is controlled by the system parameter SCSRESPCNT.
86 Performance Manager Administrator Guide
Tabular Report Sections
Send Data
Metric related to block transfers. The number of times per second that
data was written to a remote node using block mode transfers that were
initiated by the local node. This field is zero for all other nodes in the list.
K Byte Sent
The amount of information, in Kbytes, written to some remote node using
block mode transfers that were initiated by the local node. (Used for block
transfers, primarily HSC, MSCP, and Connection Manager transfers.) This
field is zero for all other nodes in the list.
A process on a remote node does a QIO read from a disk that is hosted
locally. The MSCP server on the local node has to read the data from the
local disk, then do an SCS Send Data Directive that initiates a block mode
transfer to write that data to the remote node.
Reqst Data
Metric related to block transfers. The number of times per second that
data was read from a remote node using block mode transfers that were
initiated by the local node. This field is zero for all other nodes in the list.
K Byte Reqd
The amount of information, in Kbytes, read from a remote node using
block mode transfers that were initiated by the local node. (Used for block
transfers, primarily HSC, MSCP, and Connection Manager transfers.) This
field is zero for all other nodes in the list.
A process on a remote node does a QIO write to a disk that is hosted
locally. The MSCP server on the local node has to do an SCS Request Data
Directive that initiates a block mode transfer to read from the remote node
so that it can write that data to the local disk.
K Byte Mapd
The amount of buffer space, in kilobytes, mapped to receive data from or
send data to the named node by the local node doing the data collection.
Used for block transfers, primarily HSC, MSCP, and Connection Manager
transfers.
Buf Dsc Queued
Metric related to block transfers. The number of times that a local node
Sysap attempted to map a buffer and there were no free buffer descriptor
table (BDT) entries available. The number of BDTs is controlled by the
system parameter SCSBUFCNT.
Chapter 3: Evaluate Performance in Detail 87
Tabular Report Sections
Disk and Server Statistics Section
The following example shows the Disk Statistics Section:
Tabular Report
PA Vx.x
Tuesday 26-JAN-1997 09:00 to 10:00
************************
************************
YQUEM (VAX 6000-440)
Node: YQUEM
Final Statistics
Data Analyzed: from 26-JAN-1997 09:00:00.00 to 26-JAN-1997 10:00:00.00
Page
1
***********************
***********************
+------------------------------------------------ Disk Statistics ------------------------------------------+
!
Work
Resp
!
! Node: YQUEM
Avail Paging Swping Contlr
Rate
Read
Remote
Time
Queue
Space
!
!
%
%
%
%
(/s)
%
I/O%
(ms)
Length Used %
!
!
------ ------ ------ ------ ------ ------ ------ ------ ------ -----!
! DSA0
0.0
0.0
0.0
0.0
0.0
0.0
0.0
0
0.0
95.8
!
! DSA1
0.0
0.0
0.0
0.0
0.0
0.0
0.0
0
0.0
80.9
!
! DSA10
2.2
0.0
0.0
2.4
0.7
86.7
0.0
36
0.0
61.1
!
! DSA111
11.7
26.1
0.0
14.8
4.0
71.8
0.0
34
0.1
98.8
!
! DSA12
0.6
0.0
0.0
0.5
0.1
79.3
0.0
43
0.0
32.8
!
! DSA29
0.2
0.0
0.0
0.3
0.1
56.5
0.0
35
0.0
81.8
!
! DSA30
1.0
34.9
0.0
1.0
0.3
62.4
0.0
39
0.0
99.0
!
! DSA31
2.1
0.0
0.0
2.9
0.8
57.3
0.0
30
0.0
99.9
!
! DSA32
1.0
0.0
0.0
0.9
0.2
80.6
0.0
40
0.0
99.3
!
! DSA33
0.0
0.0
0.0
0.0
0.0
93.3
0.0
28
0.0
85.0
!
! .
.
.
.
.
.
.
.
.
.
.
!
! .
.
.
.
.
.
.
.
.
.
.
!
! .
.
.
.
.
.
.
.
.
.
.
!
! YQUEM$DFSC7101
0.0
0.0
0.0
0.0
0.0
0.0
0.0
0
0.0 Unknown
!
! YQUEM$DFSC7102
0.0
0.0
0.0
0.0
0.0
0.0
0.0
0
0.0 Unknown
!
! YQUEM$DFSC7103
0.0
0.0
0.0
0.0
0.0
0.0
0.0
0
0.0 Unknown
!
! YQUEM$DFSC7104
0.0
0.0
0.0
0.0
0.0
0.0
0.0
0
0.0 Unknown
!
! YQUEM$DFSC7105
0.0
0.0
0.0
0.0
0.0
0.0
0.0
0
0.0 Unknown
!
+-----------------------------------------------------------------------------------------------------------+
User Command: ADVISE PERF REPORT TAB/SECT=DISK/NODE=YQUEM/BEG=26-JAN-1997 09:00:00.00/END=26-JAN-1997 10:00:00.00/OUT=TAB_DISK.YQUEM
The following statistics are given for each mounted disk:
Work Avail %
The percentage of time that the disk had any type of I/O request
outstanding.
Paging %
The percentage of the Work Avail time that the disk was doing paging I/O
(including I/O to and from paging files, image activations or global section
writes.
Swping %
The percentage of the Work Avail time that the disk was doing swapping
I/O. This includes both swapping and modified page writing.
Contlr %
The percentage of this disk controller's activity that was busy because of
this disk.
88 Performance Manager Administrator Guide
Tabular Report Sections
Rate(/s)
The number of I/O operations per second performed by the disk.
Read %
The percentage of read I/O performed to the disk.
Remote I/O %
The percentage of I/O to a disk performed on behalf of other nodes in a
cluster system.
Resp Time (ms)
The response time is the mean time, per I/O request, for the device in
milliseconds. This is the total time taken to perform an I/O request and is
the sum of the queuing time at the server and the service time. It is
measured from the time the I/O request is issued until the time the
controller completes the request.
Queue length
The average number of disk I/O requests waiting for service.
Space Used %
The percentage of the total disk volume space that is allocated. Reported
only for file structured and mounted disks.
The following example shows the Server Statistics Section:
+-------------------- Server Statistics ---------------------+
!
Work
!
!
Avail
Paging
Swaping
Queue
!
!
%
%
%
Length
!
!
--------------------!
! ARGOT
0.0
0.0
0.0
0.0
!
! EXURB
0.0
0.0
0.0
0.0
!
! GLIA
0.0
0.0
0.0
0.0
!
! HSC0
0.4
0.1
0.0
0.0
!
! HSC002
0.0
0.0
0.0
0.0
!
! HSC1
0.6
10.5
0.0
0.2
!
! MNGLNG
0.0
0.0
0.0
0.0
!
! SNOLPD
0.0
0.0
0.0
0.0
!
! ULTRA
0.0
0.0
0.0
0.0
!
! VERB
0.0
0.0
0.0
0.0
!
+------------------------------------------------------------+
The server statistics reported are as follows:
Work Avail %
The percentage of time there were I/O requests at the server queue. Reported
only for By Node statistics.
Chapter 3: Evaluate Performance in Detail 89
Tabular Report Sections
Paging %
The percentage of the work available marked as Page I/O.
Swping %
The percentage of work available marked as Swap I/O.
Queue Length
The average sum of the requests at the server queue.
Process Metrics Data
Process metrics consist of:
■
Standard process metrics (with image name)
■
Extended process metrics
Standard Process Metrics
The following example shows standard process metrics data. Standard process
metrics are collected by the Performance software from process data
structures and include these statistics:
PID
The process identification in hexadecimal.
Process Name
The process name.
UIC
The process user identification code.
Pri
The process priority (0 to 31). This is the priority of the process at the
time the example is taken.
State
The process scheduling state. This is the state of the process at the time
the example is taken. In final tabular statistics, the state of the last
interval is reported.
Image Count
The number of images activated by the process during the interval.
90 Performance Manager Administrator Guide
Tabular Report Sections
CPUtime (min)
The CPU time in minutes accrued by the process during the last reporting
interval.
Direct I/O
The number of direct I/O operations issued by the process during the last
reporting interval as a rate per second.
Buffrd I/O
The number of buffered I/O operations issued by the process during the
last reporting interval as a rate per second.
Page Flts
The number of page faults incurred by the process during the reporting
interval as a rate per second.
Flt I/O
The number of page fault I/Os incurred by the process during the
reporting interval as a rate per second.
Working Set (MIN/AVE/MAX)
The minimum, average, and maximum working set size for the process
during the reporting interval.
Mo
The process mode (IN=Interactive, BA=batch, NE=network,
DE=detached).
Image Name
A line containing the image name follows each process-metrics line if the
image name was collected and reported. This is the name of the image at
the time the example is taken.
Chapter 3: Evaluate Performance in Detail 91
Tabular Report Sections
Tabular Report
PA Vx.x
Tuesday 26-JAN-1997 09:00 to 10:00
************************
************************
YQUEM (VAX 6000-440)
Node: YQUEM
Final Statistics
Data Analyzed: from 26-JAN-1997 09:00:00.00 to 26-JAN-1997 10:00:00.00
Page
1
***********************
***********************
+-------------------------------------------------------- Process Metrics -------------------------------------------------------+
!
!
!
Process
Image CPUtime
DirI/O BufI/O Pg Flt FltI/O
Working Set
!
!
PID
Name
UIC
Pri State Count
(min)
/sec
/sec
/sec
/sec
MIN
AVE
MAX
Mo !
! -------- --------------- ------------- ----- ----- ----- -------- ------ ------ ------ ------ ------ ------ ------ -- !
! 29400201 SWAPPER
[1,4]
16/16 HIB
0
0.021
0.0
0.0
0.0
0.0
0
0
0 DE !
!
Swapper
!
! 29400206 CONFIGURE
[1,4]
10/ 8 HIB
0
0.038
0.0
0.0
0.0
0.0
265
265
265 DE !
!
DSA111:[SYS2.SYSCOMMON.][SYSEXE]CONFIGURE
!
! 29400209 ERRFMT
[1,6]
7/ 7 HIB
0
0.011
0.0
0.0
0.0
0.0
241
241
241 DE !
!
DSA111:[SYS2.SYSCOMMON.][SYSEXE]ERRFMT
!
! 2940020A CACHE_SERVER
[1,4]
16/16 HIB
0
0.002
0.0
0.0
0.0
0.0
215
215
215 DE !
!
DSA111:[SYS2.SYSCOMMON.][SYSEXE]FILESERV
!
!
.
.
.
.
.
.
.
.
.
.
. . !
!
.
.
.
.
.
.
.
.
.
.
. . !
!
.
.
.
.
.
.
.
.
.
.
. . !
!
DSA111:[SYS2.SYSCOMMON.][SYSEXE]LOGINOUT
!
! 29401EFB OPERATOR
[1,6]
4/ 4 CUR
12
0.073
0.0
0.1
0.4
0.0
537
1216
1295 IN !
!
DSA111:[SYS2.SYSCOMMON.][SYSEXE]LOGINOUT
!
! 29401EFC BHAT_2
[310,57]
4/ 4 CUR
1
0.008
0.0
0.0
0.0
0.0
388
568
571 IN !
!
DSA111:[SYS2.SYSCOMMON.][SYSEXE]COPY
!
! 29401EFE DQS_34061
[300,311]
4/ 4 CUR
1
0.010
0.0
0.0
0.1
0.0
403
403
403 NE !
!
DSA111:[SYS2.SYSCOMMON.][SYSEXE]LOGINOUT
!
+--------------------------------------------------------------------------------------------------------------------------------+
User Command: ADVISE PERF REPORT TAB/SECT=PROC/NODE=YQUEM/BEG=26-JAN-1997 09:00:00.00/END=26-JAN-1997 10:00:00.00/OUT=TAB_PROC.YQUEM
Extended Process Metrics
The following example shows process metrics data. Extended process
metrics include these statistics:
PID
The process identification number in hexadecimal.
User Name
The user name for the process.
Account
The account name for the process.
Globl (MIN/AVE/MAX)
The minimum, average, and maximum number of global pages in use by
the process at the reporting interval.
Priv (MIN/AVE/MAX)
The minimum, average, and maximum number of process private pages in
use by the process at the reporting interval.
92 Performance Manager Administrator Guide
Tabular Report Sections
WS Deflt
The working set default value for the process.
WS Quota
The working set quota value for the process.
WS Extnt
The working set extent value for the process.
Virt (MIN/AVE/MAX)
The minimum, average, and maximum virtual page count for the process
during the reporting interval.
Tabular Report
PA Vx.x
YQUEM (VAX 6000-440)
Page
1
Tuesday 26-JAN-2006 09:00 to 10:00
************************
************************
Node: YQUEM
Final Statistics
Data Analyzed: from 26-JAN-2006 09:00:00.00 to 26-JAN-2006 10:00:00.00
***********************
***********************
+--------------------------------------------------- Extended Process Metrics ---------------------------------------------------+
!
!
!
MIN
AVE
MAX
MIN
AVE
MAX
WS
WS
WS
MIN
AVE
MAX
!
!
PID
User Name
Account Globl
Globl
Globl
Priv
Priv
Priv
Deflt
Quota
Extnt
Virt
Virt
Virt
!
! -------- ------------ -------- ------ ------ ------ ------ ------ ------ ------ ------ ------ ------ ------ ------ !
! 29400201 SYSTEM
0
0
0
0
0
0
1
1
1
1
1
1 !
! 29400206 SYSTEM
<start>
0
0
0
265
265
265
512
1636
75000
3403
3403
3403 !
! 29400209 SYSTEM
<start>
0
0
0
241
241
241
512
1636
75000
3145
3145
3145 !
! 2940020A SYSTEM
<start>
0
0
0
215
215
215
512
1636
75000
3004
3004
3004 !
!
.
.
.
.
.
.
.
.
.
.
.
.
.
.
. !
!
.
.
.
.
.
.
.
.
.
.
.
.
.
.
. !
!
.
.
.
.
.
.
.
.
.
.
.
.
.
.
. !
! 2940027E MACNEIL
3YW
70
70
70
377
377
377
818
2048
9216
4938
4938
4938 !
! 2940027F FRIES
341
438
438
438
1816
1816
1816
818
2048
16000
10545
10545
10545 !
! 294002C3 LUNDGREN
341
165
165
165
1319
1342
1348
1024
4096
4096
8216
8323
8344 !
! 294002EC STEPHENS
341
51
51
51
374
374
374
818
2048
12288
6297
6297
6297 !
! 294010E4 BHAT
341
180
509
779
1056
4076
7158
818
2048
10000
14835
21185
21877 !
! 294010E5 RAMAN
341
20
178
193
265
1208
1299
818
2048
9216
4996
9767
10229 !
! 2940115B FRIES
341
53
53
53
360
360
360
818
2048
16000
6222
6222
6222 !
! 29401286 DBIGELOW
341
1472
1472
1472
3399
3425
3446
818
4096
9216
13888
13888
13888 !
!
.
.
.
.
.
.
.
.
.
.
.
.
.
.
. !
!
.
.
.
.
.
.
.
.
.
.
.
.
.
.
. !
!
.
.
.
.
.
.
.
.
.
.
.
.
.
.
. !
! 29401EF9 <login>
<login>
84
84
84
289
289
289
818
8192
75000
3519
3519
3519 !
! 29401EFB OPERATOR
CNB
128
286
306
408
930
989
4096
65536
75000
5236
7239
32389 !
! 29401EFC BHAT
341
58
94
95
330
474
476
818
2048
10000
4996
5609
5618 !
! 29401EFE DQS$SERVER
CNB
58
58
58
345
345
345
818
1636
9216
5580
5580
5580 !
+--------------------------------------------------------------------------------------------------------------------------------+
User Command: ADVISE PERF REPORT TAB/SECT=EXTEND/NODE=YQUEM/BEG=26-JAN-2006 09:00:00.00/END=26-JAN-2006 10:00:00.00 /OUT=TAB_PROC.YQUEM
Cluster Summary Statistics (with By Node Breakout)
Tabular cluster reports have two formats: by cluster and by node. The
following example shows final statistics by cluster. In both formats, statistics
are given for memory, CPU, disks, and locks.
Chapter 3: Evaluate Performance in Detail 93
Tabular Report Sections
Tabular Report
PA Vx.x
CLUSTER
Page
1
Tuesday 26-JAN-2006 09:00 to 09:20
************************
************************
Data Analyzed: from
Final Statistics
26-JAN-2006 09:00:00.00
to
26-JAN-2006 09:20:00.00
***********************
***********************
+---------------------------------------------- CLUSTER Memory ----------------------------------------------+
!
!
!
Total
Memory
Proc
Balset
Page
Hard
Soft
Gvalid
System InSWP
!
!
MEMutl
Queue
Count
Count
Faults
Faults
Faults
Faults
Faults Count
!
!
(%)
(avg)
(avg)
(avg)
(/sec)
(%)
(%)
(/sec)
(/sec) (tot)
!
!
---------------------------------------------- ------ !
! Node Average
67.9
0
111
109
48.9
2.4
97.6
11.2
0.0
0 !
! Node Minimum
52.4
0
79
77
28.2
1.8
96.9
5.5
0.0
0 !
! Node Maximum
87.1
0
163
161
65.5
3.1
98.2
16.1
0.0
0 !
! Cluster Total
67.2
0
333
327
146.6
2.4
97.6
33.7
0.0
0 !
+------------------------------------------------------------------------------------------------------------+
+------------------------------------------- CLUSTER CPU --------------------------------------------+--- CLUSTER I/O ---+
!
!
!
!
CPU
System
Task
CPU
CPU
CPU+IO
CPU
I/O
Multi
CPU+IO ! Direct
Buffrd !
!
Busy
CPU
CPU
Queue
Idle
Idle
Only
Only
I/O
Busy
! I/Os
I/Os
!
!
(%)
(%)
(%)
(avg)
(%)
(%)
(%)
(%)
(%)
(%)
! (/sec)
(/sec) !
!
------ ------ ------ ------ ------ ------ ------ ------ ------ ------ ! ----------- !
! Node Average
39.5
29.8
9.8
1
60.5
0.0
0.0
60.1
76.9
39.9 !
16.1
52.9 !
! Node Minimum
29.5
22.6
6.8
0
54.0
0.0
0.0
54.7
30.6
31.6 !
7.5
23.2 !
! Node Maximum
46.0
34.6
13.8
2
70.5
0.0
0.0
68.4
100.0
45.3 !
26.4
111.3 !
! Cluster Total
39.5
29.8
9.8
4
60.5
0.0
0.0
60.1
76.9
39.9 !
48.3
158.6 !
+----------------------------------------------------------------------------------------------------+-------------------+
+-------------------------- CLUSTER Lock -------------------------+
!
!
!
H-Orig
Out
Enq
Dir Op
R-Orig
!
!
Lck Act
Bound
Wait
Incomg
Lck Act !
!
(/sec)
(%)
(%)
(/sec)
(/sec)
!
!
-------------------------!
! Node Average
101.2
39.6
0.7
4.2
40.1
!
! Node Minimum
56.1
26.9
0.3
3.7
13.9
!
! Node Maximum
128.6
52.9
1.9
4.8
64.7
!
! Cluster Total
303.6
39.6
0.7
12.7
120.3
!
+-----------------------------------------------------------------+
User Command: ADVISE PERF REPORT TABULAR=BYCLUSTER/BEG=26-JAN-2006 09:00:00.00/END=26-JAN-2006 09:20:00.00 /OUT=BYCLU.TAB/SECTION=SUMMARY
Memory By Cluster Format
In the By Cluster format for summary statistics, the leftmost column of the
tabular report contains the words Node Average, Node Minimum, Node
Maximum, and Cluster Total. Each of these words begins a line of memory
statistics. For Cluster Total, the value is left blank in case of percentages.
Node Average
The average value of the statistic across all nodes in the cluster system.
Node Minimum
The minimum value of the statistic across all nodes in the cluster system.
94 Performance Manager Administrator Guide
Tabular Report Sections
Node Maximum
The maximum value of the statistic across all nodes in the cluster system.
Cluster Total
The total value of the statistic across all nodes in the cluster system.
By Node Format
The following example shows final statistics by node:
Tabular Report
PA Vx.x
CLUSTER
Page
1
Tuesday 26-JAN-2006 09:00 to 09:20
************************
************************
Data Analyzed: from
Final Statistics
26-JAN-2006 09:00:00.00
to
26-JAN-2006 09:20:00.00
***********************
***********************
+---------------------------------------------- CLUSTER Memory ----------------------------------------------+
!
!
!
Total
Memory
Proc
Balset
Page
Hard
Soft
Gvalid
System InSWP
!
!
MEMutl
Queue
Count
Count
Faults
Faults
Faults
Faults
Faults Count
!
!
(%)
(avg)
(avg)
(avg)
(/sec)
(%)
(%)
(/sec)
(/sec) (tot)
!
!
---------------------------------------------- ------ !
! LATOUR
52.4
0
79
77
65.5
3.1
96.9
12.1
0.0
0 !
! YQUEM
64.1
0
163
161
52.8
1.8
98.2
16.1
0.0
0 !
! GALLO
87.1
0
90
88
28.2
2.1
97.9
5.5
0.0
0 !
+------------------------------------------------------------------------------------------------------------+
+------------------------------------------- CLUSTER CPU --------------------------------------------+--- CLUSTER I/O ---+
!
!
!
!
CPU
System
Task
CPU
CPU
CPU+IO
CPU
I/O
Multi
CPU+IO ! Direct
Buffrd !
!
Busy
CPU
CPU
Queue
Idle
Idle
Only
Only
I/O
Busy
! I/Os
I/Os
!
!
(%)
(%)
(%)
(avg)
(%)
(%)
(%)
(%)
(%)
(%)
! (/sec)
(/sec) !
!
------ ------ ------ ------ ------ ------ ------ ------ ------ ------ ! ----------- !
! LATOUR
46.0
32.2
13.8
2
54.0
0.0
0.0
54.7
30.6
45.3 !
14.4
23.2 !
! YQUEM
29.5
22.6
6.8
0
70.5
0.0
0.0
68.4
100.0
31.6 !
26.4
111.3 !
! GALLO
43.2
34.6
8.6
1
56.8
0.0
0.0
57.3
100.0
42.7 !
7.5
24.0 !
+----------------------------------------------------------------------------------------------------+-------------------+
+-------------------------- CLUSTER Lock -------------------------+
!
!
!
H-Orig
Out
Enq
Dir Op
R-Orig
!
!
Lck Act
Bound
Wait
Incomg
Lck Act !
!
(/sec)
(%)
(%)
(/sec)
(/sec)
!
!
-------------------------!
! LATOUR
118.9
52.9
0.6
4.3
13.9
!
! YQUEM
128.6
26.9
0.3
4.8
41.7
!
! GALLO
56.1
40.4
1.9
3.7
64.7
!
+-----------------------------------------------------------------+
User Command: ADVISE PERF REPORT TABULAR=(BYNODE)/BEG=26-JAN-2006 09:00:00.00/END=26-JAN-2006 09:20:00.00 /OUT=BYCLU.TAB/SECTION=SUMMARY
In the By Node format for summary statistics, the leftmost column of the
tabular report contains the name of each node. Each node name begins a line
of summary statistics as in the case of By Cluster format. These statistics
show the contribution of each individual node to each summary statistic.
Chapter 3: Evaluate Performance in Detail 95
Tabular Report Sections
By Cluster or By Node Summary Statistics
The following is an explanation of memory statistics in By Cluster and By Node
formats:
Total MEMutl (%)
This is equal to (Total Memory - Free Pages / Total Memory).
Memory Queue (avg)
The average number of processes waiting for available memory. The value
of Memory Queue is equivalent to the count of processes in the
computable outswapped queue (COMO).
Proc Count (avg)
The number of processes in the system (including SWAPPER).
Balset Count (avg)
The number of processes resident in the balance set.
Page Faults (/sec)
The total number of page faults per second during the example interval.
Hard Faults (%)
The percentage of Page Faults that required a read from disk. This is
(Read I/Os)/(Page Faults) expressed as a percentage.
Soft Faults (%)
The percentage of Page Faults that were resolved from memory, that is,
without reading from disk. This is equal to (100 - Hard Faults) %.
Gvalid Faults (/sec)
The number of page faults per second resolved as valid global pages
(already in memory) during the example interval.
System Faults (/sec)
The number of page faults incurred in system space per second during the
example interval.
InSWP Count (avg)
The number of process inswaps performed during the last example
interval.
The following CPU statistics are reported in By Cluster and By Node
formats:
96 Performance Manager Administrator Guide
Tabular Report Sections
CPU Busy (%)
Percentage of time the CPU time spent in interrupt stack, busy wait,
kernel, executive, supervisor, user, and compatibility modes. This is the
sum of System CPU % and Task CPU %.
System CPU (%)
The sum of the interrupt, kernel, executive and busy wait CPU
percentages.
Task CPU (%)
The sum of the supervisor, user, and compatibility mode busy
percentages.
CPU Queue (avg)
The average number of processes waiting for the CPU. There is a queue if
this number is greater than one (1) (the process that would have run in
absence of the collection process). Equivalent to the sum of processes in
the computable queue (COM).
CPU Idle (%)
The percentage of time that the CPU was idle.
CPU+IO Idle (%)
The percentage of time that the CPU and all disk devices (selected for data
collection) were idle.
CPU Only (%)
The percentage of time (non-overlapped CPU time) that the CPU was busy
and no disk device (selected for data collection) was busy.
I/O Only (%)
The percentage of time (non-overlapped I/O time) that the CPU was idle
and at least one disk device (selected for data collection)was busy.
Multi I/O (%)
The percentage of time that two (2) or more disk devices (selected for
data collection) were busy.
CPU+IO Busy (%)
The percentage of time (overlapped CPU and I/O time) that both the CPU
and at least one disk device (selected for data collection) were busy.
The following I/O statistics are reported in By Cluster and By Node
formats.
Chapter 3: Evaluate Performance in Detail 97
Tabular Report Sections
Direct I/Os (/sec)
The number of direct I/O operations performed per second during the
example interval, exclusive of page and swap I/O.
Buffrd I/Os (/sec)
The number of buffered I/O operations performed per second during the
example interval.
The following lock statistics are reported in By Cluster and By Node
formats:
H-Orig Lck Act (/sec)
This metric is the Host-Originated Locking Activity per second. This is the
amount of locking activity generated by the host node. It is equal to the
sum of local and outgoing enqueue operations, plus local and outgoing
converted enqueue operations, plus local and outgoing dequeue
operations.
Out Bound (%)
This is the percentage of the host originated locking activity (above) which
had to be serviced by other nodes in the cluster. It is equal to the sum of
the outgoing enqueue, outgoing converted enqueue, and outgoing
dequeue operations, divided by the total host originated lock activity.
Enq Wait (%)
This is the percentage of enqueue and converted enqueue operations that
were forced to wait. It is equal to the enqueue wait rate, divided by the
sum of local and outgoing enqueue and local and outgoing converted
enqueue, operations.
Dir Op Incomg (/sec)
This metric is the Directory Operations Incoming per second. This is the
number of lock directory operations per second being requested of the
host node.
R-Orig Lck Act (/sec)
This is the number of locking operations performed on the host node on
behalf of other nodes in the cluster. It is equal to the sum of incoming
enqueue, incoming converted enqueue, and incoming dequeue operations.
98 Performance Manager Administrator Guide
Tabular Report Sections
Cluster Disk and Server Statistics (with By Node Breakout)
The Performance software reports disk statistics By Cluster and By Node.
Cluster statistics represent the total of all disk I/O for a cluster. By Node
statistics represent each node's contribution to the cluster I/O load. The
following example shows disk statistics by cluster:
Tabular Report
PA Vx.x
CLUSTER
Page
1
Tuesday 26-JAN-2006 09:00 to 09:20
************************
************************
Data Analyzed: from
Final Statistics
26-JAN-2006 09:00:00.00
to
26-JAN-2006 09:20:00.00
***********************
***********************
+------------------------ CLUSTER Disk Statistics -----------------------+
!
!
!
Resp
!
!
Paging Swping
Rate
Time
Queue
Space
!
!
%
%
(/s)
(ms)
Length Used % !
!
------ ------ ------ ------ ------ ------ !
!
DSA0
0.0
0.0
0.0
0
0.0
96 !
!
DSA1
0.0
0.0
0.0
0
0.0
81 !
!
DSA10
0.0
0.0
1.9
38
0.1
61 !
!
DSA111
26.5
0.0
12.4
33
0.4
99 !
!
DSA12
0.0
0.0
0.0
35
0.0
33 !
!
DSA13
0.0
0.0
0.0
27
0.0
85 !
!
DSA14
100.0
0.0
0.0
31
0.0
95 !
!
.
.
.
.
.
.
. !
!
.
.
.
.
.
.
. !
!
.
.
.
.
.
.
. !
!
YQUEM$DFSC7104
0.0
0.0
0.0
0
0.0 ...... !
!
YQUEM$DFSC7105
0.0
0.0
0.0
0
0.0 ...... !
+------------------------------------------------------------------------+
User Command: ADVISE PERF REPORT TABULAR=(BYCLUSTER)/BEG=26-JAN-2006 09:00:00.00 /END=26-JAN-2006 09:20:00.00/OUT=BYCLU.TAB/SECTION=DISK
The way the Performance software counts a node's contribution when
calculating By Node and By Cluster disk statistics is based upon the node's
relationship to the disk. There are two types of relationships a node may have
to a disk; a disk may be either hosted or served by a node.
If a node is directly connected to a disk by a MASSBUS, UNIBUS or HSC
(Hierarchical Storage Controller), the disk is hosted by the node. If a node is
not directly connected to a disk and must go through an intermediary node
that hosts the disk, the disk is served.
For the purposes of this discussion, the term, direct access, refers to the
relationship where a node hosts a disk, and the term, remote access, refers to
the relationship where a node serves a disk.
The reason a node's relationship is important when calculating disk statistics is
because the I/O of a node with remote access to a disk is processed through a
node with direct access to the disk. Therefore, rates for the node with remote
access are included in disk statistics for the node with direct access and in the
disk statistics for the remote node as well.
Chapter 3: Evaluate Performance in Detail 99
Tabular Report Sections
The calculation of Total Cluster Disk I/O rates is fairly simple; the disk
statistics from the nodes with direct access to the disk are added together.
Data from nodes with remote access to the disk is ignored, as this data is
already accounted for by nodes with direct access to the disk.
The following table is a summary of how the software calculates By Cluster
disk statistics:
Disk/Node Relationship
Calculation of Total Cluster Disk
Statistics
One or more nodes with direct
access and any number of
nodes with remote access
Add I/O data from node(s) with direct
access to disk
No nodes with direct access in Add I/O data from all nodes with remote
the collection specification and access only
one or more nodes with remote
access
Depending upon the number of nodes with direct and remote access to the
disk, computing By Node I/O disk statistics is complex and sometimes not
possible to calculate for all nodes. This is because it is not always possible to
distinguish each node's contribution to the total Cluster I/O rate.
When there is only one node with direct access to a disk and any number of
nodes with remote access, the By Node contribution of the node with direct
access is calculated as follows: Subtract the I/O statistics of any nodes with
remote access from the I/O statistics of the node with direct access. The By
Node contribution of nodes with remote access to the disk is the I/O statistic
for each remote node.
In the case of more than one node with direct access to a disk and more than
one node with remote access, calculation of each node's contribution is not
possible because there is no way to distinguish which node with direct access
performed the I/O operations for which nodes with remote access.
The following table shows a summary of how the software calculates By Node
disk statistics:
Disk/Node Relationship
Calculation of By Node Disk Statistics
One or more nodes with
direct access; no nodes with
remote access
Take I/O data from node with direct access to
disk.
100 Performance Manager Administrator Guide
Tabular Report Sections
Disk/Node Relationship
Calculation of By Node Disk Statistics
One node with direct access;
one or more nodes with
remote access
Node(s) with remote access, take I/O data
from the node with remote access. Node with
direct access, subtract all remote access
nodes' I/O statistics from the direct access
node's I/O statistics. (Information is
unavailable if all data is not present, that is,
when interval times for all nodes do not
align.)
More than one node with
direct access; more than one
node with remote access
Unable to report By Node data.
The following Example Configuration diagram below is an example system
configuration. There are two disks, DU1 and DB2, and three nodes, A, B and
C. Disk DU1 is hosted by nodes A and B; that is, nodes A and B have direct
access to DU1. Nodes A and B are served to disk DB2; that is, nodes A and B
have remote access to disk DB2. Node C has remote access to disk DU1 and
direct access to DB2.
Detailed examples of how the Performance software would calculate By Cluster
and By Node disk statistics using the example configuration are given in the
following By Cluster and By Node report format explanations.
Disk By Cluster Format
In the By Cluster format for disk statistics, the leftmost column of the tabular
report contains the name of each disk that is accessible cluster-wide. Disk
names are usually prefixed by a node name or allocation class. Each disk
name begins a line of disk statistics. Each statistic shows the activity for the
specific disk due to all nodes in the cluster.
When determining cluster-wide statistics for a disk, only statistics from nodes
with direct access are considered. This is because I/O for nodes with remote
access is processed by nodes directly accessing the disk and is therefore
already included in the node with direct access statistics. For example, the
software would calculate cluster rates for disks DU1 and DB2 in the following
figure as follows:
■
For disk DU1 with the HSC, all I/Os come to this disk through host (direct
access) nodes A and B. Therefore, adding the I/O statistics from each of
these nodes provides the total cluster I/O for disk DU1. The I/O statistics
of node C are already included in the I/O statistics for nodes A and B and
are therefore ignored.
Chapter 3: Evaluate Performance in Detail 101
Tabular Report Sections
■
For disk DB2, node C is the host (direct access) node. All I/Os come to this
disk through node C; therefore, the I/O statistic of node C provides the
total cluster I/O rate for disk DB2. As above, the I/O statistics of nodes A
and B are already included in the I/O statistics for node C and are
therefore ignored.
Example Configuration: Disk By Cluster Format
102 Performance Manager Administrator Guide
Tabular Report Sections
Disk By Node Format
The following example shows disk statistics in By Node format:
Tabular Report
PA Vx.x
CLUSTER
Page
1
Tuesday 26-JAN-2006 09:00 to 09:20
************************
************************
Data Analyzed: from
Final Statistics
26-JAN-2006 09:00:00.00
to
26-JAN-2006 09:20:00.00
***********************
***********************
+----------------------------------- BY NODE Disk Statistics -------------------------+
!
!
!
Work
Resp
!
!
Avail
Paging Swping
Rate
Time
Queue
Space
!
!
%
%
%
(/s)
(ms)
Length Used % !
!
------ ------ ------ ------ ------ ------ ------ !
! DSA0
!
!
LATOUR
0.0
0.0
0.0
0.0
0
0.0
96 !
!
YQUEM
0.0
0.0
0.0
0.0
0
0.0
96 !
!
GALLO
0.0
0.0
0.0
0.0
0
0.0
96 !
! DSA1
!
!
LATOUR
0.0
0.0
0.0
0.0
0
0.0
81 !
!
YQUEM
0.0
0.0
0.0
0.0
0
0.0
81 !
!
GALLO
0.0
0.0
0.0
0.0
0
0.0
81 !
! DSA10
!
!
LATOUR
1.9
0.0
0.0
0.6
37
0.0
61 !
!
YQUEM
3.7
0.0
0.0
1.0
40
0.0
61 !
!
GALLO
1.3
0.0
0.0
0.4
36
0.0
61 !
! DSA111
!
!
LATOUR
16.9
25.9
0.0
7.1
29
0.2
99 !
!
YQUEM
9.3
27.9
0.0
3.1
36
0.1
99 !
!
GALLO
7.7
26.3
0.0
2.2
39
0.1
99 !
!
.
.
.
.
.
.
.
. !
!
.
.
.
.
.
.
.
. !
!
.
.
.
.
.
.
.
. !
+-------------------------------------------------------------------------------------+
User Command: ADVISE PERF REPORT TABULAR=(BYNODE)/BEG=26-JAN-2006 09:00:00.00 /END=26-JAN-2006 09:20:00.00/OUT=BYCLU.TAB/SECTION=DISK
In the By Node format for disk statistics, the leftmost column of the tabular
report contains the name of each disk, followed by the name of each node
from which the disk was accessed. Following each node name is the processor
type; and if the node hosted the disk, the word host.
Each disk, with node names, begins a line of disk statistics similar to the By
Cluster format. These statistics show the contribution of each individual node
to the cluster-wide activity of a specific disk. The way the Performance
software determines a node's contribution to the cluster-wide activity of a disk
depends upon whether the node has direct or remote access to the disk. For
nodes with remote access, the I/O statistic for each node is that node's
contribution to the total cluster I/O load.
Chapter 3: Evaluate Performance in Detail 103
Tabular Report Sections
In the case of a configuration with one node with direct access to the disk and
any number of nodes with remote access, I/O statistics for the node with
direct access includes I/Os from any nodes with remote access to the disk.
Therefore, to compute the direct access node's contribution, the software
subtracts the number of I/Os of the nodes with remote access from the I/O
information of the node with direct access.
In the case of two nodes with direct access to a disk with any number of nodes
with indirect access, both direct nodes' I/O statistics include I/O from any
remote nodes. Therefore, it is not possible to compute the By Node
contribution to the cluster total of the nodes with direct access to the disk. The
By Node contribution of the nodes that access the disk remotely is each node's
I/O statistics.
For example, the software would calculate By Node rates for disks DU1 and
DB2 in the example configuration as follows. For disk DU1 with the HSC, all
I/Os come to this disk through host (direct access) Nodes A and B. The I/O
information for these nodes includes I/O from the served (remote access)
Node C. There is no way to distinguish whether Node C's I/Os were processed
by Node A or Node B. Therefore, calculating the By Node contribution for
Nodes A and B, which directly access the disk, is not possible. The By Node
contribution for Node C, which has remote access to Disk DU1, is the I/O
statistic for Node C.
For disk DB2, Node C is the host (direct access) node; all I/Os come to this
disk through Node C. Therefore, to calculate Node C's By Node contribution,
subtract from Node C's I/O information the I/O information from Nodes A and
B, which have remote access to DB2. The By Node contribution of Nodes A and
B, is each node's I/O statistics.
By Cluster and By Node Disk Statistics
The following discussion explains the By Cluster and By Node Disk Statistics.
The disk statistics reported in By Cluster and By Node formats are as follows:
Work Avail%
The percentage of time that work was available for the disk. Reported only
for By Node statistics.
Paging %
The percentage of the work available, marked as Page I/O.
Swping %
The percentage of the work available, marked as Swap I/O. This includes
both swapping and modified page writing.
Rate(/s)
The number of I/O operations per second performed by the device.
104 Performance Manager Administrator Guide
Tabular Report Sections
Resp Time(ms)
The response time. This is the mean total service time, per I/O request,
for the device in milliseconds. This is the total time taken to service an I/O
request and is the sum of the queuing time and the busy time. It is thus
measured from the time the I/O request is issued until the time the
controller completes the request. This value is computed as (Average
device queue length)/Rate.
Queue length
The average number of disk I/O requests waiting for service.
Space Used %
The percentage of the total disk volume space that is allocated. Reported
only for mounted disks.
Server By Cluster Format
The following example shows server statistics in BYCLUSTER format.
In the By Cluster format for server statistics, the leftmost column of the
tabular report contains the name of each server that is accessible cluster-wide.
Server names are followed, in parentheses, by the name of the CPU or HSC
server with which they are associated. Each server name begins a line of
server statistics. Each statistic shows the activity for the specific server due to
all nodes in the cluster, as shown in the following example:
+----------------- CLUSTER Server Statistics ---------------+
!
Alloc
Paging
Swping
Queue
!
!
Class
%
%
Length
!
!
--------------------!
! ARGOT
(VAX )
0
0.0
0.0
0.0
!
! EXURB
(VAX )
0
0.0
0.0
0.0
!
! GLIA
(VAX )
4
0.0
0.0
0.0
!
! HSC0
(HS70)
1
0.1
0.0
0.0
!
! HSC002
(HS50)
1
0.0
0.0
0.0
!
! HSC1
(HS70)
1
8.5
0.0
0.3
!
! MNGLNG
(VAX )
0
0.0
0.0
0.0
!
! SNOLPD
(VAX )
1
0.0
0.0
0.0
!
! ULTRA
(VAX )
1
0.0
0.0
0.0
!
! VERB
(VAX )
0
0.0
0.0
0.0
!
+-----------------------------------------------------------+
Chapter 3: Evaluate Performance in Detail 105
Tabular Report Sections
Server By Node Format
In the By Node format for server statistics, the leftmost column of the tabular
report contains the name of each server that is accessible cluster-wide. This is
followed by the name of each node from which the server was accessed. Each
server, by node name, begins a line of server statistics as in the case of By
Cluster format. These statistics show the contribution of each individual node
to the activity of a specific server. Server names are followed, in parentheses,
by the processor type or HSC type with which they are associated. Node
names are followed, in parentheses, by the processor type for the node. The
following example shows server statistics in BYNODE format:
+----------------- BY NODE Server Statistics ---------------+
!
!
Work Avail
Paging
Swping
Queue
!
!
%
%
%
Length
!
!
--------------------!
!
SNOLPD (VAX )
0.6
10.5
0.0
0.2
!
! MNGLNG
(VAX )
!
!
ULTRA
(VAX )
0.0
0.0
0.0
0.0
!
!
SNOLPD (VAX )
0.0
0.0
0.0
0.0
!
! SNOLPD
(VAX )
!
!
ULTRA
(VAX )
0.0
0.0
0.0
0.0
!
!
SNOLPD (VAX )
0.0
0.0
0.0
0.0
!
! ULTRA
(VAX )
!
!
ULTRA
(VAX )
0.0
0.0
0.0
0.0
!
!
SNOLPD (VAX )
0.0
0.0
0.0
0.0
!
! VERB
(VAX )
!
!
ULTRA
(VAX )
0.0
0.0
0.0
0.0
!
!
SNOLPD (VAX )
0.0
0.0
0.0
0.0
!
+-----------------------------------------------------------+
!
By Cluster and By Node Server Statistics
The server statistics reported in By Cluster and By Node formats are:
Alloc Class
The allocation class of the node or HSC associated with the server.
Reported only for By Cluster statistics.
Work Avail %
The percentage of time there were I/O requests at the server queue.
Reported only for By Node statistics.
Paging %
The percentage of the work available marked as Page I/O.
Swping %
The percentage of work available marked as Swap I/O.
Queue Length
The average sum of the requests at the server queue.
106 Performance Manager Administrator Guide
Chapter 4: Generate Historical Graphs
You can generate graphs and pie charts from current or historical data for
many aspects of the system. Numerous types of predefined graphs are
available. You can also create custom graphs to represent your site-specific
needs. These graphs can be printed or displayed on your terminal. The
/FILTER qualifier lets you select a subset of data for graphs. For more
information, see the chapter Performance Manager Commands (see
page 175).
This section contains the following topics:
Generate Predefined Graphs (see page 107)
Generate Multiple Graphs (see page 111)
Components of Graphs (see page 111)
Composite Graphs (see page 113)
Stacked Graphs (see page 113)
Create Typical Time Period Graphs (see page 113)
Scheduling (see page 114)
Use Binary Graph Data (see page 114)
Components of Pie Charts (see page 115)
Pie Chart Presentation of CPU Utilization (see page 116)
Format Graphs and Pie Charts (see page 116)
Generate Custom Graphs (see page 126)
Graph the Hot File Activity (see page 133)
Generate Predefined Graphs
You can generate predefined graphs in the following three ways:
■
At the DCL level - see the section Generate Graphs from the DCL Level
(see page 108)
■
Within the Performance Manager command mode - see the section
Generate Graphs in Command Mode (see page 108)
■
Within the DECwindows interface - see the chapter Use the DECwindows
Motif Interface (see page 257)
Regardless of the method you use, the basic process is the same. The
Performance Manager selects, reads, and buckets the data, then formats and
writes the graph to the output device.
Chapter 4: Generate Historical Graphs 107
Generate Predefined Graphs
Each method has its own advantages and disadvantages in terms of ease of
use, efficiency, and equipment. This section discusses how to create single and
multiple graphs from the DCL level and within the Performance Manager
command mode. The DECwindows Motif Interface is discussed in the chapter
Use the DECwindows Motif Interface (see page 257).
Generate Graphs from the DCL Level
Generating graphs at the DCL level offers the most efficient method of
selecting data. Only those metrics contributing to the selected graphs are
saved and bucketed when the performance data is read. The CPU demand is
mostly for reading and decoding the data files. By contrast, the data selection
for the DECwindows and command mode interfaces is somewhat more costly
because all the performance metrics are usually saved and bucketed in
anticipation of a subsequent user request to view them. See Appendix D for
information on estimating virtual memory needs and selecting data.
To generate a graph or pie chart
■
Use the following commands:
$ ADVISE PERFORMANCE GRAPH
$ ADVISE PERFORMANCE PIE_CHART
With either command, you can control the data selection by specifying a time
period and list of node names. The /TYPE qualifier specifies graphs or
performance metrics or both. The /FORMAT qualifier controls the format of the
output data. The /OUTPUT qualifier directs the output data to the desired
destination.
You can generate all of the predefined graphs in a single command by using
the /TYPE=ALL_GRAPHS qualifier. However, if you do not specify a graph, the
CPU Utilization graph is the default.
Generate Graphs in Command Mode
If you are investigating performance data interactively, generating graphs
from command mode offers several distinct advantages. Once the data has
been loaded into memory, you can view graphs and reports quickly, skipping
around as dictated by your investigation, without causing the input data to be
reread and reanalyzed. Also, if you need to produce output files in different
formats, command mode is more efficient than using DCL commands.
108 Performance Manager Administrator Guide
Generate Predefined Graphs
To invoke command mode
■
Enter the following command:
$ ADVISE PERFORMANCE
PSPA>
In command mode, you must first select the data you want to use, and then
you specify the method you want to use to view it.
The graphs can be viewed in ReGIS mode on a terminal, and then written to a
file in Postscript, for example, without having to reread and analyze the data.
Also, you can switch between graphs and pie charts without reprocessing the
data.
To select data, enter the SELECT command and specify the processing options
you want to use. You can specify any or all of these processing options:
ANALYSIS, PERFORMANCE, and GRAPHS. For example:
PSPA> SELECT GRAPHS /NODE=SUPPLY
This command selects data for node SUPPLY; subsequent GRAPH commands
use this data to generate graphs.
The ANALYSIS option provides the results of the factory rules and optionally
user rules that may fire as a result of your performance data.
The PERFORMANCE_EVALUATION option allows you to view and output
sections of the Performance Evaluation Report and Tabular Report, which
contain statistics about the system, including process and disk activity, and
summaries.
The GRAPHS option lets you control how data is to be selected for subsequent
graphing operations (including pie charts). The GRAPHS option has the
following eight sub-options:
■
IMAGENAMES
■
USERNAMES
■
HOTFILES
■
USERVOLUMES
■
IO_DEVICES (and workloads)
■
BY_NODE
Chapter 4: Generate Historical Graphs 109
Generate Predefined Graphs
■
ALL
■
DEFAULT
DEFAULT, generates graphs for IMAGENAMES, USERNAMES, and IO_DEVICES
(and workloads).
DEFAULT is used in the absence of any specified graph processing options. ALL
is equivalent to the complete list: IMAGENAMES, USERNAMES, HOTFILES,
USERVOLUMES, IO_DEVICES (and workloads), and BY_NODE.
Note that when you are processing a large amount of data, each option can
pose significant additional CPU and memory demands on your process.
If you specify NOALL, only system-level metrics are saved. NOALL is helpful
when you need to select data as fast as possible, and retain the ability to
generate graphs for the system-level metrics. The system-level metrics are
always saved BY_NODE as well.
The processing options IMAGENAMES, USERNAMES, HOTFILES, IO_DEVICES
(and workloads), and USERVOLUMES cause the selection process to maintain
the graph statistics for each unique occurrence of an image name, user name,
and so forth. The BY_NODE option causes these statistics to be maintained on
both a per-node and a composite (all nodes) basis. The BY_NODE option can
increase the memory demands to select the data, as a factor of the number of
nodes being selected. See Appendix D for information on estimating virtual
memory needs and selecting data.
After selecting the data, you can specify as many GRAPH, PIE_CHART, or
REPORT commands as you wish. You can also select more data. The chapter
“Using Command Mode Commands” describes the commands available in
command mode.
Because Performance Manager provides so many different choices for
predefined and custom graphs, you may prefer to use an interactive dialogue
to make your selections.
110 Performance Manager Administrator Guide
Generate Multiple Graphs
You can request this interactive prompting from within command mode by
entering the GRAPH/TYPE=PROMPT command. The Performance Manager's
response is as follows:
PSPA> GRAPH/TYPE=PROMPT
Please select either
1) a predefined graph or
2) a custom graph
Choice: [1]:
Enter the graph type keyword (<cr> for list): cpu_utilization
A graph is produced. When you press Return, prompting continues.
Generate Multiple Graphs
When you generate multiple graphs with one DCL command or in Command
Mode, you can produce a separate output file for each graph by specifying the
/OUTPUT qualifier. The Performance Manager names each file according to the
node and graph type with a default or user-specified file type.
For example, the following command creates a separate graph output file for
each graph. The files reside in the default directory, and are named
SUPPLY_CPU_UTILIZATION.REG and SUPPLY_TOP_BUSY_VOLUMES.REG.
$ ADVISE PERFORMANCE GRAPH/TYPE=(CPU_UTILIZATION,TOP_BUSY_VOLUMES)_$ /FORMAT=REGIS=CHARACTERISTIC=COLOR/NODE=SUPPLY/OUT=[]
You can specify device, directory, and filenames with the /OUTPUT qualifier if
you do not want to take the defaults.
Components of Graphs
Each graph has the same basic components, as shown in the following table:
Component
Applies to
Title
graphs and pie charts
Subtitle
graphs and pie charts
Axis labels
graphs only
Chapter 4: Generate Historical Graphs 111
Components of Graphs
X- and Y-axis markers
graphs only
Legend
graphs only
Units and Unit total
pie charts only
MIN, MAX, and AVG
graphs only, if one metric or if items
are stacked
The following list describes each component:
Title
For the predefined graphs, the title identifies the type of graph and is
centered at the top of the graph. For custom graphs, the title is PSPA
CUSTOM GRAPH unless you specify a title. Titles for ReGIS and PostScript
graphs are in enlarged characters.
Subtitle
The graph and pie chart subtitle gives the node name (or the list of node
names for composite graphs) and the date and time of the selected data.
Also, the x-axis data points and the width, in time, of each point, is
provided for graphs.
Axis Labels
All graphs have Time implied as the x-axis label. Labels for the y-axis
specify the units of the plotted values, for example, Page Faults Per
Second. If metrics of differing units coexist on the graph, the y-axis label
is blank.
Y-Axis Markers
Axis markers indicate the magnitude and time of any point on the graph.
The x-markers indicate the time and are displayed differently depending
on the graphic format. The x-markers are displayed as HH:MM, HH,
MM:SS, MM, DD, or MMM depending on the graph time range, and graphic
format. When graphing historical data, month or even years may appear,
depending on the time range selected.
The y-markers are based on the maximum value of all the data points. The
increments are obtained from an internal table to make the graph easy to
read. You may define the maximum value on the y-axis by using, the
Y_AXIS_MAXIMUM keyword.
Legend
The legend appears at the bottom of the graph for all graphs other than
ANSI graphs. The legend identifies the name of the metric, and the color,
pattern, or graph character associated with it. For the predefined TOPxxx
graphs, the items are always in the same format and order; for example,
other (users, workloads, images, volumes, disks, and so forth), topmost,
second top, third top, fourth, and fifth.
112 Performance Manager Administrator Guide
Composite Graphs
Composite Graphs
If multiple nodes contribute data to a graph, the graph is considered a
composite graph. Data for each node can be added together, scaled by some
factor, and added, or averaged. The method used depends on the metric being
displayed. CPU percentages are scaled by CPU VUP rating, then added.
Response times, I/O sizes, and disk space are averaged for each node and all
other metrics are summed for each node.
To generate composite graphs, specify /COMPOSITE on the DCL command
line, or if in command mode with more than one nodes data selected, omit the
/NODE qualifier. When using Windows, the CLUSTER option or ALL NODES
option generates the composite graph.
You can recognize a composite graph if there is more than one node listed in
the subtitle.
Note: When you produce a composite Graph or Pie Chart and the nodes
contribute data to the graph for different time periods (possibly missing data),
the results are undefined. Composite Graphs and Pie Charts show accurate
totals and averages when the data for the nodes correspond to the same time
period.
Stacked Graphs
Graphs showing more than one metric can be displayed either stacked or
unstacked. When stacked, the metric data points are added such that the topmost category on the graph plots the sum of all the metrics. You can specify
that all graphs be stacked with the /STACK qualifier or you can specify that
none are to be stacked with the /NOSTACK qualifier. Also, each graph you
request can have its own specific stack or nostack attribute.
Stacking is provided by default on some graphs, where it makes good sense to
do so, and the remaining graphs are provided unstacked. Specifically, rates,
percentages, and counts are stacked by default, and response times, I/O size,
and disk space utilization are unstacked, by default.
Create Typical Time Period Graphs
If you want your graphs to represent a typical time period, such as an average
day, you can turn on graph averaging. On the DCL command line, specify
/AVERAGE=DAILY (WEEKLY, MONTHLY, and QUARTERLY are also options).
From command mode the /AVERAGE qualifier must be specified with the
SELECT verb. Window users can set this option from the Select Data dialog
box under Additional Options....
Chapter 4: Generate Historical Graphs 113
Scheduling
If you want a typical Monday type graph, you specify /AVERAGE=WEEKLY and
specify a schedule with only Monday as indicated in the following example:
/SCHEDULE=(NOEVERYDAY,MON=0-24)
If history data, with the periodicity attribute set, is used for the graph, the
history's periodicity is used for (and overrides) the graph averaging.
Scheduling
If you want certain time periods included and others not included on the
graph, you can use a combination of the schedule and dates features. The
/SCHEDULE qualifier, and the schedule time clocks in the window interface,
allow you to specify desired hours on a weekly basis for inclusion on the
graph. If you need more specific selection time frames, you can use a DATES
file (see the /DATES qualifier), which specifies an unlimited number of date
ranges, to indicate the desired time frames for inclusion in the graph.
You may want to use both the /DATES qualifier and the /SCHEDULE qualifier
together. For example, if you need a graph depicting an average Monday
through Thursday prime time for the first week of September, October,
November and December of 2005, your schedule and dates file would be as
follows:
MYDATES.DAT:
07-SEP-2005,11-SEP-2005
05-OCT-2005,09-OCT-2005
02-NOV-2005,06-NOV-2005
07-DEC-2005,11-DEC-2005
To use this dates file
■
Enter a command similar to the following:
$ ADVISE PERFORMANCE GRAPH/SCHEDULE=(NOWEEKENDS,WEEKDAYS=(9-12 -,
_$ 14-17),NOFRIDAY)/DATES=MYDATES.DAT/AVERAGE=WEEKLY
Use Binary Graph Data
The DECwindows and the command mode interfaces let you save the graph
data that you selected for viewing into a file. This binary file can later be
reloaded into either of the interfaces and the graphs presented, eliminating the
need for re-analyzing the data.
114 Performance Manager Administrator Guide
Components of Pie Charts
The following example shows the command mode interface:
$ ADVISE PERFORMANCE
PSPA> SELECT GRAPHS=BY_NODE /BEG=26-JAN-2006:9/END=26-JAN-2006:17
PSPA> SAVE JAN26.GRAPHS
PSPA> EXIT
$ ADVISE PERFORMANCE
PSPA> LOAD JAN26.GRAPHS
PSPA> GRAPH /TYPE=CPU_UTILIZATION /NODE=NODE1
You can modify the PSPA$DAILY.COM file in PSPA$EXAMPLES to save the
graph data during a nightly batch job and the next day, load the data if the
analysis report indicated any problems.
Components of Pie Charts
Each pie chart includes the following components:
Title
For the predefined pie charts, the title identifies the type of pie chart.
Subtitle
The pie chart subtitle gives the node name (or the list of node names for
composite pie charts) and the date and time of the selected data.
Whole Pie Represents
The Whole Pie represents the sum of metric values represented by each
pie slice.
Pie Slices
The Pie Slices represent the average value of the metric over the time
period presented in descending order by value.
Label
The label associated with each slice identifies the metric or item being
presented along with the percentage contribution to the pie chart. The
actual value of the metric can be obtained through either the tabular or
CSV pie chart formats.
Legend
The legend identifies the name of the metric, and the color, pattern, or
character associated with it.
Chapter 4: Generate Historical Graphs 115
Pie Chart Presentation of CPU Utilization
Pie Chart Presentation of CPU Utilization
Pie charts that reflect metrics measured in terms of CPU percentages now
have two possible presentations. If you specify /PERCENTAGE=MAXIMUM, the
pie is drawn in terms of 100 percent, with an IDLE section appearing. If you
specify /PERCENTAGE=TOTAL the pie is drawn to represent the total of the
metrics presented.
For example, if you are producing a pie chart of CPU utilization and the parts
of the pie chart have the following values:
■
Interactive 30%
■
Batch
10%
■
Network
5%
■
Overhead
1%
■
Interrupts 5%
■
Other
0%
If you specify /PERCENTAGE=MAXIMUM, the pie chart contains an idle slice
representing 49 percent of the total pie with the remaining 51 percent
representing their respective slices.
If you specify /PERCENTAGE=TOTAL, the pie chart represents the sum of
these parts, a total of 51 percent utilization, with the largest slice of the pie
(approximately 3/5) being represented by Interactive.
If you do not specify /PERCENTAGE on the PIE command line, then
/PERCENTAGE=MAXIMUM is assumed. This qualifier has no effect on graphs,
custom pie charts, or pie charts of metrics other than CPU Utilization.
Format Graphs and Pie Charts
You can control the format of the Performance Manager's graphs and pie
charts. The following formats are available:
Format available
Graphs
Pie Charts
PostScript
Y
y
Tabular
Y
y
CSV
Y
y
ReGIS
Y
ANSI
Y
116 Performance Manager Administrator Guide
Format Graphs and Pie Charts
The ANSI-formatted, tabular and PostScript output can be printed on any
output device. Color graphs print or display on monochrome devices in shades
of gray.
See the discussion on the logical names to change the colors of the ReGIS and
PostScript graphs in the Appendix Performance Manager Logical Names (see
page 405).
Refresh a ReGIS Graph with New Characteristics
After you generate a ReGIS graph to the SYS$OUTPUT device, you receive the
following prompt:
Type <CR> to continue
If a broadcast message disrupts the display of the ReGIS graph you can refresh
the display with the following procedure. You can either enter a C (for color), P
(for pattern), or L (for line) to regenerate the graph currently on the screen
with a changed characteristic. The DCL qualifiers that obtain these
characteristics are as follows:
/FORMAT=ReGIS=CHARACTERISTIC=COLOR
/FORMAT=ReGIS=CHARACTERISTIC=LINE
/FORMAT=ReGIS=CHARACTERISTIC=PATTERN
With each method, it is possible to redraw the current graph if a broadcast
message disrupts the display.
Chapter 4: Generate Historical Graphs 117
Format Graphs and Pie Charts
Output Formats
The following figure, PostScript Graph, illustrates a PostScript formatted
pattern graph. The graph was generated with the following command:
$ ADVISE PERFORMANCE GRAPH/BEGINNING=19-FEB-2006:13:00/ENDING=19-FEB-2006:17:00 _$ /TYPE=CPU_UTILIZATION/NODE=GALLO/OUTPUT=CH4CPU.PS _$ /FORMAT=POSTSCRIPT=CHARACTERISTIC=PATTERN
The following figure, PostScript Formatted Line Graph, illustrates a PostScript
formatted line graph. The graph was generated with the following command:
$ ADVISE PERFORMANCE GRAPH/BEGINNING=19-FEB-2006:13:00
_$ /ENDING=19-FEB-_$2006:17:00/TYPE=CPU_UTILIZATION/NODE=GALLO
_$ /FORMAT=POSTSCRIPT=CHARACTERISTICS=LINE/OUTPUT=CPU_LINE.PS
118 Performance Manager Administrator Guide
Format Graphs and Pie Charts
The LINE keyword is used with the /NOSTACK qualifier to avoid occlusion.
Chapter 4: Generate Historical Graphs 119
Format Graphs and Pie Charts
ANSI Formatted Graph is the same CPU utilization graph as Tabular Formatted
Graph in ANSI formatted output. The default width of an ANSI graph is 132
characters. This graph overrides the default width. It was generated with the
following command:
$ ADVISE PERFORMANCE GRAPH/BEGINNING=19-FEB-2006:13:00/ENDING=19-FEB-2006:17:00 _$ TYPE=CPU_UTILIZATION/NODE=GALLO/OUTPUT=CPU.LIS _$ /FORMAT=ANSI=(WIDTH=79,HEIGHT=25)
CPU UTILIZATION
Node: GALLO
Date: 19-FEB-2006 13:00-17:00
LEGEND:
* = Other
N = Network
B = Batch
I = Interactive
D = Detached
X = Intstk+MPsynch
(Metric Values are Stacked)
Y-Units: Percent of CPU
100 !
N
* NNNNNNNNNNNNNNNNNNN
96 !
NIN NNNNNBINNNBNINNBNBNNNNB
92 !
*NINNNNBIBIIIIIBIIIBBIBIIIIBI
88 !
NIIINIIIIIIIIIIIIIIIIIIIIIIII N
84 !
IIIIIIIIIIIIIIIIIIIIIIIIIIIII IN
80 !
N
IIIIIIIIIIIIIIIIIIIIIIIIIIIIIN IB
76 !
B
IIIIIIIIIIIIIIIIIIIIIIIIIIIIIN II
72 !
* I
IIIIIIIIIIIIIIIIIIIIIIIIIIIIIB II
68 !
N I
IIIIIIIIIIIIIIIIIIIIIIIIIIIIIBNII
64 !
N D
IIIIIIIIIIIIIIIIIIIIIIIIIIIIIBNII
60 !
D D
NIIIIIIIIIIIIIIIIIIIIIIIIIIIIIBBII
56 !
D D
NIIIIIIIIIIIIIIIIIIIIIIIIIIIIIIBII
52 !
DNDN
IIIDIIIIIIIIIIIIIIIIIIIIIIIIIIIBIIN N
48 !I
N DBDIN INDIIDIIIIIIIIIIIIIIIIIIIIIIIIIIIBIII N
44 !I
I DIDDI IIDIIDIIIIIIIIIIIIIIIIIIIIIIIIIIIIIIIN IN
40 !D
N I DIDDI IDDIIDIIIIIIIIIIIIIIIIIIIIIIIIIIIIIIIN II
36 !D
D D DIDDDIDDDIIDIIIIIIIIIIIIIIIIIIIIIIIIIIIIIIIINIIN
32 !D IN D DNDDDDDIDDDDIDIIIIIIIIIIIIIIIIIIIIIIIIIIIIIIIIIIIN
28 !DNIDID NDNDDDDDIDDDDIDIIIIIIIIIIIIIIIIDIIIIIIIIIIIIIIIIIINN
24 !DIDDDDNNDIDDDDDIDDDDIDDIIIIDIDDIIIIIIDDDIIIIIIIDDIIIIIIIIINNN*
*
N
20 !DIDDDDDDDDXDXDDDXDDDDDDIIIIDDDDDDIIIIXXDDDDDDDDDDDDDIIIDIIIININNNNNNDN
16 !DDDDDDDDDXXXXDDDXXXXDDDDDDDDDXXDDDDDDXXXXDDXXDDXXDDDDDIDDDDIIDDNDDIIIDN
12 !DDDXXXXDXXXXXXXXXXXXXXDXXXXXXXXXXXXXXXXXXXXXXXXXXXXXXDDXDDDDDXXDDDDDDDD
8 !XXXXXXXXXXXXXXXXXXXXXXXXXXXXXXXXXXXXXXXXXXXXXXXXXXXXXXXXXXXXXXXXXXXXXXX
4 !XXXXXXXXXXXXXXXXXXXXXXXXXXXXXXXXXXXXXXXXXXXXXXXXXXXXXXXXXXXXXXXXXXXXXXX
++-----+-----+-----+-----+-----+-----+-----+-----+-----+-----+-----+---13:00 13:20 13:40 14:00 14:20 14:41 15:01 15:21 15:41 16:01 16:22 16:42
Min:
12.72
Max: 100.00
Average:
62.51
120 Performance Manager Administrator Guide
Format Graphs and Pie Charts
The following table, Tabular Formatted Output, illustrates tabular formatted
output. Tabular output is in 132-column format. It was generated with the
following command:
$ ADVISE PERFORMANCE GRAPH/BEGINNING=19-FEB-2006:13:00/ENDING=19-FEB-2006:17:00 _$ /TYPE=CPU_UTILIZATION/NODE=GALLO/OUTPUT=CPU_TAB.LIS/FORMAT=TABULAR
CPU UTILIZATION
Node: GALLO
Date: 19-FEB-2006 13:00-17:00
Metric Values are Stacked (Added to the left)
Units:
Percent of CPU
Time
Other
Network Batch
Interactive Detached
19-FEB-2006 13:00
37.0417 36.8618 34.8204 34.7315
29.2958
19-FEB-2006 13:05
28.7843 28.6284 25.6078 25.5536
13.9655
19-FEB-2006 13:10
30.8503 30.6480 29.0889 29.0197
26.4432
19-FEB-2006 13:15
39.5400 39.1330 37.2836 37.2375
35.1232
19-FEB-2006 13:20
21.6206 21.3342 16.1865 16.1200
15.7037
.
.
.
19-FEB-2006 16:30
16.8700 16.5002 13.9558 13.9363
13.8224
19-FEB-2006 16:35
18.6083 18.4667 13.4750 13.4625
13.3917
19-FEB-2006 16:40
20.1096 19.7068 12.6488 12.6349
11.5711
19-FEB-2006 16:45
18.3733 18.3733 12.5977 12.5852
10.4367
19-FEB-2006 16:50
19.1731 18.7125 13.6036 13.5897
12.2661
19-FEB-2006 16:55
18.2973 17.5590 11.2668 11.0500
10.7143
Minimum Values
0.0000
0.9171
0.0083
0.0708
4.1546
Maximum Values
1.1978
9.0092 16.5792 75.3240
34.9630
Average Values
0.4288
5.6702
1.4347 33.7350
11.1873
Intstk+MPsynch
7.1025
7.7340
8.9179
9.5303
9.1339
7.8752
7.7000
6.1713
5.7852
5.7172
6.5597
5.7172
8.7164
0.0492
The following example, CSV Formatted Output, illustrates CSV formatted
output. It was generated with the following command:
$ ADVISE PERFORMANCE GRAPH/BEGINNING=22-MAR-2006:12:00/ENDING=22-MAR-2006:14:00 _$ /NODE=(BYOB,BUGDEV,ORIPAS,BATCH,MIGHTB,CINAMN,CHATTY)/FORMAT=CSV=X_POINTS=8 _$ /TYPE=CUSTOM=SYSTEM_METRIC=CPU_TOTAL/COMPOSITE
"PSPA CUSTOM GRAPH"
"Nodes: BYOB, BUGDEV, ORIPAS, BATCH, MIGHTB, CINAMN, CHATTY"
"Date: 22-MAR-2006 12:00-14:00"
"Metric Values are Stacked (Added to the left)"
"Units:
%CPU Total Busy"
"Time","2 Other Nodes,total","BUGDEV","BYOB","CINAMN","ORIPAS","BATCH"
"22-MAR-2006 12:00",4.5250,3.8487,2.7485,1.5865,0.9080,0.6247
"22-MAR-2006 12:15",4.3510,3.6925,2.9084,1.2251,0.4400,0.1722
"22-MAR-2006 12:30",3.5105,2.9182,2.7072,1.5696,0.9082,0.6624
"22-MAR-2006 12:45",4.6329,4.0381,3.6512,2.6581,1.2887,1.0471
"22-MAR-2006 13:00",9.6964,9.1100,2.8984,1.8634,0.8863,0.4046
"22-MAR-2006 13:15",11.1101,10.2576,3.4636,2.3228,1.2826,0.5255
"22-MAR-2006 13:30",28.1334,27.2356,12.2585,2.3256,1.2172,0.3333
"22-MAR-2006 13:45",29.9854,29.1150,14.0548,2.1800,0.9782,0.1727
Chapter 4: Generate Historical Graphs 121
Format Graphs and Pie Charts
PostScript Formatted Pie Chart Output illustrates PostScript formatted output
for a pie chart. It was generated with the following command:
$ ADVISE PERFORMANCE PIE_CHART/BEGINNING=22-MAR-2006:12:00 _$ /ENDING=22-MAR-2006:14:00 _$ /NODE=(BYOB,BUGDEV,ORIPAS,BATCH,MIGHTB,CINAMN,CHATTY)/FORMAT=POSTSCRIPT _$ /TYPE=CUSTOM=SYSTEM_METRIC=CPU_TOTAL/COMPOSITE
The following example, Tabular Formatted Pie Chart Output, illustrates tabular
formatted output for a pie chart. It was generated with the following
command:
$ ADVISE PERFORMANCE PIE_CHART/BEGINNING=22-MAR-2006:12:00 _$ /ENDING=22-MAR-2006:14:00 _$ /NODE=(BYOB,BUGDEV,ORIPAS,BATCH,MIGHTB,CINAMN,CHATTY)/FORMAT=TABULAR _$ /TYPE=CUSTOM=SYSTEM_METRIC=CPU_TOTAL/COMPOSITE
122 Performance Manager Administrator Guide
Format Graphs and Pie Charts
PSPA CUSTOM GRAPH
Nodes: BYOB, BUGDEV, ORIPAS, BATCH, MIGHTB, CINAMN, CHATTY
Date: 22-MAR-2006 12:00-14:00
The whole pie represents
11.79 %CPU Total Busy
Item
Value
Percent of Total
-----------------------------------------------------------------------------BUGDEV
5.68626
48.216 %
BYOB
3.59973
30.523 %
CINAMN
0.96963
8.222 %
ORIPAS
0.49438
4.192 %
BATCH
0.49370
4.186 %
CHATTY
0.36808
3.121 %
MIGHTB
0.18164
1.540 %
The following example, CSV Formatted Pie Chart Output, illustrates CSV
formatted output for a pie chart. It was generated with the following
command:
$ ADVISE PERFORMANCE PIE_CHART/BEGINNING=22-MAR-2006:12:00 _$ /ENDING=22-MAR-2006:14:00 _$ /NODE=(BYOB,BUGDEV,ORIPAS,BATCH,MIGHTB,CINAMN,CHATTY)/FORMAT=CSV _$ /TYPE=CUSTOM=SYSTEM_METRIC=CPU_TOTAL/COMPOSITE
"PSPA CUSTOM GRAPH"
"Nodes: BYOB, BUGDEV, ORIPAS, BATCH, MIGHTB, CINAMN, CHATTY"
"Date: 22-MAR-2006 12:00-14:00"
"The whole pie represents
11.79 %CPU Total Busy"
"Item","Value","Percent of Total"
"BUGDEV",
5.68626,48.216
"BYOB",
3.59973,30.523
"CINAMN",
0.96963, 8.222
"ORIPAS",
0.49438, 4.192
"BATCH",
0.49370, 4.186
"CHATTY",
0.36808, 3.121
"MIGHTB",
0.18164, 1.540
Data Resolution with X_POINTS
For ReGIS and PostScript graphs, the X_POINTS keyword indicates the number
of data points to plot along the x-axis of the graph, and is specified with the
/FORMAT=REGIS=X_POINTS=number qualifier, from a DCL command, or
/X_POINTS=number qualifier from command mode.
For Tabular graphs, the X_POINTS keyword specifies the number of data
points to present in the report, and is specified with the
/FORMAT=TABULAR=X_POINTS=number qualifier. The valid range for
X_POINTS is 2 to 480, the default is generally from 45 to 90, but is computed
to produce an even time interval per point.
The following are examples of specifying the X_POINTS keyword:
■
DCL command:
$ ADVISE PERFORMANCE GRAPH/FORMAT=REGIS=X_POINTS=number
Chapter 4: Generate Historical Graphs 123
Format Graphs and Pie Charts
■
Command mode:
PSPA> SELECT GRAPH/X_POINTS=number
■
DECwindows:
Specify the Additional Options... option from the
Select Data dialog box.
As the value of X_POINTS increases, more peaks and valleys appear on a
graph. As the value decreases, the peaks and valleys are smoother because
Performance Manager averages data points within the time frame requested.
The next three figures illustrate the relationship between the value of
X_POINTS and a time frame of 4 hours. During this period the Performance
Manager records statistics 120 times (every 2 minutes).
The following graph, X_POINTS Default Value Graph, uses 60 for the value of
X_POINT. Therefore, two data records are averaged to calculate the value of
each point plotted.
This command generates the graph:
$ ADVISE PERFORMANCE GRAPH/BEGINNING=19-FEB-2006:13:00/ENDING=19-FEB-2006:17:00 _$ /TYPE=CPU_UTILIZATION/NODE=GALLO/OUTPUT=SUPPLY_XP_60.PS _$ /FORMAT=POST=CHARACTERISTIC=PATTERN
124 Performance Manager Administrator Guide
Format Graphs and Pie Charts
In the Maximum X_POINTS Graph, the value of X_POINTS is 480. Therefore,
the graphing facility did not average the data.
This following command generates the following graph:
$ ADVISE PERFORMANCE GRAPH/BEGINNING=19-FEB-2006:04:00/ENDING=19-FEB-2006:20:00 _$ /TYPE=CPU_UTILIZATION/NODE=GALLO/OUTPUT=CH4CPU_XP_480.PS _$ /FORMAT=POSTSCRIPT=(CHARACTERISTIC=PATTERN,X_POINTS=480)
In the Minimum X_POINTS Graph, the value of X_POINTS is 8. The graphing
facility averages every 15 data points in the four hour time span.
Chapter 4: Generate Historical Graphs 125
Generate Custom Graphs
This command generates the graph:
$ ADVISE PERFORMANCE GRAPH/BEGINNING=19-FEB-2006:13:00/ENDING=19-FEB-2006:17:00 _$/TYPE=CPU_UTILIZATION/NODE=GALLO/OUTPUT=CH4CPU_XP_8.PS _$ /FORMAT=POSTSCRIPT=(CHARACTERISTIC=PATTERN,X_POINTS=8)
Generate Custom Graphs
The Custom graph type behaves differently than all other graph types because
to control the graph data, you must specify one metric and up to six data
items or up to six metrics and one data item.
You can use metrics from one of the following groups for a custom graph:
■
System metrics
■
Process metrics, selected by user name, image name or workload name
■
Disk device metrics, selected by device name or volume name
■
Processor mode metrics, selected by processor ID
■
HSC metrics, selected by HSC node name
■
SCS metrics, selected by SCS cluster node name
■
Rule metrics (for archived data only), selected by rule ID
■
HSC channel metrics, selected by HSC channel name
126 Performance Manager Administrator Guide
Generate Custom Graphs
■
File metrics, selected by file name
■
Process Disk Volume I/O Rates, selected by user name and volume name,
or image name and volume name
These metrics are described in the chapter Performance Manager Commands
(see page 175).
You can specify the metrics and data items by one of the following methods:
■
DCL command
■
Interactive prompting
The units that the various metrics represent may differ, for example, I/Os per
second or percentage of CPU time. The Performance Manager allows you to
include data with different metrics on the same graph. Use your discretion
when doing this, however.
Graph System Metrics
The following command generates a custom graph:
$ ADVISE PERFORMANCE GRAPH/TYPE=CUSTOM=( _$ SYSTEM_METRICS=(DZRO,GVALID),TITLE="Pagefaulting")
The following example, Prompting for System Metrics Custom Graph, shows
Performance Manager prompts and user input that generate the same graph in
command mode:
$ ADVISE PERFORMANCE
PSPA> SELECT/BEGINNING=19-FEB-2006:13:00 _PSPA> /ENDING=19-FEB-2006:17:00 GRAPH=BY_NODE
The resulting graph appears in the example, Custom Graph for System
Metrics.
Chapter 4: Generate Historical Graphs 127
Generate Custom Graphs
Processing Options
---------------------------------------------------------------ANALYSIS REPORT NO
PERFORMANCE_EVALUATION REPORT NO
GRAPHS YES
User Names YES
Image Names YES
Hot File Names NO
User/Image Volume IO NO
IO Devices & workloads YES
By Node details YES
Reading data for node YQUEM
Reading data for node GALLO
PSPA>GRAPH/TYPE=PROMPT/FORMAT=POSTSCRIPT=CHARACTERISTIC=PATTERN/OUT=CH4CUSTOM_PROMT.PS
Please select either 1) a predefined graph or
2) a custom graph
Choice [1]: 2
0. Composite
1. YQUEM
2. GALLO
Please select a node number [0]: 2
For the CUSTOM Graph, select one of the following:
1.
2.
3.
4.
5.
6.
7.
8.
9.
10.
11.
12.
13.
14.
System Metrics
Process metrics selected by user name
Process metrics selected by image name
Process metrics selected by workload name
Disk device metrics selected by device name
Disk device metrics selected by volume name
Processor mode metrics by physical processor ID
HSC metrics by HSC node name
SCS metrics by SCS Cluster node name
RULE metrics by rule id
HSC Channel metrics by channel name
File metrics by file name
IOs by Username and Volumename
IOs by Imagename and Volumename
Enter Choice (1 - 14): 1 [1]
Select Up to 6 System Metrics (<CR> for list): [2]
GRAPH
/TYPE
CUSTOM
System_metrics
Select up to 6 of the following system metrics to be displayed on a custom graph:
Sampled %CPU mode metrics (for all CPUs in an SMP configuration):
COMPAT EXEC FILE_SYS IDLE INTERRUPT
KERNEL MP_SYNCH SUPER USER_MODE
Sampled process counts by process state:
COLPG MWAIT CEF PFW CUR
LEF LEFO HIB HIBO SUSP
SUSPO FPG COM COMO
INPROCACT INPROCINACT
OUTPROCACT OUTPROCINACT
TOTAL_PROCESSES
Sampled process counts by type:
BATCH_PROCESSES INTERACTIVE_PROCESSES
NETWORK_PROCESSES DETACHED_PROCESSES
Derived CPU time metrics:
%CPU Utilization Compute Queue
------------------------------------- ----------------------------CPU_BATCH CPU_INTERACTIVE BATCH_COMQ INT_COMQ
128 Performance Manager Administrator Guide
Generate Custom Graphs
CPU_NETWORK CPU_OTHER NETWORK_COMQ DETACHED_COMQ
CPU_DETACHED CPU_TOTAL
CPU_MP_INT
Sampled paging/swapping/memory metrics:
Paging Rates MemoryPages Swaprate
--------------------------------- -------- -------DZROFAULTS FAULTS FREEFAULTS FREECNT INSWAP
GVALID MFYFAULTS PREADIO MPYCNT
PREADS PWRITES PWRITIO
SYSFAULTS WRTINPROG IMAGE_ACTIVATIONS
Derived paging/swapping/memory metrics:
Memory Utilization as a percentage Pagefile Utilization
---------------------------------- -------------------FREELIM FREELIST MODIFIED PAGEFILE_UTILIZATION
MEM_TOTAL SYSTEMWS USERWS
VMSALLOC
Sampled system IO rates:
BUFIO DIRIO ERASE_QIO FILE_CACHE_HIT
FILE_CACHE_MISS FILE_OPEN LOGNAM MBREADS MBWRITES
SPLITIO WINDOW_TURN
Derived system IO rates:
Disks Terminals and Printers
----------------------------- --------------------------------DISK_PAGING DISK_SWAPPING LAT_TERMIO NV_TERMIO RT_TERMIO
DISK_USER TT_TERMIO TX_TERMIO TW_TERMIO
WT_TERMIO OTHERBUFIO
Sampled DECnet metrics:
ARRLOCPK ARRTRAPK DEPLOCPK RCVBUFFL TRCNGLOS
Sampled distributed locking metrics:
DEADLOCK_FIND DEADLOCK_SEARCH INCOMING_LOCKING
LOCAL_LOCKING OUTGOING_LOCKING
Sampled pool metrics:
IRP_CNT IRP_MAX LOCK_CNT LRP_CNT
LRP_MAX NP_FREE_BLOCKS NP_FREE_BYTES NP_FREE_LEQ_32
NP_MAX_BLOCK NP_MIN_BLOCK NP_POOL_MAX PG_FREE_BLOCKS
PG_FREE_BYTES PG_FREE_LEQ_32 PG_MAX_BLOCK PG_MIN_BLOCK
PG_POOL_MAX RESOURCE_CNT SRP_CNT SRP_MAX
Other system metrics:
SM_RESPONSE MED_RESPONSE LG_RESPONSE
CPU_VUP_RATING RELATIVE_CPU_POWER
Select Up to 6 System Metrics (<CR> for list): DZROFAULTS, GVALID [3]
Enter an optional title for the CUSTOM graph <40 characters max>
Title [PSPA CUSTOM GRAPH]:PAGEFAULTING [4]
The following statements are keyed to the Prompting for System Metrics
Graph:
1.
1 was entered to select System Metrics.
2.
<CR> was entered to select the list of system metrics.
Chapter 4: Generate Historical Graphs 129
Generate Custom Graphs
3.
DZRO, GVALID was entered to select these two metrics.
4.
Pagefaulting was entered to select the custom graph title.
Graph Process Metrics by User
When graphing process metrics by user you must specify either of the
following user names and process metrics:
■
A list of up to six user names and a single process metric
or
■
A single user name with a list of up to six process metrics
Performance Manager graphs include the metrics for all users that match any
one of the user names you specify in the list. The resulting graph depicts each
of the specified users or metrics separately on the plot.
To graph process metrics by user in DCL mode, issue the command:
$ ADVISE PERFORMANCE GRAPH _$ /TYPE=CUSTOM=(USER_METRICS=CPUTIME,_$ SELECTION=(DIEGER,HAFFMAN,ORIPAS,_$ SANTELK,FRED_CARL,SARBID),_$ TITLE="CPU time used by the team"
130 Performance Manager Administrator Guide
Generate Custom Graphs
The Prompting for Process Custom Graph example shows Performance
Manager prompts and user input that generate the same graph using
command mode and specifying the following command:
PSPA> GRAPH/TYPE=PROMPT/FORMAT=POSTSCRIPT=CHARACTERISTIC=PATTERN _PSPA> /OUT=CH4CUSTOM_USER_PROMPT.PS
The graph itself appears in the figure, Custom Graph for Process Usage.
The following statements are keyed to the Prompting for Process Custom
Graph example:
1.
2 was entered to select process metrics selected by user name.
2.
The user names were entered to select the users.
3.
<CR> was entered to request the list of process metrics.
4.
CPUTIME was selected from the list and entered.
5.
The Custom graph title was entered.
Chapter 4: Generate Historical Graphs 131
Generate Custom Graphs
Please select either 1) a predefined graph or
2) a custom graph
Choice [1]: 2
0. Composite
1. YQUEM
2. GALLO
Please select a node number [0]: 1
For the CUSTOM Graph, select one of the following:
1. System Metrics
2. Process metrics selected by user name
3. Process metrics selected by image name
4. Process metrics selected by workload name
5. Disk device metrics selected by device name
6. Disk device metrics selected by volume name
7. Processor mode metrics by physical processor ID
8. HSC metrics by HSC node name
9. SCS metrics by SCS Cluster node name
10. RULE metrics by rule id
11. HSC Channel metrics by channel name
12. File metrics by file name
13. IOs by Username and Volumename
14. IOs by Imagename and VolumenameEnter Choice (1 - 14): 2
Enter Choice b(1 - 14) : 2 [1]
Select up to 6 User Names (<CR> for list): SANTELK,HAFFMAN,SARBID,ORIPAS,FRED_CARL,DIEGER [2]
Select one process metric (<CR>) for list: [3]
GRAPH
/TYPE
CUSTOM
Process_metrics
The following process metrics can be requested on a custom graph.
BUFIO CPUTIME DIRIO DSKIO
DSKTP FAULTS HARDFAULTS IMAGE_ACTIVATIONS
IO_SIZE RESIDENCE RESPONSE_TIME TAPIO
TAPTP TERM_INPUT TERM_THRUPUT WSSIZE VASIZE
Select one process metric (<CR> for list): CPUTIME [4]
Enter an optional title for the CUSTOM graph <40 characters max>
Title [PSPA CUSTOM GRAPH]:CPU time used by the team [5]
PSPA>
132 Performance Manager Administrator Guide
Graph the Hot File Activity
Graph the Hot File Activity
By default, PA combines files with the same names regardless of differing
directory or device locations. To separate files having different directories or
devices, you must define the logical names PSPA$GRAPH_FILE_DIRECTORY
and PSPA$GRAPH_FILE_DEVICE. Or, alternatively, use the /FILTER qualifier to
select hotfile records for specific processes and/or disk devices.
If the graph legend is undesirable due to its length, you have several options
to shrink the font used to print the legend. DECwindows has a Resources file
that can change the font. PostScript has a logical name.
The Pie Chart can be presented in tabular format which gives a wider legend
text.
If the file is deleted before the prod_fam Performance Manager detects its
specification, its name is not available. The FID is provided in parentheses
instead of its name. All non-virtual QIO activity to the disk is reported under
the file specification, Non Virtual QIO.
Chapter 4: Generate Historical Graphs 133
Chapter 5: Customize the Knowledge
Base
This chapter provides information about the knowledge base, rules, and
customizing both.
This section contains the following topics:
The Knowledge Base (see page 135)
Investigate Rule Firing (see page 136)
Components of Rules (see page 137)
Data Cell Types and Use (see page 156)
Implement Changes (see page 163)
Build an Auxiliary Knowledge Base (see page 172)
Use an Auxiliary Knowledge Base for Reporting and Archiving (see page 173)
The Knowledge Base
The Performance Manager makes assertions and inferences about system
performance based on a large and changing body of technical information
called a knowledge base. This information is in the form of performance rules.
Performance rules come from one or two sources. The first source of rules is
the product itself. The factory rules are automatically loaded by the user
interfaces that require them. The second source is an auxiliary rules file, which
you create.
While the Performance Manager is designed to work without any modifications,
an experienced system manager can further benefit from the tool by
customizing the knowledge base. Good reasons to customize the knowledge
base include the following rules:
■
Eliminating the firing of rules for conditions that are customary and
unchangeable for your system
■
Refining rules to filter testing of specific images or other conditions that
are a required and unchangeable part of your workload
■
Modifying the characteristics of certain (older) disk devices that you might
own and still use (for example, RF31)
■
Adding rules to check for additional warning conditions that are specific for
your own workloads and systems
Chapter 5: Customize the Knowledge Base 135
Investigate Rule Firing
Investigate Rule Firing
The factory rules embedded in the Performance Manager follow the
methodology in the HP's OpenVMS Performance Management guide. Some
rules go beyond this methodology.
Keep in mind that, while the Performance Manager alerts you to potential
performance problems, it does not (by default) screen out firings that are
insignificant. Some circumstances on your system might fire a rule, for a onetime transient condition, without any implications for the long-term
performance of your system. The factory rules try to minimize this possibility
by setting occurrence thresholds within rules, but this might still happen.
Figure out whether you need to be concerned about a particular rule firing.
Check the evidence provided with each rule. Does the problem appear to be
persistent (as indicated by many lines of evidence)? Check the time of
occurrence: does this happen at the same time as a regularly scheduled job?
Make sure you understand the meaning of each data item presented. If you
are unsure of a definition, look it up in the Data Cell Types and Use section, or
use the online Help system, which contains hotspots to all the data items in
the Conditions and in the Evidence. Many of the data items presented as
evidence are used in the rule's conditions: read the conditions, and understand
how each data item is being used, and what values would cause it to fire.
You are probably very familiar with approximate or typical values for many
parameters of your systems. If a rule fires, but all related evidence appears
normal for your environment, then you probably want to adjust that rule's
thresholds to reflect more precisely the upper bounds of performance for your
particular workloads and systems. For more information on how to do this, see
How to Implement Changes in this chapter.
However, if the evidence presented does not look normal, or if you don't know
what normal looks like for those data items, you need to investigate further.
One good way is to generate graphs of those or related data items for the time
periods given in the evidence, and then look for unusual spikes of activity. If
you find spikes occurring at the same time in different graphs, then you might
suspect that the data items graphed are somehow related to the underlying
problem, which might lead you to ideas of what might be changed to fix the
problem.
136 Performance Manager Administrator Guide
Components of Rules
Another path of investigation is to look for related rule firings. A rule might not
present the full picture by itself, but when coupled with related rules, could
give you a clear indication of the source of the problem. Related rules need not
appear one after the other, as Performance Manager processes rules in the
following order: CPU, memory, I/O, resource (miscellaneous), and (after all
nodes have been analyzed) cluster-wide. (You do not need to have a cluster
for one of these rules to fire, but the metrics used are not specific to an
individual node, so they are evaluated after all node-specific rules.) Rules
which require special evidence processing (as indicated by the absence of
evidence data items in the rules source file) are presented first.
Finally, if you observe a persistent performance problem, you can use the
Real-time Motif displays to investigate dynamically-see the chapters Use the
DECwindows Motif Real-time Display (see page 321) and Customize the
DECwindows Motif Real-time Display (see page 341). This new functionality
supports progressive disclosure, so that you can start monitoring with highlevel system displays, and then progressively launch panels to focus on
perceived problem areas, as they are occurring.
Components of Rules
A rule is a conditional statement in an if/then format. A rule can contain
multiple conditions. The Performance Manager evaluates rules while
generating Analysis Reports. If all conditions of the rule are true, then there is
a rule occurrence. If the number of rule occurrences meet the rule occurrence
threshold, the rule is said to fire and the Performance Manager reports the
associated rule conclusion.
A Performance Manager rules file contains entities known as constructs.
Performance Manager rule constructs represent rules. Rule construct elements
govern the syntax of the rule.
Rules File Constructs
The format of a rules file is not rigid. Multiple spaces, tabs, carriage return,
and form feeds are treated as a single space. A rules file can include the
following five constructs:
■
RULE
■
DISABLE
■
LITERAL
■
COMMENT
■
THRESHOLD
Chapter 5: Customize the Knowledge Base 137
Components of Rules
These rule constructs, their format, and use are discussed next:
RULE
Constructs define rules.
–
The format of the rule construct is as follows:
RULE rule_elements ENDRULE
■
■
The rule construct consists of seven rule elements. The optional
elements in the list following are enclosed in brackets:
–
Rule ID element
–
[Domain element]
–
Rule condition element [Rule condition element...]
–
[Occurrence threshold element]
–
[Evidence element]
–
[Conclusion text element]
–
[Brief conclusion text element]
Once defined and compiled, the rules can be supplied to the analysis
process to cause a conclusion to be fired as appropriate or can be
supplied to the archival process to cause the number of occurrences of
the rule to be archived.
DISABLE
Constructs allow you to turn off individual rules.
■
The format of the disable construct is as follows:
DISABLE rule_id [rule_id...];
■
The parameter rule id specifies which rule or rules to disable; the
construct ends with a semicolon (;).
LITERAL
Constructs allow you to define unique symbols for use in a rule expansion.
■
The format of the literal construct is as follows:
LITERAL literal_definition [literal_definition...] ENDLITERAL
■
A literal definition is defined as:
literal_symbol = decimal_value
■
A literal symbol is a unique symbol that you have equated to a decimal
value. A literal symbol can contain up to 40 alphanumeric characters
that have not been defined before as a literal, a threshold, or a data
cell. A literal symbol can be used in a rule expansion.
138 Performance Manager Administrator Guide
Components of Rules
COMMENT
Constructs allow you to include notations in the rules file.
■
An exclamation point (!), occurring as the first character in the line,
denotes a comment construct. The Performance Manager ignores any
text on the line after the exclamation point.
THRESHOLD
Constructs allow you to modify internal thresholds that affect the
calculation of derived data cells.
■
The format of a threshold construct is as follows:
THRESHOLD threshold_definition [threshold_definition...] ENDTHRESHOLD
■
A threshold definition is defined as:
threshold_name = decimal_value
■
A threshold name must match one of the Performance Manager's
predefined thresholds. These thresholds are not used directly in the
rule expression; however, they influence the resultant value of some
data cells that can be used in rule expressions. Some thresholds act as
occurrence limits for a few factory rules.
■
The following table lists the Performance Manager's predefined
thresholds and the default value of each threshold, and describes how
each threshold affects the data cells or evidence.
■
All thresholds have a prefix of TD. These thresholds cannot be
redefined, but their values can be modified.
The following tables show the Performance Manager thresholds:
Name
Default
Value
Description
TD_MIN_DSKSPC_PCT
.05
The minimum percentage of disk
free blocks required to set the data
cell ANY_DISK_FULL to 1 for a given
Performance Manager two-minute
record.
TD_DISK_QL_MAX
1
The maximum queue length on any
disk required to set the data cell
ANY_DISK_OVER_QL_THRESHOLD
to 1 for a given Performance
Manager two-minute record. This
affects condition-checking on rules
I0040, I0050, I0055, I0060, and
I0150.
Chapter 5: Customize the Knowledge Base 139
Components of Rules
Name
Default
Value
Description
TD_SMP_VUP_RATIO
85
A percentage of the threshold
TD_SINGLE_CPU_VUP_n value
applied to additional CPUs in an SMP
system used to compute the total
VUPs. This is used to compute the
data cell CPU_VUP_RATING for
processor type N. See the processor
specific thresholds in the next table.
TD_M0010_PROBRECS_PER
_IMAGE
4
Number of records for any one
image required to fire the rule
M0010.
TD_PROCESS
2
Number of problem records per
user/image combination required to
include the record into the evidence
for rules M0050, M0055, and
M0060.
TD_CIO
4
Number of problem records per disk
volume required to include the
image into the evidence for rule
L0050, L0060, and L0070.
TD_IO_ERROR
2
Number of problem records per disk
volume required to include the
volume into the evidence for rule
L0080.
TD_CI_PORT_IO
1500000 Number of bytes per second through
any CI port required to set the data
cell
EXCESS_THRUPUT_ON_ANY_CHANN
EL to 1 for a given Performance
Manager two-minute record.
TD_UNIBUS_CHANNEL_IO
140 Performance Manager Administrator Guide
1000000 Number of bytes per second through
any UNIBUS port required to set the
data cell
EXCESS_THRUPUT_ON_ANY_CHANN
EL to 1 for a given Performance
Manager two-minute record.
Components of Rules
Name
Default
Value
Description
TD_KDA_CHANNEL_IO
800000
Number of bytes per second through
any KDA50 port required to set the
data cell
EXCESS_THRUPUT_ON_ANY_CHANN
EL to 1 for a given Performance
Manager two-minute record.
TD_KDB_CHANNEL_IO
900000
Number of bytes per second through
any KDB port required to set the
data cell
EXCESS_THRUPUT_ON_ANY_CHANN
EL to 1 for a given Performance
Manager two-minute record.
TD_MASSBUS_CHANNEL_IO
1700000 Number of bytes per second through
any MASSBUS port required to set
the data cell
EXCESS_THRUPUT_ON_ANY_CHANN
EL to 1 for a given Performance
Manager two-minute record.
TD_GENERIC_DISK_IO
30
Default I/O operation per second
threshold for disks that are not
covered in the translation table
(TD_Tn_x) thresholds.
TD_GENERIC_DISK_THRUPU 1000000 Default number of bytes per second
T
threshold for disks that are not
covered in the translation table
(TD_In_x) thresholds.
TD_T1_RK06
20
I/O per second threshold for disk
type. Data cell
DISK_IO_RATE_THRESHOLD has
this value if the current disk subrecord is of this type.
TD_T2_RK07
20
Same as previous.
TD_T3_RP04
26
Same as previous.
TD_T4_RP05
26
Same as previous.
TD_T5_RP06
26
Same as previous.
TD_T6_RM03
26
Same as previous.
TD_T7_RP07
32
Same as previous.
TD_T8_RP07HT
32
Same as previous.
TD_T13_RM80
30
Same as previous.
Chapter 5: Customize the Knowledge Base 141
Components of Rules
Name
Default
Value
Description
TD_T15_RM05
26
Same as previous.
TD_T20_RA80
27
Same as previous.
TD_T21_RA81
28
Same as previous.
TD_T22_RA60
20
Same as previous.
TD_T25_RD51
10
Same as previous.
TD_T27_RD52
20
Same as previous.
TD_T28_RD53
26
Same as previous.
TD_T30_RA82
33
Same as previous.
TD_T31_RD31
18
Same as previous.
TD_T32_RD54
26
Same as previous.
TD_T34_RRD50
20
Same as previous.
TD_T36_RX33
10
Same as previous.
TD_T37_RX18
10
Same as previous.
TD_T38_RA70
32
Same as previous.
TD_T39_RA90
34
Same as previous.
TD_T40_RD32
20
Same as previous.
TD_T42_RX35
10
Same as previous.
TD_T43_RF30
24
Same as previous.
TD_T44_RF71
24
Same as previous.
TD_T45_RD33
18
Same as previous.
TD_T46_ESE20
240
Same as previous.
TD_T47_TU56
30
Same as previous.
TD_T48_RZ22
24
Same as previous.
TD_T49_RZ23
24
Same as previous.
TD_T50_RZ24
32
Same as previous.
TD_T51_RZ55
31
Same as previous.
TD_T52_RRD40S
20
Same as previous.
TD_T53_RRD40
20
Same as previous.
TD_T54_GENERIC_DK
30
Same as previous.
TD_T55_RX23
10
Same as previous.
142 Performance Manager Administrator Guide
Components of Rules
Name
Default
Value
Description
TD_T56_RF31
78
Same as previous.
TD_T57_RF72
37
Same as previous.
TD_T58_RAM_DISK
130
Same as previous.
TD_T59_RZ25
38
Same as previous.
TD_T60_RZ56
34
Same as previous.
TD_T61_RZ57
38
Same as previous.
TD_T62_RX23S
10
Same as previous.
TD_T63_RX33S
10
Same as previous.
TD_T64_RA92
33
Same as previous.
TD_T65_SSTRIPE
60
Same as previous.
TD_T66_RZ23L
30
Same as previous.
TD_T67_RX26
10
Same as previous.
TD_T68_RZ57I
38
Same as previous.
TD_T70_RZ58
4
Same as previous.
TD_T71_SCSI_MO
20
Same as previous.
TD_T72_RRD42
20
Same as previous.
TD_T73_CD_LOADER_1
20
Same as previous.
TD_T74_ESE25
240
Same as previous.
TD_T75_RFH31
78
Same as previous.
TD_T76_RFH72
37
Same as previous.
TD_T77_RF73
44
Same as previous.
TD_T78_RFH73
44
Same as previous.
TD_T79_RA72
40
Same as previous.
TD_T80_RA71
40
Same as previous.
TD_T81_RF35
69
Same as previous.
TD_T82_RFH35
69
Same as previous.
TD_T83_RF31F
40
Same as previous.
TD_T84_RZ72
37
Same as previous.
TD_T85_RZ73
36
Same as previous.
TD_T86_RZ35
53
Same as previous.
Chapter 5: Customize the Knowledge Base 143
Components of Rules
Name
Default
Value
Description
TD_T87_RZ24L
35
Same as previous.
TD_T88_RZ25L
41
Same as previous.
TD_T89_RZ55L
34
Same as previous.
TD_T90_RZ56L
37
Same as previous.
TD_T91_RZ57L
42
Same as previous.
TD_T92_RA73
44
Same as previous.
TD_T93_RZ26
50
Same as previous.
TD_T94_RZ36
51
Same as previous.
TD_T95_RZ74
47
Same as previous.
TD_T96_ESE52
1300
Same as previous.
TD_T97_ESE56
1300
Same as previous.
TD_T98_ESE58
1300
Same as previous.
TD_T99_RZ27
51
Same as previous.
TD_I1_RK06
530000
Number of bytes per second
threshold for disk type. Data cell
DISK_THRUPUT_RATE_THRESHOLD
has this value if the current disk
sub-record is of this type.
TD_I2_RK07
530000
Same as previous.
TD_I3_RP04
800000
Same as previous.
TD_I4_RP05
800000
Same as previous.
TD_I5_RP06
800000
Same as previous.
TD_I6_RM03
1200000 Same as previous.
TD_I7_RP07
1300000 Same as previous.
TD_I8_RP07HT
2200000 Same as previous.
TD_I13_RM80
1000000 Same as previous.
TD_I15_RM05
1200000 Same as previous.
TD_I20_RA80
800000
TD_I21_RA81
1500000 Same as previous.
TD_I22_RA60
1300000 Same as previous.
TD_I25_RD51
300000
144 Performance Manager Administrator Guide
Same as previous.
Same as previous.
Components of Rules
Name
Default
Value
Description
TD_I27_RD52
530000
Same as previous.
TD_I28_RD53
530000
Same as previous.
TD_I30_RA82
1600000 Same as previous.
TD_I31_RD31
500000
Same as previous.
TD_I32_RD54
530000
Same as previous.
TD_I34_RRD50
120000
Same as previous.
TD_I36_RX33
400000
Same as previous.
TD_I37_RX18
400000
Same as previous.
TD_I38_RA70
1000000 Same as previous.
TD_I39_RA90
1900000 Same as previous.
TD_I40_RD32
500000
Same as previous.
TD_I42_RX35
400000
Same as previous.
TD_I43_RF30
900000
Same as previous.
TD_I44_RF71
900000
Same as previous.
TD_I45_RD33
500000
Same as previous.
TD_I46_ESE20
2000000 Same as previous.
TD_I47_TU56
750000
TD_I48_RZ22
1000000 Same as previous.
TD_I49_RZ23
1000000 Same as previous.
TD_I50_RZ24
1200000 Same as previous.
TD_I51_RZ55
1000000 Same as previous.
TD_I52_RRD40S
120000
Same as previous.
TD_I53_RRD40
120000
Same as previous.
TD_I54_GENERIC_DK
750000
Same as previous.
TD_I55_RX23
400000
Same as previous.
TD_I56_RF31
2100000 Same as previous.
TD_I57_RF72
1200000 Same as previous.
TD_I58_RAM_DISK
5000000 Same as previous.
TD_I59_RZ25
1800000 Same as previous.
TD_I60_RZ56
1400000 Same as previous.
Same as previous.
Chapter 5: Customize the Knowledge Base 145
Components of Rules
Name
Default
Value
TD_I61_RZ57
1700000 Same as previous.
TD_I62_RX23S
400000
Same as previous.
TD_I63_RX33S
400000
Same as previous.
TD_ _RA92
1900000 Same as previous.
TD_I65_SSTRIPE
1200000 Same as previous.
TD_I66_RZ23L
1200000 Same as previous.
TD_I67_RX26
500000
TD_I68_RZ57I
1500000 Same as previous.
TD_I70_RZ58
3100000 Same as previous.
TD_I71_SCSI_MO
750000
Same as previous.
TD_I72_RRD42
120000
Same as previous.
TD_I73_CD_LOADER_1
120000
Same as previous.
TD_I74_ESE25
2000000 Same as previous.
TD_I75_RFH31
2100000 Same as previous.
TD_I76_RFH72
1600000 Same as previous.
TD_I77_RF73
2100000 Same as previous.
TD_I78_RFH73
2100000 Same as previous.
TD_I79_RA72
1400000 Same as previous.
TD_I80_RA71
1400000 Same as previous.
TD_I81_RF35
2600000 Same as previous.
TD_I82_RFH35
2600000 Same as previous.
TD_I83_RF31F
1400000 Same as previous.
TD_I84_RZ72
1400000 Same as previous.
TD_I85_RZ73
1900000 Same as previous.
TD_I86_RZ35
2600000 Same as previous.
TD_I87_RZ24L
1900000 Same as previous.
TD_I88_RZ25L
2000000 Same as previous.
TD_I89_RZ55L
1100000 Same as previous.
TD_I90_RZ56L
1500000 Same as previous.
TD_I91_RZ57L
1800000 Same as previous.
146 Performance Manager Administrator Guide
Description
Same as previous.
Components of Rules
Name
Default
Value
Description
TD_I92_RA73
2100000 Same as previous.
TD_I93_RZ26
2600000 Same as previous.
TD_I94_RZ36
3700000 Same as previous.
TD_I95_RZ74
3100000 Same as previous.
TD_I96_ESE52
2000000 Same as previous.
TD_I97_ESE56
2000000 Same as previous.
TD_I98_ESE58
2000000 Same as previous.
TD_I99_RZ27
3700000 Same as previous.
Processor-Specific Thresholds
The processor-specific thresholds can be modified by using threshold scaling
factors indicated in the following table:
Threshold Name
Affected Data Cell Name
TD_SINGLE_CPU_VUP_n
CPU_VUP_RATING
TD_SOFT_FAULT_SCALING_n
SOFT_FAULT_SCALING
TD_HARD_FAULT_SCALING_n
HARD_FAULT_SCALING
TD_IMGACT_SCALING_n
IMGACT_SCALING
TD_COM_SCALING_n
COM_SCALING
The n is an integer that specifies an individual processor and must be replaced
by a model number. All Integrity servers use 4096 for a model number. For
Alpha systems, you can get the model number of a specific processor by using
the $GETSYI system service using the item code SYI$HWMODEL. An entry of
zero is used for an unknown model.
A scale factor of 1.0 is used as a basis for the rules when applied to a VAX11/780 system.
For example, the threshold construct TD_SOFT_FAULT_SCALING_40 = 0.4
places the value 0.4 in the data cell SOFT_FAULT_SCALING when a VAX model
40 is being analyzed. A VAX model 40 is a MicroVAX 2000.
Chapter 5: Customize the Knowledge Base 147
Components of Rules
Rule Construct Elements
A rule construct consists of up to seven elements. Each construct begins with
RULE and ends with ENDRULE. The following sections describe each of the
elements listed in the following table:
Rule Construct Elements and Descriptions
Element
Presence
Description
Rule ID
Required
Identifies a rule definition.
Domain
Optional
Identifies the domain; default is
LOCAL.
Rule conditions
Required
There must be at least one condition.
Occurrence
Optional
Number of occurrences for the rule to
fire; default is one.
Evidence
Optional
If omitted, no evidence is presented.
Conclusion text
Optional
If omitted, no conclusion text is
presented.
Brief conclusion text
Optional
If omitted, no conclusion text is
presented.
Auxiliary Rules File Example
As shown in following example, the first three elements - rule ID, domain, and
the rule conditions - must be in this order. The next four elements may be in
any order.
!
disable M0010
DISABLE M0010;
!
fire this rule after 10 rule occurrences
LITERAL Too_many = 10 ENDLITERAL
Rule UM010 Domain Local
Soft_fault_Rate .ge. 100 ;
Hard_fault_Rate .ge. 8 ;
Pages_on_Freelist .le. 300 ;
Computable_Processes_Ovr_Defpri .ge. 2.5 ;
Direct_IO_Rate .ge. 40 ;
Occurrences = Too_many;
Evidence =
Soft_Fault_Rate
Hard_fault_Rate
Pages_on_freelist
148 Performance Manager Administrator Guide
Components of Rules
Computable_Processes_Ovr_Defpri
Direct_IO_Rate
User_name (Top_HF_User_X)
Volume_Name (Highest_IO_rate_disk_x)Time;
Conclusion " There are significant demands on all of
the system's resources.
Either lower
the overall demand, or expand the data
processing resources."
Brief_conclusion
"System resources fully taxed;
performance degradation likely."
EndRule
Rule ID Element
The rule ID identifies the rule. Each rule must begin with a unique rule
identifier. The format of a rule identifier is this:
RULE rule_ID
Where rule_ID:
■
Is one to five alphanumeric characters.
■
Does not have a zero for the second character. The zero is reserved for
use by CA.
■
Is not already defined by Performance Manager factory rules.
By convention, the first character of a rule identifier describes the rule
performance category. The Performance Manager uses the alphabetic
characters in the following table as the first letter of the rule identifier.
The following table lists the rule ID abbreviations:
Letter
Rule Performance Category
C
CPU-related rule
M
Memory-related rule
I
I/O-related rule
R
Resource (miscellaneous) rule
L
Cluster-related rule
X
XFC-related rule
Chapter 5: Customize the Knowledge Base 149
Components of Rules
Domain Element
The domain element defines the context in which the rule exists. The
association between a rule and its domain designates when a rule is tested
and under which Analysis Report section the rule firing is reported.
The definition of a domain for Performance Manager knowledge base
processing is based on the sub-records that are read from collected data. Each
rule exists within a single domain. Also, each data cell is associated with a set
of domains. Rules can reference any data cells in the domain in which the rule
exists. If you omit the domain element, the default domain for the rule is
LOCAL.
The format of the domain element is as follows:
DOMAIN domain_name [TRACE]
domain_name
Can be one of the following names:
■
CLUSTER
■
COMMUNICATION
■
CONFIGURATION
■
CPU
■
DISK
■
FILE
■
LOCAL
■
LOCALC
■
PROCESS
■
SUMMARY
■
TAPE
Domain Names, Rule Testing, and Reporting
Domain selection determines the data against which the rule is evaluated, the
frequency with which the rule is tested and the Analysis Report section in
which the conclusion is reported. See the following table. An interval record
contains data for a single node in a cluster system.
Domain Name
Report Section
Testing Frequency
CLUSTER
Cluster analysis
Multiple times depending on the
number of disks
150 Performance Manager Administrator Guide
Components of Rules
Domain Name
Report Section
Testing Frequency
COMMUNICATION
Local analysis
Multiple times per interval record
depending on the number of
terminal controllers
CONFIGURATION
Local analysis
Multiple times per interval record
depending on the number of
remote nodes within a cluster
system
CPU
Local analysis
Multiple times per interval record
depending on the number of
processors in a multiprocessor
system
DISK
Local analysis
Multiple times per interval record
depending on the number of disk
sub-records
FILE
Local analysis
Multiple times per interval record
depending on the number of hot
file sub-records
LOCAL
Local analysis
Once per interval record
LOCALC
Cluster analysis
Once per interval record
PROCESS
Local analysis
Multiple times per interval record
depending on the number of
process sub-records
SUMMARY
Local analysis
Once per node
TAPE
Local analysis
Multiple times per interval record
depending on the number of tape
sub-records
Optionally, you can display a trace each time a rule's condition is tested.
During report generation, the Performance Manager displays the trace only on
the terminal screen.
The following code is sample output using TRACE:
%RULETRACE of UM010 condition 1 is TRUE
%RULETRACE of UM010 condition 2 is FALSE
Chapter 5: Customize the Knowledge Base 151
Components of Rules
The Performance Manager displays this debugging information for each rule
condition when the condition is evaluated and terminates with the first FALSE
condition. It is possible that the Performance Manager does not output a trace
for your rule. This occurs when another rule with a rule condition identical to
one of your rule's conditions is evaluated to FALSE. In this case, the
Performance Manager does not evaluate your rule because it is known to be
false.
The relationship between domains and data cells is fixed. Rules are in
domains. Data cells are in one or more domains.
■
Rules defined in the CLUSTER or SUMMARY domain can reference data
cells only in the CLUSTER or SUMMARY domain, respectively.
■
Rules defined in the LOCAL domain can reference data cells in the LOCAL
domain and in other domains, but only if there is an index specifier for the
specific domain.
■
Rules defined in any of the remaining seven domains - COMMUNICATION,
CONFIGURATION, CPU, DISK, FILE, PROCESS, or TAPE - can reference
data cells in their own domains or the LOCAL domain. The rule can
reference data cells in any other six domains only if there is an index
specifier for the other domains.
Rule Condition Element
A rule must have one or more rule conditions. A rule condition is an expression
that the Performance Manager resolves to true or false status during the
course of rule evaluation. A rule condition must end with a semicolon (;). If
the Performance Manager evaluates the rule condition to 1.0, then the rule
condition is true; otherwise, it is false.
A rule condition is composed of rule expressions. A rule expression is one of
the following values:
■
decimal_value
■
literal_symbol
■
tally_data_cell
■
(rule_expression)
■
numeric_data_cell [(index_specifier_data_cell)]
■
boolean_data_cell [(index_specifier_data_cell)]
■
scan_routine_data_cell(rule_expression)
■
string_item string_operator string_item
■
rule_expression numeric_binary_operator rule_expression
152 Performance Manager Administrator Guide
Components of Rules
Rule Expression Operators and Descriptions
A numeric or string operator is one of the symbols listed in the following table:
Symbol
Definition
.EQS.
String equal to string
.NES.
String not equal to string
*
Multiply
/
Divided by
+
Plus
-
Minus
.EQ.
Equal to
.NE.
Not equal to
.LT.
Less than
.LE.
Less than or equal to
.GT.
Greater than
.GE.
Greater than or equal to
.AND.
And
.OR.
Or
The Boolean operators .AND. and .OR. evaluate to either a decimal 1.0 for true
or a 0 for false. The operands are treated as true if their values equal decimal
1.0, and anything else as false. Valid components of rule expressions are
defined as follows:
■
A decimal value is a rational number.
■
A literal symbol is a symbol previously defined by the literal construct.
■
A tally data cell is a data cell (see the Data Cell Types and Use section).
■
Parentheses can be used to denote precedence.
■
A numeric data cell is a data cell (see the Data Cell Types and Use
section).
■
An index specifier data cell is a data cell (see the Data Cell Types and Use
section).
■
A Boolean data cell is a data cell (see the Data Cell Types and Use
section).
■
A scan routine data cell is a data cell (see the Data Cell Types and Use
section).
Chapter 5: Customize the Knowledge Base 153
Components of Rules
■
A string item is either a string data cell (see the Data Cell Types and Use
section) or a string literal, where the literal string is enclosed in quotation
marks.
■
A string operator is either the .EQS. or .NES. operator.
■
A numeric binary operator is one of the operators in the previous table.
Occurrence Element
When the Performance Manager evaluates a rule and all of the conditions of
the rule are true, there is a rule occurrence. The number of times the
Performance Manager evaluates a rule depends upon its domain, the number
of interval records, and the number of nodes. The format for an occurrence
element is as follows:
OCCURRENCES = {literal_symbol | decimal_value};
A literal symbol or decimal value specifies the number of times a rule must
occur for it to fire. The occurrence element ends with a semicolon (;). When a
rule fires, an entry is made in the Analysis Report.
Evidence Element
You can specify evidence for every rule. You can select one or more data cells
to use in the evidence list. You cannot use scan routine data cells as evidence.
When the rule fires (all rule conditions are true and the occurrence threshold is
met), the Performance Manager saves the current values for all data cells
listed as evidence.
The format for an evidence element is as follows:
EVIDENCE = evidence_value [evidence_value...];
Evidence value is a data cell that is not a scan routine:
data_cell [(index_specifier[(index_specifier)])]
The evidence element ends with a semicolon (;). When a rule fires, an entry is
made in the Analysis Report.
Present the Evidence
The Performance Manager starts preparing conclusions, if any, after all data
has been processed. After the conclusion, the Performance Manager lists the
evidence in the Analysis Report in tabular format. Each column corresponds to
an evidence data cell and is indicated by an appropriate column header.
154 Performance Manager Administrator Guide
Components of Rules
If there are many evidence fields, the width of the evidence columns could
exceed 80 characters. If, when writing user auxiliary rules, you do not want
the width to exceed 80 characters, then you must limit the number of
evidence items. The width of each evidence column depends on the column
header and the width of the data that must be displayed.
Performance Manager Factory Evidence
The Performance Manager's factory rules use column headers that are created
to improve readability. If you need to reference the same data cell that is
displayed as evidence on a factory rule conclusion, reference the factory rules
file PSPA$EXAMPLES:PSPA$KB.VPR to see what evidence data cells are
provided for the desired rule.
These factory rules have special evidence processing:
M0010
M0050
M0055
M0060
M0421
R0140
R0150
R0160
R0170
R0210
R0230
R0240
R0245
R0250
R0270
R0280
L0040
L0050
L0060
L0070
L0080
L0090
The special processing allows non-chronological sorting and the use of special
display requirements. These rules do not have evidence data cells listed in the
factory rules file. The evidence headers and conclusions for factory rules are
stored in the file SYS$SYSTEM:PSPA$MSG.TXT.
See the Data Cell Types and Use section for a list and description of the data
cells.
Chapter 5: Customize the Knowledge Base 155
Data Cell Types and Use
Conclusion Text Element
A conclusion is a block of text presented in the Analysis Report when a rule
fires. It describes the problem detected by the rule. The format for conclusion
text is shown in the following code:
CONCLUSION "text_string"
Conclusions can contain multiple lines of text. An example of a multiline
conclusion follows:
CONCLUSION
"
Queues are forming on heavily used disks. Longer
delays will be experienced when longer queues form."
The format of this conclusion (10 spaces at the beginning of each line) ensures
consistent formatting with Performance Manager factory rules.
Brief Conclusion Text Element
A brief conclusion is one line of text presented in the Brief Analysis Report
when a rule fires. A brief conclusion describes the problem detected by the
rule. The format for a brief conclusion is the following code:
BRIEF_CONCLUSION "text_string"
To ensure consistent formatting with Performance Manager factory rules, the
text must be aligned with the left quotation mark.
Data Cell Types and Use
The Performance Manager sub-record types in the following table are stored in
Performance Manager data records. You can access the fields within the subrecords as data cells within a rule construct. See Appendix C for the names of
the data cells. You can also dump them using the ADVISE COLLECT REPORT
DUMP_DATACELLS command. This command produces a dump report of all
data cells in the LOCAL domain.
The following table shows the data sub-record types and associated domains:
Sub-record Type Associated Domain
Communication
COMMUNICATION
Configuration
CONFIGURATION
CPU
CPU
156 Performance Manager Administrator Guide
Data Cell Types and Use
Sub-record Type Associated Domain
Disk
DISK
Hot_Files
FILE
Metrics
COMMUNICATION, CONFIGURATION, CPU, DISK, FILE,
LOCAL, PROCESS, TAPE
Parameters
COMMUNICATION, CONFIGURATION, CPU, DISK, FILE,
LOCAL, SUMMARY, PROCESS, TAPE
Process
PROCESS
Tape
TAPE
Note: The CLUSTER domain references a sub-record type that exists only in
memory. It does not exist in the Performance Manager data records.
If you write a rule in the LOCAL domain, the data cells available to the rule
conditions and rule evidence include all values from the metrics and
parameters records for a single node. The Performance Manager evaluates the
rule once for each interval record (2 minutes for daily data, user-defined for
history data), for each node that is processed. For example, an hour of daily
data at the default interval contains 30 records per node for the LOCAL
domain.
If you write a rule in the PROCESS domain, data cells available to the rule
include all values from the process sub-record. Metric and parameter subrecord data cells are also available from the PROCESS domain because they
are part of the current interval record containing the given process sub-record
for the current node. The Performance Manager passes each of the process
sub-records through all rules in the PROCESS domain for each interval record
and for each node.
The number of process sub-records that the Performance Manager examines
depends on the number of processes logged in, the time range, system
activity, and for history files, the workload classification scheme. You must
reference data in a process sub-record from the PROCESS domain or from the
LOCAL, COMMUNICATION, CONFIGURATION, CPU, DISK, FILE, or TAPE
domains with a process domain index specifier. The Index Specifier Data Cell
section describes Index Specifier data cells.
The SUMMARY and CLUSTER domains do not directly correlate to Performance
Manager data records; however, they are derived from them.
Chapter 5: Customize the Knowledge Base 157
Data Cell Types and Use
The data cells available in the SUMMARY domain are metrics that are
maximums or averaged from all of the interval records. After processing all the
data for a single node, the summary data cells become available in the
SUMMARY domain. The last parameter sub-record is also available in the
SUMMARY domain. The number of times the Performance Manager tests a rule
in the SUMMARY domain is equal to the number of nodes processed.
After the Performance Manager processes all nodes data, the data cells
available in the CLUSTER domain are disk statistics that represent the cluster
perspective of the I/O traffic. The Performance Manager combines data from
each node's two-minute disk sub-records into a set of two-minute cluster
records in memory. The Performance Manager provides items such as clusterwide throughput and operation rates; however, there is no longer any
association with the “current two-minute” data record. Metric and parameter
sub-record values (available from the LOCAL domain) are not accessible from
the CLUSTER domain.
The following table lists the seven types of data cells:
Data Cell Types
Brief Descriptions
Boolean
1.0 (True) or 0 (False)
Numeric
Floating point value
String
An ASCII string
Time
Clock time for data
Scan routines
Loads tally data cells and returns sub-record count
Tally
Derived data
Index specifier
Index to a sub-record
Boolean Data Cell
A Boolean data cell is a value provided by the Performance Manager software
that represents the result of applying a commonly needed condition to a
domain (or a subset of internal records). A Boolean data cell has a value of
true (1.0) or false (0).
For example, the ANY_DISK_OVER_THRESHOLD data cell is set to either true
or false. If it is set to TRUE, at least one disk for the current Performance
Manager interval record has exceeded the I/O rate threshold for the given disk
type. If this Boolean operator did not exist, you would have to use an
expression similar to the following code:
DISK_SCAN(DISK_IO_RATE .GE. DISK_IO_RATE_THRESHOLD) .GT. 0
158 Performance Manager Administrator Guide
Data Cell Types and Use
Numeric Data Cell
A numeric data cell provides a floating-point value. For example,
NUMBER_OF_PROCESS is a numeric data cell in the LOCAL domain that
contains the floating-point value for the average number of processes resident
on the system during the given two-minute period for the current node.
String Data Cell
A string data cell provides the actual string when the cell is used as evidence.
However, when you use it in a rule condition, you must compare the string
data cell to another string data cell or to a string literal with one of the string
operators (.EQS. or .NES.).
Time Data Cell
The time data cell represents the time of the current Performance Manager
interval record. You cannot use this data cell in a rule condition; however, it is
valid as an evidence item.
Scan Routine Data Cell
You can use scan routines to scan sub-records in the target domain. The scan
routine data cell name starts with the target domain name. The scan routine
data cell counts sub-record occurrences and tallies data into tally data cells for
use in a rule expression. The scan routine data cell requires a rule expression,
enclosed with parentheses, following the scan routine name. This rule
expression can contain data cells. These cells referenced in the rule expression
must be in the target domain scanned by the scan routine.
For example, you can use the scan routine data cell PROCESS_SCAN to return
tally information. If a rule is in the LOCAL domain, you can use the following
rule expression to test whether the image XYZZY.EXE is being used:
PROCESS_SCAN (IMAGE_NAME .EQS. "XYZZY") .GT. 0
The PROCESS domain is the target domain for PROCESS_SCAN.
The value that a scan routine returns is an integer indicating the number of
times the specified expression tested true (evaluated to 1.0). In this case, the
value returned by PROCESS_SCAN would be the count of process sub-records
with an image name of XYZZY. If the value is greater than 0, the rule
expression is true.
Chapter 5: Customize the Knowledge Base 159
Data Cell Types and Use
These scan routine data cells are valid:
■
COMMUNICATION_SCAN
■
CONFIGURATION_SCAN
■
CPU_SCAN
■
DISK_SCAN
■
FILE_SCAN
■
PROCESS_SCAN
■
TAPE_SCAN
You cannot use scan routine data cells as evidence.
Tally Data Cell
Tally data cells contain data tallied from those sub-records scanned when the
scan routine rule expression holds true.
Each scan routine has a target domain. Each tally data cell has a target
domain. A given scan routine updates those tally data cells with the same
target domain as the scan routine's target domain. Scan routine data cell
names start with the target domain name.
For a given rule, you can use tally data cells in a rule expression or evidence
after a call to a scan routine. For example, a LOCAL domain rule with the
following expression makes available the process TALLY fields that contain the
sum of all PROCESS domain metrics for process sub-records with the user
name of CHARLIE:
PROCESS_SCAN(USER_NAME .EQS. "CHARLIE") .GT. 0
Subsequent rule expressions may use the tally data cells in the same rule. For
example:
PROCESS_CPUTIME_TALLY .GT. 1000
Tally Data Cells and Associated Scan Routines
The following table shows tally data cells and the associated scan routines:
Scan Routines
Tally Data Cells Updated by Scan Routines
COMMUNICATION_SCAN
COMM_OPERATION_RATE_TALLY
160 Performance Manager Administrator Guide
Data Cell Types and Use
Scan Routines
Tally Data Cells Updated by Scan Routines
CONFIGURATION_SCAN
DATAGRAMS_SEND_TALLY
DATAGRAMS_RECEIVED_TALLY
DATAGRAMS_DISCARDED_TALLY
SEQUENCED_MESSAGES_SENT_TALLY
SEQUENCED_MESSAGES_RECD_TALLY
BLOCK_SEND_DATAS_INIT_TALLY
KB_SENT_VIA_SEND_DATAS_TALLY
BLOCK_REQUEST_DATAS_INIT_TALLY
KB_RECVD_VIA_REQST_DATAS_TALLY
KB_MAPPED_TALLY
SEND_CREDIT_QUEUE_TALLY
BUFFER_DESC_QUEUE_TALLY
CPU_SCAN
CPU_KERNEL_TALLY
CPU_EXEC_TALLY
CPU_SUPER_TALLY
CPU_USER_TALLY
DISK_SCAN
DISK_SERVICE_TIME_TALLY
DISK_QUEUE_LENGTH_TALLY
DISK_IO_RATE_TALLY
DISK_THRUPUT_TALLY
DISK_PAGING_IO_RATE_TALLY
DISK_PAGING_THRUPUT_TALLY
DISK_SWAPPING_IO_TALLY
DISK_SWAPPING_THRUPUT_TALLY
DISK_BUSY_PERCENT_TALLY
DISK_ERROR_COUNT_TALLY
DISK_READ_IO_RATE_TALLY
DISK_FREE_PAGES_TALLY
DISK_MSCP_IO_RATE_TALLY
DISK_MSCP_PAGING_IO_TALLY
DISK_MSCP_THRUPUT_TALLY
DISK_SPLIT_IO_TALLY
FILE_SCAN
FILE_THROUGHPUT_TALLY
FILE_OPERATION_TALLY
FILE_READ_TALLY
FILE_SPLIT_IO_TALLY
FILE_PAGING_IO_TALLY
FILE_SWAPPING_IO_TALLY
Chapter 5: Customize the Knowledge Base 161
Data Cell Types and Use
Scan Routines
Tally Data Cells Updated by Scan Routines
PROCESS_SCAN
PROCESS_CPUTIME_TALLY
WORKING_SET_FAULT_TALLY
WORKING_SET_FAULT_IO_TALLY
PROCESS_DIRECT_IO_TALLY
PROCESS_BUFFERED_IO_TALLY
GLOBAL_PGS_TALLY
PRIVATE_PGS_TALLY
WORKING_SET_LIST_TALLY
WORKING_SET_DEFAULT_TALLY
WORKING_SET_QUOTA_TALLY
WORKING_SET_EXTENT_TALLY
PROCESS_UPTIME_TALLY
PROCESS_IMAGE_ACTS_TALLY
PROCESS_COM_PERCENT_TALLY
PROCESS_DISK_THRUPUT_TALLY
PROCESS_DISK_IO_TALLY
TAPE_SCAN
TAPE_IO_TALLY
TAPE_ERROR_TALLY
Index Specifier Data Cell
Index specifiers are data cells that indicate a specific occurrence of a subrecord that has a unique characteristic in one of these domains:
■
COMMUNICATION
■
CONFIGURATION
■
CPU
■
DISK
■
FILE
■
PROCESS
■
TAPE
During analysis, the Performance Manager reads an interval record. The
Performance Manager evaluates rules in the following domains:
■
LOCAL
■
PROCESS
■
DISK
■
FILE
■
CPU
162 Performance Manager Administrator Guide
Implement Changes
■
COMMUNICATION
■
CONFIGURATION
■
TAPE
Data cells available in the LOCAL domain are available to rules in all of these
domains. You can reference data cells in the PROCESS, DISK, FILE, CPU,
COMMUNICATION, CONFIGURATION, or TAPE domains and not in the LOCAL
domain directly by rules within that domain, or indirectly with an index
specifier to data cells in any of the other domains. Each index specifier data
cell has a target domain. The target domain indicates the name of the domain
of the desired data cell.
For example, the index specifier TOP_CPU_PROC_X points to a specific process
sub-record for the current interval. You might use the index specifier in rule
definitions in the LOCAL, DISK, FILE, CPU, COMMUNICATION,
CONFIGURATION, or TAPE domains.
Specify the PROCESS domain data cell with the index specifier as a parameter.
A rule expression for a rule in the LOCAL domain is as follows:
PROCESS_CPUTIME(TOP_CPU_PROC_X)
This expression calculates which process has the highest CPU time. Although
PROCESS_CPUTIME is a PROCESS domain data cell, TOP_CPU_PROC_X is a LOCAL domain
index specifier that has a target domain of PROCESS. So, you can reference any
PROCESS domain data cell from a rule in the LOCAL domain by using an index
specifier with the target domain of PROCESS. The maximum index depth for index
specifiers is two.
Implement Changes
This section provides scenarios for customizing the knowledge base with the
following actions:
■
Disabling an existing rule
■
Modifying an existing rule
■
Adding a new rule
■
Changing a threshold value
■
Changing a rule literal value
While the scenarios assume that your auxiliary rules file is called
MYRULES.VPR, you can name it whatever you like, provided that it conforms
to standard OpenVMS naming conventions.
Chapter 5: Customize the Knowledge Base 163
Implement Changes
There are two files to which you probably need to refer when making changes
to the factory rules. The first is a copy of the source file for the factory rules,
located in PSPA$EXAMPLES:PSPA$KB.VPR. The second is the message text file
(which contains the Conclusions and Evidence headings), located in
SYS$SYSTEM:PSPA$MSG.TXT. You should make a copy of each in your private
directory to modify; do not edit these files directly.
Disable an Existing Rule
Assume that you work in a secure government facility, and data security is a
top priority. You do not care if security erase I/Os exceed their default
threshold of 1 I/O per second, and would like to disable the rules that check
for this.
To do this, first check in the source file of the factory rules
(PSPA$EXAMPLES:PSPA$KB.VPR) and in the message text file
(SYS$SYSTEM:PSPA$MSG.TXT) for the rules of interest. You find one rule,
I0180, which focuses on security erasures. To eliminate this rule from further
consideration in your knowledge base, add the following line to your rules
source file MYRULES.VPR:
DISABLE I0180;
The semicolon terminator (;) is important: if you forget one of these, your
auxiliary rules file probably does not compile.
To use this rule file, see the sections Build an Auxiliary Knowledge Base (see
page 172) and Use an Auxiliary Knowledge Base for Reporting and Archiving
(see page 173).
Modify an Existing Rule
Assume that you do not want to see all the lines of evidence produced by rule
R0095 for the image VMSBUXX, because you cannot change the operation of
this image. To modify a rule, you need to first disable the factory version of
that rule, then copy the factory version into your MYRULES.VPR file and modify
it accordingly. Make sure that you define all literals used in this rule - see the
section Change a Rule Value (see page 172).
164 Performance Manager Administrator Guide
Implement Changes
The following example shows how your auxiliary rules file might look.
The bulk of the new rule came from the corresponding factory rule in
PSPA$EXAMPLE:PSPA$KB.VPR. The only difference is the addition of a
condition to filter out VMSBUXX image records from the rules processing. The
actual rule number could not simply be copied in the auxiliary rules file, as a
zero in the second character is reserved.) Most of the conclusion sections were
copied from their corresponding sections in SYS$SYSTEM:PSPA$MSG.TXT. The
example also shows that you can make minor modifications to the factory
rules, without investing significant time and effort.
To use this rule file, see the sections Build an Auxiliary Knowledge Base (see
page 172) and Use an Auxiliary Knowledge Base for Reporting and Archiving
sections (see page 173).
To change an Existing Rule
■
Use the following code:
DISABLE R0095;
Literal TD_FILE_CACHE_HITRATIO = 70
TD_FILE_CACHE_MISSEDIO_RATE = 5
TD_XQP_CACHE = 10
EndLiteral
Rule UR095
XQP_Cache_hit_ratio .lt. td_file_cache_hitratio;
XQP_Cache_missedio_rate .ge. td_file_cache_missedio_rate;
File_header_Cache_HR .lt. td_file_cache_hitratio;
(100 - File_header_Cache_HR) / 100 * File_header_Cache_AR
.ge. td_file_cache_missedio_rate;
Disk_header_cache_size(Highest_IO_rate_disk_x) .ge.
Sysgen_Acp_Hdrcache;
Image_name(Top_Dirio_process_x) .nes. "BACKUP";
Image_name(Top_Dirio_process_x) .nes. "VMSBUXX";
Occurrences = td_XQP_cache;
Chapter 5: Customize the Knowledge Base 165
Implement Changes
Evidence =
Sysgen_Acp_Hdrcache
Disk_Header_Cache_size(Highest_IO_rate_disk_x)
File_header_Cache_HR
File_header_Cache_AR
Volume_name(top_dskio_proc_topdsk_x)
Disk_IO_rate(top_dskio_proc_topdsk_x)
User_name(top_dskio_process_x)
Image_name(top_dskio_process_x)
Time;
Conclusion
"There are too many disk I/Os caused by a low hit ratio on
the file header cache. This will occur if your workload
causes disk files to be scanned instead of repeatedly
accessed (i.e., BACKUP, DIR, SEARCH, etc). However, if your
workload does not scan disk files, so that there is still
useful information in the cache, then you may benefit by
using AUTOGEN with the feedback mechanism to automatically
increase the SYSGEN parameter ACP_HDRCACHE. After
successive uses of AUTOGEN, its feedback mechanism provides
the system with sufficient file header cache for the average
workload."
Brief_conclusion
"Low hit ratio, high attempt rate on the file header cache."
EndRule
Add a New Rule
Assume that a user would like you to add a rule that fires when any disk is low
on space. The following data cells: DISK_MAX_BLOCKS, ANY_DISK_FULL (a
binary data cell type derived from DISK_MAX_BLOCKS), and
DISK_MOST_FULL_X (an index specifier pointing to the most affected disk)
make this type of rule possible. An example of adding a new rule to check for
disk space shortages follows:
166 Performance Manager Administrator Guide
Implement Changes
To creating a new rule
■
Use the following code
Rule UI101
Any_disk_full .eq. True;
Occurrences = td_IO;
Evidence =
Volume_name(Disk_most_full_x)
Disk_free_pages(Disk_most_full_x)
Time;
Conclusion
"The following disks are almost full. You should purge or
delete any unnecessary files. You might also consider
moving some files to a disk with more free space."
Brief_conclusion
"Disk space shortage. Clean up disk or off-load some files."
EndRule
You could insert the type of rule shown in the previous example in many
possible places within the I/O decision tree used by the Performance Manager
software, which would add more conditions to those presented here. Also, you
might have a large reference database that completely fills up N-1 volumes of
its volume set, so you would want to exclude those from consideration. Finally,
you might want to show additional data cells in the Evidence.
Change a Threshold Value
Assume that you would like to be even more proactive detecting potential
bottlenecks on disks. You might want to reduce the global threshold on disk
queue length (which is used as an initial condition in many disk rules) from 1.0
to 0.66, and see how many more rule firings you get as a result of this
change.
Chapter 5: Customize the Knowledge Base 167
Implement Changes
The list of all Performance Manager thresholds is presented in the Performance
Manager Thresholds table at the beginning of this chapter. To implement a
change like this is relatively straightforward. Simply add the following line to
your MYRULES.VPR file:
Threshold TD_DISK_QL_MAX = 0.66 EndThreshold
Assume that you would like to make this change, plus raise the threshold of
free space remaining on a disk from 5 percent to 10 percent (for use in the
rule that you just finished adding in the last section). To change more than
one threshold, you might want to change your format within MYRULES.VPR to
the following, for greater clarity:
Threshold
TD_DISK_QL_MAX = 0.66
TD_MIN_DSKSPC_PCT = 0.10
EndThreshold
There are other cases when a threshold might need to be changed. For
example, if you own older RF31 disk drives, you should change the RF31
threshold values, as they now reflect the performance of the newer RF31T
disk. (The internal model number used by OpenVMS to identify disk types is no
longer unique: this is the first case of an ID number being re-used for a newer
disk, but more recycling of IDs is expected in the future.)
Also, certain disks may be able to process many more I/Os per second than
indicated by the given disk thresholds, if they are able to make effective use of
their (embedded or HSC-based) disk cache. If you have many I/O rule firings,
but upon investigation, find relatively low queue lengths on disks that are
processing I/Os at a much higher rate than shown in the Performance Manager
Thresholds table, then you might want to increase your disk operations rate
thresholds to account for this performance, and eliminate these extraneous
rule firings.
Suggested numbers for these scenarios are as follows:
■
If you have an older RF31 (as opposed to the newer RF31T), then you
should change the threshold TD_T56_RF31 to 34.
■
If your workloads on any of the following disks benefit from disk caching,
then you might want to set the following thresholds:
TD_T43_RF30 = 31 TD_T48_RZ22 = 40
TD_T44_RF71 = 31 TD_T49_RZ23 = 41
TD_T56_RF31 = 96 TD_T50_RZ24 = 51
TD_T57_RF72 = 55 TD_T51_RZ55 = 54
TD_T75_RFH31 = 96 TD_T59_RZ25 = 65 (est.)
168 Performance Manager Administrator Guide
Implement Changes
TD_T76_RFH72 = 55 TD_T60_RZ56 = 58
TD_T77_RF73 = 63 TD_T61_RZ57 = 62
TD_T78_RFH73 = 63 TD_T66_RZ23L = 47
TD_T81_RF35 = 87 TD_T68_RZ57I = 62
TD_T82_RFH35 = 87 TD_T70_RZ58 = 70 (est.)
TD_T83_RF31F = 56
TD_T84_RZ72 = 63 (est.)
For the older RF31: TD_T85_RZ73 = 63
TD_T56_RF31 = 51 TD_T86_RZ35 = 87
TD_T75_RFH31 = 51 TD_T87_RZ24L = 55 (est.)
TD_T88_RZ25L = 62 (est.)
With HSC caching: TD_T89_RZ55L = 59 (est.)
TD_T80_RA71 = 97 TD_T90_RZ56L = 60 (est.)
TD_T79_RA72 = 97 TD_T91_RZ57L = 62 (est.)
TD_T92_RA73 = 102 TD_T93_RZ26 = 87
TD_T94_RZ36 = 88 (est.)
TD_T95_RZ74 = 78 (est.)
TD_T99_RZ27 = 88 (est.)
You might want to change processor-specific thresholds (in the Performance
Manager Thresholds table). To learn what default values are in effect for your
system, you can produce a dump report for a single two-minute interval as
follows:
$ ADVISE COLLECT REPORT DUMP_DATACELLS _$ /BEGINNING=hh:mm/ENDING=hh:mm+2/NODE_NAMES=node1
hh:mm+2
Take the the actual hours and minutes from the beginning statement, add
two minutes, and then enter the final value in the hh:mm format. Do not
use +2 as part of the syntax.
Look up the values given for their corresponding data cells CPU_VUP_RATING,
COM_SCALING, SOFT_FAULT_SCALING, HARD_FAULT_SCALING, and
IMG_ACT_RATE_SCALING. (Since the DUMP_DATACELLS report produces
voluminous output for each interval, and since the processor-specific
thresholds do not change, generate this report for only one two-minute
interval to learn their (fixed) values.)
These scaling factors are multiplied by the values shown in the following
examples before being applied in rule condition-checking:
■
Soft fault scaling factors are multiplied by TD_HIGH_SOFT_FAULT (rule
literal), default value = 100.
■
Hard fault scaling factors are multiplied by TD_HIGH_HARD_FAULT (rule
literal), default value = 10.
■
Image activation scaling factors are multiplied by TD_HIGH_IMGACT (rule
literal), default value = 0.5.
Chapter 5: Customize the Knowledge Base 169
Implement Changes
■
Number in the Compute queue scaling factors are multiplied by
TD_COM_PROCESSES (rule literal), default value = 5.
■
VUPS for SMP systems are computed by adding 85 percent (threshold
TD_SMP_VUP_RATIO) of the single processor VUPS rating for each
additional processor.
If you decide that you would like to refine the scaling factors to more precisely
reflect typical activity on your system, then you need to know your system's
hardware model ID number. To get this, enter the following at the DCL
prompt:
$ n = f$getsyi("hw_model")
$ show symbol n
Assume that this action returned the number 230 to you. Then, if you want to
change the threshold for the number of jobs in the Compute queue from its
default value of 1.30 to 1.45, you just add another line in MYRULES.VPR in the
following format:
Threshold TD_COM_SCALING_230 = 1.45 EndThreshold
Change a Rule Literal Value
Assume that security (due to its additional overhead)is not a priority for your
systems. Minimal security erasure I/Os should occur on your system. You
would like to change the threshold used in rule I0180 from 1.0 to 0.1. You
look in the source file for the factory rules (PSPA$EXAMPLES:PSPA$KB.VPR)
and find TD_HIGH_ERASE_IO = 1.0 in the initial literals section.
Performance Manager Rule Literals
This rule literals section is listed in the following table for ease of reference:
Literal
TD_HIGH_ERASE_IO = 1.00
TD_DISK_QUEUE_LENGTH = 1.00
TD_HIGH_PROC_PAGE_FAULT = 500
TD_IO_ERROR_COUNT = 2
TD_IO = 4
TD_CPU = 4
TD_IMG = 10
TD_XQP_CACHE = 10
TD_PAR = 4
TD_SYS = 4
170 Performance Manager Administrator Guide
Implement Changes
TD_HDW = 10
TD_RSR_PPR = 2
TD_RSR_INT = 10
TD_HIGH_INTERRUPT_STACK = 20
TD_HIGH_KERNEL_MODE = 30
TD_HIGH_EXEC_MODE = 35
TD_HIGH_HARD_FAULT = 10
TD_HIGH_SOFT_FAULT = 100
TD_HIGH_DECNET_RATE = 100
TD_IDLE_MEM_RATIO = 0.05
TD_HIGH_SWAPPING = 1.00
TD_LOW_SWAP_IDLETIME = 20
TD_LOW_BALSET_MEM_AVL = 15
TD_HIGH_GLOBAL_FAULT = 40
TD_HIGH_SYSTEM_FAULT = 3
TD_HIGH_SPLIT_IO = 5
TD_HIGH_TURN_RATE = 6
TD_FILE_CACHE_HITRATIO = 70
TD_FILE_CACHE_MISSEDIO_RATE = 5
TD_COM_PROCESSES = 5
TD_CPU_NORMAL_OVERHEAD = 7
TD_HIGH_SYS_BUFIO = 70
TD_HIGH_FILE_SYSTEM = 30
TD_HIGH_SYS_OPENS = 5
TD_HIGH_TERM_IO = 60
TD_HIGH_IMGACT = 0.5
TD_POOL_EXPANSION_RATIO = 0.40
TD_POOL_EXPANSION_LIMIT_RATIO = 0.85
TD_CIBCI_PEAK_KBTHRUPUT = 1200
TD_BCAA_PEAK_KBTHRUPUT = 1400
TD_BCAB_PEAK_KBTHRUPUT = 2200
TD_CIXCD_PEAK_KBTHRUPUT = 9000
TD_CI780_PEAK_KBTHRUPUT = 1900
TD_ADAPTER_SATURATION_WARNIING_RATIO = 0.80
TD_AVG_MESSAGE_SIZE_KB = 0.117
True = 1
False = 0
Endliteral
While thresholds affect all rules, literals affect the rules that are local to them
(that is, included in the same file). So, to make this change effective, you
need to disable the original factory rules and copy over your own versions of
this rule into your auxiliary knowledge base, where it may be compiled with
the new, lower value of TD_HIGH_ERASE_IO.
Chapter 5: Customize the Knowledge Base 171
Build an Auxiliary Knowledge Base
Changing a Rule Value
An example of what you would include in your MYRULES.VPR to effect this
change follows:
DISABLE I0180;
Literal TD_HIGH_ERASE_IO = 0.1 EndLiteral
Rule UI180
Split_io_rate .lt. td_high_split_io;
Window_turn_rate .lt. td_high_turn_rate;
Erase_QIO_rate .ge. td_high_erase_io;
Occurrences = td_io;
Evidence =
Erase_QIO_rate
Time;
Conclusion
"Security erasures (as measured by Erase I/Os) have exceeded
threshold. These I/Os may be generated on a per-file basis
by the use of $DELETE /ERASE or $PURGE /ERASE. They may also
be generated on a per-volume basis through the use of
$SET VOLUME /ERASE_ON_DELETE or by *NOT* turning off the
HIGHWATER_MARKING attribute, which OpenVMS enables by
default for all volumes."
Brief_conclusion
"Security erasures detected; disable if not necessary."
EndRule
In the previous example, the conditions and evidence were copied from the
factory rules source file, while the conclusion and brief conclusion were copied
from the message text file.
Build an Auxiliary Knowledge Base
You can supplement and disable Performance Manager rules. To modify the
effect of the default Performance Manager knowledge base, create an auxiliary
knowledge base with your own rule definitions. Edit your rules using a
standard text editor.
172 Performance Manager Administrator Guide
Use an Auxiliary Knowledge Base for Reporting and Archiving
Build your auxiliary knowledge base by entering the following command:
$ ADVISE PERFORMANCE COMPILE MYRULES.VPR
In this example, MYRULES.VPR is the name of your source rules file. The
Performance Manager compiles the rules, and then names the resultant
knowledge base MYRULES.KB.
Note: If you compile an auxiliary rules file, it is valid only for the version of the
Performance Manager software on which it was compiled (and later
versions). Use caution to not place it in a cluster common area. This is due to
concern that the compiled rules file might be used on older software versions
where the new keywords and data cells are not defined. The filename
PSPA$KB.KB is reserved by CA and should not be used to name an auxiliary
rules file.
Use an Auxiliary Knowledge Base for Reporting and
Archiving
The Performance Manager generates Analysis Reports based on the
Performance Manager factory knowledge base combined with the auxiliary
knowledge base when you specify the name of your auxiliary rules file with the
following command:
$ ADVISE PERFORMANCE REPORT ANALYSIS/RULES=MYRULES.KB
The Performance Manager archives analysis results for rules in all domains,
except CLUSTER and SUMMARY. When you issue the following command, rule
occurrences based on the Performance Manager factory knowledge base
combined with the auxiliary knowledge base are archived:
$ ADVISE ARCHIVE/RULES=MYRULES.KB
If you want to use the auxiliary knowledge base regularly, you can use the
Performance Manager Parameter Editor (ADVISE EDIT command) to set the
AUTO_AUGMENT parameter to the name of your rule file. This setting becomes
the system-wide default. The Performance Manager uses your auxiliary
knowledge base file and augments the factory rules whenever you generate an
Analysis Report or archive data.
When configuring AUTO_AUGMENT to use an auxiliary rules file in an OpenVMS
Cluster, place the file in PSDC$DATABASE or place it in another directory that
is accessible by all nodes of the cluster. If a logical name is used within the file
specification, be sure that the logical name is defined in the SYSTEM logical
name table on all nodes. Alternatively, the cluster logical name table could be
used.
Chapter 5: Customize the Knowledge Base 173
Use an Auxiliary Knowledge Base for Reporting and Archiving
You can override the AUTO_AUGMENT parameter and specify another auxiliary
rules file with the following command:
$ ADVISE PERFORMANCE REPORT ANALYSIS/RULES=MY_OTHER_RULES.KB
You can override the AUTO_AUGMENT parameter entirely and specify no
auxiliary rules with the following command:
$ ADVISE PERFORMANCE REPORT ANALYSIS/NORULES
To clear the automatic augmenting of your site-specific rules, specify SET
NOAUTO_AUGMENT with the Performance Manager Parameter Editor.
174 Performance Manager Administrator Guide
Chapter 6: Performance Manager
Commands
This is a reference chapter for the Performance Manager command syntax. It
describes all commands, their qualifiers, keywords, and options. See the
Performance Agent Administrator Guide for a complete description of the
ADVISE ARCHIVE, ADVISE COLLECT, and ADVISE EDIT commands.
At installation time the Performance Manager software adds the ADVISE
PERFORMANCE command to the DCL command table. To start a Performance
Manager action, issue the ADVISE PERFORMANCE command with the
appropriate action option to perform the desired task, for example, ADVISE
PERFORMANCE COMPILE.
This section contains the following topics:
ADVISE
ADVISE
ADVISE
ADVISE
ADVISE
ADVISE
ADVISE
ADVISE
PERFORMANCE
PERFORMANCE
PERFORMANCE
PERFORMANCE
PERFORMANCE
PERFORMANCE
PERFORMANCE
PERFORMANCE
(see page 175)
COMPILE (see page 176)
DISPLAY (see page 178)
EXPORT (see page 182)
GRAPH (see page 191)
PIE_CHART (see page 232)
REPORT (see page 234)
SHOW VERSION (see page 238)
ADVISE PERFORMANCE
The ADVISE PERFORMANCE command initiates the functions of the
Performance Manager module.
Format
ADVISE PERFORMANCE option
ADVISE/INTERFACE[={DECWINDOWS|MOTIF}]
Description
The ADVISE PERFORMANCE command options are described individually in this
guide. If you do not specify an option, the command defaults to command
mode with a PSPA> prompt. For more information about command mode, see
the chapters Customize the Knowledge Base (see page 135) and Use
Command Mode Commands (see page 239).
Chapter 6: Performance Manager Commands 175
ADVISE PERFORMANCE COMPILE
If the /INTERFACE qualifier is used to start the DECwindows interface, refer to
the chapter Use the DECwindows Motif Interface (see page 257) for more
information. The following table lists the ADVISE PERFORMANCE command
options:
Option
Function
COMPILE
Compiles user rules.
DISPLAY
Activates the Performance Manager Real-time
Display Interface.
EXPORT
Activates the data export facility.
GRAPH/PIE_CHART
Activates the Performance Manager graphing
facility.
REPORT
Activates the Performance Manager reporting
facility.
SHOW VERSION
Identifies the current version of the Performance
Manager module.
ADVISE PERFORMANCE COMPILE
The ADVISE PERFORMANCE COMPILE command invokes the Performance
Manager rules compiler to compile a set of user rules from the specified file.
Format
ADVISE PERFORMANCE COMPILE file-spec
Parameter
file-spec
The file specification of a text file that contains user-defined rules or
disabled Performance Manager factory rules. The default file type is .VPR.
Description
ADVISE PERFORMANCE COMPILE invokes the rules compiler to compile a set of
rules into the auxiliary knowledge base. The output file is a compiled version
of the rules (and thresholds) in an efficient format used to produce an Analysis
Report. To use the auxiliary knowledge base, specify the file name with the
/RULES qualifier when you generate either a Brief_Analysis or an Analysis
report.
176 Performance Manager Administrator Guide
ADVISE PERFORMANCE COMPILE
During the archiving process, the auxiliary rules can be applied to the data
being processed, resulting in “rules” records being added to the archive files.
Later processing of the archived data allows the rules records to be graphed,
reported on, or dumped.
Optionally, set AUTO_AUGMENT in the parameters file and specify the file
specification for the auxiliary knowledge base. The Performance Manager
software uses your rules to augment the Performance Manager factory rules.
For information and additional examples on how to create an auxiliary rules
file, see the chapter Customize the Knowledge Base (see page 135).
Qualifiers
/RULES=file-spec
Specifies the name of the auxiliary knowledge base output file. By default,
the Performance Manager rules compiler creates an output file in the
default directory with the file name of the specified input file and file type
of .KB.
Examples
$ ADVISE PERFORMANCE COMPILE MY_SITE
The Performance Manager reads the MY_SITE.VPR file and compiles the rules
for subsequent use. The Performance Manager creates a file named
MY_SITE.KB in the default directory.
To use the compiled rules in conjunction with Performance Manager factory
rules, type the following command:
$ ADVISE PERFORMANCE REPORT ANALYSIS/RULES=MY_SITE
Or alternately, use the Parameter Edit Utility to automatically use your
compiled rules:
$ ADVISE EDIT
PSDC_EDIT> SET AUTO_AUGMENT DEVICE:[DIRECTORY]MY_SITE.KB
PSDC_EDIT> EXIT
$ ADVISE PERFORMANCE REPORT ANALYSIS
In either case, the Performance Manager reads in the compiled user rules in
addition to the default Performance Manager rules when generating an
Analysis Report.
$ ADVISE PERFORMANCE GRAPH/HISTORY=MONTHLY-USER _$ /TYPE=TOP_CPU_RULE_OCC
The top firing rules concerning CPU usage during the last month are displayed.
Chapter 6: Performance Manager Commands 177
ADVISE PERFORMANCE DISPLAY
ADVISE PERFORMANCE DISPLAY
The ADVISE PERFORMANCE DISPLAY command invokes dynamic displays
using a DECwindows Motif interface or using a character-cell terminal.
Format
ADVISE PERFORMANCE DISPLAY display_keyword
Description
Use the ADVISE PERFORMANCE DISPLAY command to produce dynamic
Performance Manager displays. The following section describes the qualifiers
you can use with the ADVISE PERFORMANCE DISPLAY command to control
displays. The display keywords are:
■
CHARACTER_CELL
Provides dynamic displays on a character cell terminal.
■
WINDOWS
Provides dynamic displays using a DECwindows Motif interface.
Qualifiers
Some of the following qualifiers are valid for both the CHARACTER_CELL and
WINDOWS interfaces, while others are valid for only CHARACTER_CELL. Each
qualifier has one of the following interface annotations:
■
(C)-CHARACTER_CELL only
■
(C,W)-Both CHARACTER_CELL and WINDOWS
/BEGINNING=time
(C) Specifies the starting date and time for the display, for doing playback.
Normally, you do not need to specify this qualifier, however to view
previously recorded data using the Real-time displays, specify the desired
begin time. When completed with the display, use the DISCONNECT and
EXIT push buttons to exit.
You can specify either an absolute time or a combination of absolute and
delta times. For complete information on specifying time values, see HP's
OpenVMS User's Manual (or type HELP DATE_TIME).
You can also use the keywords TODAY, TOMORROW and YESTERDAY.
/BEGINNING is mutually exclusive (or ignored) with /MODE=NETWORK.
178 Performance Manager Administrator Guide
ADVISE PERFORMANCE DISPLAY
/COLLECTION_DEFINITION=collection-definition-name
(C,W) Specifies the name of the Collection Definition, and hence the
collected data that you use for the dynamic display. If you omit this
qualifier, data is obtained from the Collection Definition called “CPD.” Use
the ADVISE COLLECT SHOW STATUS command to see which collection
definitions are active.
The /COLLECTION_DEFINITION qualifier is used in conjunction with the
/MODE=DISKFILE qualifier and is ignored if you specify
/MODE=NETWORK.
/DISK_DEVICES=(devicename,...)
(C,W) The /DISK_DEVICES qualifier allows you to specify a list of disk
device names that are included in the Real-time Character Cell displays. If
the qualifier is omitted, all disk devices are included on the displays.
Server statistics are provided for the servers that provide access to the
disks selected. This qualifier is mutually exclusive with /VOLUMES.
/DNS_NAMES=filename
(C) Specifies the node name translation file for DECnet Phase V support
when Phase V Node Synonyms are not defined. This qualifier is used along
with the /MODE=NETWORK qualifier.
The format of this ASCII file is one translation per line which consists of
two names separated by a comma. Provide the cluster name first and then
the DECnet Phase V name (or name segment) or address. For example:
LATOUR,DEC:.TAY.StanWilk
For more information on this translation file, see the appendix
Performance Manager Logical Names (see page 405).
/NODE_NAMES=(nodename,...)
(C,W) Specifies the node for which data is to be displayed. By default, all
nodes associated with the collection definition are displayed.
/MODE={NETWORK|DISKFILE}
(C,W) Specifies which data gathering mode to use. DISKFILE access does
not start up a new data collector, whereas the NETWORK keyword does.
DISKFILE allows use of the cluster's currently open collection files for the
source of data. DISKFILE cannot be used for displaying data from remote
nodes Real-time; only for nodes within the current cluster. However, data
from remote nodes can be selected for viewing in playback mode.
DISKFILE mode lets you display additional information that only the main
CPD Performance Manager collects. This includes process terminal
response time, hot file records, and process device IO rates. For the Motif
displays, you can view several default panels that refer to this additional
information, see Chapter 10 for these panels with (MODE=DISKFILE).
Chapter 6: Performance Manager Commands 179
ADVISE PERFORMANCE DISPLAY
/INTERVAL=seconds
(C,W) Specifies the interval, in seconds, between collection records when
collecting data in NETWORK mode. The /INTERVAL qualifier is ignored
when you specify /MODE=DISKFILE; the interval is that of the collection
selected. The valid range is 1 to 86400.
/RULES=file-spec
(C) With the character cell interface, generates brief conclusions based on
a knowledge base you have specified to supplement the default knowledge
base. The file-spec must point to the auxiliary knowledge base which has
previously been compiled with the ADVISE PERFORMANCE COMPILE
command. The default file type is .KB.
If you specify /NORULES, no auxiliary knowledge base is used for the
display, even if AUTO_AUGMENT is enabled.
/VOLUMES=(name,...)
(C) The /VOLUMES qualifier allows you to specify a list of disk volume
names that is included in the Real-time Character Cell displays. If the
qualifier is omitted, all disk devices are included on the displays.
Server statistics are provided for the servers that provide access to the
disks selected. This qualifier is mutually exclusive with /DISK_DEVICES.
/INITIAL=(options)
(C) With the character cell interface, indicates which display to bring up
first, and what values to use for the Investigate screen scale factors.
The options are as follows:
■
■
SCREEN=
–
NODE
–
PROCESS
–
DISK
–
RULES
–
INVESTIGATE_SYSTEM
–
INVESTIGATE_MEMORY
–
INVESTIGATE_CPU
–
INVESTIGATE_IO
–
INVESTIGATE_LOAD
–
RESOURCE_MEMORY
–
RESOURCE_CPU
–
RESOURCE_DISK
PROCESS_SCALING = n,
180 Performance Manager Administrator Guide
ADVISE PERFORMANCE DISPLAY
■
WORKINGSET_SCALING = n,
■
RATE_PER_SECOND_SCALING = n
Chapter 6: Performance Manager Commands 181
ADVISE PERFORMANCE EXPORT
ADVISE PERFORMANCE EXPORT
The ADVISE PERFORMANCE EXPORT command allows Performance Manager
data to be converted into a format you can use for further processing.
Format
ADVISE PERFORMANCE EXPORT
Description
The EXPORT command converts Performance Manager data into a format that
can be read and processed by an alternative analysis tool.
This command generates a file in CSV (comma separated variable) format.
Other tools can then import this data file directly for further processing.
Qualifiers
/BEGINNING=time
Specifies the starting date and time of the data to be exported. If /ENDING
is not specified, the default /BEGINNING time is TODAY. If /ENDING is
specified, the default /BEGINNING time is 00:00 of the date specified with
/ENDING.
/BEGINNING is incompatible with the /DATES qualifier.
/CLASS=(item[,...])
Specifies which optional classes of statistics are included in the export file.
You can select any of the following class items:
Keyword
Meaning
ALL
Report all optional class statistics,
along with default classes
CPU
Report CPU statistics
DEFAULT_STATISTICS
Report CPU, DISK, IO, MEMORY,
PAGE_FAULT and XQP_CACHE
statistics
DEVICE
Report device statistics
DISK
Report disk statistics
IO
Report I/O statistics
182 Performance Manager Administrator Guide
ADVISE PERFORMANCE EXPORT
Keyword
Meaning
LOCK
Report lock statistics
MEMORY
Report memory statistics
PAGE_FAULT
Report page fault statistics
PROCESS[=([NO]EXTENDED,
[NO]IMAGE,ALL)
Report process statistics
SYSTEM_COMMUNICATION
Report system communication
services statistics
XQP_CACHE
Report XQP statistics
You can negate these keywords to indicate that reporting of a particular class
of data is not wanted. Also, you can specify /CLASS=(ALL[,negated-keyword])
to allow an “all but these” capability.
The DEFAULT_STATISTICS class of statistics is always on unless specifically
negated. For example, if /CLASS=LOCK is specified, then CPU, DISK, IO,
MEMORY, PAGE_FAULT, XQP_CACHE and LOCK statistics are exported. To
disable any classes of data which are part of the DEFAULT_STATISTICS group,
you must specify NODEFAULT_STATISTICS. Therefore, if you want to report
only disk and CPU data, specify
/CLASS=(NODEFAULT_STATISTICS,CPU,DISK).
The PROCESS keyword allows you to specify the optional keywords
EXTENDED, IMAGE or ALL. The presence of the EXTENDED keyword indicates
that the extended process metric data is to be exported along with the
standard process metric data. If you do not specify EXTENDED, then
NOEXTENDED is assumed. The presence of the IMAGE keyword indicates that
the image name for each process is to be exported along with the standard
process metric data. If you do not specify IMAGE, then NOIMAGE is assumed.
The presence of the ALL keyword indicates that all available process metric
data is to be exported, including the standard process metric data, the
extended process metric data, and the image name.
If you omit the /CLASS keyword from the command line, then
/CLASS=DEFAULT_STATISTICS is assumed.
/CLASSIFY_BY=USERGROUP=workload-family
Lets you specify a workload family to control how process data is
classified. By default, all process data is exported without being
summarized.
Chapter 6: Performance Manager Commands 183
ADVISE PERFORMANCE EXPORT
/COLLECTION_DEFINITION=collection-definition-name
Specifies the name of the Collection Definition, and hence the collected
data that you want to export. If you omit this qualifier, daily data is
obtained from the Collection Definition called “CPD.” To view the Collection
Definitions that you have available, use the DCL command ADVISE
COLLECT SHOW SCHEDULE. If you want to use history data instead of
daily data, use the /HISTORY qualifier instead of the
/COLLECTION_DEFINITION qualifier. These two qualifiers are mutually
exclusive.
/DATES=filespec
Specifies that a file containing a series of date ranges is to be used in
place of the /BEGINNING and /ENDING qualifiers. Each line in the dates
file should look as follows:
dd-mmm-yyyy hh:mm:ss.cc,dd-mmm-yyyy hh:mm:ss.cc
The time can be either omitted entirely or truncated. Any truncated parts
of the time default to 0. The periods of time represented by each line in
the file need not be contiguous but they must be in ascending order.
/DATES is incompatible with the /BEGINNING and /ENDING qualifiers.
/ENDING=time
Specifies the ending date and time of the data to be exported. If you do
not specify /BEGINNING, the default ending time is the current time. If
you specify /BEGINNING, the default ending time is midnight (23:59) for
the same day.
/FILTER=keyword
The /FILTER qualifier allows you select a subset of the daily or history data
for exporting. Process data and disk data can be filtered.
Process data can be filtered by using any of the filter keywords:
USERNAMES, IMAGENAMES, PROCESSNAMES, ACCOUNTNAMES, UICS,
PIDS or WORKLOADNAMES. If a process record's identification information
matches any of the identification specifications that are specified, then that
record is selected.
Likewise, disk data can be filtered by using either of the filter keywords,
VOLUMENAMES and DEVICENAMES. If a device record's identification
information matches any of the volume names or device names that are
specified, then that record is selected.
184 Performance Manager Administrator Guide
ADVISE PERFORMANCE EXPORT
The following table lists the keywords:
Keyword
Description
/USERNAMES=(string,...)
Specify /FILTER=USERNAMES to export all
process records with the username matching
any of the specified strings.
/IMAGENAMES=(string,...)
Specify /FILTER=IMAGENAMES to export all
process records with the imagename
matching any of the specified strings. Do not
specify any trailing ".EXE", nor the file
version, device or directory.
/PROCESSNAMES=(string,...)
Specify /FILTER=PROCESSNAMES to export
all process records with the processname
matching any of the specified strings. The
match string is case sensitive, so if the
process names have any lowercase letters,
spaces or tabs, use double quotes when you
enter the value (e.g.,
/FILTER=PROCESSNAMES="--RTserver--" ).
/ACCOUNTNAMES=(string,...)
Specify /FILTER=ACCOUNTNAMES to export
all process records with the accountname
matching any of the specified strings.
/WORKLOADNAMES
=(workloadname,...)
Specify /FILTER=WORKLOADNAMES to
export all process records associated with
any of the specified workloads. This filter is
valid only if the /CLASSIFY_BY qualifier is
used to specify a classification scheme for
your workload data.
/UICS=(uic,...)
Specify /FILTER=UICS to export all process
records with the UIC matching any of the
specified UICs. An asterisk may be used to
wildcard either the group or user field of the
specified UICs.
/PIDS=(pid,...)
Specify /FILTER=PIDS to export all process
records with the PID matching any of the
specified PIDs.
/VOLUMENAMES=(string,...)
Specify /FILTER=VOLUMENAMES to export
all disk records with the volumename
matching any of the specified strings. Do not
specify any trailing colon.
Chapter 6: Performance Manager Commands 185
ADVISE PERFORMANCE EXPORT
Keyword
Description
/DEVICENAMES=(string,...)
Specify /FILTER=DEVICENAMES to export all
disk records with the devicename matching
any of the specified strings. Do not specify
any trailing colon.
/HISTORY=history-descriptor-name
Allows you to select history data from the Performance Manager database.
By default, daily .CPD files are processed. However, by specifying the
name of a history file descriptor you can select historical data instead.
You must have previously defined the descriptor-name in the parameters
file and have used the archiving facility to create the history files. Use the
DCL command ADVISE EDIT to start the parameters editor. From the
utility, you can ADD, DELETE, MODIFY, and SHOW history file descriptors.
If you want to use history data instead of daily data, use the /HISTORY
qualifier instead of the /COLLECTION_DEFINITION qualifier. These two
qualifiers are mutually exclusive.
/INTERVAL=seconds
Specifies the elapsed time to be summarized in an output record. Its
minimum value is that of the performance data file being exported. It
must be a multiple of the interval of the data file, and are rounded up to
match such a value.
The default value is the interval of the data file being exported.
The value is expressed in seconds.
/NODE_NAME=node-name
Identifies the node for which data is to be exported. /NODE_NAME is
required if your collection definition supports multiple nodes. Only one
node's data can be written out to an export file.
/OUTPUT[=file-spec]
Specifies the name of the export file. If you do not specify /OUTPUT, or if
you specify /OUTPUT without a file specification, a default filename of
PSPA$DUMP.DAT is used.
186 Performance Manager Administrator Guide
ADVISE PERFORMANCE EXPORT
/PROCESS_STATISTICS=([PRIMARY_KEY=option]
[,SECONDARY_KEY=option])
This qualifier allows you to specify how process records can be
summarized and sorted, and to indicate what output fields to preserve in
the output. By default, all details are preserved, and all fields are supplied.
The default settings are:
/PROCESS_STATISTICS=(PRIMARY_KEY=PID,
SECONDARY_KEY=IMAGENAME)
If you use /CLASSIFY_BY to attach workload information to the process
records, you affect the default PRIMARY_KEY, which then becomes
WORKLOAD_NAME. To obtain all detail fields (such as PID), including the
workload name, you must specify both the /CLASSIFY_BY qualifier, and
the /PROCESS_STATISTICS = (PRIMARY_KEY=PID,
SECONDARY_KEY=IMAGENAME) settings.
Primary key options are:
PRIMARY_KEY={MODE|USERNAME|IMAGENAME|
UIC_GROUP|PROCESS_NAME| WORKLOAD_NAME|ACCOUNT_NAME|PID}
Key option
Description
MODE
Group process statistics by the process mode
(Interactive, Batch, Network, or Detached).
USERNAME
Group process statistics by the process's User
name. (The fields UIC and ACCOUNT are also
enabled when this key is specified.)
IMAGENAME
Group process statistics by the process's Image
Name. (The field IMAGE_DIRECTORY is also
enabled when this key is used in combination with
PID.)
UIC_GROUP
Group process statistics by the process's UIC
Group.
PROCESS_NAME
Group process statistics by the process name.
WORKLOAD_NAME
Group process statistics by the workload name.
You must specify /CLASSIFY_BY to indicate the
workload family that you intend to use.
ACCOUNT_NAME
Group process statistics by the process's account
name.
Chapter 6: Performance Manager Commands 187
ADVISE PERFORMANCE EXPORT
Key option
Description
PID
Group process statistics by the process's EPID.
(The fields USERNAME, PROCESS_NAME, UIC,
MODE and ACCOUNT are also enabled when this
key is specified. If both PID and IMAGENAME are
used for the primary and secondary keys, the
WORKLOAD_NAME and IMAGE fields are also
enabled ( (i.e., all fields are enabled.)
Secondary key options are:
SECONDARY_KEY={MODE|USERNAME|IMAGENAME|
UIC_GROUP|PROCESS_NAME| WORKLOAD_NAME|ACCOUNT_NAME|PID}
Secondary key option
Description
MODE
Provide process records subgrouped by the process
mode (Interactive, Batch, Network, or Detached).
USERNAME
Provide process records subgrouped by the
process's User name. (The fields UIC and
ACCOUNT are also enabled when this key is
specified.)
IMAGENAME
Provide process records subgrouped by the
process's Image Name. (The field
IMAGE_DIRECTORY is also enabled when this key
is used in combination with PID.)
UIC_GROUP
Provide process records subgrouped by the
process's UIC Group.
PROCESS_NAME
Provide process records subgrouped by the process
name.
WORKLOAD_NAME
Provide process records subgrouped by the
workload name. You must specify /CLASSIFY_BY to
indicate the workload family that you intend to
use.
ACCOUNT_NAME
Provide process records subgrouped by the
process's account name.
PID
Provide process records subgrouped by the
process's EPID. (The fields USERNAME,
PROCESS_NAME, UIC, MODE and ACCOUNT are
also enabled when this key is specified. If both PID
and IMAGENAME are used for the primary and
secondary keys, the WORKLOAD_NAME and IMAGE
fields are also enabled, that is all fields are
enabled.)
188 Performance Manager Administrator Guide
ADVISE PERFORMANCE EXPORT
If the value for secondary key is the same as for the primary key, no
secondary level breakout occurs. This also happens if the primary key is
specified and no secondary key is given.
The following example demonstrates the use of this qualifier:
$ ADVISE PERFORMANCE EXPORT /CLASS=(NODEFAULT, PROCESS)/NODE=MYNODE - _$
/BEGIN=time/END=time _$ /PROCESS_STATISTICS=(PRIMARY_KEY=IMAGENAME,SECONDARY_KEY=PID) _$ /CLASSIFY_BY=USERGROUP=MODEL_TRANSACTIONS
This command produces an output file called PSPA$DUMP.DAT in the current
directory, in ASCII CSV format. The process data records contain all detail
fields, including the workload name with which it is associated, sorted by
imagename first, then PID within that. The /CLASSIFY_BY qualifier is needed
to specify the Family definition (and Workload definitions) that define the
workload groups.
/SCHEDULE=({day=(hour-range[,...]) | NOday}[,...])
Where day is one of the following words:
■
EVERYDAY
■
WEEKDAYS
■
WEEKENDS
■
MONDAY
■
TUESDAY
■
WEDNESDAY
■
THURSDAY
■
FRIDAY
■
SATURDAY
■
SUNDAY
The hour-range is in the form of m-n where m is an integer (hour) from 0
to 23 and n is an integer (hour) from 1 to 24 and larger than m.
Use the /SCHEDULE qualifier to select a sub-set of the performance data
for exporting. By default all data between the /BEGINNING time and the
/ENDING time is selected. Use the day keywords with hour ranges to
specify what data is to be included.
Negate any of the day keywords to omit data for a range of days. Do not
specify any hour ranges with negated keywords.
Chapter 6: Performance Manager Commands 189
ADVISE PERFORMANCE EXPORT
/TYPE={ASCII | BINARY}
There are two different data types available for the exported file, ASCII
and BINARY.
The default type is ASCII which provides data in CSV (comma separated
variable) format with text items in quotes. For examples commands and
the resulting output data, see Appendix E.
To use either format in subsequent processing of the data, two files have
been placed in the PSPA$EXAMPLES directory area,
PSPA$DUMP_ASCII.DTR and PSPA$DUMP_BINARY.DTR. To specify a
format, supply a value to the qualifier of “ASCII” or “BINARY.” The default
is “BINARY.”
Examples
$ ADVISE PERFORM EXPORT/TYPE=BINARY _$ /CLASS=(NODEFAULT,MEMORY)/NODE=MYNODE/BEGIN=9:00 _$ /END=10:00/OUTPUT=MYNODE_MEMORY.BIN
The previous command creates an export file containing memory statistics for
node MYNODE for an hour's worth of data.
$ADVISE PERFORM EXPORT/TYPE=BINARY _$ /CLASS=(NODEFAULT,MEMORY)/NODE=MYNODE/BEGIN=20-Jan-1997 _$ /END=21-Jan-1997/INTERVAL=1800/OUTPUT=MYNODE_MEMORY.20JAN
The previous command creates a file with a day's worth of data summarized
into 30 minute records.
$ DTR
DTR>DEFINE DICTIONARY CDD$TOP.DECPS_BIN;
DTR>SET DICTIONARY CDD$TOP.DECPS_ASC;
DTR>@PSPA$EXAMPLES:PSPA$DUMP_BINARY.DTR
DTR>DEFINE DOMAIN MEMORY_BIN USING BINARY_RECORD ON CON>MYNODE_MEMORY.20JAN;
DTR>READY MEMORY_BIN
DTR>FIND MEMORY_BIN WITH DATA_TYPE = "MEMO"
[48 records found]
DTR>LIST ALL HEADER AND MEMO
The previous command shows you how you can examine the binary data with
DATATRIEVE, interactively. The DATATRIEVE record definition is contained in
PSPA$EXAMPLE:PSPA$DUMP_BINARY.DTR and
PSPA$EXAMPLE:PSPA$DUMP_ASCII.DTR.
190 Performance Manager Administrator Guide
ADVISE PERFORMANCE GRAPH
ADVISE PERFORMANCE GRAPH
Use the ADVISE PERFORMANCE GRAPH command to chronologically graph any
group of metrics stored in the Performance Manager database.
Format
ADVISE PERFORMANCE GRAPH
Description
The Performance Manager can produce a multitude of predefined graphs. You
can also define your own custom graphs if the predefined graphs do not meet
your specific needs. You can generate multiple graphs with a single command.
The Performance Manager produces at least one graph, and can produce many
graphs depending on how you specify the /TYPE and /NODE qualifiers.
When producing many graphs, you are likely to benefit by using the command
mode interface invoked by the ADVISE PERFORMANCE command. Command
mode allows many graphs to be built in memory and selectively viewed or
written to a file. You can also direct the output to either the SYS$OUTPUT
device or an output device as specified by the /OUTPUT qualifier.
The Performance Manager generates the graphs using ReGIS format if the
SYS$OUTPUT device has the ReGIS capability, or if you specify
/FORMAT=ReGIS. Otherwise, the Performance Manager generates a less
resolute graph using standard ASCII characters.
Qualifiers
/AVERAGE={DAILY | WEEKLY | MONTHLY | QUARTERLY}
Causes graphs to depict a summarization of a specified time period. The
selected data is averaged into the time period selected. See Chapter 4 for
more information.
If you also use the /SCHEDULE or /DATES qualifiers, the DAILY and
WEEKLY graphs are trimmed to show only the selected hours.
If history data with the periodicity attribute is selected, the /AVERAGE
value is automatically set to that periodicity value. This is true regardless
of whether the /AVERAGE qualifier is used.
Chapter 6: Performance Manager Commands 191
ADVISE PERFORMANCE GRAPH
/BEGINNING=date
Specifies the beginning date and time of data selected for graphing.
Where date represents the date and time in standard DCL format.
The date and time format is the standard DCL format, either absolute or
relative. If you do not specify the /BEGINNING qualifier, the Performance
Manager uses 00:00:00 on the same day for which the ending date and
time is specified. If you do not specify an /ENDING qualifier, the
Performance Manager uses 00:00:00 of the current day as the default
beginning time.
You can also use the keywords TODAY and YESTERDAY. See HP's
OpenVMS User's Manual, or access the HELP topic SPECIFY DATE_TIME for
complete information on specifying time values.
/BEGINNING is incompatible with the /DATES qualifier.
/COLLECTION_DEFINITION=collection-definition-name
Specifies the name of the Collection Definition, and hence the collected
data that you desire to use for the graph. If you omit this qualifier, daily
data is obtained from the Collection Definition called “CPD.”
To view the Collection Definitions that you have available, use the DCL
command ADVISE COLLECT SHOW ALL.
If you want to use history data instead of daily data, use the /HISTORY
qualifier instead of the /COLLECTION_DEFINITION qualifier.
/COLLECTION_DEFINITION is incompatible with the /HISTORY qualifier.
/CLASSIFY_BY=USERGROUP=family_name
Specifies the workload family whose workload definitions are to be used
for summarizing process activity. This affects the TOP_WORKLOAD graph
types as well as custom graphs with WORKLOAD metrics by providing the
desired metrics on an individual workload basis. The default is “other”
which averages all process activity together. The family_type of
USERGROUP is required. No restrictions are made on the family name.
192 Performance Manager Administrator Guide
ADVISE PERFORMANCE GRAPH
/COMPOSITE
Combines data from all nodes into a single graph. Data from each node is
either added or averaged.
The following command produces a graph of the total number of processes
in the cluster.
$ ADVISE PERFORMANCE GRAPH/COMPOSITE/TYPE=PROCESSES
When the Performance Manager combines I/O data from more than one
node, it is possible to double count I/O operations to a disk device if it is
served. Therefore, when you specify /COMPOSITE, the Performance
Manager does not count all MSCP-served I/O for individual disks.
When generating a customized graph for a single metric with
/COMPOSITE, the Performance Manager graphs the metric by node.
When graphing CPU percentages with the /COMPOSITE qualifier each
node's CPU time is scaled according to the VUP rating to produce a cluster
average CPU utilization.
For more information, see the chapter Generate Historical Graphs (see
page 107).
/DATES=filespec
Specifies that a file containing a series of date ranges is to be used in
place of the /BEGINNING and /ENDING qualifiers. Each line in the dates
file should look like the following command:
dd-mmm-yyyy hh:mm:ss.cc,dd-mmm-yyyy hh:mm:ss.cc
The time can be either omitted entirely or truncated. Any truncated parts
of the time defaults to 0. The periods of time represented by each line in
the file need not be contiguous but they must be in ascending order.
/DATES is incompatible with the /BEGINNING and /ENDING qualifiers.
/ENDING=date
Specifies the ending date and time of the graph. Where date represents
the date and time in standard DCL format.
If you do not specify /BEGINNING, /ENDING defaults to the current time.
If you do specify /BEGINNING, the /ENDING default are midnight (23:59)
of the beginning date.
You can specify either an absolute time or a combination of absolute and
delta times. You can also use the keywords TODAY, TOMORROW, and
YESTERDAY. See HP's OpenVMS User's Manual, or access the HELP topic
SPECIFY DATE_TIME for complete information on specifying time values.
/ENDING is incompatible with the /DATES qualifier.
Chapter 6: Performance Manager Commands 193
ADVISE PERFORMANCE GRAPH
/FILTER=keyword
The /FILTER qualifier allows you select a subset of the daily or history data
for graphing. Process data and disk data can be filtered.
Hotfile data is also filtered. When you specify filtering by process, a hotfile
record is selected if accessed by the specified process. When you specify
filtering by disk device, a hotfile record is selected if located on the
specified device. For hotfile records matching both process and disk
device, specify filtering by both process and device.
Process data can be filtered by using any of the filter keywords:
USERNAMES, IMAGENAMES, PROCESSNAMES, ACCOUNTNAMES, UICS,
PIDS or WORKLOADNAMES. If a process record's identification information
matches any of the identification specifications that are specified, then that
record is selected.
Likewise, disk data can be filtered by using either of the filter keywords,
VOLUMENAMES and DEVICENAMES. If a device record's identification
information matches any of the volume names or device names that are
specified, then that record is selected.
The following table lists the /FILTER keyword options:
Keyword
Description
/USERNAMES=(string,...)
Specify /FILTER=USERNAMES to graph all
process records with the username matching
any of the specified strings.
/IMAGENAMES=(string,...)
Specify /FILTER=IMAGENAMES to graph all
process records with the imagename
matching any of the specified strings. Do not
specify any trailing ".EXE", nor the file
version, device or directory.
/PROCESSNAMES=(string,...)
Specify /FILTER=PROCESSNAMES to graph all
process records with the processname
matching any of the specified strings. The
match string is case sensitive, so if the
process names have any lowercase letters,
spaces or tabs, use double quotes when you
enter the value (e.g.,
/FILTER=PROCESSNAMES="--RTserver--" ).
/ACCOUNTNAMES=(string,...) Specify /FILTER=ACCOUNTNAMES to graph
all process records with the accountname
matching any of the specified strings.
194 Performance Manager Administrator Guide
ADVISE PERFORMANCE GRAPH
Keyword
Description
/WORKLOADNAMES
=(workloadname,...)
Specify /FILTER=WORKLOADNAMES to graph
all process records associated with any of the
specified workloads. This filter is valid only if
the /CLASSIFY_BY qualifier is used to specify
a classification scheme for your workload
data.
/UICS=(uic,...)
Specify /FILTER=UICS to graph all process
records with the UIC matching any of the
specified UICs. An asterisk may be used to
wildcard either the group or user field of the
specified UICs.
/PIDS=(pid,...)
Specify /FILTER=PIDS to graph all process
records with the PID matching any of the
specified PIDs.
/VOLUMENAMES=(string,...)
Specify /FILTER=VOLUMENAMES to graph all
disk records with the volumename matching
any of the specified strings. Do not specify
any trailing colon.
/DEVICENAMES=(string,...)
Specify /FILTER=DEVICENAMES to graph all
disk records with the devicename matching
any of the specified strings. Do not specify
any trailing colon.
/FORMAT={
ReGIS[=(CHARACTERISTIC={COLOR | LINE | PATTERN}
[,X_POINTS=l ])] |
ANSI=[(HEIGHT=m,WIDTH=n,LINE)] |
TABULAR[=X_POINTS=l] |
CSV[=X_POINTS=l]
POSTSCRIPT=(CHARACTERISTIC={COLOR,LINE,
PATTERN},X_POINTS=l)
Where:
l
Is in the range of 2 to 480, and a best-fit value is chosen by
default.
m
Is greater than or equal to 20 and less than or equal to 60.
n
Is greater than or equal to 40 and less than or equal to 132.
The Performance Manager graphs ReGIS or ANSI graph by default,
depending on the device characteristics of the SYS$OUTPUT device. ANSI
and ReGIS formats are not available with pie charts. You may override the
default with the /FORMAT qualifier. A graph is one of four formats: ANSI,
REGIS, TABULAR or PostScript.
Chapter 6: Performance Manager Commands 195
ADVISE PERFORMANCE GRAPH
Optionally, you may specify whether ReGIS graphs use LINE, PATTERN, or
COLOR. COLOR is the default. PATTERN is incompatible with COLOR.
Use the X_POINTS keyword to specify the number of data points to plot
across a ReGIS graph. The valid range for X_POINTS is 2 to 480. By
default, the Performance Manager chooses a best-fit value for x-points so
that the time period represented by each point is even.
As the value of X_POINTS increases, spikes and valleys become more
defined and the graph has a higher resolution. A low number of X_POINTS
produces a smoother graph because the graphing facility averages any
additional data points within the time frame requested. Consider the time
frame of a particular graph request when you determine the value of
X_POINTS.
For example, over a 12-hour span, the Performance Manager records
statistics 360 times (every 2 minutes). If the value of X_POINTS is 24, the
graphing facility averages every 15 data records (or 30 minutes) and
produces a graph with smooth flow. If the value of X_POINTS is 72, the
graphing facility averages every 5 data records (or 10 minutes) and
produces a graph with valleys and spikes.
Use the WIDTH keyword to specify the column width of the ANSI graph
output. Valid widths range from 40 to 132 columns. If you do not specify
the WIDTH qualifier, the Performance Manager uses the terminal width
setting. When you specify the /OUTPUT qualifier or generate the graph
under batch, the width of the graph is 132 columns.
Use the HEIGHT keyword to specify the graph height of the ANSI graph
output. Valid heights are from 20 to 60 lines. If you do not specify
HEIGHT, the Performance Manager uses the terminal page length setting.
When you use the /OUTPUT qualifier or generate the graph under batch,
the height of the graph is 40 lines.
/HISTORY=history_descriptor_name
Allows you to select history data from the Performance Manager database.
By default, daily data files are used to supply data for graphing. However,
by specifying the name of a history file descriptor, you can select historical
data instead.
You must define the history file descriptor in the parameters file and have
archived data according to the descriptor's definition. Use the DCL
command ADVISE EDIT to invoke the Performance Manager Parameter
Edit Utility. From the utility, you can ADD, DELETE, MODIFY, and SHOW
history file descriptors. Use the ADVISE ARCHIVE command to create the
archived files.
If history data with the periodicity attribute is selected, the /AVERAGE
value is automatically set to that periodicity value. This is true regardless
of whether the /AVERAGE qualifier is used.
196 Performance Manager Administrator Guide
ADVISE PERFORMANCE GRAPH
/HISTORY is incompatible with the /COLLECTION_DEFINITION qualifier.
For information on how to produce a graph of history data including a
typical time period, see the chapter Generate Historical Graphs (see
page 107).
Note: If model data was not archived, the /CLASSIFY_BY qualifier is
restricted to those workload families specified in the history file descriptor.
/NODE_NAMES=(node-name[,...])
Identifies the nodes to graph.
The Performance Manager creates a separate graph for each node unless
you specify the /COMPOSITE qualifier. If you omit the /NODE_NAMES
qualifier, all the nodes in the schedule file associated with the specified
collection definition (CPD by default) are used for the graph(s). If you
specify only one node, the parentheses can be omitted. Do not use
wildcard characters in the node-name specifications.
/OUTPUT=filespec
Creates an output file that contains the graphs. The default file extension
for a ReGIS graph is .REG, the file type for ANSI and TABULAR formatted
graphs is .RPT and the file extension for PostScript is .PS.
When you generate multiple graphs with a single command line, you can
create a unique output file for each graph. To do this, omit the file name
with the /OUTPUT qualifier. The Performance Manager generates a
separate file for each graph created and uses the graph type keyword as
the unique file name.
For example:
$ ADVISE PERFORMANCE GRAPH/NODE=SYSDEV/END=1/TYPE=(MEM,CPU_U,CPU_MODE)
/OUTPUT=.REG
%PSPA-I-CREAGRAPHOUT, PSPA Graph created file
MUMMS$DKA300:[CORREY]SYSDEV_CPU_UTILIZATION.REG;1
%PSPA-I-CREAGRAPHOUT, PSPA Graph created file
MUMMS$DKA300:[CORREY]SYSDEV_MEMORY_UTILIZATION.REG;1
%PSPA-I-CREAGRAPHOUT, PSPA Graph created file
MUMMS$DKA300:[CORREY]SYSDEV_CPU_MODES.REG;1
/RULES[=file-spec], /NORULES
Loads information from the rules file to establish user-defined hardware
scaling factors. The file-spec must point to an auxiliary knowledge base
which has previously been compiled with the ADVISE PERFORMANCE
COMPILE command. The default file type is .KB. If the NORULES qualifier
is specified no augmentation of the factory rules occur. See also the
Chapter "Customize the Knowledge Base (see page 135)."
Chapter 6: Performance Manager Commands 197
ADVISE PERFORMANCE GRAPH
/SCHEDULE=({day=(hour-range)[,...]|NOday}[,...])
Specifies that a subset of Performance Manager data is to be used (or not
used if keyword negation is specified) to generate graphs. By default, the
Performance Manager selects all data between the /BEGINNING time and
the /ENDING time, or as specified with the /DATES qualifier.
Where:
day
SUNDAY, MONDAY, TUESDAY, WEDNESDAY, THURSDAY,
FRIDAY, SATURDAY, EVERYDAY, WEEKDAYS or WEEKENDS.
hourrange
Specified as m-n, where m and n are numbers from 0 to 24,
and m is less than n. You can specify more than one hour
range for a given day. Hour-range is mutually exclusive with
the NO option.
If you omit a day keyword, the data for that day is selected. Data selection
for individual days of the week can be inhibited by negating the keyword
(for example, NOSUNDAY) or for all of the days of the week by specifying
the NOEVERYDAY keyword. The values [NO]WEEKDAYS and
[NO]WEEKENDS similarly can be used to enable or disable data selection
for weekdays and weekends.
You must specify an hour range for any non-negated day keyword. Do not
include an hour range if you are specifying a negated day keyword, such
as NOMONDAY.
Less inclusive keyword values override more inclusive values. For
example, MONDAY=10--12 overrides EVERYDAY=8--17 for Monday, but
the Performance Manager selects data from 8:00 a.m. to 5:00 p.m. for all
of the other days of the week.
For example:
$ ADVISE PERFORMANCE GRAPH _$ /SCHEDULE=(NOEVERYDAY,WEEKDAYS=(8-12,13-17))
Graphs do not depict the time periods deselected by the /SCHEDULE
qualifier.
/SELECT[={GREATER_THAN[:percent] | LESS_THAN[:percent]}],
/NOSELECT
Use /SELECT in conjunction with the optional threshold values which may
be specified on a per graph type basis.
198 Performance Manager Administrator Guide
ADVISE PERFORMANCE GRAPH
If this qualifier is present, before a graph is produced, a check is made to
see if the values to be graphed fall within the threshold values for the
indicated percentage of points. If so, then the graph (or pie chart) is
produced. If not, no graph is produced. For details on THRESHOLD, see
the /TYPE qualifier.
Keyword
Meaning
GREATER_THAN:percent
At least “percent” of the graph points plotted
must be greater than or equal to the threshold
value specified with the /TYPE qualifier.
LESS_THAN:percent
At least “percent” of the graph points plotted
must be less than or equal to the threshold
value specified with the /TYPE qualifier.
These keywords accept a single value representing the percentage of the
points plotted that must meet the threshold criteria before the graph is
produced. Each graph point value is determined by the sum (STACKED) of
the items depicted (up to 6). If the GREATER_THAN keyword is specified
without a value, then 50 percent is assumed. If the LESS_THAN keyword
is specified without a value, then 90 percent is assumed.
If the /SELECT qualifier is present without a keyword, then
GREATER_THAN:50 is assumed. For example:
$ ADVISE PERFORMANCE GRAPH /BEGINNING=10/ENDING=11/NODE=YQUEM _$ /TYPE=(CPU_U:THRESHOLD:25,CPU_M:THRESHOLD:35,TOP_CPU_I:THRESHOLD:45)_$ /SELECT=GREATER/OUTPUT=.REGIS
%PSPA-I-CREAGRAPHOUT, PSPA Graph created file
BADDOG:[CORREY.WORK.PSPA]YQUEM_CPU_UTILIZATION.REG;1
This command requests that three graphs be produced. The CPU Utilization
graph is produced, if 50 percent or more of the data points exceed 25
percent CPU utilization. The CPU_MODES graph is produced if 50 percent
or more of the data points exceed 35 percent CPU utilization. The
TOP_CPU_IMAGES graph is produced if 50 percent or more of the data
points exceed 45 percent CPU utilization. In this case only one graph is
produced.
$ ADVISE PERFORMANCE GRAPH /BEGINNING=10/ENDING=11/NODE=YQUEM _$ /TYPE=(CPU_U:THRESHOLD:25,CPU_M:THRESHOLD:35,TOP_CPU_I:THRESHOLD:15)_$ /SELECT=GREATER/OUTPUT=.REGIS
%PSPA-I-CREAGRAPHOUT, PSPA Graph created file
BADDOG:[CORREY.WORK.PSPA]YQUEM_CPU_UTILIZATION.REG;3
%PSPA-I-CREAGRAPHOUT, PSPA Graph created file
BADDOG:[CORREY.WORK.PSPA]YQUEM_TOP_CPU_IMAGES.REG;1
Chapter 6: Performance Manager Commands 199
ADVISE PERFORMANCE GRAPH
This command produced two of three graphs because threshold quantity
for the last graph was lowered.
$ ADVISE PERFORMANCE GRAPH /BEGINNING=10/ENDING=11/NODE=YQUEM _$ /TYPE=(CPU_U:THRESHOLD:25,CPU_M:THRESHOLD:35,TOP_CPU_I:THRESHOLD:15) _$ /SELECT=GREATER:90/OUTPUT=.REGIS
$
The previous command generated none of the graphs because in all cases
90 percent of the graph points did not exceed the specified thresholds.
/STACK, /NOSTACK
Stacks the values for each category on the graph. Use /NOSTACK to
overlay the values on the graph. ReGIS graphs using /NOSTACK may
cause some occlusion if you do not specify
/FORMAT=ReGIS=CHARACTERISTICS=LINE also. If you are requesting a
series of graphs in one command, you can override the /[NO]STACK
qualifier by specifying the [NO]STACK keyword following each graph type.
See Chapter 4 for an illustration of the use of the /NOSTACK qualifier and
for additional information about default behavior.
/TYPE=
([NO]graph_type[=([NO]STACK,Y_AXIS_MAXIMUM=n,
TITLE=string)],...,
ALL_GRAPHS[=([NO]STACK,THRESHOLD=m,
Y_AXIS_MAXIMUM=n)],
CUSTOM=(see below “TYPE=CUSTOM”))
Specifies which of the graphs you want generated.
Use the TITLE keyword to override the Performance Manager supplied title.
The text string may be a maximum of 40 characters.
The STACK keyword for a particular graph type overrides the setting
established by the /STACK qualifier.
The THRESHOLD keyword specifies a threshold value associated with the
graph. The m specifier is a positive decimal value. A horizontal line is
placed on the graph at the position on the Y-axis associated with the
value. You can use THRESHOLD in conjunction with the /SELECT qualifier
to prevent the generation of the graph or pie chart.
The Y_AXIS_MAXIMUM specifies a fixed y-axis to be used for the graph.
The default behavior is to setup the y-axis so that the maximum data point
appears near the top of the graph. This graph modifier allows you to
specify the y-axis so that you can compare data from different graphs
without having different scales on the y-axis. The n specifier is a positive
decimal value.
200 Performance Manager Administrator Guide
ADVISE PERFORMANCE GRAPH
You can specify multiple graphs in a single command. For example, you
can specify /TYPE=(TOP_IO_DISKS,TOP_HARDFAULTING_IMAGES). Of
course, /TYPE=ALL_GRAPHS generate all of the predefined graphs. To
suppress a graph type, specify NO graph_type.
CPU_UTILIZATION is the default graph type.
The following list contains all of the available Performance Manager
graphs:
[NO]ALL_GRAPHS
[NO]COMPUTE_QUEUE
[NO]CPU_MODES
[NO]CPU_UTILIZATION
CUSTOM
[NO]DECNET
[NO]DISKS
[NO]FAULTS
[NO]FILECACHE
[NO]JOBS
[NO]LOCKS
[NO]MEMORY_UTILIZATION
[NO]PROCESSES
[NO]RESPONSE_TIME
[NO]TERMINALS
[NO]TOP_BDT_W
[NO]TOP_BLKS_R
[NO]TOP_BLKS_S
[NO]TOP_BUFIO_IMAGES
[NO]TOP_BUFIO_USERS
[NO]TOP_BUFIO_WORKLOADS
[NO]TOP_BUSY_DISKS
[NO]TOP_BUSY_PROCESSOR
[NO]TOP_BUSY_VOLUMES
[NO]TOP_CHANNEL_IO
[NO]TOP_CHANNEL_QUELEN
[NO]TOP_CHANNEL_THRUPUT
[NO]TOP_CLUSTER_RULE_OCC
[NO]TOP_COMPAT_PROCESSOR
[NO]TOP_CPU_IMAGES
[NO]TOP_CPU_RULE_OCC
[NO]TOP_CPU_USERS
[NO]TOP_CPU_WORKLOADS
[NO]TOP_CR_W
[NO]TOP_DGS_D
[NO]TOP_DGS_R
[NO]TOP_DGS_S
[NO]TOP_DIRIO_IMAGES
[NO]TOP_DIRIO_USERS
[NO]TOP_DIRIO_WORKLOADS
[NO]TOP_DISKIO_IMAGES
[NO]TOP_DISKIO_USERS
[NO]TOP_DISKIO_WORKLOADS
[NO]TOP_EXEC_PROCESSOR
[NO]TOP_FAULTING_IMAGES
[NO]TOP_FAULTING_USERS
[NO]TOP_FAULTING_WORKLOADS
[NO]TOP_FREEBLK_DISKS
[NO]TOP_FREEBLK_VOLUMES
[NO]TOP_HARDFAULTING_IMAGE
S
Chapter 6: Performance Manager Commands 201
ADVISE PERFORMANCE GRAPH
[NO]TOP_HARDFAULTING_USERS
[NO]TOP_HARDFAULTING_WORKL
OADS
[NO]TOP_HSC_DISK_IO
[NO]TOP_HSC_DISK_THRUPUT
[NO]TOP_HSC_IO
[NO]TOP_HSC_TAPE_IO
[NO]TOP_HSC_TAPE_THRUPUT
[NO]TOP_HSC_THRUPUT
[NO]TOP_IDLE_PROCESSOR
[NO]TOP_IMAGE_ACTIVATIONS
[NO]TOP_IMAGE_VOLUME_IO
[NO]TOP_INTERRUPT_PROCESSO
R
[NO]TOP_IOSIZE_DISKS
[NO]TOP_IOSIZE_VOLUMES
[NO]TOP_IOSIZE_IMAGES
[NO]TOP_IOSIZE_USERS
[NO]TOP_IOSIZE_WORKLOADS
[NO]TOP_IO_DISKS
[NO]TOP_IO_FILES
[NO]TOP_IO_RULE_OCC
[NO]TOP_IO_VOLUMES
[NO]TOP_KB_MAP
[NO]TOP_KB_RC
[NO]TOP_KB_S
[NO]TOP_KERNEL_PROCESSOR
[NO]TOP_MEMORY_RULE_OCC
[NO]TOP_MGS_R
[NO]TOP_MGS_S
[NO]TOP_MP_SYNCH_PROCESSOR
[NO]TOP_MSCPIO_FILES
[NO]TOP_PAGING_DISKS
[NO]TOP_PAGING_FILES
[NO]TOP_PAGING_VOLUMES
[NO]TOP_POOL_RULE_OCC
[NO]TOP_PRCT_FREE_DISKS
[NO]TOP_PRCT_FREE_VOLUMES
[NO]TOP_PRCT_USED_DISKS
[NO]TOP_PRCT_USED_VOLUMES
[NO]TOP_QUEUE_DISKS
[NO]TOP_QUEUE_VOLUMES
[NO]TOP_READ_DISKS
[NO]TOP_READ_FILES
[NO]TOP_READ_VOLUMES
[NO]TOP_RESIDENT_IMAGES
[NO]TOP_RESIDENT_USERS
[NO]TOP_RESIDENT_WORKLOAD
S
[NO]TOP_RESOURCE_RULE_OCC
[NO]TOP_RESPONSE_TIME_DISK
S
[NO]TOP_RESPONSE_TIME_FILES
[NO]TOP_RESPONSE_TIME_IMAG
ES
[NO]TOP_RESPONSE_TIME_USERS
[NO]TOP_RESPONSE_TIME_VOLU
MES
[NO]TOP_RESPONSE_TIME_WORKLOADS [NO]TOP_RULE_OCCURRENCES
[NO]TOP_SPLITIO_DISKS
[NO]TOP_SPLITIO_FILES
[NO]TOP_SPLITIO_VOLUMES
[NO]TOP_SUPER_PROCESSOR
202 Performance Manager Administrator Guide
ADVISE PERFORMANCE GRAPH
[NO]TOP_TERMINAL_INPUT_IMAGES
[NO]TOP_TERMINAL_INPUT_USER
S
[NO]TOP_TERMINAL_INPUT_WORKLOAD
S
[NO]TOP_TERMINAL_THRUPUT_
IMAGES
[NO]TOP_TERMINAL_THRUPUT_USERS
[NO]TOP_TERMINAL_THRUPUT_
WORKLOADS
[NO]TOP_THRUPUT_DISKS
[NO]TOP_THRUPUT_FILES
[NO]TOP_THRUPUT_IMAGES
[NO]TOP_THRUPUT_USERS
[NO]TOP_THRUPUT_VOLUMES
[NO]TOP_THRUPUT_WORKLOADS
[NO]TOP_USER_IMAGE_ACTIVATIONS
[NO]TOP_USER_PROCESSOR
[NO]TOP_USER_VOLUME_IO
[NO]TOP_VA_IMAGES
[NO]TOP_VA_USERS
[NO]TOP_VA_WORKLOADS
[NO]TOP_WORKLOAD_IMAGE_ACTIVATI
ONS
[NO]TOP_WRITE_DISKS
[NO]TOP_WRITE_FILES
[NO]TOP_WRITE_VOLUMES
[NO]TOP_WSSIZE_IMAGES
[NO]TOP_WSSIZE_USERS
[NO]TOP_WSSIZE_WORKLOADS
The following sections list the graph types and their descriptions. Included are
keywords used with the /TYPE qualifier.
■
/TYPE=CUSTOM
You must specify the items for the Performance Manager to graph. The
metrics and selection objects are described below.
ADVISE PERFORMANCE
GRAPH/TYPE=CUSTOM=({SYSTEM_METRICS=(system_metrics) |
USER_METRICS=(process_metrics),SELECTION=(usernames) |
IMAGE_METRICS=(process_metrics),SELECTION=(imagenames) |
WORKLOAD_METRICS=(process_metrics),SELECTION=(workloadnames)|
DEVICE_METRICS=(disk_metrics),SELECTION=(devicenames) |
VOLUME_METRICS=(disk_metrics),SELECTION=(volumenames) |
CPU_METRICS=(cpu_modes),SELECTION=(Phy-cpu-ids) |
HSC_METRICS=(hsc_metrics),SELECTION=(HSC-nodenames) |
SCS_METRICS=(scs_metrics),SELECTION=(SCS-nodenames) |
RULE_METRICS=(rule_metrics),SELECTION=(Rule-ids) |
CHANNEL_METRICS=(channel_metrics),SELECTION=(channel-specs) |
FILE_METRICS=(file_metrics),SELECTION=(file-names) |
DISK_USER_METRICS=(disk_user_metrics),SELECTION=(username-volumename) |
DISK_IMAGE_METRICS=(disk_image_metrics),SELECTION=(imagename-volumename)}
[,[NO]STACK] [,Y_AXIS_MAXIMUM=n] [,THRESHOLD=m] [,TITLE=string])
Chapter 6: Performance Manager Commands 203
ADVISE PERFORMANCE GRAPH
Where:
metric_class
The metrics are grouped together by metric class and
described in the next table.
Selection_string
Specify up to six strings, or only one if you specify
multiple metrics. The strings are used to match against
Performance Manager records to select data for the
CUSTOM graph. If you specify /TYPE= CUSTOM=
(USER_METRICS= CPUTIME,SELECTION= WILK) the
Performance Manager selects and graph all process
records which have the username field “WILK.”
The CUSTOM graph type allows you to graph a selection of metrics for
either the system, or selected users, images, workloads, disk devices,
volumes, HSCs, SCS nodes, rule-ids or channels. You may graph up to six
selections with a single metric, or up to six metrics with a single selection.
The Performance Manager either prompts you in command mode for the
data (ADVISE PERFORMANCE) or you can specify the desired metrics and
selections in a single DCL command.
For example:
$ ADVISE PERFORMANCE GRAPH/TYPE = CUSTOM = SYSTEM_METRICS = _$ (DZROFAULTS,GVALID)
The SELECTION string must be chosen based on the metric class that you
use:
–
If the metric class is USER_METRICS then the selection strings are
interpreted as user names.
–
If the metric class is IMAGE_METRICS then the selection strings are
interpreted as image names.
–
If the metric class is WORKLOAD_METRICS then the selection strings
are interpreted as workload names. (Unless you use the /CLASSIFY_BY
qualifier to characterize the process data into various workloads, all
workload data is grouped into the default workload called “OTHER.”)
–
If the metric class is DEVICE_METRICS then the selection strings are
interpreted as device names.
–
If the metric class is VOLUME_METRICS then the selection strings are
interpreted as volume names.
204 Performance Manager Administrator Guide
ADVISE PERFORMANCE GRAPH
–
If the metric class is CPU_METRICS then the selection strings are
interpreted as physical processor IDs which are in the form
NODENAME_INTEGER, such as, NODE1_3.
To display a graph which shows active CPUs in an OpenVMS
multiprocessing system, enter a command similar to the following:
$ ADVISE PERFORMANCE GRAPH/END=0:10/NODE=YQUEM _$ /TYPE=TOP_BUSY_PROCESSOR
Specifying a physical CPU ID allows you to isolate and analyze one CPU
of a selected node in an SMP configuration.
–
If the metric class is HSC_METRICS then the selection strings are
interpreted as HSC node names.
–
If the metric class is SCS_METRICS then the selection strings are
interpreted as cluster node names.
–
If the metric class is FILE_METRICS then the selection strings are
interpreted as file names.
–
If the metric class is RULE_METRICS then the selection strings are
interpreted as rule IDs.
Note: Rule Metrics are available only from history files.
–
If the metric class is DISK_USER_METRICS, then the selection strings
are interpreted as username-volumename.
–
If the metric class is DISK_IMAGE_METRICS, then the selection strings
are interpreted as imagename-volumename.
–
If the metric class is CHANNEL_METRICS then the selection strings are
interpreted as a channel-spec which is the HSC nodename, an
underscore, and the HSC's channel number (for example, HSC001_6).
The following tables identify the custom graphing metrics grouped by metric
class.
Channel
Description
CHANNEL_IO
Number of I/O operations transferred
by the HSC K.SDI channel
CHANNEL_QUELEN
Number of I/O operations outstanding
to all disks on the HSC K.SDI channel
CHANNEL_THRUPUT
Number of bytes per second
transferred by the HSC K.SDI channel
CPU
Description
P_BUSY
Percentage of time that the physical
CPU was busy
Chapter 6: Performance Manager Commands 205
ADVISE PERFORMANCE GRAPH
Channel
Description
P_COMPAT
Percentage of time that the physical
CPU was in compatibility mode
P_EXEC
Percentage of time that the physical
CPU was in exec mode
P_IDLE
Percentage of time that the physical
CPU was idle
P_INTERRUPT
Percentage of time that the physical
CPU was in interrupt stack mode
P_KERNEL
Percentage of time that the physical
CPU was in kernel mode
P_MP_SYNCH
Percentage of time that the physical
CPU was in MP_synch mode
P_SUPER
Percentage of time that the physical
CPU was in supervisor mode
P_USER
Percentage of time that the physical
CPU was in USER mode
Disk
Description
BUSY
Percent of time that there was one or
more outstanding I/O operation to
the disk
D_IO_SIZE
Number of 512 byte pages per I/O
request
D_RESPONSE_TIME
Average number of milliseconds to
process an I/O operation (Note that
this is zero if there are no I/O
operations)
SPLITIO
Number of split I/O operations per
second to the disk
FREEBLKS
Number of free blocks on the disk
MSCPIO
Number of MSCP I/O operations per
second
PAGIO
Number of paging and swapping I/O
operations per second
PRCT_FREE
Percentage of free disk space for a
given disk
PRCT_USED
Percentage of used disk space for a
given disk
206 Performance Manager Administrator Guide
ADVISE PERFORMANCE GRAPH
Channel
Description
QUEUE
Average number of I/O operations
outstanding
READIO
Number of read I/O operations per
second
THRUPUT
Number of Kbytes per second
transferred to or from the disk
TOTIO
Number of I/O operations per second
WRITIO
Number of write I/O operations per
second
Disk User
Description
USER_VOLUME_IO
Number of I/Os per second for the
user's use of the disk volume. This is
based on the collected top two disks'
I/O rates per process.
HSC
Description
HSC_DISK_IO
Number of disk I/O operations
performed by the HSC
HSC_DISK_THRUPUT
Number of bytes per second
transferred to and from disks on the
HSC
HSC_IO
Number of I/O operations transferred
by the HSC
HSC_TAPE_IO
Number of tape I/O operations
performed by the HSC
HSC_TAPE_THRUPUT
Number of bytes per second
transferred to and from tapes on the
HSC
HSC_THRUPUT
Number of bytes per second
transferred by the HSC
File Metric
Description
FILE_TOTIO
Number of I/O's per second to this
file.
FILE_PAGIO
Number of paging I/Os per second to
this file.
FILE_READIO
Number of read I/O's per second to
this file.
Chapter 6: Performance Manager Commands 207
ADVISE PERFORMANCE GRAPH
Channel
Description
FILE_WRITIO
Number of write I/O's per second to
this file.
FILE_THRUPUT
Number of bytes per second
transferred to or from this file.
FILE_RESPONSE_TIME
Average number of milliseconds
elapsed between the start of the IO
(SIO) and its completion (EIO), for all
of the I/Os to the file.
FILE_SPLITIO
Number of split I/O's per second to
this file.
Process
Description
BUFIO
Number of process buffered I/O
operations per second
CPUTIME
Percent of total CPU time that the
process(es) consumed
DIRIO
Number of process direct I/O
operations per second
DSKIO
Number of process disk I/O
operations per second
DSKTP
Number of process bytes per second
transferred to and from disks
FAULTS
Number of process hard and soft
page faults per second
HARDFAULTS
Number of process page fault I/O
operations per second
IMAGE_ACTIVATIONS
Number of process image activations
per second
IO_SIZE
Average number of pages per process
disk I/O
RESIDENCE
Number of resident processes with
either the specified user name or
image name
RESPONSE_TIME
Average number of seconds between
the end-transaction for a terminal
read, and the start-transaction for the
next terminal read, or an image
termination.
208 Performance Manager Administrator Guide
ADVISE PERFORMANCE GRAPH
Channel
Description
TAPIO
Number of process tape I/O
operations per second.
TAPTP
Number of process bytes per second
transferred to and from tapes.
TERM_INPUT
Number of process terminal read
operations per second.
TERM_THRUPUT
Number of process bytes per second
transferred via terminal reads.
VASIZE
Number of pages in the virtual
address space for a given process
WSSIZE
Number of working set pages (X
1000) per process
Rule
Description (Rule Metrics
available from history data only)
CLUSTER_OCCURRENCES
Number of rules prefixed with the
letter “L” that fired per hour. (Does
not include any rules in Domain
Cluster)
CPU_OCCURRENCES
Number of rules prefixed with the
letter “C” that fired per hour
IO_OCCURRENCES
Number of rules prefixed with the
letter “I” that fired per hour
MEMORY_OCCURRENCES
Number of rules prefixed with the
letter “M” that fired per hour
OCCURRENCES
Number of rules that fired per hour
(including user written rules)
POOL_OCCURRENCES
Number of rules in the set: R0020,
R0025, R0030, R0035, R0040,
R0045, R0050, R0060, R0070, R0080
that fired per hour
RESOURCE_OCCURRENCES
Number of rules prefixed with an “R”
but not in the above set that fired per
hour
SCS
Description
BDT_W
Number of times per second that
message had to wait for buffers
BLKS_R
Block request rate
Chapter 6: Performance Manager Commands 209
ADVISE PERFORMANCE GRAPH
Channel
Description
BLKS_S
Block send rate
CR_W
Number of times per second that
messages had to wait due to
insufficient credits
DGS_D
Datagrams discarded rate
DGS_R
Datagram receive rate
DGS_S
Datagram send rate
KB_MAP
Kbytes transferred rate
KB_RC
Kbytes received rate
KB_S
Kbytes sent rate
MGS_R
Message receive rate
MGS_S
Message send rate
System
Description
ARRLOCPK
Arriving local packets per second
ARRTRAPK
Transit packets per second
BATCH_COMQ
Number of computable batch
processes
BATCH_PROCESSES
Number of Batch processes
BUFIO
Buffered I/O per second
CEF
Average number of processes in
common event flag wait state
COLPG
Average number of processes in
collided page wait state
COM
Average number of processes in
computable state
COMO
Average number of processes in
computable outswapped state
COMPAT
Percent CPU time spent in
compatibility mode
CPU_BATCH
Percent CPU time used by batch jobs
CPU_DETACHED
Percent CPU time used by detached
jobs
CPU_INTERACTIVE
Percent CPU time used by interactive
jobs
210 Performance Manager Administrator Guide
ADVISE PERFORMANCE GRAPH
Channel
Description
CPU_NETWORK
Percent CPU time used by network
jobs
CPU_OTHER
Percent CPU time for which the
Performance Manager did not capture
process data
CPU_TOTAL
Percent CPU time not in idle mode
CPU_VUP_RATING
The VUP rating of the CPU
SWPBUSY
Percentage of CPU SWAPPER busy
IOBUSY
Percentage of CPU Multi I/O busy
ANYIOBUSY
Percentage of CPU Any I/O busy
PAGEWAIT
Percentage of CPU idle: page wait
SWAPWAIT
Percentage of CPU idle: swap wait
MMGWAIT
Percentage of CPU idle: page or swap
wait
SYSIDLE
percentage of CPU and I/O idle
CPUONLY
Percentage of CPU only busy
IOONLY
Percentage of I/O only busy
CPUIO
Percentage of CPU and I/O busy
CUR
Average number of processes in
currently executing process state
DEADLOCK_FIND
Number of deadlocks found by
OpenVMS per second
DEADLOCK_SEARCH
Number of deadlock searches per
second
DEPLOCPK
Departing local packets per second
DETACHED_COMQ
Number of computable detached
processes
DETACHED_PROCESSES
Number of detached processes
DIRIO
Direct I/O per second
DISK_PAGING
Number of paging I/O operations per
second
DISK_SWAPPING
Number of swapping I/O operations
per second
Chapter 6: Performance Manager Commands 211
ADVISE PERFORMANCE GRAPH
Channel
Description
DISK_USER
Number of user I/O disk operations
per second
DZROFAULTS
Number of demand-zero page faults
per second
ERASE_QIO
Number of Erase QIO operations per
second
EXEC
Percent CPU time charged to
executive mode
FILE_OPEN
Number of files opened per second
FILE_SYS
Percent CPU time spent in the file
system
System
Description
FPG
Average number of processes in free
page wait state
FREECNT
Free list page count
FREEFAULTS
Number of free list page faults per
second
FREELIM
Percent of physical memory allocated
to the free list by the SYSGEN
parameter FREELIM
FREELIST
Percent of physical memory on the
FREELIST, excluding the number of
pages for FREELIM
GVALID
Global page faults per second
HIB
Average number of processes in
hibernate wait state
HIBO
Average number of processes in
hibernate outswapped wait state
IDLE
Percent CPU time that is idle time
IMAGE_ACTIVATIONS
Number of image activations per
second
INCOMING_LOCKING
Number of incoming ENQs or Lock
Conversion (CVTs) from remote
nodes per second
INPROCACT
Number of active inswapped
processes
212 Performance Manager Administrator Guide
ADVISE PERFORMANCE GRAPH
Channel
Description
INPROCINACT
Number of inactive inswapped
processes
ISWPCNT
Inswaps per second
INTERACTIVE_PROCESSES
Number of interactive processes
INTERRUPT
Percent CPU time spent on the
interrupt stack
INT_COMQ
Number of computable interactive
processes
IRP_CNT
Count of the IRPs in use
IRP_MAX
Length of the IRP list
KERNEL
Percent CPU time charged to kernel
mode time
LAT_TERMIO
Number of LAT terminal I/O
operations per second
LEF
Average number of processes in local
event flag wait state
LEFO
Average number of processes in local
event flag outswapped wait state
LG_RESPONSE
Average process terminal response
time for interactions requiring greater
than 1.0 CPU seconds
LOCAL_LOCKING
Number of local node ENQs or Lock
Conversion (CVTs) per second
LOCK_CNT
Count of lock IDs in use
LOGNAM
Number of logical name translations
per second
LRP_CNT
Count of the LRPs in use
LRP_MAX
Length of the LRP list
MBREADS
Mailbox reads per second
MBWRITES
Mailbox writes per second
MED_RESPONSE
Average process terminal response
time for interactions requiring greater
than or equal to 0.1 CPU seconds,
and less than 1.0 CPU seconds
Chapter 6: Performance Manager Commands 213
ADVISE PERFORMANCE GRAPH
Channel
Description
MEM_TOTAL
Percent of physical memory in use,
excluding pages on the free and
modified list
MFYCNT
Modified list page count
MFYFAULTS
Number of modified list pagefaults
per second
MODIFIED
Percent of physical memory on the
modified list
MP_SYNCH
CPU time charged while waiting for a
resource protected by a spin lock to
be freed
MWAIT
Average number of processes in
miscellaneous wait state
NETWORK_COMQ
Number of computable network
processes
NETWORK_PROCESSES
Number of network processes
NP_FREE_BLOCKS
Count of non-paged blocks
NP_FREE_BYTES
Number of free Kbytes in non-paged
pool
NP_FREE_LEQ_32
Number of free non-paged pool blocks
less than or equal to 32 bytes in size
NP_MAX_BLOCK
Size, in Kbytes, of largest free nonpaged pool block
NP_MIN_BLOCK
Size, in bytes, of smallest free nonpaged pool block
NP_POOL_MAX
Size, in Kbytes, of non-paged pool
NV_TERMIO
Number of NV terminal I/O operations
per second
OTHERBUFIO
Number of buffered I/O operations
less any terminal I/O operations per
second
OUTGOING_LOCKING
Number of outgoing ENQs or Lock
Conversion (CVTs) to remote nodes
per second
OUTPROCACT
Number of active outswapped
processes (COMO)
214 Performance Manager Administrator Guide
ADVISE PERFORMANCE GRAPH
Channel
Description
OUTPROCINACT
Number of inactive outswapped
processes
PAGEFILE_UTILIZATION
Percent of pagefile pages in use or
occupied
PFW
Average number of processes in page
fault wait state
PG_FREE_BLOCKS
Count of paged blocks
PG_FREE_BYTES
Number of free Kbytes in paged pool
PG_FREE_LEQ_32
Number of free paged pool blocks less
than or equal to 32 bytes in size
PG_MAX_BLOCK
Size, in Kbytes, of largest free paged
pool block
PG_MIN_BLOCK
Size, in bytes, of smallest free paged
pool block
PG_POOL_MAX
Size, in Kbytes, of paged pool
PREADIO
Read operations per second from a
disk due to a page fault
PREADS
Pages read per second from a disk
due to a page fault
PWRITES
Pages written per second to paging
files
PWRITEIO
Write operations per second to paging
files
RCVBUFFL
Receiver buffer failures per second
RELATIVE_CPU_POWER
This node's VUP rating as a
percentage of the composite of
selected nodes
RESOURCE_CNT
Count of resources in use
RT_TERMIO
Number of remote (RT) terminal I/O
operations per second
SM_RESPONSE
Average process terminal response
time for interactions requiring less
than 0.1 CPU seconds
SPLITIO
Number of split I/O transfers per
second
SRP_CNT
Count of SRPs in use
Chapter 6: Performance Manager Commands 215
ADVISE PERFORMANCE GRAPH
Channel
Description
SRP_MAX
Length of the SRP list
SUPER
Percent CPU time charged to
supervisor mode
SUSP
Average number of processes in
suspend wait state
SUSPO
Average number of processes in
suspend outswapped wait state
SYSFAULTS
System page faults per second
SYSTEMWS
Percent of physical memory used by
processes with the user name of
SYSTEM
TOTAL_PROCESSES
Total number of processes
TRCNGLOS
Transit congestion losses per second
TT_TERMIO
Number of TT terminal I/O operations
per second
TW_TERMIO
Number of DECterm I/O operations
per second
TX_TERMIO
Number of TX terminal I/O operations
per second
USERWS
Percent of physical memory used by
process working sets
USER_MODE
Percent CPU time spent in user mode
VMSALLOC
Percent of physical memory allocated
to OpenVMS (including pool)
WINDOW_TURN
Number of file window turns per
second
WRTINPROG
Transition page faults per second
WT_TERMIO
Number of UIS terminal operations
per second
216 Performance Manager Administrator Guide
ADVISE PERFORMANCE GRAPH
/TYPE=COMPUTE_QUEUE (Number of Processes in COM and COMO)
Plots the number of computable processes categorized by:
–
Network processes (NETWORK_COMQ)
–
Interactive processes (INT_COMQ)
–
Batch processes (BATCH_COMQ)
–
Detached processes (DETACHED_COMQ)
/TYPE=CPU_MODES (CPU Modes)
Plots the percentage of CPU time spent in the various processor modes:
–
Multiprocessor synchronization (MP_SYNCH)
–
User (USER_MODE)
–
Supervisor (SUPER)
–
Executive (EXEC)
–
Kernel (KERNEL)
–
Interrupt Stack (INTERRUPT)
/TYPE=CPU_UTILIZATION (CPU Utilization)
Plots 6 metrics for percent CPU utilization:
–
Interrupt stack and MP Synch (CPU_MP_INT)
–
Detached processes (CPU_DETACHED)
–
Interactive processes (CPU_INTERACTIVE)
–
Batch processes (CPU_BATCH)
–
Network processes (CPU_NETWORK)
–
Other (CPU_OTHER)
This is the default graph type.
/TYPE=DECNET (System-Wide DECnet Traffic)
Plots the number of DECnet operations per second in terms of:
–
Arriving packets (ARRLOCPK)
–
Departing packets (DEPLOCPK)
–
Transit packets (ARRTRAPK)
/TYPE=DISKS (DISK I/O)
Plots the disk operations per second categorized by:
–
User (DISK_USER)
–
Paging (DISK_SWAPPING)
–
Swapping (DISK_PAGING)
Chapter 6: Performance Manager Commands 217
ADVISE PERFORMANCE GRAPH
/TYPE=FAULTS (Page Fault Rate)
Plots the page fault rate per second, and places the rate into these
categories:
–
Demand zero page faults (DZROFAULTS)
–
Free page faults (FREEFAULTS)
–
Modified page faults (MFYFAULTS)
–
Global page faults (GVALID)
–
Hard page faults (PREADIO)
–
System page faults (SYSFAULTS)
/TYPE=FILECACHE (File Cache Usage)
Plots the file operation attempt rate to the file system caches categorized
by:
–
Hits (FILE_CACHE_HIT)
–
Misses (FILE_CACHE_MISS)
/TYPE=JOBS (Number of Jobs)
Plots the number of processes categorized by:
–
Interactive (INTERACTIVE_PROCESSES)
–
Batch (BATCH_PROCESSES)
–
Network (NETWORK_PROCESSES)
–
Detached (DETACHED_PROCESSES)
/TYPE=LOCKS (Distributed Locking)
Plots the number of distributed lock operations per second categorized by:
–
Incoming enqueues and converts (INCOMING_LOCKING)
–
Outgoing enqueues and converts (OUTGOING_LOCKING)
–
Local enqueues and converts (LOCAL_LOCKING)
/TYPE=MEMORY_UTILIZATION (Memory Utilization)
Plots physical memory usage categorized by:
–
Percentage allocated to the free list (FREELIM)
–
Percentage in the modified page list (MODIFIED)
–
Percentage allocated to user processes (USERWS)
–
Percentage allocated to system processes (SYSTEMWS)
–
Percentage allocated to OpenVMS (VMSALLOC)
218 Performance Manager Administrator Guide
ADVISE PERFORMANCE GRAPH
/TYPE=PROCESSES (Number of Processes by State)
Plots the number of processes categorized as:
–
Inswapped/active (INPROCACT)
–
Inswapped/inactive (INPROCINACT)
–
Outswapped/inactive (OUTPROCINACT)
–
Outswapped/active (OUTPROCACT)
/TYPE=RESPONSE_TIME (Terminal Response Time)
Plots the terminal response time for interactive processes categorized as:
–
Large transactions (LG_RESPONSE)
–
Medium transactions (MED_RESPONSE)
–
Small transactions (SM_RESPONSE)
/TYPE=TERMINALS (Terminal I/O)
Plots the number of terminal operations per second categorized by the
type of terminal used:
–
TX (TX_TERMIO)
–
TT (TT_TERMIO)
–
RT (RT_TERMIO)
–
LT (LAT_TERMIO)
–
NV (NV_TERMIO)
–
TW (TW_TERMIO)
/TYPE=TOP_BDT_W (Top BDT Wait Rate)
Plots five remote nodes with the highest rate of BDT waits (plus “Other”)
resulting when a local node issues an I/O, but the connection had to wait
for a buffer descriptor. The metric graphed is BDT_W.
/TYPE=TOP_BLKS_R (Top Blk Transfers Requested)
Plots the top five nodes with the highest block transfer requests (plus
“Other”) from the remote system to the local system. The metric graphed
is BLKS_R.
/TYPE=TOP_BLKS_S (Top Blk Transfers Sent)
Plots the top five nodes with the highest block transfers sent (plus
“Other”) from the local system to the remote system. The metric graphed
is BLKS_S.
/TYPE=TOP_BUFIO_IMAGES (Top Buffered I/O Images)
Plots the top five (plus “Other Images”) creators of buffered I/O by image
names. The metric graphed is BUFIO.
Chapter 6: Performance Manager Commands 219
ADVISE PERFORMANCE GRAPH
/TYPE=TOP_BUFIO_USERS (Top Buffered I/O Users)
Plots the top five (plus “Other Users”) creators of buffered I/O by user
names. The metric graphed is BUFIO.
/TYPE=TOP_BUFIO_WORKLOADS (Top Buffered I/O Workloads)
Plots the top five (plus “Other Users”) creators of buffered I/O by workload
names. The metric graphed is BUFIO.
/TYPE=TOP_BUSY_DISKS (Top Busy Disk Device)
Plots the five (plus “Other Disks”) disk devices that experienced the
highest busy time percentages. The metric graphed is BUSY.
/TYPE=TOP_BUSY_PROCESSOR (Top Busy Physical Processor)
Plots the five (plus “Other”) processors that experienced the highest busy
time percentages. The metric graphed is P_BUSY.
/TYPE=TOP_BUSY_VOLUMES (Top Busy Disk Volume)
Plots the five (plus “Other Volumes”) disk volumes that experienced the
highest busy time percentages. The metric graphed is BUSY.
/TYPE=TOP_CHANNEL_IO (Top HSC Channel I/O)
Plots the five (plus “Other”) HSC channels that experienced the largest I/O
rate, in I/Os per second. The metric graphed is CHANNEL_IO.
/TYPE=TOP_CHANNEL_QUELEN (Top Queue HSC Channel)
Plots the five (plus “Other”) HSC channels that experienced the largest
queue length. The metric graphed is CHANNEL_QUELEN.
Note: The channel names are provided in the format nodename_n, where
n represents the channel number (K.SDI) on the HSC node indicated by
node name. If the channel cannot be identified, the character u is
substituted for n. See logical name PSDC$hscname_hscunitnumber in the
Performance Agent Administrator Guide.
/TYPE=TOP_CHANNEL_THRUPUT (Top HSC Channel Thruput)
Plots the five (plus “Other”) HSC channels that experienced the largest
throughput rate, in Kilobytes per second. The metric graphed is
CHANNEL_THRUPUT.
Note: The channel names are provided in the format nodename_n, where
n represents the channel number (K.SDI) on the HSC node indicated by
node name. If the channel cannot be identified, the character u is
substituted for n. See logical name PSDC$hscname_hscunitnumber in the
Performance Agent Administrator Guide.
/TYPE=TOP_CLUSTER_RULE_OCC (Top Cluster Rule Occurrences)
Plots the five (plus “Other”) rule identifiers that fired, as a rate per hour.
The metric graphed is CLUSTER_OCCURRENCES and is available only from
history data.
220 Performance Manager Administrator Guide
ADVISE PERFORMANCE GRAPH
/TYPE=TOP_COMPAT_PROCESSOR (Top Compat Mode Processor)
Plots the five (plus “Other”) processors in terms of time spent in
compatibility mode, as a percent of CPU time. The metric graphed is
P_COMPAT.
/TYPE=TOP_CPU_IMAGES (Top CPU Images)
Plots the top five (plus “Other Images”) consumers of CPU time by image
name. The metric graphed is CPUTIME.
/TYPE=TOP_CPU_RULE_OCC (Top CPU Rule Occurrences)
Plots the five (plus “Other”) CPU rule identifiers that fired, as a rate per
hour. The metric graphed is CPU_OCCURRENCES and is available only
from history data.
/TYPE=TOP_CPU_USERS (Top CPU Users)
Plots the top five (plus “Other Users”) consumers of CPU time by user
name. The metric graphed is CPUTIME.
/TYPE=TOP_CPU_WORKLOADS (Top CPU Workloads)
Plots the top five (plus “Other”) workloads as consumers of CPU time. The
metric graphed is CPUTIME.
/TYPE=TOP_CR_W (Top Credit Wait Rate)
Plots five nodes with the highest rate of credit waits (plus “Other”)
resulting when a connection has to wait for a send credit. The metric
graphed is CR_W.
/TYPE=TOP_DGS_D (Top Datagrams Discarded)
Plots five nodes with the most datagrams discarded (plus “Other”)resulting
when application datagrams are discarded by the port driver. The metric
graphed is DGS_D.
/TYPE=TOP_DGS_R (Top Datagrams Received)
Plots five nodes with the most datagrams received (plus “Other”)resulting
when the local system receives datagrams over the connection from the
remote system and given to SYSAP. The metric graphed is DGS_R.
/TYPE=TOP_DGS_S (Top Datagrams Sent)
Plots five nodes with the most datagrams sent (plus “Other”) resulting
when application datagrams are sent over the connection. The metric
graphed is DGS_S.
Chapter 6: Performance Manager Commands 221
ADVISE PERFORMANCE GRAPH
/TYPE=TOP_DIRIO_IMAGES (Top Direct I/O Images)
Plots the top five (plus “Other Images”) creators of direct I/O by image
name. The metric graphed is DIRIO.
/TYPE=TOP_DIRIO_USERS (Top Direct I/O Users)
Plots the top five (plus “Other Users”) creators of direct I/O by user name.
The metric graphed is DIRIO.
/TYPE=TOP_DIRIO_WORKLOADS (Top Direct I/O Workloads)
Plots the top five (plus “Other Users”) creators of direct I/O by workload
name. The metric graphed is DIRIO.
/TYPE=TOP_DISKIO_IMAGES (Top Image I/O Operations)
Plots the top five (plus “Other Images”) creators of disk I/O by image
name. The metric graphed is DSKIO.
/TYPE=TOP_DISKIO_USERS (Top User Disk Operations)
Plots the top five (plus “Other Users”) creators of disk I/O by user name.
The metric graphed is DSKIO.
/TYPE=TOP_DISKIO_WORKLOADS (Top Workload Disk Operations)
Plots the top five (plus “Other”) creators of disk I/O by workload name.
The metric graphed is DSKIO.
/TYPE=TOP_EXEC_PROCESSOR (Top Exec Mode Processor)
Plots the five (plus “Other”) processors in terms of time spent in executive
mode, as a percent of CPU time. The metric graphed is P_EXEC.
/TYPE=TOP_FAULTING_IMAGES (Top Faulting Images)
Plots the top five (plus “Other Images”) creators of page faults by image
name. The metric graphed is FAULTS.
/TYPE=TOP_FAULTING_USERS (Top Faulting Users)
Plots the top five (plus “Other Users”) creators of page faults by user
name. The metric graphed is FAULTS.
/TYPE=TOP_FAULTING_WORKLOADS (Top Faulting Workloads)
Plots the top five (plus “Other Users”) creators of page faults by workload
name. The metric graphed is FAULTS.
/TYPE=TOP_FREEBLK_DISKS (Top Freeblks Disk Device)
Plots the top five (plus “Other”) disk devices in terms of number of free
disk pages. The metric graphed is FREEBLKS.
/TYPE=TOP_FREEBLK_VOLUMES (Top Freeblks Disk Volume)
Plots the top five (plus “Other”) disk volumes in terms of number of free
disk pages. The metric graphed is FREEBLKS.
222 Performance Manager Administrator Guide
ADVISE PERFORMANCE GRAPH
/TYPE=TOP_HARDFAULTING_IMAGES (Top Hard Faulting Images)
Plots the top five (plus “Other Images”) creators of hard page faults by
image name. The metric graphed is HARDFAULTS.
/TYPE=TOP_HARDFAULTING_USERS (Top Hard Faulting Users)
Plots the top five (plus “Other Users”) creators of hard page faults by user
name. The metric graphed is HARDFAULTS.
/TYPE=TOP_HARDFAULTING_WORKLOADS (Top Hard Faulting
Workloads)
Plots the top five (plus “Other Users”) creators of hard page faults by
workload name. The metric graphed is HARDFAULTS.
/TYPE=TOP_HSC_DISK_IO (Top HSC Disk IO)
Plots the top five (plus “Other”) HSCs in terms of disk I/O operations per
second. The metric graphed is HSC_DISK_IO.
/TYPE=TOP_HSC_DISK_THRUPUT (Top HSC Disk Thruput)
Plots the top five (plus “Other”) HSCs in terms of disk throughput in
Kilobytes per second. The metric graphed is HSC_DISK_THRUPUT.
/TYPE=TOP_HSC_IO (Top HSC IO)
Plots the top five (plus “Other”) HSCs in terms of I/O operations per
second. The metric graphed is HSC_IO.
/TYPE=TOP_HSC_TAPE_IO (Top HSC Tape IO)
Plots the top five (plus “Other”) HSCs in terms of tape I/O operations per
second. The metric graphed is HSC_TAPE_IO.
/TYPE=TOP_HSC_TAPE_THRUPUT (Top HSC Tape Thruput)
Plots the top five (plus “Other”) HSCs in terms of tape thruput in Kilobytes
per second. The metric graphed is HSC_TAPE_THRUPUT.
/TYPE=TOP_HSC_THRUPUT (Top HSC Thruput)
Plots the top five (plus “Other”) HSCs in terms of total thruput in Kilobytes
per second. The metric graphed is HSC_THRUPUT.
/TYPE=TOP_IMAGE_ACTIVATIONS (Top Images Activated)
Plots the top five (plus “Other”) images in terms of image activations per
second. The metric graphed is IMAGE_ACTIVATIONS.
/TYPE=TOP_IMAGE_VOLUME_IO (Top I/O Images and the Disk
Volumes they access)
Plots the top five (plus “Other”) image and volume name pairs in terms of
their I/O rate. The metric graphed is IMAGE_VOLUME_IO.
Chapter 6: Performance Manager Commands 223
ADVISE PERFORMANCE GRAPH
/TYPE=TOP_INTERRUPT_PROCESSOR (Top Interrupt Stack Processor)
Plots the five (plus “Other”) processors in terms of time spent on the
interrupt stack, as a percent of CPU time. The metric graphed is
P_INTERRUPT.
/TYPE=TOP_IO_DISKS (Top Operations Disk Device)
Plots the five (plus “Other Disks”) disk devices that incurred the highest
I/O rates. The metric graphed is TOTIO.
/TYPE=TOP_IO_FILES (Top IO Operations Files)
Plots the five (plus “Other”) files that incurred the highest I/O rates. The
metric graphed is FILE_TOTIO.
/TYPE=TOP_IO_RULE_OCC (Top IO Rule Occurrences)
Plots the five (plus “Other”) IO rule identifiers that fired, as a rate per
hour. The metric graphed is IO_OCCURRENCES.
/TYPE=TOP_IO_VOLUMES (Top Operations Disk Volume)
Plots the five (plus “Other Volumes”) disk volumes that incurred the
highest I/O rates.
/TYPE=TOP_KB_MAP (Top Kilobyte Mapped Rate)
Plots five nodes (plus “Other”) in terms of the number of kilobytes of data
mapped for block transfer. The metric graphed is KB_MAP.
/TYPE=TOP_KB_RC (Top Kilobyte Received Rate)
Plots five nodes (plus “Other”) in terms of the number of kilobytes of data
received by the local system from the remote system through requestdata commands. The metric graphed is KB_RC.
/TYPE=TOP_KB_S (Top KB Sent Rate)
Plots five nodes (plus “Other”) in terms of the number of kilobytes of data
sent from the local system to the remote system through send-data
commands. The metric graphed is KB_S.
/TYPE=TOP_KERNEL_PROCESSOR (Top Kernel Mode Processor)
Plots the five (plus “Other”) processors in terms of time spent in kernel
mode as a percent of CPU time. The metric graphed is P_KERNEL.
/TYPE=TOP_MEMORY_RULE_OCC (Top Memory Rule Occurrences)
Plots the five (plus “Other”) memory rule identifiers that fired, as a rate
per hour. The metric graphed is MEMORY_OCCURRENCES and is available
only from history data.
224 Performance Manager Administrator Guide
ADVISE PERFORMANCE GRAPH
/TYPE=TOP_MGS_R (Top Messages Received)
Plots five nodes (plus “Other”) in terms of number of application datagram
messages received over the connection. The metric graphed is MGS_R.
/TYPE=TOP_MGS_S (Top Messages Sent)
Plots five nodes (plus “Other”) in terms of number of application datagram
messages sent over the connection. The metric graphed is MGS_S.
/TYPE=TOP_MP_SYNCH_PROCESSOR (Top MP Synch Mode Processor)
Plots the five (plus “Other”) processors in terms of time spent in MP
synchronization mode, as a percent of CPU time. The metric graphed is
P_MP_SYNCH.
/TYPE=TOP_MSCPIO_FILES (Top MSCP I/O Operations Files)
Plots the five (plus “Other”) files that incurred the highest MSCP I/O rates.
The metric graphed is FILE_MSCPIO.
/TYPE=TOP_PAGING_DISKS (Top PG&SWP Operations Disk Device)
Plots the five (plus “Other Disks”) disk devices that incurred the highest
I/O paging and swapping rates. The metric graphed is PAGIO.
/TYPE=TOP_PAGING_FILES (Top PG&SWP Operations Files)
Plots the five (plus “Other”) files that incurred the highest I/O paging and
swapping rates. The metric graphed is FILE_PAGIO.
/TYPE=TOP_PAGING_VOLUMES (Top PG&SWP Operations Disk
Volume)
Plots the five (plus “Other Volumes”) disk volumes that incurred the
highest I/O paging and swapping rates. The metric graphed is PAGIO.
/TYPE=TOP_POOL_RULE_OCC (Top Pool Rule Occurrences)
Plots the five (plus “Other”) pool rule identifiers that fired, as a rate per
hour. The metric graphed is POOL_OCCURRENCES and is available only
from history data.
/TYPE=TOP_PRCT_FREE_DISKS (Top Percent Freeblks Disk Device)
Plots the top five (plus “Other”) disk devices in terms of percentage of free
disk blocks. The metric graphed is PRCT_FREE.
/TYPE=TOP_PRCT_USED_DISKS (Top Percent Usedblks Disk Device)
Plots the top five (plus “Other”) disk devices in terms of percentage of
used disk blocks. The metric graphed is PRCT_USED.
Chapter 6: Performance Manager Commands 225
ADVISE PERFORMANCE GRAPH
/TYPE=TOP_PRCT_FREE_VOLUMES (Top Percent Freeblks Disk
Volume)
Plots the top five (plus “Other”) disk volumes in terms of percentage of
free disk blocks. The metric graphed is PRCT_FREE.
/TYPE=TOP_PRCT_USED_VOLUMES (Top Percent Usedblks Disk
Volume)
Plots the top five (plus “Other”) disk volumes in terms of percentage of
used disk blocks. The metric graphed is PRCT_USED.
/TYPE=TOP_QUEUE_DISKS (Top Queue Disk Device)
Plots the five (plus “Other Disks”) disk devices that experienced the
longest queue lengths. The metric graphed is QUEUE.
/TYPE=TOP_QUEUE_VOLUMES (Top Queue Disk Volume)
Plots the five (plus “Other Volumes”) disk volumes that experienced the
longest queue lengths. The metric graphed is QUEUE.
/TYPE=TOP_READ_DISKS (Top Read Operations Disk Device)
Plots the five (plus “Other Disks”) disk devices that incurred the highest
read I/O rates. The metric graphed is READIO.
/TYPE=TOP_READ_FILES (Top Read Operations Files)
Plots the five (plus “Other”) files that incurred the highest read I/O rates.
The metric graphed is FILE_READIO.
/TYPE=TOP_READ_VOLUMES (Top Read Operations Disk Volume)
Plots the five (plus “Other Volumes”) disk volumes that incurred the
highest read I/O rates. The
metric graphed is READIO.
/TYPE=TOP_RESIDENT_IMAGES (Most Resident Images)
Plots the top five (plus “Other Images”) images most resident on the
system by image name. The metric graphed is RESIDENCE.
/TYPE=TOP_RESIDENT_USERS (Most Resident Users)
Plots the top five (plus “Other Users”) users most resident on the system
by user name. Note that each subprocess adds to the residence for the
parent process's user name. The metric graphed is RESIDENCE.
/TYPE=TOP_RESIDENT_WORKLOADS (Most Resident Workloads)
Plots the top five (plus “Other Workloads”) workloads most resident on the
system by workload name. The metric graphed is RESIDENCE.
/TYPE=TOP_RESOURCE_RULE_OCC (Top Resource Rule Occurrences)
Plots the five (plus “Other”) resource rule identifiers that fired, as a rate
per hour. The metric graphed is RESOURCE_OCCURRENCES and is
available only from history data.
226 Performance Manager Administrator Guide
ADVISE PERFORMANCE GRAPH
/TYPE=TOP_RESPONSE_TIME_DISKS (Top Response Time Disk
Device)
Plots the five (plus “Other Disks”) disk devices that incurred the highest
response times. The metric graphed is D_RESPONSETIME.
/TYPE=TOP_RESPONSE_TIME_FILES (Top Response Time Files)
Plots the five (plus “Other”) files that incurred the highest response times.
The metric graphed is FILE_RESPONSE_TIME.
/TYPE=TOP_RESPONSE_TIME_IMAGES (Top Image Response Time)
Plots the five (plus “Other Images”) images with the highest terminal
response time. The metric graphed is RESPONSE_TIME.
/TYPE=TOP_RESPONSE_TIME_USERS (Top User Response Time)
Plots the five (plus “Other Users”) users with the highest terminal
response time. The metric graphed is RESPONSE_TIME.
/TYPE=TOP_RESPONSE_TIME_VOLUMES (Top Response Time Disk
Volume)
Plots the five (plus “Other Volumes”) disk volumes that have the highest
response times. The metric graphed is D_RESPONSETIME.
/TYPE=TOP_RESPONSE_TIME_WORKLOADS (Top Workload Response
Time)
Plots the five (plus “Other Workloads”) workloads with the highest terminal
response time. The metric graphed is RESPONSE_TIME.
/TYPE=TOP_RULE_OCCURRENCES (Top Rule Occurrences)
Plots the five (plus “Other”) rule identifiers that fired, as a rate per hour.
The metric graphed is OCCURRENCES and is available only from history
data.
/TYPE=TOP_SPLITIO_DISKS (Top Split Operations Disk Device)
Plots the five (plus “Other”) disk devices that have the highest split I/O
operations. The metric graphed is SPLITIO.
/TYPE=TOP_SPLITIO_FILES (Top Split Operations Files)
Plots the five (plus “Other”) files that have the highest split I/O operations.
The metric graphed is FILE_SPLITIO.
/TYPE=TOP_SPLITIO_VOLUMES (Top Split Operations Disk Volume)
Plots the five (plus “Other”) disk volumes that have the highest split I/O
operations. The metric graphed is SPLITIO.
Chapter 6: Performance Manager Commands 227
ADVISE PERFORMANCE GRAPH
/TYPE=TOP_SUPER_PROCESSOR (Top Supervisor Mode Processor)
Plots the five (plus “Other”) processors in terms of time spent in
Supervisor mode, as a percent of CPU time. The metric graphed is
P_SUPER.
/TYPE=TOP_TERMINAL_INPUT_IMAGES (Top Image Terminal Input)
Plots the top five (plus “Other Images”) images with the highest character
per second terminal input. The metric graphed is TERM_INPUT.
/TYPE=TOP_TERMINAL_INPUT_USERS (Top User Terminal Input)
Plots the top five (plus “Other Users”) users with the highest character per
second terminal input. The metric graphed is TERM_INPUT.
/TYPE=TOP_TERMINAL_INPUT_WORKLOADS (Top Workload Terminal
Input)
Plots the top five (plus “Other Workloads”) workloads with the highest
character per second terminal input. The metric graphed is TERM_INPUT.
/TYPE=TOP_TERMINAL_THRUPUT_IMAGES (Top Image Terminal
Thruput)
Plots the top five (plus “Other Images”) images with the highest character
per second terminal thruput. The metric graphed is TERM_THRUPUT.
/TYPE=TOP_TERMINAL_THRUPUT_USERS (Top User Terminal
Thruput)
Plots the top five (plus “Other Users”) users with the highest character per
second terminal thruput. The metric graphed is TERM_THRUPUT.
/TYPE=TOP_TERMINAL_THRUPUT_WORKLOADS (Top Workload
Terminal Thruput)
Plots the top five (plus “Other Workloads”) workloads with the highest
character per second terminal thruput. The metric graphed is
TERM_THRUPUT.
/TYPE=TOP_THRUPUT_DISKS (Top Throughput Disk Device)
Plots the five (plus “Other Disks”) disk devices that incurred the highest
throughput rates. The metric graphed is THRUPUT.
/TYPE=TOP_THRUPUT_FILES (Top Throughput Files)
Plots the five (plus “Other”) files that incurred the highest throughput
rates. The metric graphed is FILE_THRUPUT.
/TYPE=TOP_THRUPUT_IMAGES (Top Throughput Images)
Plots the five (plus “Other”) images with the highest throughput rates. The
metric graphed is THRUPUT.
228 Performance Manager Administrator Guide
ADVISE PERFORMANCE GRAPH
/TYPE=TOP_THRUPUT_USERS (Top Throughput Users)
Plots the five (plus “Other”) users with the highest throughput rates. The
metric graphed is THRUPUT.
/TYPE=TOP_THRUPUT_VOLUMES (Top Throughput Disk Volume)
Plots the five (plus “Other”) disk volumes that incurred the highest
throughput rates. The metric graphed is THRUPUT.
/TYPE=TOP_THRUPUT_WORKLOADS (Top Throughput Workloads)
Plots the five (plus “Other”) workloads with the highest throughput rates.
The metric graphed is THRUPUT.
/TYPE=TOP_USER_IMAGE_ACTIVATIONS (Top Image Activations
Users)
Plots the top five (plus “Other”) users in terms of image activations per
second. The metric graphed is IMAGE_ACTIVATIONS.
/TYPE=TOP_USER_PROCESSOR (Top User Mode Processor)
Plots the five (plus “Other”) processors in terms of time spent in User
mode, as a percent of CPU time. The metric graphed is P_USER.
/TYPE=TOP_USER_VOLUME_IO (Top I/O Users and the Disk Volumes
they access)
Plots the top five (plus “Other”) user and volume name pairs in terms of
their I/O rate. The metric graphed is USER_VOLUME_IO.
/TYPE=TOP_WORKLOAD_IMAGE_ACTIVATIONS (Top Image
Activations Workload)
Plots the top five (plus “Other”) workloads in terms of image activations
per second. The metric graphed is IMAGE_ACTIVATIONS.
/TYPE=TOP_WRITE_DISKS (Top Write Operations Disk Device)
Plots the five (plus “Other Disks”) disk devices that incurred the highest
write I/O rates. The metric graphed is WRITIO.
/TYPE=TOP_WRITE_FILES (Top Write Operations Files)
Plots the five (plus “Other”) files that incurred the highest write I/O rates.
The metric graphed is FILE_WRITIO.
/TYPE=TOP_WRITE_VOLUMES (Top Write Operations Disk Volume)
Plots the five (plus “Other Volumes”) disk volumes that incurred the
highest write I/O rates. The metric graphed is WRITIO.
Chapter 6: Performance Manager Commands 229
ADVISE PERFORMANCE GRAPH
/TYPE=TOP_VA_IMAGES (Top VA Space Images)
Plots the top five (plus “Other Images”) images that had the largest
combined virtual address space by image name. The metric graphed is
VASIZE.
/TYPE=TOP_VA_USERS (Top VA Space Users)
Plots the top five (plus “Other Users”) users that had the largest combined
virtual address space by user name. The metric graphed is VASIZE.
/TYPE=TOP_VA_WORKLOADS (Top VA Space Workload)
Plots the top five (plus “Other”) workloads that had the largest combined
virtual address space. The metric graphed is VASIZE.
/TYPE=TOP_WSSIZE_IMAGES (Top WS Size Images)
Plots the top five (plus “Other Images”) images that had the largest
combined working set sizes by image name. The metric graphed is
WSSIZE.
/TYPE=TOP_WSSIZE_USERS (Top WS Size Users)
Plots the top five (plus “Other Users”) users that had the largest combined
working set sizes by user name. The metric graphed is WSSIZE.
/TYPE=TOP_WSSIZE_WORKLOADS (Top WS Size Workload)
Plots the top five (plus “Other”) workloads that had the largest combined
working set sizes. The metric graphed is WSSIZE.
Examples
$ ADVISE PERFORMANCE GRAPH
The default graph of CPU_UTILIZATION, for today, is displayed for all nodes.
$ ADVISE PERFORMANCE GRAPH/TYPE=TOP_RESPONSE_TIME_VOLUME _$ /NOSTACK/FORMAT=REGIS=CHARACTERISTICS=LINE
The previous command produces a graph of the top response times for the top
5 disks. /NOSTACK and LINE are used together to compare the response times
on a graph without any occlusion.
$ ADVISE PERFORMANCE GRAPH/COMPOSITE_$ /BEGINNING=9-JAN-1990:09:00/ENDING=10-JAN-1990:09:00_$ /TYPE=TOP_IO_VOLUME/HISTORY=monthly_user
230 Performance Manager Administrator Guide
ADVISE PERFORMANCE GRAPH
The previous command produces one composite graph of archived data for all
nodes in the cluster system.
$ ADVISE PERFORMANCE
PSPA> SELECT/BEGIN=12:00
PSPA> GRAPH/TYPE=PROMPT
Please select either 1) a predefined graph or
2) a custom graph
Choice:
.
.
.
In command mode GRAPH/TYPE=PROMPT displays available graph types and
custom metrics as shown in the previous command.
Chapter 6: Performance Manager Commands 231
ADVISE PERFORMANCE PIE_CHART
ADVISE PERFORMANCE PIE_CHART
Use the ADVISE PERFORMANCE PIE_CHART command to produce a pie chart
instead of a graph. The PIE_CHART option has the same format as the ADVISE
PERFORMANCE GRAPH command, however the data is presented as a pie chart
instead of as a graph.
Format
ADVISE PERFORMANCE PIE_CHART
Description
The Performance Manager can produce a multitude of predefined charts,
however, only PostScript and DECwindows formats are supported. The pie
charts have the advantage of being able to display more than the top 5 values.
Qualifiers
The following are qualifiers that are specific to pie charts. For a complete
description of the remaining ADVISE PERFORMANCE PIE_CHART qualifiers,
refer to the ADVISE PERFORMANCE GRAPH (see page 191) command.
/FILTER=keyword
The /FILTER qualifier allows you select a subset of the daily or history data
for charting. Process data and disk data can be filtered.
Hot file data is also filtered. When you specify filtering by process, a hot
file record is selected if accessed by the specified process. When you
specify filtering by disk device, a hot file record is selected if located on the
specified device. For hot file records matching both process and disk
device, specify filtering by both process and device.
Process data can be filtered by using any of the filter keywords:
USERNAMES, IMAGENAMES, PROCESSNAMES, ACCOUNTNAMES, UICS,
PIDS or WORKLOADNAMES. If a process record's identification information
matches any of the identification specifications that are specified, then that
record is selected.
Likewise, disk data can be filtered by using either the filter keywords,
VOLUMENAMES or DEVICENAMES. If a device record's identification
information matches any of the volume names or device names that are
specified, then that record is selected.
232 Performance Manager Administrator Guide
ADVISE PERFORMANCE PIE_CHART
The following table lists the FILTER keyword options:
Keyword
Description
/USERNAMES=(string,...)
Specify /FILTER=USERNAMES to
chart all process records with the
username matching any of the
specified strings.
/IMAGENAMES=(string,...)
Specify /FILTER=IMAGENAMES to
chart all process records with the
image name matching any of the
specified strings. Do not specify any
trailing ".EXE", nor the file version,
device or directory.
/PROCESSNAMES=(string,...)
Specify /FILTER=PROCESSNAMES to
chart all process records with the
process name matching any of the
specified strings. The match string is
case sensitive, so if the process
names have any lowercase letters,
spaces or tabs, use double quotes
when you enter the value (e.g.,
/FILTER=PROCESSNAMES="-RTserver--" ).
/ACCOUNTNAMES
=(string,...)
Specify /FILTER=ACCOUNTNAMES to
chart all process records with the
account name matching any of the
specified strings.
/WORKLOADNAMES
=(workloadname,...)
Specify /FILTER=WORKLOADNAMES
to chart all process records associated
with any of the specified workloads.
This filter is valid only if the
/CLASSIFY_BY qualifier is used to
specify a classification scheme for
your workload data.
/UICS=(uic,...)
Specify /FILTER=UICS to chart all
process records with the UIC
matching any of the specified UICs.
An asterisk may be used to wildcard
either the group or user field of the
specified UICs.
/PIDS=(pid,...)
Specify /FILTER=PIDS to chart all
process records with the PID
matching any of the specified PIDs.
Chapter 6: Performance Manager Commands 233
ADVISE PERFORMANCE REPORT
Keyword
Description
/VOLUMENAMES=(string,...)
Specify /FILTER=VOLUMENAMES to
chart all disk records with the volume
name matching any of the specified
strings. Do not specify any trailing
colon.
/DEVICENAMES=(string,...)
Specify /FILTER=DEVICENAMES to
chart all disk records with the device
name matching any of the specified
strings. Do not specify any trailing
colon.
/PERCENTAGE = {TOTAL | MAXIMUM}
Specifies that a pie chart representing data in units of percentages is to be
filled out to be the MAXIMUM of 100 percent, or is to represent only the
TOTAL of the parts. For example; if you are producing a pie chart of CPU
Utilization, and the parts of the pie chart have the following values:
■
Interactive
30%
■
Batch
10%
■
Network
5%
■
Overhead
1%
■
Interrupts
5%
■
Other
0%
If you specify /PERCENTAGE=TOTAL, the pie chart represents the sum of
these parts, a total of 51 percent utilization, with the largest slice of the
pie (approximately 3/5ths) being represented by “Interactive.” If you
specify /PERCENTAGE=MAXIMUM, the pie chart contains a slice
representing IDLE at 49 percent of the total pie with the remaining 51
percent representing their respective slices. If /PERCENTAGE is not used
on the Pie command line, then /PERCENTAGE=MAXIMUM is assumed.
This qualifier has no effect on graphs, custom pie charts, or pie charts of
metrics other than CPU Utilization.
ADVISE PERFORMANCE REPORT
The ADVISE PERFORMANCE REPORT command generates Analysis Reports,
Performance Evaluation Reports, Tabular Reports and Histograms using daily
or historical data.
Format
ADVISE PERFORMANCE REPORT report_keyword[,...])
234 Performance Manager Administrator Guide
ADVISE PERFORMANCE REPORT
Description
Use the ADVISE PERFORMANCE REPORT command to produce Performance
Manager reports. The Performance Manager can generate reports using either
daily or historical data. The following section describes the qualifiers you can
use with the ADVISE PERFORMANCE REPORT command to control report
generation. The report keywords are as follows:
■
ANALYSIS
■
Consists of conclusions, conditions, and evidence for each rule that fired
for each node and includes cluster-wide conclusions for a cluster system.
■
BRIEF_ANALYSIS
A brief version of the analysis report consisting of a one-line synopsis of
each conclusion.
■
HISTOGRAMS
Consists of chronological charts that show peak resource usage. The
Performance Manager produces a report containing separate histograms
for CPU utilization, number of disk I/Os, number of terminal I/Os, memory
usage, node status information, and, if you include the /IMAGE qualifier,
an image residence time histogram. Use of the /IMAGE qualifier it limited
to the DCL command interface.
■
PERFORMANCE_EVALUATION
■
TABULAR[=(FINAL,INTERVAL,BYCLUSTER,BYNODE)
Contains an overview of the system activity on a per node basis, or
cluster-wide. Subsections of this report can be selected or omitted with the
/SECTION qualifier.
The Tabular report can be presented in the following ways:
FINAL
Each Tabular report section is presented with statistics
representing the whole time period.
INTERVAL
Each Tabular report section is presented for each reporting
interval. By default the reporting interval is the same as the
recording interval, however you can specify the reporting
interval with the /INTERVAL qualifier.
BYCLUSTER
Each Tabular report section is presented in a cluster-wide
format. The configuration section is not available in the
cluster-wide format.
BYNODE
Each Tabular report section is presented in a cluster-wide
format with the by-node detail included. The configuration
section is not available in the cluster-wide format.
Chapter 6: Performance Manager Commands 235
ADVISE PERFORMANCE REPORT
If both BYNODE and BYCLUSTER are omitted, the Tabular report sections
are presented on a node by node basis, and not on a cluster-wide basis.
By default, if none of the above options are specified, FINAL is assumed.
Using BYCLUSTER or BYNODE presents a different output format than
FINAL or INTERVAL. For example, the following commands produce
different output formats:
ADVISE PERF REPORT TABULAR/SECTION=ALL
ADVISE PERF REPORT TABULAR=BYCLUSTER/SECTION=ALL
Examples
$ ADVISE PERFORMANCE REPORT ANALYSIS,PERFORMANCE_EVALUATION_$ /OUTPUT=SAMPLE
This command produces an Analysis Report and a Performance Evaluation
Report for the current day using a beginning time of midnight (00:00) and the
current time of day as the ending time. The reports contain information for
each of the nodes listed in the Performance Manager schedule file. The
/OUTPUT qualifier directs the output to a file called SAMPLE.RPT. (The .RPT
extension is the default.)
$ ADVISE PERFORMANCE REPORT ANALYSIS/NODE_NAMES=DEMAND _$ /NOEXPLAIN/RULES=MYRULES
This command produces an Analysis Report for the node DEMAND. This report
is for the current day using the beginning time of midnight (00:00) and the
current time of day as the ending time. In addition to the Performance
Manager factory rules, the Performance Manager use an auxiliary knowledge
base. The /NOEXPLAIN qualifier indicates that the report contains only
conclusions and recommendations, omitting the rule conditions and the
evidence. Because the /OUTPUT qualifier is not specified, the report is
displayed on the terminal.
$ ADVISE PERFORMANCE REPORT BRIEF_ANALYSIS_$ /BEGIN=30-JUN-1996:10:00/END=30-JUN-1996:14:00 _$ /OUTPUT=ZERO_IN
This command produces a Brief Analysis Report for the time period between
10:00 a.m. and 2:00 p.m. on June 30, 1996. The /OUTPUT qualifier directs the
output to a file called ZERO_IN.RPT. The Brief Analysis Report contains rule
identifiers, the percentage of time for which there were instances of rule
occurrences during the reporting period, the number of Performance Manager
data records (two-minute records) supporting the rule occurrence, and a brief
(no more than one line) synopsis of the problem statement. A cluster-wide
synopsis follows the synopsis for each node.
236 Performance Manager Administrator Guide
ADVISE PERFORMANCE REPORT
As you become more familiar with analysis reports, the brief report may be
sufficient on a daily basis.
$ ADVISE PERFORMANCE REPORT ANALYSIS,PERFORMANCE_EVALUATION _$ /BEGIN=10:00/END=14:00 _$ /OUTPUT=ZERO_IN
This command produces both an Analysis Report and a Performance
Evaluation Report for the nodes listed in the schedule file. These reports are
for the time period between 10:00 a.m. and 2:00 p.m. on the current day. The
/OUTPUT qualifier directs the output to a file called ZERO_IN.RPT.
$ ADVISE PERFORMANCE REPORT HISTOGRAM,PERFORMANCE_EVALUATION _$ /PROCESS_STATISTICS= _$ (PRIMARY_KEY=USERNAME,SECONDARY_KEY=IMAGENAME )_$ /INCLUDE=PROCESS/END=8/IMAGE=LOGINOUT/OUTPUT=CHECK_BREAKIN
This command produces a Performance Evaluation Report for the current day
from midnight to 8:00 a.m. An additional histogram for the LOGINOUT image
is generated. The /OUTPUT qualifier writes the Performance Evaluation Report
to a file called CHECK_BREAKIN.RPT. Only the Process Statistics section of the
Performance Report is produced showing the process activity of each user by
image.
$ ADVISE PERFORMANCE REPORT TABULAR=INTERVAL _$ /INTERVAL=600/BEGIN=10:00/END=11:00 _$ /NODE=MYNODE/SECTION=SUMMARY_STATISTICS
This command produces the summary statistics section of the tabular report
for the node MYNODE. The section is repeated 6 times, each summarizing 10
minutes of data from within the 1 hour reporting period.
Chapter 6: Performance Manager Commands 237
ADVISE PERFORMANCE SHOW VERSION
ADVISE PERFORMANCE SHOW VERSION
Use the ADVISE PERFORMANCE SHOW VERSION command to display the
current version of the Performance Manager module.
Format
ADVISE PERFORMANCE SHOW VERSION
Example
$ ADVISE PERFORMANCE SHOW VERSION <Return>
Performance Manager version Vx.x-yymm built dd-MMM-yyyy
$
The ADVISE PERFORMANCE SHOW VERSION command in this example
displays a version of x.x-yymm.
238 Performance Manager Administrator Guide
Chapter 7: Use Command Mode
Commands
This is a reference chapter for the Performance Manager command mode
syntax. Command mode allows you to specify an analysis period that you may
want to investigate and then to interactively view graphs and reports.
To start a command mode session, enter the DCL command ADVISE
PERFORMANCE.
This section contains the following topics:
ADVISE PERFORMANCE (see page 239)
SELECT (see page 240)
LOAD (see page 245)
GRAPH (see page 245)
PIE_CHART (see page 248)
REPORT (see page 249)
SAVE (see page 255)
SPAWN (see page 255)
EXIT (see page 256)
@(Execute Procedure) (see page 256)
ADVISE PERFORMANCE
The ADVISE PERFORMANCE command invokes a Performance Manager
command mode session.
Format
ADVISE PERFORMANCE
Description
When you invoke command mode you see the PSPA> prompt. At this prompt
you can enter the commands listed in the following table. You can end a
command mode session with the EXIT command.
Command
Function
SELECT
Causes data to be selected for subsequent viewing
by GRAPH and REPORT commands.
Chapter 7: Use Command Mode Commands 239
SELECT
Command
Function
LOAD
Loads a binary graph data file.
GRAPH/PIE_CHART
Causes a graph or pie chart to be produced from
the selected data.
REPORT
Causes the preparation of one of the reports.
SAVE
Saves a binary graph data file.
PSPAWN
Creates a subprocess of the current process.
EXIT
Causes the program to exit.
HELP
Assists the user by providing a detailed discussion
of any parameter or qualifier.
@
Executes the commands in the file-spec.
SELECT
The SELECT command selects data for analysis.
Format
SELECT option[,...]
Description
The SELECT command causes data to be selected for subsequent viewing by
GRAPH and REPORT commands. The following table lists all the SELECT
command options.
You can abort the SELECT operation and return to the PSPA> prompt by
entering Ctrl+C.
Options
Option
Function
ANALYSIS
Enables the viewing of the Analysis Report
from the selected data. By default, the
Performance Manager provides analysis
processing.
240 Performance Manager Administrator Guide
SELECT
Option
Function
PERFORMANCE_EVALUATION[=([NO]suboption,...)]
Enables the viewing of the Performance
Evaluation Report, the Tabular Report and
Histograms from the selected data.
Suboptions include HOT_FILE, PROCESS
(=key levels), and ALL. The PROCESS
keyword may be followed by a list of
PROCESS Key Levels indicating the detail
level by which process data can be reported.
These key levels include: IMAGENAME,
MODE, USERNAME, UIC_GROUP,
PROCESS_NAME, WORKLOAD_NAME,
ACCOUNT_NAME, and PID. For a description
of these key levels, see the table of focus
types in ADVISE PERFORMANCE REPORT.
The Tabular process metrics require ALL key
levels. When specifying PID or
PROCESS_NAME key levels, additional
virtual memory may be required. See
Appendix D, “Estimating Virtual Memory
Needs,” for more information. By default,
the Performance Manager provides
Performance Evaluation processing without
Process key levels, PID, or Processname.
GRAPHS[=([NO]suboption,...)]
Suboptions include IMAGENAMES,
USERNAMES, HOTFILES, USERVOLUMES,
IO_DEVICES, BY_NODE, ALL, and DEFAULT.
DEFAULT consists of IMAGENAMES,
USERNAMES and IO_DEVICES. By default,
the Performance Manager provides
GRAPH=DEFAULT processing.
Qualifiers
/AVERAGE={DAILY | WEEKLY | MONTHLY | QUARTERLY}
Causes graphs to depict a specified time period. The selected data is
averaged into the time period selected. If you also use the /SCHEDULE
qualifier, the DAILY and WEEKLY graphs are trimmed to show only the
selected hours.
The DAILY and WEEKLY graphs must select data from at least two different
days, and the MONTHLY and QUARTERLY graphs must select data from at
least two different months.
If history data with the periodicity attribute is selected, the /AVERAGE
value is automatically set to that periodicity value. This is true regardless
of whether the /AVERAGE qualifier is used.
Chapter 7: Use Command Mode Commands 241
SELECT
/BEGINNING=date
Specifies the beginning time for the data selection. By default 00:00 is
used.
/CLASSIFY_BY= USERGROUP= family_name
Specifies the family name, which dictates how to classify the workload for
workload graphs, and the process statistics section of the Performance
Evaluation Report. By default, no classification is used.
/COLLECTION_DEFINITION=collection-definition-name
Specifies the name of the Collection Definition, and hence the collected
data that you desire to use for graphs and reports. If you omit this
qualifier, daily data is obtained from the Collection Definition called “CPD.”
To view the Collection Definitions that you have available, use the DCL
command ADVISE COLLECT SHOW ALL.
If you want to use history data instead of daily data, use the /HISTORY
qualifier instead of the /COLLECTION_DEFINITION qualifier. These two
qualifiers are mutually exclusive.
/DATES=filespe
Specifies that a file containing a series of date ranges is to be used in
place of the /BEGINNING and /ENDING qualifiers. Each line in the dates
file should look like the following code:
dd-mmm-yyyy hh:mm:ss.cc,dd-mmm-yyyy hh:mm:ss.cc
The time may be omitted entirely or may be truncated. Any truncated
parts of the time are defaulted to 0. The periods of time represented by
each line in the file need not be contiguous but they must be in ascending
order.
/DATES is mutually exclusive with /BEGINNING and /ENDING.
/ENDING=date
Specifies the ending time for the data selection. By default, 23:59 or NOW
is used.
/FILTER=keyword
The /FILTER qualifier allows you select a subset of the daily or history data
for interactive displays. Process data and disk data can be filtered.
Hotfile data is also filtered. When you specify filtering by process, a hotfile
record is selected if accessed by the specified process. When you specify
filtering by disk device, a hotfile record is selected if located on the
specified device. For hotfile records matching both process and disk
device, specify filtering by both process and device.
242 Performance Manager Administrator Guide
SELECT
Process data can be filtered by using any of the filter keywords:
USERNAMES, IMAGENAMES, PROCESSNAMES, ACCOUNTNAMES, UICS,
PIDS or WORKLOADNAMES. If a process record's identification information
matches any of the identification specifications that are specified, then that
record is selected.
Likewise, disk data can be filtered by using any of the filter keywords:
VOLUMENAMES and DEVICENAMES. If a device record's identification
information matches any of the volume names or device names that are
specified, then that record is selected.
Keyword
Description
/FILTER=USERNAMES=(string,...)
Specify /FILTER=USERNAMES to select
all process records with the username
matching any of the specified strings.
/FILTER=IMAGENAMES=(string,...)
Specify /FILTER=IMAGENAMES to
select all process records with the
imagename matching any of the
specified strings. Do not specify any
trailing “.EXE,” nor the file version,
device or directory.
/FILTER=PROCESSNAMES=(string,.. Specify /FILTER=PROCESSNAMES to
.)
select all process records with the
processname matching any of the
specified strings. The match string is
case sensitive, so if the process names
have any lowercase letters, spaces or
tabs, use double quotes when you
enter the value (e.g.,
/FILTER=PROCESSNAMES="-RTserver--").
/FILTER=ACCOUNTNAMES
=(string,...)
Specify /FILTER=ACCOUNTNAMES to
select all process records with the
accountname matching any of the
specified strings.
/FILTER=WORKLOADNAMES
=(workloadname,...)
Specify /FILTER=WORKLOADNAMES to
select all process records associated
with any of the specified workloads.
This filter is valid only if the
/CLASSIFY_BY qualifier is used to
specify a classification scheme for your
workload data.
Chapter 7: Use Command Mode Commands 243
SELECT
Keyword
Description
/FILTER=UICS=(uic,...)
Specify /FILTER=UICS to select all
process records with the UIC matching
any of the specified UICs. An asterisk
may be used to wildcard either the
group or user field of the specified
UICs.
/FILTER=PIDS=(pid,...)
Specify /FILTER=PIDS to select all
process records with the PID matching
any of the specified PIDs.
/FILTER=VOLUMENAMES=(string,...) Specify /FILTER=VOLUMENAMES to
select all disk records with the
volumename matching any of the
specified strings. Do not specify any
trailing colon.
/FILTER=DEVICENAMES=(string,...)
Specify /FILTER=DEVICENAMES to
select all disk records with the
devicename matching any of the
specified strings. Do not specify any
trailing colon.
/HISTORY= history-descriptor-nam
Specifies the name of a history file descriptor to cause history files to be
used instead of daily data. By default, no history selection is made.
/NODE_NAMES=(nodename[,...])
Specifies the list of node names on which to select data. By default, the
Performance Manager uses all nodes.
/RULES=file
Specifies a user compiled rules file to be used when data is selected for
Analysis.
/SCHEDULE= (dow=m-n[,...])
Specifies that a weekly selection schedule is to be used when selecting
data. By default, no schedule is used.
/X_POINTS=n
Specifies the number of points to plot along the x-axis for graphs.
/X_POINTS also affects the width of ANSI formatted graphs. The default
value varies depending on the time period selected.
244 Performance Manager Administrator Guide
LOAD
LOAD
The LOAD command allows you to load a selection of graph data that was
previously saved to the specified file. If you already have a period of time
selected, this command replaces the current selection.
Format
LOAD file-spec
GRAPH
The GRAPH command graphs any group of metrics stored in the database that
are selected with the SELECT command.
Format
GRAPH
Description
The Performance Manager can produce a multitude of predefined graphs. You
can also define your own custom graphs if the predefined graphs do not meet
your specific needs.
Qualifiers
/FORMAT
Specifies the graph's output format. Options include:
REGIS=[CHARACTERISTICS=(COLOR,LINE,PATTERN)]
POSTSCRIPT=[CHARACTERISTICS=(COLOR,LINE,
PATTERN)]|TABULAR|ANSI[=(HEIGHT=n[,LINE])]
CSV
The default value depends on terminal characteristics. For more
information, see the section Advise Performance Graph (see page 191).
/NODE_NAME=nodename
Specifies the preparation of a graph for only one of the selected nodes.
The BY_NODE graph processing option may be required during data
selection if the metric is not a system metric. By default, the Performance
Manager prepares graphs for all selected nodes (Composite graphs).
Chapter 7: Use Command Mode Commands 245
GRAPH
/OUTPUT=filespec
Creates an output file that contains the graphs. The default file extension
for a ReGIS graph is .REG, the file type for ANSI and TABULAR formatted
graphs is .RPT and the file extension for PostScript is .PS.
When you generate multiple graphs with a single command line, you can
create a unique output file for each graph. To do this, omit the file name
with the /OUTPUT qualifier. The Performance Manager generates a
separate file for each graph created and uses the graph type keyword as
the unique file name.
For example:
$ ADVISE PERFORMANCE GRAPH/NODE=SYSDEV/END=1/TYPE=(MEM,CPU_U,CPU_MODE)
/OUTPUT=.REG
%PSPA-I-CREAGRAPHOUT, PSPA Graph created file
MUMMS$DKA300:[CORREY]SYSDEV_CPU_UTILIZATION.REG;1
%PSPA-I-CREAGRAPHOUT, PSPA Graph created file
MUMMS$DKA300:[CORREY]SYSDEV_MEMORY_UTILIZATION.REG;1
%PSPA-I-CREAGRAPHOUT, PSPA Graph created file
MUMMS$DKA300:[CORREY]SYSDEV_CPU_MODES.REG;1
/SELECT[={GREATER_THAN[:percent] | LESS_THAN[:percent]}],
/NOSELECT
Use /SELECT in conjunction with the optional threshold values which may
be specified on a per graph type basis.
If this qualifier is present, before a graph is produced, a check is made to
see if the values to be graphed fall within the threshold values for the
indicated percentage of points. If so, then the graph (or pie chart) is
produced. If not, no graph is produced. For details on THRESHOLD, see
the /TYPE qualifier.
Keyword
Meaning
GREATER_THAN:percent
At least “percent” of the graph points plotted
must be greater than or equal to the threshold
value specified with the /TYPE qualifier.
LESS_THAN:percent
At least “percent” of the graph points plotted
must be less than or equal to the threshold
value specified with the /TYPE qualifier.
These keywords accept a single value representing the percentage of the
points plotted that must meet the threshold criteria before the graph is
produced. Each graph point value is determined by the sum (STACKED) of
the items depicted (up to 6). If the GREATER_THAN keyword is specified
without a value, then 50 percent is assumed. If the LESS_THAN keyword
is specified without a value, then 90 percent is assumed.
246 Performance Manager Administrator Guide
GRAPH
If the /SELECT qualifier is present without a keyword, then
GREATER_THAN:50 is assumed. For example:
$ ADVISE PERFORMANCE GRAPH /BEGINNING=10/ENDING=11/NODE=YQUEM _$ /TYPE=(CPU_U:THRESHOLD:25,CPU_M:THRESHOLD:35,TOP_CPU_I:THRESHOLD:45)_$ /SELECT=GREATER/OUTPUT=.REGIS
%PSPA-I-CREAGRAPHOUT, PSPA Graph created file
BADDOG:[CORREY.WORK.PSPA]YQUEM_CPU_UTILIZATION.REG;1
This command requests that three graphs be produced. The CPU Utilization
graph is produced, if 50 percent or more of the data points exceed 25
percent CPU utilization. The CPU_MODES graph is produced if 50 percent
or more of the data points exceed 35 percent CPU utilization. The
TOP_CPU_IMAGES graph is produced if 50 percent or more of the data
points exceed 45 percent CPU utilization. In this case only one graph is
produced.
$ ADVISE PERFORMANCE GRAPH /BEGINNING=10/ENDING=11/NODE=YQUEM _$ /TYPE=(CPU_U:THRESHOLD:25,CPU_M:THRESHOLD:35,TOP_CPU_I:THRESHOLD:15)_$ /SELECT=GREATER/OUTPUT=.REGIS
%PSPA-I-CREAGRAPHOUT, PSPA Graph created file
BADDOG:[CORREY.WORK.PSPA]YQUEM_CPU_UTILIZATION.REG;3
%PSPA-I-CREAGRAPHOUT, PSPA Graph created file
BADDOG:[CORREY.WORK.PSPA]YQUEM_TOP_CPU_IMAGES.REG;1
This command produced two of three graphs because threshold quantity
for the last graph was lowered.
$ ADVISE PERFORMANCE GRAPH /BEGINNING=10/ENDING=11/NODE=YQUEM _$ /TYPE=(CPU_U:THRESHOLD:25,CPU_M:THRESHOLD:35,TOP_CPU_I:THRESHOLD:15) _$ /SELECT=GREATER:90/OUTPUT=.REGIS
$
The previous command generated none of the graphs because in all cases
90 percent of the graph points did not exceed the specified thresholds.
/STACK, /NOSTACK
Stacks the values for each category on the graph. Use /NOSTACK to
overlay the values on the graph. ReGIS graphs using /NOSTACK may
cause some occlusion if you do not specify
/FORMAT=ReGIS=CHARACTERISTICS=LINE also. If you are requesting a
series of graphs in one command, you can override the /[NO]STACK
qualifier by specifying the [NO]STACK keyword following each graph type.
See Chapter 4 for an illustration of the use of the /NOSTACK qualifier and
for additional information about default behavior.
Chapter 7: Use Command Mode Commands 247
PIE_CHART
/TYPE={
(graph_type[=([NO]STACK,Y_AXIS_MAXIMUM=n,
THRESHOLD=m,TITLE=string)],...)|
ALL_GRAPHS[=([NO]STACK,THRESHOLD=m,Y_AXIS_MAXIMUM=n)]
CUSTOM=(see “/TYPE=CUSTOM in Chapter 6”)|
PROMPT}
Specifies which of the graphs you want generated.
The PROMPT keyword specifies that the Performance Manager prompt you
for the graph types and custom metrics. Using PROMPT has the advantage
of allowing an interactive user the ability to preview any predefined or
custom graphs quickly and view any item categories to see what choices
exist.
Use the TITLE keyword to override the Performance Manager supplied title.
The text string may be a maximum of 40 characters.
The STACK keyword for a particular graph type overrides the setting
established by the /STACK qualifier.
The THRESHOLD keyword specifies a threshold value associated with the
graph. THRESHOLD does not apply to pie chart graphs and is ignored. The
m specifier is a positive decimal value.
The Y_AXIS_MAXIMUM specifies a fixed y-axis to be used for the graph.
The default behavior is to setup the y-axis so that the maximum data point
appears near the top of the graph. This graph modifier allows you to
specify the y-axis so that you can compare data from different graphs
without having different scales on the y-axis. The n specifier is a positive
decimal value.
You can specify multiple graphs in a single command. For example, you
can specify /TYPE=(TOP_IO_DISKS,TOP_HARDFAULTING_IMAGES). Of
course, /TYPE=ALL_GRAPHS generates all of the predefined graphs.
CPU_UTILIZATION is the default graph type.
For a list of valid graph types, see the chapter “Performance Manager
Commands”.
PIE_CHART
Use the PIE_CHART command to produce a pie chart instead of a graph. The
PIE_CHART option has the same format as the GRAPH command, however the
data is presented as a pie chart instead of as a graph.
Format
PIE_CHART
248 Performance Manager Administrator Guide
REPORT
Description
The Performance Manager software can produce a multitude of predefined or
custom pie charts, in the following formats PostScript and DECwindows
formats, tabular, and CSV. In command mode the /OUTPUT qualifier must be
used to direct the output to a PostScript file.
The /PERCENTAGE qualifier is specific to the PIE_CHART command. For other
applicable PIE_CHART qualifiers, see the GRAPH command (see page 245).
Qualifiers
/PERCENTAGE = {TOTAL | MAXIMUM}
Specifies that a pie chart representing data in units of percentages is to be
filled out to be the MAXIMUM of 100 percent, or is to represent only the
TOTAL of the parts. For example; if you are producing a pie chart of CPU
Utilization, and the parts of the pie chart have the following values:
■
Interactive
30%
■
Batch
10%
■
Network
5%
■
Overhead
1%
■
Interrupts
5%
■
Other
0%
If you specify /PERCENTAGE=TOTAL, the pie chart represents the sum of
these parts, a total of 51 percent utilization, with the largest slice of the
pie (approximately 3/5ths) being represented by “Interactive.” If you
specify /PERCENTAGE=MAXIMUM, the pie chart contains a slice
representing IDLE at 49 percent of the total pie with the remaining 51
percent representing their respective slices. If /PERCENTAGE is not used
on the Pie command line, then /PERCENTAGE=MAXIMUM is assumed.
This qualifier has no effect on graphs, custom pie charts, or pie charts of
metrics other than CPU Utilization.
REPORT
The REPORT command generates Performance Manager Analysis Reports,
Performance Evaluation Reports, Tabular Reports, and Histograms.
Format
REPORT report_keyword[,...]
Chapter 7: Use Command Mode Commands 249
REPORT
Description
Use the REPORT command to produce Performance Manager reports. The
Performance Manager can generate reports using either daily or historical
data. The following table lists all the REPORT command options.
Options
Option
Function
ANALYSIS
Displays the full Analysis Report.
BRIEF_ANALYSIS
Displays the brief Analysis Report.
PERFORMANCE_EVALUATION
Displays the Performance Evaluation
Report.
HISTOGRAMS
Displays standard ANSI graphs of CPU,
memory, and I/O use. The Image
Residence histogram is not available in
Command Mode.
TABULAR=[{FINAL|BYCLUSTER|BY Displays an overview of the system
NODE}]
activity on a per node basis, or clusterwide. Subsections of this report can be
selected or omitted with the /SECTION
qualifier. Tabular process statistics
require that you select PROCESS=ALL to
save by-PID details for each process.
See also SELECT.
Qualifiers
/EXPLAIN, /NOEXPLAIN
Specifies for the Full Analysis Report, whether to include the rule's
conditions and evidence in the report output. By default, the Performance
Manager uses the /EXPLAIN qualifier for a batch process or if /OUTPUT is
specified or asks you if the process is interactive.
/HOTFILE_LIMIT=n
Specifies the maximum number of hot files to list per disk volume in the
Hotfile Statistics section of the Performance Evaluation Report. By default
the maximum number of hot files is 20.
250 Performance Manager Administrator Guide
REPORT
/INCLUDE =(section,...)
Specifies which sections of the Performance Evaluation Report are to be
included. The negatable options are as follows:
■
ALL_STATISTICS
■
POOL_STATISTICS
■
LOCK_STATISTICS
■
TAPE_STATISTICS
■
SCS_STATISTICS
■
HOTFILE_STATISTICS
■
CI_NI_AND_ADAPTER_STATISTICS
■
DISK_STATISTICS
■
SUMMARY_STATISTICS
■
PROCESS_STATISTICS
■
MODE_STATISTICS
■
RULE_STATISTICS
By default, the Performance Manager includes all sections except SCS
statistics. Rule statistics are only available with archived data.
/NODE_NAME=nodename
Specifies the preparation of a report for only one of the selected nodes. By
default, the Performance Manager prepares reports for all selected nodes.
cluster-wide statistics are always included.
Chapter 7: Use Command Mode Commands 251
REPORT
/OUTPUT=filespec
Specifies an output file specification as a destination for the report output.
By default, the output file destination is SYS$OUTPUT.
/PROCESS_STATISTICS=([FOCUS={TRADITIONAL|SUMMARY|
GENERAL|MEMORY_RELATED|
IO_RELATED|CPU_RELATED}]
[,PRIMARY_KEY={
MODE|
USERNAME|
IMAGENAME|
UIC_GROUP|
PROCESS_NAME|
WORKLOAD_NAME|
ACCOUNT_NAME|
PID}]
[,SECONDARY_KEY={
MODE|
USERNAME|
IMAGENAME|
UIC_GROUP|
PROCESS_NAME|
WORKLOAD_NAME|
ACCOUNT_NAME|
PID}]
[,[NO]CLUSTER]
[,[NO]BY_NODE])
The previous code lets you tailor the process statistics section of the
Performance Evaluation report. You can specify the focus of the report to
obtain slightly different sorts of statistics that pertain to the focus area.
The grouping, merging, and sorting of the process data is controlled with
the primary and secondary key settings. To use a given primary or
secondary key, you must have previously specified the process key level
with the SELECT command. See the description of the
PERFORMANCE_EVALUATION option with SELECT. Also, you can specify
whether a cluster-wide report, or a node-by-node presentation is desired.
By default, the focus area is TRADITIONAL, that being an image based
report showing relative resource consumption. Reports are provided by
node, unless otherwise specified.
Where:
FOCUS Types:
Provide:
TRADITIONAL
An 80 column report showing process CPU, memory and
IO statistics on a per image activation basis, or as a
relative percentage. The default primary and secondary
keys are MODE and IMAGENAME. The SUMMARY focus
report is also provided with the TRADITIONAL flavor.
252 Performance Manager Administrator Guide
REPORT
FOCUS Types:
Provide:
SUMMARY
An 80 column report showing process CPU, memory and
IO counts on a per image activation basis. The default
primary key is MODE (no secondary key).
GENERAL
A 132 column report showing process CPU, memory and
IO statistics primarily as rates. Some UAF parameters
are also provided. The default primary and secondary
keys are USERNAME and IMAGENAME.
MEMORY_RELATED
A 132 column report showing primarily process memory
related statistics. Some UAF parameters are also
provided. The default primary and secondary keys are
IMAGENAME and USERNAME.
IO_RELATED
A 132 column report showing primarily process IO
related statistics as rates. The default primary and
secondary keys are USERNAME and IMAGENAME.
CPU_RELATED
A 132 column report showing primarily process CPU
related statistics. The default primary and secondary
keys are USERNAME and IMAGENAME.
Primary Keys:
Provide:
MODE
Group process statistics by the process mode
(Interactive, Batch, Network, or Detached).
USERNAME
Group process statistics by the process's User name.
IMAGENAME
Group process statistics by the process's Image Name.
UIC_GROUP
Group process statistics by the process's UIC Group.
PROCESS_NAME
Group process statistics by the process name.
WORKLOAD_NAME
Group process statistics by the workload name. You
must specify /CLASSIFY_BY to indicate the workload
family that you intend to use.
ACCOUNT_NAME
Group process statistics by the process's account name.
PID
Group process statistics by the process's PID.
Secondary Keys:
Provide:
MODE
Process statistics detail lines by the process mode
(Interactive, Batch, Network, or Detached).
USERNAME
Process statistics detail lines by the process's User
name.
IMAGENAME
Process statistics detail lines by the process's Image
name.
Chapter 7: Use Command Mode Commands 253
REPORT
FOCUS Types:
Provide:
UIC_GROUP
Process statistics detail lines by the process's UIC
Group.
PROCESS_NAME
Process statistics detail lines by the process name.
WORKLOAD_NAME
Process statistics detail lines by the workload name. You
must specify /CLASSIFY_BY to indicate the workload
family that you intend to use.
ACCOUNT_NAME
Process statistics detail lines by the process's account
name.
PID
Process statistics detail lines by the process's PID.
Other Options:
Provide:
[NO]CLUSTER
A summary of process data for the entire cluster, scaled
by CPU speed. The default is NOCLUSTER
[NO]BY_NODE
Per node detail of cluster process data. The default is
NOBY_NODE if you specify CLUSTER.
If the value for the secondary key is the same as the primary key, no
secondary level breakout occurs. This also happens if you specify the
primary key and no secondary key is given.
The CLUSTER and BY_NODE keywords allow you to specify that the
process statistics section of the Performance Evaluation Report is to
present data combining process information for all selected nodes
(CLUSTER), and if so, whether the (BY_NODE) detail should also be
included. By default, process data is not combined for all selected nodes.
When the CLUSTER option is used, the percentage of CPU Utilization for
the data line of each process is scaled according to the processor speeds of
the nodes in the cluster. The speed ratings can be changed using an
auxiliary knowledge base.
If you specify CLUSTER or BY_NODE, a by-node breakdown of the process
data is provided following the line representing the cluster-wide data.
/SECTION=(item[,...])
Specifies which sections of the Tabular Report should be displayed. By
default, all are displayed.
For node analysis, the available sections are as follows:
■
CONFIGURATION
■
SUMMARY_STATISTICS
■
DISK_STATISTICS
■
PROCESS_STATISTICS
■
EXTENDED_PROCESS_STATISTICS
254 Performance Manager Administrator Guide
SAVE
For PROCESS_STATISTICS and EXTENDED_PROCESS_STATISTICS, the
process data must be selected with the PROCESS=ALL keyword. For
example:
PSPA> SELECT=PERFORMANCE=PROCESS=ALL
For cluster analysis, the available sections are as follows:
■
SUMMARY_STATISTICS
■
DISK_STATISTICS
SAVE
The SAVE command allows you to save a selection of graph data to a disk file
in a binary format. All graph data points are saved, and they can be reloaded
using the LOAD command. The SAVE operation does not affect the current
selection.
Format
SAVE file-spec
SPAWN
The SPAWN command creates a subprocess of the current process. Portions of
the current process context are copied to the subprocess.
Format
SPAWN [command-string]
Parameter
command-string
Specifies a command string of less than 132 characters that is to be
executed in the context of the created subprocess. When the command
completes execution, the subprocess terminates and control returns to the
parent process.
Chapter 7: Use Command Mode Commands 255
EXIT
Description
The SPAWN command creates a subprocess of your current process with the
following attributes copied from the parent process:
■
All symbols except $RESTART, $SEVERITY, and $STATUS
■
Key definitions
■
The current keypad state
■
The current prompt string
■
All process logical names and logical name tables except those explicitly
marked CONFINE or those created in executive or kernel mode
■
Default disk and directory
■
Current SET MESSAGE settings
■
Current process privileges
■
Control and verification states
Note that some attributes, such as the process's current command tables, are
not copied.
EXIT
The EXIT command returns you to the DCL command level.
Format
EXIT
@(Execute Procedure)
Format
@ file-spec
Description
The @ command causes subsequent commands to be obtained from the
specified file, instead of the user's terminal. When all the commands are
executed, command input is returned to the user's terminal.
256 Performance Manager Administrator Guide
Chapter 8: Use the DECwindows Motif
Interface
This chapter provides information about using the Performance Manager
DECwindows Motif Interface to perform Performance Manager analysis
functions.
This section contains the following topics:
Start the DECwindows Motif Interface (see page 257)
How You Control the DECwindows Interface (see page 260)
How You Select Data for Analysis (see page 266)
How You Display Analyzed Data (see page 278)
How You Customize (see page 296)
View the Main Window (see page 320)
Start the DECwindows Motif Interface
To use the windowing interface, the Performance Manager does not need to be
installed or running on a workstation. The windowing interface can be started
and directed to your workstation by setting host to the node or cluster where
the Performance Manager is installed, and issuing the commands:
$ SET DISPLAY/CREATE/NODE=mynode
$ ADVISE/INTERFACE=MOTIF
or
$ ADVISE/DECWINDOWS
Note: If the fonts required by the Performance Manager interface are not
present, a warning appears listing the expected font names. All fonts used can
be redirected to those available in your environment by modifying the
Performance Manager resource, DECPS$RESOURCES.DAT.
For any font not available, the DECwindows tool kit provides a “best fit”
substitute which may alter the intended presentation. For more information
about the Resource File, see the Installation Guide.
Chapter 8: Use the DECwindows Motif Interface 257
Start the DECwindows Motif Interface
Use the Main Window
When initiated, DECwindows Motif displays its main window, from which you
select the activity you want to perform. It reflects the status of your use of the
application and, if available, the status of data collection in your environment.
The Performance Manager Main Window lets you do the following tasks:
■
Control the DECwindows interface
■
Select data for analysis
■
Display analyzed data
■
Customize data collection, PSDC$DATABASE definition, and the
parameters file
■
View or remove specified main window sections
■
Get Help, either Contextual (specific to a widget) or General (relating to a
window)
258 Performance Manager Administrator Guide
Start the DECwindows Motif Interface
Main Window Status Information
The Performance Manager Main Window displays the following information:
PSDC$DATABASE Translation
Displays the following directory information:
■
Collection/Status-Displays the system-wide definition of the logical
name PSDC$DATABASE. If there is a data collector running on your
analysis node, this directory contains the data files produced by the
Performance Manager and the schedule file for controlling the
collection.
■
Reporting/Customizing-Displays the process definition of the logical
name PSDC$DATABASE, if it exists. If not, the job definition, group
definition, or system definition is displayed.
If you want to analyze a Performance Manager database directory other
than the system directory, you can specify an alternate directory. This
directory might contain Performance Manager data files from another
cluster or archived data whose classification definition is not applicable to
your current scheme.
Performance Manager Status
The status of the data collection process can be one of the following:
■
Running
■
Stopped
■
Down
■
Waiting due to schedule
■
Waiting for disk space
■
No path to database device
■
Unknown (user lacks SYSLCK privilege)
For more information on Performance Manager status, see the Performance
Manager Administrator Guide.
Data Selected for Processing-Displays the start and end time of the analysis
period, the processing options chosen and the nodes selected for analysis.
Until you select data, the message “No data selected” is displayed and all
display menu options are disabled.
This is a brief list of the results of an analysis of performance data. Additional
information can be gained by reviewing the Work in Progress box and the Data
Selection box.
Chapter 8: Use the DECwindows Motif Interface 259
How You Control the DECwindows Interface
Files locked by this session-Displays one of the following files:
■
Schedule file
■
Parameters file
■
No files locked
The schedule file is locked when you customize Data Collection and is unlocked
when you complete your changes.
The parameters file is locked when you customize parameters. When you
complete your changes a message box appears asking you if you want to
release the file. See the section How You Customize (see page 296) for more
information about customizing either file.
How You Control the DECwindows Interface
Pull down the Control menu and release on the menu item you want. The
Control menu lets you do the following actions:
■
Save reports
■
Monitor work in progress
■
Read the Parameters file
■
Write the Parameters file
■
Load binary graph data
■
Save binary graph data
■
Quit the DECwindows session
260 Performance Manager Administrator Guide
How You Control the DECwindows Interface
Save the Reports
To save the reports
1.
Release on the Save As... menu item to save reports.
Performance Manager displays the Save Reports dialog box. The reports
reflect the data selected for analysis as shown in the main window's Data
Selected for Processing Section. This option is disallowed if no data has
been selected or if data selection was canceled.
For details of data selection, see the section How You Select Data for
Analysis (see page 266).
Chapter 8: Use the DECwindows Motif Interface 261
How You Control the DECwindows Interface
2.
Enter a file name and select report sections you want to save.
3.
Click OK to apply your selections and save the indicated reports.
The dialog box is removed from the screen and the file created.
4.
Click Reset to redisplay the default settings if you changed settings
without applying them.
OR
Click Cancel to dismiss the dialog box without changing any settings or
saving a report.
262 Performance Manager Administrator Guide
How You Control the DECwindows Interface
Monitor the Work in Progress
To monitor the work in progress
1.
To display the Performance Manager Work in Progress dialog box, release
on Work in Progress... .
The work that is being monitored is the reading of the Performance
Manager data files and the building of the internal data structures needed
for the requested analysis.
This work is started as a result of data selection. See the section How You
Select Data for Analysis (see page 266) for information on requesting an
analysis of performance.
2.
If the analysis process is currently active, the completion percentage is
less than 100 percent. Click the Cancel Operation button to stop work in
progress and cancel data selection.
No reporting capabilities are allowed until a complete data selection is
performed.
3.
When work is complete, click the Dismiss button to clear the dialog box
from your screen.
The Main Window's Data Selected for Processing Section is updated to
reflect the new selection.
If data is missing from the selected time period, missing data messages
appear in the Work in Progress box. This is to alert you that a subsequent
examination of the selected analysis period may be incomplete or inaccurate.
The length of time required to read and analyze the selected data depends on
the options selected (such as hot file information) and the duration of time (1
hour as opposed to one day). You may want to remove the Main window and
leave only the Work in Progress box on the screen.
Chapter 8: Use the DECwindows Motif Interface 263
How You Control the DECwindows Interface
Read the Parameter File
To read the parameter file
1.
Release on the Read Parameter File... menu item,
You are prompted with the following message:
Important! By clicking YES, any changes to the parameter file that you have
made are not saved and are lost.
2.
Click YES to load and view the parameters file.
Write the Parameter File
To write the parameter file
■
Release on the Write Parameter File... menu item if you want to save
changes you have made to the file.
OR
If you have not made changes, this option is desensitized.
Load the Binary Graph Data
The Performance Manager software lets the saving of analyzed data required
to support graphing functions in a summarized format. To load one of these
files and use the graphing options, release on the Load Binary Graph Data
menu item. The Performance Manager software displays the Load Graph Data
Dialog Box.
264 Performance Manager Administrator Guide
How You Control the DECwindows Interface
To load the binary graph data
■
Specify a file to which a selection of previously saved graphing data is to
be loaded.
If you previously requested data analysis using an option from the Select
menu, access to that analysis data is lost.
Normally Performance Manager data is selected and processed prior to
performing any of the display functions available. This selection process can be
very time consuming, especially if you have activated all processing options.
If, at a later date, you want to view other graphs or pie charts associated with
the original selection, you might want to use the SAVE and LOAD graph data
features. Otherwise, the only way to recover the selected data, is to reselect.
A faster way is to SAVE the selected data so that if later review of the same
time period is required, you can use the load function for much faster retrieval
of the data.
Save the Binary Graph Data
To save the binary graph data
1.
Release on the Save Binary Graph Data menu item.
Performance Manager displays the Save Graph Data Dialog Box.
2.
Specify a file to which the currently selected graph data is to be saved in a
binary format.
All graph data points are saved, and the file can be reloaded using the
Load Graph Data Dialog Box. The save operation does not affect the
current selection.
You can also load and save this binary graph data using the DCL command
mode interface.
Chapter 8: Use the DECwindows Motif Interface 265
How You Select Data for Analysis
Quit the Session
To end a DECwindows session
1.
Click the Quit menu item.
If you have any outstanding changes to the Schedule file or the
Parameters file, you are asked if you want to save them.
2.
Click Yes to save your changes
OR
Click No to quit without saving your changes.
The interface proceeds to end of job.
How You Select Data for Analysis
The DECwindows Interface lets you analyze performance data and display
graphs, pie charts, and reports, including the Analysis Report, Performance
Evaluation Report, Tabular Report and Dump Reports. You must specify the
time period, the nodes, and the processing options desired, before these
functions can be performed.
To analyze Performance Manager data
1.
Pull down the Select menu and release on the menu item you want.
2.
The Select menu lets you specify the following data for analysis:
■
Data collected today
■
Specific data
■
Data collected during the last hour of the current day
Select Today's Data
By default, the Performance Manager selects daily data for all nodes and
analyzes data for the Analysis, Performance, and Tabular Reports and the
graphs and pie charts unless you have adjusted these options by using the
Specific Data... menu item.
The Performance Manager uses 00:00:00 of the current day as the beginning
time and the current time as the ending time and chooses the CPD collection
as the source. To select the default, release on Select Today from the Select
menu. You can override the defaults if you have a local resource file
(PSPA$SELECT.DAT) that sets your preferred defaults. See the section Data to
be Analyzed (see page 268) for a discussion of the Resource file.
266 Performance Manager Administrator Guide
How You Select Data for Analysis
Select Specific Data
Choose the Specific Data... menu item from the Select menu to specify data to
be analyzed. Performance Manager displays the Performance Manager Data
Selection dialog box.
The time period and the processing options selected affect the amount of time
needed to complete the analysis and the quantity of memory required
(generally restricted by your pagefile quota, PGFLQUO, and the system
parameter VIRTUALPAGECNT).
See the Appendix Estimate Virtual Memory Needs (see page 535) for
information on estimating virtual memory needs and selecting data.
Chapter 8: Use the DECwindows Motif Interface 267
How You Select Data for Analysis
Including each graphing sub-option expands the memory and CPU
requirements. Selecting archived data in place of daily data reduces memory
and processing time, but also reduces flexibility. The By Selected Node menu
item associated with graphing greatly increases memory requirements, as
does the number of x-points.
The Performance Manager Data Selection dialog box lets you perform the
following actions:
■
Choose type and classification of data to be analyzed
■
Set the beginning and ending date and time of the reporting period
■
Set hourly schedule within the beginning and ending date
■
Specify a Calendar file, indicating specific dates for analysis.
■
Choose processing and report options
■
Choose nodes for which data is to be reported
Data to Be Analyzed
Enter any of the following information:
Data
Specifies the source of data to be analyzed. Press MB1 on the Data option
item and a menu appears. The menu lists daily data collection definitions
in your local schedule file and history file definitions in your local
parameter file.
Release on the item you want. The option menu disappears. The menu
item you chose is now the current source for performance data. The
default data source is daily data from the CPD collection definition.
Note: Changing the source of data may change how it can be classified
and which nodes can be analyzed. If you have chosen a history file
descriptor, the Classify By options are changed to reflect those specified by
the descriptor's definition. If you choose daily data, Classify By options
reflect all workload families currently defined in the parameters file. If a
data source selection nullifies the current Classify By selection, the Classify
By selection is reset to the default of None.
For daily collection definitions, the nodes specified by the collection
definition are the only valid nodes for analysis. For this reason the source
of the data should always be chosen ahead of the classification of the data
and the nodes to be analyzed.
If you select archived data for processing, the history files will be locked,
blocking any archiving process. Also, if an archiving process is in progress,
the DECwindows interface will be suspended from reading the files until
the archiving is complete.
268 Performance Manager Administrator Guide
How You Select Data for Analysis
Classified By
Specifies how the Performance Manager is to classify process activity in
the Process Statistics Reports and in graphs presenting workload metrics.
Press MB1 on the Classify By option item and a menu appears. The menu
lists workload families. Release on the family name you want.
The default option is None, which results in the following summarizations.
All graph data will be displayed in the workload “Other.” All Process
Statistics reports will use the processing modes of Interactive, Batch,
Network, or Detached.
Period to Be Analyzed
Enter any of the following information:
Start time\End time
Hold MB1 down on any of the date and time fields to see all available
choices. Release MB1 on the desired value. Press and hold MB2 to advance
through the possible values. Press and hold MB3 to move back through the
values.
These controls are desensitized if you have enabled the calendar option
and have loaded a file of date ranges.
Press MB1 on the Set time option button and an option menu appears.
Enter any of the following options:
■
Default (today)-Specifies midnight to now.
■
Yesterday-Specifies yesterday, from midnight to midnight.
■
Most recent hour-Specifies the last 60 minutes.
■
First hour of today-Specifies the time period of 00:00 to 01:00.
■
Advance by a day-Increment the beginning and end dates by one.
■
Backup by a day-Decrement beginning and end dates by one.
■
Specify text...-Release on the Specify text... menu item to specify the
beginning and end day and time from the keyboard.
Chapter 8: Use the DECwindows Motif Interface 269
How You Select Data for Analysis
Performance Manager displays the Performance Manager Time Selection
Box.
The day and time can be entered in the format shown in the window.
Clicking on the OK button applies the start and end times and removes the
dialog box from the screen. The Reset button restores the start and end
times to those displayed in the Performance Manager Data Selection box.
Clicking on the Cancel button removes the dialog box without changing the
time fields currently displayed in the Data Selection box.
Schedule
Specifies a subset of hours within your beginning and ending reporting
period. Release on the Modify button and a Schedule Selection dialog box
appears.
A 24-hour clock is displayed. A bar on the right side of the clock lets you
scroll to each day of the week. By default, data collection is set ON for
each hour of the day, every day of the week.
270 Performance Manager Administrator Guide
How You Select Data for Analysis
To set the clock:
1.
Set or reset the square toggle button above the clock to turn data
analysis on or off for an entire day.
To turn off data collection for a specific hour, point to the hour on the
clock and click MB1. Holding MB1 down and dragging the pointer
around the clock will set data collection to the value of the initial hour
setting for a series of hours.
2.
Drag the slider on the scroll bar to display the collection schedule for
each day of the week or click the up or down stepping arrows.
To duplicate a day's schedule:
1.
Press and hold MB3 inside the clock. A pop-up menu is displayed.
Release on the Cut menu item.
2.
Scroll to another day and press MB3 inside the clock. Release on the
appropriate Paste menu item. The clock displays the copied schedule.
The OK button removes the dialog box and applies the new schedule.
Reset causes the schedule to revert to your previous selection. Cancel
removes the Schedule Selection dialog box.
Calendar
lets you specify a series of date ranges that are listed in a text file.
For example, if you wanted to generate graphs and reports for the all
Mondays in January, but wanted to substitute a Tuesday for the Martin
Luther King holiday, you could create a text file with the following entries:
04-JAN-2006 10:00, 04-JAN-2006 12:00
04-JAN-2006 14:00, 04-JAN-2006 16:00
11-JAN-2006 10:00, 11-JAN-2006 12:00
11-JAN-2006 14:00, 11-JAN-2006 16:00
19-JAN-2006 10:00, 19-JAN-2006 12:00
19-JAN-2006 14:00, 19-JAN-2006 16:00
25-JAN-2006 10:00, 25-JAN-2006 12:00
25-JAN-2006 14:00, 25-JAN-2006 16:00
The above date list indicates that the hours of 10 to 12 a.m. and 2 to 4
p.m. should be processed for the 4 days specified. Tuesday the 19th is
processed in place of Monday the 18th, a holiday.
Release on the Modify button and a Performance Manager Dates File
Selection box appears.
Chapter 8: Use the DECwindows Motif Interface 271
How You Select Data for Analysis
Enter the name of the file containing the date ranges and release on OK.
When the dates are successfully loaded, the box is removed and the Start
Time and End Time buttons are updated and desensitized. Click the
Calendar button to turn off the Dates File.
Filtering Options
Click Filter to select a subset of data for reporting and graphing. Click
Modify to change the entries for filtering.
The Selection Filters dialog box lets you select a subset of the daily or
history data for PA reports and graphs. Process data and disk data can be
filtered.
Process data can be filtered by using any of the filter entries: Usernames,
Imagenames, Processnames, Accountnames, UICs, PIDs or
Workloadnames. If a process record's identification information matches
any of the identification specified, that record is selected. When using one
or more of the process filters, the following PA reports and graphs include
only information on the selected processes:
■
Process Statistics section of the Performance Evaluation Report
■
Process and Extended Process Metrics sections of the Tabular report.
■
Hot file report (only files used by the specified processes are selected)
■
Top or Custom Username, Imagename, and Workloadname graphs
■
Top or Custom User_Volume, Image_Volume, and Workload_Volume
graphs
■
Top or Custom Hot file graphs (only files used by the specified
processes are selected)
272 Performance Manager Administrator Guide
How You Select Data for Analysis
Likewise, disk data can be filtered by using any of the filter entries:
Volumenames and Devicenames. If a device record's identification
information matches any of the volume names or device names specified,
that record is selected. When using one or more of the disk filters, the
following PA reports include only information on the selected disks:
■
Disk Statistics section of the Performance Evaluation Report
■
Disk Metrics section of the Tabular report
■
Hot file report (only files located on the specified disk are selected.)
■
Top or Custom Volumename and Devicename graphs
■
Top or Custom User_Volume, Image_Volume, and Workload_Volume
graphs
■
Top or Custom Hot file graphs (only files located on the specified disk
are selected
If you specify both a process filter and a disk filter, the hot file report
section and hot file graphs will select only hot files that are both located on
the specified disk volume, and used by the specified process. The same
will be true for the User_Volume, Image_Volume, and Workload_Volume
graphs.
The following entries allow you to select specific processes or disks for the
reports and graphs:
Usernames
Specify a list of strings (separated by commas, spaces or tabs) to generate
reports and graphs for all process records with the username matching
any of the specified strings.
Imagenames
Specify a list of strings (separated by commas, spaces or tabs) to generate
reports and graphs for all process records with the imagename matching
any of the specified strings. Do not specify any trailing ".EXE", nor the file
version, device or directory.
Processnames
Specify a list of strings (separated by commas, spaces or tabs) to generate
reports and graphs for all process records with the processname matching
any of the specified strings. The match string is case sensitive, so if the
process names have any lower case letters, spaces or tabs, use double
quotes when you enter the value; (for example,"--RTserver--").
Accountnames
Specify a list of strings (separated by commas, spaces or tabs) to generate
reports and graphs for all process records with the accountname matching
any of the specified strings.
Chapter 8: Use the DECwindows Motif Interface 273
How You Select Data for Analysis
Workloadnames
Specify a list of strings (separated by commas, spaces or tabs) to generate
reports and graphs for all process records associated with any of the
specified workloads. This filter is valid only if the Classified By option is
used to specify a classification scheme for your workload data.
Uics
Specify a list of UICs (separated by commas, spaces or tabs) to generate
reports and graphs for all process records with the UIC matching any of
the specified UICs. An asterisk may be used to wildcard either the group or
user field of the specified UICs.
Pids
Specify a list of PIDs (separated by commas, spaces or tabs) to generate
reports and graphs for all process records with the PID matching any of
the specified PIDs.
Volumenames
Specify a list of strings (separated by commas, spaces or tabs) to generate
reports and graphs for all disk records with the volumename matching any
of the specified strings. Do not specify any trailing colon.
Devicenames
Specify a list of strings (separated by commas, spaces or tabs) to generate
reports and graphs for all disk records with the devicename matching any
of the specified strings. Do not specify any trailing colon.
Process Your Options
You can enter any of the following options:
Analysis
Directs the Performance Manager to analyze the data to generate an
Analysis Report.
Performance
Directs the Performance Manager to analyze the data to generate
Performance Evaluation and Process Statistics Reports. The primary key
for presenting process statistics defaults to Interactive, Batch, Network,
Detached, or Other organization. The secondary key defaults to
Imagename.
274 Performance Manager Administrator Guide
How You Select Data for Analysis
While viewing the resulting report, an option is provided to re-sort the
process statistics.
Dumps
Specifies that the unanalyzed data will be made available for user
inspection. Since no pre-processing of the data is required for dumps, no
overhead is added to the analysis process. Refer to the CA Performance
Manager for OpenVMS Administrator Guide for more information about
dump reports.
Tabular-Final
Directs the Performance Manager to analyze data to generate the Tabular
Report sections averaged over the entire analysis period.
Report Options
Displays options for summarizing process statistics and for specifying the
reporting intervals, as shown in the following screen:
Chapter 8: Use the DECwindows Motif Interface 275
How You Select Data for Analysis
Tabular-Interval
Directs the Performance Manager to prepare interval reports summarizing
data into specified intervals. This reporting option is unavailable unless the
Final Tabular report is selected. Once selected, the reporting interval
becomes available. Performance Manager data collection for daily
performance data is recorded every two minutes. This is the default
reporting interval. This value can be adjusted by varying the supplied
value of 2 and the units value of minutes. When the analysis process is
initiated, it may override your selections for the reporting interval if it is
not a multiple of the recording interval.
Graphs
Directs the Performance Manager to analyze the data to generate all
graphs and pie charts. The options are as follows:
■
By Imagenames-Enables graphing of process statistics by imagename.
■
By Usernames-Enables graphing of process statistics by user name.
■
By Hot Filenames-Enables graphing of file statistics by file name.
■
By Disks, channels, CPUs, HSCs, workloads, SCS nodes and rulesEnables graphs for listed categories.
■
By Users/Images of Volumes-Enables graphing of process I/O statistics
by the user or image of volumes.
■
By Selected Node-Enables predefined top graphs and custom graphs
for selected nodes. The system metric graphs are always available By
node. This option greatly increases memory requirements.
■
Additional Options...-Click the Additional Options... button and the
interface displays the Performance Manager Graph Options dialog box.
The Auto Select Number of X Axis data points button is used to have the
Performance Manager choose a value that results in an even time interval
to be represented by each data point. When you disable this button, you
can specify the number of X Axis data points to plot across a graph.
As the value of X Axis data points increases, spikes and valleys become
more defined and the graph has a higher resolution. A low number of X
Axis data points produces a smoother graph because the graphing facility
may average multiple data points within the time frame specified.
276 Performance Manager Administrator Guide
How You Select Data for Analysis
Press on the Graph Averaging button and an option menu appears. The
selected data is averaged into the time period selected. For more
information on graph averaging, see the chapter “Generating Historical
Graphs."
Node Control and Toggle Buttons
By default, the Performance Manager analyzes data for all nodes in your
schedule file. Click a node's toggle button to include or exclude the node
from the processing. Clear and Set buttons are available for adjusting all
toggles.
Control Buttons
The OK button applies your selection, removes the data selection box and
activates a Performance Manager Work in Progress dialog box which
includes a real time display of the progress of the analysis procedure. See
the Controlling the DECwindows Motif Interface section for details of the
Work in Progress box.
The Cancel button closes the Data Selection dialog box and resets all
widgets.
The Reset button sets all widgets back to their settings of either the
startup defaults or the last approved selection.
Select the Last Hour
Release on the Last Hour option from the Select menu to apply the current
data selection settings, for the last hour of the day. To review what the current
data selection settings are, release on the Specific data... menu item and view
the Data Selection dialog box.
Use Custom Default Settings
You can override the default data selection settings by providing a selections
resource file, PSPA$SELECT.DAT in the DECW$USER_DEFAULTS directory area
(typically SYS$LOGIN). A sample file is provided in PSPA$EXAMPLES.
The PSPA$SELECT.DAT file will be read once when you make the first data
selection. This file can be edited with a text editor. A leading exclamation point
(!) makes a setting a comment.
Only override those items that are significant to you, as the process does slow
the activation of the Data Selection dialog box.
Chapter 8: Use the DECwindows Motif Interface 277
How You Display Analyzed Data
How You Display Analyzed Data
To display reports or graphs, pull down the Display Menu and release on the
option you want. The Display menu lets you generate the following reports:
■
Brief Analysis Reports
■
Full Analysis Reports
■
Performance Evaluation Reports
■
Process Statistics Reports
■
Tabular Reports
■
Graphs and pie charts
■
Dump Reports
For more information about dump reports, see the Performance Agent
Administrator Guide.
Until a complete data selection process has occurred, these options are
unavailable.
Brief Analysis Report
Release on the Brief Analysis menu item from the Display menu to open a
Performance Manager Analysis Report Window.
The Brief Analysis Report lists the rules that fired during the analysis period.
Click anywhere on the rule and Performance Manager DECwindows opens
another Analysis Report Window that displays the fired rule's conclusions,
conditions, and evidence.
To return to the Brief Analysis Report, pull down the File menu and release on
the Close menu item or click the Close button at the bottom of the window.
278 Performance Manager Administrator Guide
How You Display Analyzed Data
Full Analysis Report
Release on the Full Analysis menu item from the Display menu to open a
Performance Manager Analysis Report window, as shown in the following
screen:
The menu bar contains File and View menus. To close the window, pull down
the File menu and release on the Close menu item.
By default, the Full Analysis Report lists conclusions, evidence, and rule
conditions that satisfied rule firings. To remove either evidence or conditions
or both from your report, pull down the View menu and release on the
appropriate item.
To proceed through the list of nodes, click the appropriate Node arrow button
or hold MB1 down on the node button to display an option menu with the
selected nodes. Releasing on the desired node name updates the window with
that node's report.
Chapter 8: Use the DECwindows Motif Interface 279
How You Display Analyzed Data
If more than eight nodes were selected for analysis, the node option menu
contains two <more> buttons, which cause the node names to be shifted up
or down when the cursor is within their option entry. To stop the shifting,
move the cursor out of the <more> button. Releasing on a node name causes
the Analysis Report window to be updated with that node's report. Releasing
on a <more> button causes the report window to be updated with data of the
node name adjacent to the <more> button.
To proceed through the list of conclusions, click the appropriate rule ID arrow
button.
Performance Evaluation Report
Release on the Performance Evaluation menu item from the Display menu to
open the Performance Manager Performance Evaluation Window, as shown in
the following screen:
To navigate through the Performance Evaluation Report, click the Statistics
label. An option menu appears listing all of the Performance Evaluation
Reports. Release on the report section you want displayed. You can also
advance through the report by clicking on the appropriate direction arrows.
The Section label, here labeled SOURCE, changes according to the report being
viewed, and will be desensitized if irrelevant. The arrows on either side of this
label allow you to advance to other sections of the report.
280 Performance Manager Administrator Guide
How You Display Analyzed Data
Press on the Node button and an option menu appears listing the nodes for
which the report is available. Release on the node you want displayed. Only
pool statistics are available by node.
To exit from the Performance Evaluation Window, pull down the File menu and
release on Close.
To customize the Performance Evaluation Report, pull down the Customize
menu and release on the menu item you want.
The Customize menu lets you alter the hotfiles report.
Set hotfile limit..
Release on the Set Hotfile limit... menu item to display the Set Hotfile limit
dialog box containing a scale set at the current hotfile reporting count, as
shown in the following screen:
Drag the arrow to change the number of files that you want reported for
each disk device.
Control Buttons
■
The OK button applies the change and removes the dialog box.
■
The Reset button restores the value to your last selection (if you
previously changed the default) or to the default value of 20.
■
The Cancel button removes the dialog box without changing the limit.
Chapter 8: Use the DECwindows Motif Interface 281
How You Display Analyzed Data
Process Statistics
Release on the Process Statistics menu item from the Display menu to open
the Performance Manager Process Statistics Window, as shown in the following
screen:
To navigate through the Process Statistics Reports, click the Traditional Focus
label. An option menu appears listing all of the Process Statistics Reports.
Release on the report type you want displayed. You can also advance through
the reports by clicking on the appropriate direction arrows.
The Section label, here labeled INTERACTIVE, changes according to the report
section being viewed, and will be desensitized if irrelevant. The arrows on
either side of this label allow you to advance to other sections of the report.
Holding MB1 down on the section label will display all other available reports.
Releasing MB1 on the desired report name will update the Detail window.
Press on the Node button and an option menu appears listing the nodes on
which the report is based. Release on the node you want displayed.
282 Performance Manager Administrator Guide
How You Display Analyzed Data
To exit from the Process Statistics Window, pull down the File menu and
release on Close.
To customize the Process Statistics Report, pull down the Customize menu and
release on the menu item you want.
The Customize menu lets you enter any of the following:
Cluster stats by node
Release on the Cluster stats by node menu item to turn on or off the
reporting of cluster-wide process statistics by node.
Report keys...
To re-sort the process data, release on the Report keys... menu item.
Performance Manager displays the Primary and Secondary Keys dialog
box.
The Primary and Secondary keys you specify are applied when you use the
SAVE AS option to save process statistics, as shown in the following screen:
Control Buttons
■
The OK button removes the dialog box, sorts the process data, and redisplays the report.
■
The Apply button sorts the process data and re-displays the report.
■
The Cancel button removes the dialog box without changing the keys.
Chapter 8: Use the DECwindows Motif Interface 283
How You Display Analyzed Data
Tabular Report Sections
Release on the Tabular report menu item from the Display menu to open the
Performance Manager Tabular Report window, as shown in the following
screen:
To navigate through the Tabular Report, click the arrow buttons on either side
of the Configuration label. This updates the window with the Summary,
Process, Extended Process, Disk, or Server Statistics sections for node
reporting. Cluster-wide reports are also provided for summary, process, disk,
and server reports which focus on either a cluster view or a by-node view. The
window is sized to accommodate the requirements of the Summary Statistics
display. The section label changes according to what section is currently
viewed, as are the arrow buttons enabled or disabled.
Pressing the node button (labeled LATOUR in the figure) displays an option
menu with the list of selected node names for which the report can be viewed.
Releasing on a node name causes the report window to be updated with that
node's data. The arrow buttons on either side of the node button can be used
to progress sequentially through the selected nodes.
284 Performance Manager Administrator Guide
How You Display Analyzed Data
The node option menu and arrow buttons are not enabled while cluster reports
are being viewed.
The process and disk report sections can generate many screens worth of
data. When viewing these report sections the number of screens available for
viewing and the arrow buttons on either side become enabled to allow
reviewing all available data.
To exit from the Tabular Report Window, pull down the File menu and release
on Close.
Tabular Interval Report Sections
In addition to viewing the tabular report statistics summarized over the
selected analysis period, you can also view classes of statistics according to a
subinterval specified during data selection. The menu entries Node Interval
Data and Cluster Interval Data provide access to the subinterval statistics
windows. If the Tabular - Interval option was not chosen during data selection,
these menu options are desensitized.
The node statistics classes include memory, CPU, paging, IO, XQP, lock, SCS,
and process statistics. Each class appears in a separate window. If the node
selected in the parent window is changed, the interval statistics windows are
all updated with that node's data. The beginning time stamp of each interval is
included in the display.
The cluster statistics classes include memory, CPU, and lock statistics, either in
terms of minimum/maximum/average displays or by node displays.
For details on the data displayed in the different report sections, see the
chapter Evaluate Performance in Detail (see page 33).
Chapter 8: Use the DECwindows Motif Interface 285
How You Display Analyzed Data
Graphs
To view graphs or pie charts of selected data, release on the graph item of the
Display menu. The Performance Manager Graph Window is displayed, as
shown in the following screen:
Each graph has the same basic format. The components are these:
Title
The title is centered at the top of the graph and identifies the type of
graph.
Subtitle
The subtitle gives the node name (or list of node names for composite
graphs), the date and time of the selected data, the number of x-axis data
points, and the time represented by each point.
Axis Labels
Time is implied as the x-axis label. Labels on the y-axis specify the units of
the plotted values, for example, “Percent of CPU.”
X- and Y-Axis Markers
Axis markers indicate the magnitude and time of any point on the graph.
The x-markers indicate the time. The y-markers are scaled based on the
maximum value of all the data points.
286 Performance Manager Administrator Guide
How You Display Analyzed Data
Legend
The legend appears at the bottom of the graph. The legend identifies the
name of the metric, and the color or pattern associated with it.
The Performance Manager Graph Window lets you do the following:
■
Save the graph
■
Edit the graph format
■
Display predefined graphs
■
Display Top system use graphs
■
Display Custom graphs
Save a Graph
To save the graph or pie chart
1.
Pull down the File menu and release on the Save as... menu item.
The Performance Manager Save Graph or Save Pie dialog box is displayed,
as shown in the following screen:
Chapter 8: Use the DECwindows Motif Interface 287
How You Display Analyzed Data
The Save Graph or Save Pie dialog boxes allow you to do the following
actions:
■
Specify a file name
■
Select an output format
More output formats are available for graphs than for pie charts.
■
2.
Specify the title
Click OK to save the graph or pie chart to a file.
OR
Click Cancel to remove the window from the screen, with no data being
saved.
Edit the Graph Format
Pull down the Edit menu. You can change the following aspects of the graph:
Stack
Specifies that the values for each category on the graph are to be stacked.
This is the default.
Release on the button to turn Stack off. The Performance Manager
software displays a line mode graph to avoid occlusion. The values for
each category are overlaid or unstacked.
If you request an unstacked graph of top metrics, the items grouped
together are displayed as an average instead of a total.
288 Performance Manager Administrator Guide
How You Display Analyzed Data
Pie Chart
Specifies that the display is to be a pie chart. A pie chart produces a slice
for each item, using size to depict average units of measure over the
specified time period. When pie charts are displayed, stack and line mode
toggle buttons do not affect the display.
For more information, see the chapter Generate Historical Graphs (see
page 107).
Monochrome
Specifies that shades of a single color shall be used to display the graph or
pie chart.
Chapter 8: Use the DECwindows Motif Interface 289
How You Display Analyzed Data
Line Mode
Specifies that the values for each category on the graph are to be
displayed in a line mode. Click the button to turn line mode off or on.
Editing Panel
Release on the Editing Panel menu item and the Performance Manager
interface displays a Graph Panel dialog box.
290 Performance Manager Administrator Guide
How You Display Analyzed Data
The Graph Panel dialog box contains five sections that allow you to enter
any of the following:
■
Graph selection-The first option menu lets you specify a major class of
graphs to be viewed. In response, Performance Manager replaces the
entries in the second option menu with those that are appropriate for
the class you specified in the first option menu.
The graph window is updated with the first graph in the list indicated
by the major category. An exception to this is switching between the
Top User and Top Image categories, which causes the same graph
metric to be displayed.
■
Selecting the major category of custom graph updates the lower menu
with custom classes. Selecting a custom subclass, causes the custom
graph metrics dialog box to appear. For more information about
displaying custom graphs, see the section Display Custom Graphs (see
page 295).
The arrow buttons allow you to proceed through the categories in the
specified class.
If multiple nodes have been selected for graphing, access to graphs by
individual nodes is provided. Press MB1 on the CLUSTER menu entry to
view the popup menu with all selected node names. Release MB1 on
the node to be graphed. The arrow keys allow stepping through the
node names sequentially.
Access to the System graph category is always available by node. To
access the other graph categories, when the data was selected, the BY
NODE toggle button must have been set.
■
Graph format-This radio box lets you choose between a graph and a
pie chart. For graphs displaying data in terms of percentages (CPU
UTILIZATION), Performance Manager provides an additional option. If
selected, the percentage reflected in the pie is 100%, with a slice
labeled “IDLE” added to the pie chart.
■
Middle section (contains 4 buttons arranged vertically)-This panel
contains two toggle buttons for adjusting the graph presentation, a
lock for locking your settings, and a Help button.
The top toggle button flips the graph from line mode to fill mode, and
back again. The pixmap on the button reverses to be the opposite of
the state of the graph, allowing you to see where you can go.
Chapter 8: Use the DECwindows Motif Interface 291
How You Display Analyzed Data
The second toggle button changes the graph presentation from
stacked to unstacked, and back again. A stacked graph displays the
metrics one on top of another. An unstacked graph displays each
metric value with respect to the X-axis. This can cause occlusion of
some details, so it is best to view unstacked graphs in line mode.
The lock button will lock your current settings for stack/unstack,
line/fill mode, Y-axis maximum, and threshold line selection. As you
view different graphs, the same settings will be applied.
■
Y Axis maximum-Specifies a new value for Y Axis Maximum. This lets
you minimize the affect of spikes on graph presentation and to gain
consistency in graphs generated from different data selections.
You can either drag the pointer across the scale or click either side of
the value to adjust the scale. Press and hold MB1 to scroll the values.
The Y Axis Maximum value is maintained until the next data selection.
■
Threshold line-Specifies a line to be displayed on the graph reflecting
the value of the selected button. You can also specify a specific value
at which a threshold line is to be displayed.
The Max, Min, and Ave lines are available only for stacked graphs.
Change Color
Releasing MB1 on an option in the Change Color submenu causes
Performance Manager to display a color mixing dialog box. The colors you
establish are used when you save a color PostScript graph.
By Node
Releasing MB1 on a node name in the By Node submenu causes the
current graph and all subsequent graphs to be drawn for that node only.
Note: If you did not select the By Selected Node processing option in the
Data Selection dialog box, only system metrics graphs are available by
node.
All Nodes-Releasing MB1 on All Nodes causes the current graph and all
subsequent graphs to be redrawn for all nodes selected. When all nodes
are selected the graph becomes a Composite graph. See the chapter
Generate Graphs (see page 191) for more information on Composite
graphs.
292 Performance Manager Administrator Guide
How You Display Analyzed Data
Display Predefined Graphs
Pull down the Display menu to view the possible system metrics graphs.
Release on the type of graph you want. Your choice is displayed in the
Performance Manager Graph Window, as shown in the following screen:
Chapter 8: Use the DECwindows Motif Interface 293
How You Display Analyzed Data
Display Top System Use Graphs
Pull down the Display Top menu to display graphs of top system use. Point to
a Top menu item and click the submenu icon. Click a menu item in the
submenu. The graph you have chosen is displayed, as shown in the following
screen:
For more information on predefined graphs, see the chapter Evaluate
Performance in Detail (see page 33).
294 Performance Manager Administrator Guide
How You Display Analyzed Data
Display Custom Graphs
Pull down the Display Custom menu to display custom graphs. Choose the
custom graph category that you want to select. Performance Manager
interface displays a dialog box, as shown in the following screen:
You can take the following actions in this screen:
■
To move your selected option into the selections box, click a metric option.
Up to six system metrics can be selected.
■
To apply your changes and draw the graph, click the Apply button without
closing the dialog box.
■
To apply your changes and close the dialog box, click the OK button.
■
To clear all selected items, click the Reset button.
■
To close the dialog box without applying any changes, click the Cancel
button.
For most custom categories, additional items appear in the lower option box.
You can display up to six metrics when using system metrics. For other types
of metrics you can display up to six metrics when one item is chosen and up to
six items when one metric is chosen.
Chapter 8: Use the DECwindows Motif Interface 295
How You Customize
How You Customize
To select and item for customization, pull down the Customize menu and
release on the item.
The Customize menu lets you perform the following actions:
■
View and change Performance Agent settings
■
Specify or redefine the PSDC$DATABASE definition
■
View and change Performance Manager parameters
Customize the Data Collection
To view Performance Agent settings
■
Pull down the Customize menu and release on the Data Collection... menu
item.
The Performance Manager DECwindows Motif displays the Performance
Agent Collection Definition dialog box.
The primary data collection process collects performance data according to
parameters in the CPD collection definition within the schedule file. If no other
collection definitions exist, the CPD parameters will be displayed in the
Collection Definitions box, as shown in the following screen:
296 Performance Manager Administrator Guide
How You Customize
The Collection Definition dialog box lets you do the following actions:
■
Modify, create, or remove collection definitions
■
Change collection parameters
■
Change collection schedules
■
Add or remove nodes
Your changes to the Collection Definition file are applied when you pull down
the Control menu and release on Save schedule file or exit. If you change
settings and then decide not to use the changes, pull down the Control menu
and release on Load schedule file to start over with the latest version.
When you are done with this window, pull down the Control menu and release
on Exit.
Before writing out a new schedule file or releasing the lock, a message box
appears with one of the following messages:
■
(If modifications have been made:) Do you want to write out your changes
to the schedule file and release the lock?
■
(If no modifications have been made:) You have locked access to the
schedule File, do you want to release it to other users?
–
Press YES to release the lock. Your modifications, if any, are written
out.
–
Press NO to keep the lock. Your modifications, if any, are not written
out.
Modify or Create a Collection Definition
The names of the collection definitions are listed in the box at the upper lefthand corner. To select a collection definition, click the collection definition. The
definition and current parameters will appear. Use the Tab key to move
between parameter entries or point to the entry and click MB1.
Click the buttons at the bottom of the window to perform the following
actions:
Clear
Removes all the entries from display and restores all default values
Create
Adds the collection definition you have created to the list
The software displays an error message if it finds an error in your entries.
Chapter 8: Use the DECwindows Motif Interface 297
How You Customize
Modify
Updates the collection definition with your changes.
Delete
Removes the collection definition from the list and restores all default
values
Reset
Returns all the parameters on display to their original values
Change the Collection Definition Parameters
To change the collection definitions, enter any of the following parameters:
Collection Definition List
The box in the upper left-hand corner contains the names of the current
collection definitions. When you click an entry, the parameters for that
collection definition appear.
Collection name
The Collection name is a text field that shows the name of the definition
currently displayed. When creating a new definition, use this field to enter
the name. Names can be up to 20 characters in length.
Default working set
Enter the working set quota. This value is a decimal number greater than
1024 that sets both the working set quota and the working set extent if
the value is higher than the default values. By default, the working set
quota is 2048 and the working set extent is 20K. You can override this
default by specifying values for individual nodes.
Default minimum space
Enter the minimum number of blocks of free disk space needed on each
database disk for each node in the definition. Data collection suspends
recording if there are fewer blocks of free disk space available. You can
override this default by specifying values for individual nodes.
Default database path
The default database path for all nodes in the collection definition. You can
override this default by specifying values for individual nodes.
298 Performance Manager Administrator Guide
How You Customize
Node Definition Section
This displays the nodes in a collection definition. Default values are
displayed. Although the changes that you make appear as they are made,
they are not applied to the collection definition until you click the Create or
Modify buttons at the bottom of the window.
To add a node, enter the name and make any modifications you want to the
default values shown to the right. Then press Return or click Enter.
To modify a node entry, double-click it. The definition appears under the list.
Make the changes you wish and then press Return or click Modify to the left of
the box.
To delete one or more nodes, click the entries in the list, and then click Delete
to the left of the box.
To change the order of the nodes in the list, click the node to be moved, and
then the arrows in the right-hand corner. Only one node can be moved at a
time.
The changes you make in the node definition section do not modify the
collection definition until you click Create or Modify to update the entire
collection definition.
Enter
Enter lets a new node to be added to the node list. When you type in a
new node name, you can click Enter or press Return to add it to the list.
Modify
Modify takes changes you make to a node definition and puts the changes
into the list. Modify is disabled until you have selected a node from the list
by double-clicking on the node. Changes to the collection definition take
effect when you click Modify at the bottom of the window.
Delete
Delete removes any selected, or highlighted, nodes from the list. The
nodes are removed from the collection definition when you click Modify at
the bottom of the window.
Chapter 8: Use the DECwindows Motif Interface 299
How You Customize
Hot file queue
To enable hot file collection in the CPD collection definition, the toggle
button to the left must be on. This lets you specify the queue length in the
text entry box. This pertains only to the CPD collection definition because
only the primary data collector collects hot file data.
Enter the minimum average queue size that a disk must have to start
collecting the hottest files for that disk. This value is a decimal number less
than 100.00 and greater than or equal to 0.00. The default is 0.33.
If the toggle button is off, no hot file data is collected.
If the toggle button is on, you must specify a queue length or accept the
default value.
Collection interval
The Collection interval specifies the number in seconds in a sampling
interval. At the end of this time period, data is recorded into an interval
record.
The CPD collection definition has an interval of 120 seconds which cannot
be modified.
You can specify an interval from 1 to 3600 seconds for other definitions.
Delete files after
Enter the number of days that data is to be retained. The default is seven
days for the primary data collector. Data files are automatically deleted
from the database when they are older than the specified number of days.
For alternate data collectors, the default is 99,999 days which lets you
control the how long data files are retained.
This value should be coordinated with any data archiving and the amount
of free space required for the database area. For information on archiving,
see the Performance Agent Administrator Guide.
Start date
The date and time on which the collection definition goes into effect. A
data collection process will hibernate until this date and time. The
formatting is as follows: DD-MMM-YYYY HH:MM
End date
The date and time on which a data collection process Is to terminate. The
formatting is as follows: DD-MMM-YYYY HH:MM
300 Performance Manager Administrator Guide
How You Customize
Changing the Collection Schedule
A 24-hour clock is displayed. A bar on the right side of the clock lets you
scroll to each day of the week. By default, data collection is set ON for
each hour of the day, every day of the week.
To set the clock:
1.
Set or reset the square toggle button above the clock to turn data
collection on or off for an entire day.
To turn off data collection for a specific hour, point to the hour on the clock
and click MB1. Holding MB1 down and dragging the pointer around the
clock will set data collection to the value of the initial hour setting for a
series of hours.
2.
Drag the slider on the scroll bar to display the collection schedule for each
day of the week or click the up or down stepping arrows.
To duplicate a day's schedule
1.
Press and hold MB3 inside the clock. A pop-up menu is displayed. Release
on the Cut menu item.
2.
Scroll to another day and press MB3 inside the clock. Release on the Paste
menu item. The clock displays the copied schedule.
Class Coverage Section
The Class Coverage section lets you specify which major areas of
performance data should be collected. While the CPD can not be limited,
other collection definitions can be limited to only those classes of data
needed for special-purpose analysis.
The toggle buttons enable you to choose all or selected classes.
All classes
Turn on this toggle button to collect all classes of data.
Selected classes
Turn on this toggle button to choose which classes of data you wish to
collect: processes; IO data; or metrics.
Chapter 8: Use the DECwindows Motif Interface 301
How You Customize
Processes
Turn on this toggle button to collect Process data or to collect process data
for specified processes.
IO data
Turn on this toggle button to collect IO data or to collect IO data on
specified devices.
Metrics
The Metrics field lets you choose whether or not to collect a summary set
of system metrics including such data items as memory utilization, CPU,
and I/O parameters.
All processes
When you select the collection of process data, the All Processes option is
collected by default. If you have modified the process list, the menu is
revised to reflect the type of coverage list (include or exclude) and the
count of specified processes. Clicking on this menu will display the correct
list. This menu provides a convenient way to view the coverage list.
Modify process list...
Click this button to specify a list of processes in the Collection Coverage
List box. You specify a list of processes to be included in collection or
excluded from collection.
All devices
When you select the collection of IO data, the All Devices option is
collected by default. If you have modified the device list, the menu is
revised to reflect the type of coverage list (include or exclude) and the
count of specified devices. Clicking on this menu will display the correct
list. This menu provides a convenient way to view the coverage list.
Modify device list...
Click this button to specify a list of devices in the Collection Coverage List
box. You specify a list of devices to be included in collection or excluded
from collection.
302 Performance Manager Administrator Guide
How You Customize
Coverage Lists
For Process and Disk classes, you can collect data for specific lists of items
or exclude lists of items.
To create a list of processes, push down and hold on the uppermost box in this
window, which displays All processes or one of the other options. When the
menu appears, pull down to the menu item you want and release.
Click the text entry field to activate the cursor.
To add a process name, enter a name and press Return or click the Enter
button. The name will appear in the list box and be cleared from the text entry
field.
To delete a name, click the name in the name list box, then click the Delete
button. The name is removed from the list box. To remove multiple names,
click the names and then click the Delete button.
Chapter 8: Use the DECwindows Motif Interface 303
How You Customize
To create a list of devices, push down and hold on the uppermost box in this
window, which displays All devices or one of the other options. When the
menu appears, pull down to the menu item you want and release.
Click the text entry field to activate the cursor.
To add a device name, enter a name and press Return or click the Enter
button. The name will appear in the list box and be cleared from the text entry
field.
To delete a name, click the name in the name list box, then click the Delete
button. The name is removed from the list box. To remove multiple names,
click the names and then click the Delete button.
304 Performance Manager Administrator Guide
How You Customize
The following sample Collection Coverage List box shows a list of processes for
which no data is to be collected.
The type of list being managed cannot be converted. For example, an include
processes list cannot become an exclude processes list. All list entries must be
deleted before the coverage list type can be changed.
Customize the PSDC$DATABASE Definition
To specify or redefine a PSDC$DATABASE definition, pull down the Customize
menu and release on the PSDC$DATABASE definition... menu item.
DECwindows Motif displays the Set Database dialog box. This box lets you
redirect editing and review of dump reports to an alternate database area. You
can also redirect performance analysis to an alternate area.
The translation of the lowest level definition is displayed, along with a toggle
setting indicating the logical name table in which it is defined.
Chapter 8: Use the DECwindows Motif Interface 305
How You Customize
To remove a definition, click Deassign. The dialog box is removed, and the
definition at the next highest level goes into effect, possibly reloading a
schedule and parameter file.
To create a new definition, click a toggle to specify which logical name table
the definition should be placed in and type in the new definition. Click OK
when done. The dialog box is removed and any new schedule and parameter
files are loaded. There must be at least one definition of PSDC$DATABASE
defined for the interface to run.
Customize Parameters
The DECwindows Motif Interface lets you view and change the Performance
Manager parameters file. The Performance Manager Parameters file contains
workload definitions, family definitions, history file descriptors, and auxiliary
knowledge base information.
See the Performance Agent Administrator Guide for more discussion of these
definitions.
Start Parameter Editing
To edit parameters
1.
Pull down the Customize menu in the Performance Manager Main Menu.
2.
Click the pointer on the Parameters menu item.
3.
Choose a menu item from that submenu.
Only one user at a time is allowed to edit data in the parameter file
PSDC$PARAMS.DAT. The file is locked by anyone using any editor. If the file is
locked by another user when you initiate any of the parameter menu's
submenus, a message box appears explaining that read-only access to the file
is allowed. You are able to view the contents of the file, but any requests to
change data are denied. Should the file become unlocked during the course of
your DECwindows Motif session, a second message box appears asking you if
you would now like update capabilities. Indicate your choice by clicking on
either Yes or No.
306 Performance Manager Administrator Guide
How You Customize
Once you have gained update access to the file, it is unavailable to other
users. Whenever you close one of the parameter editor's dialog boxes, you are
asked if you would now like to release the file.
When you have completed your set of changes to the file, click Yes in response
to this request. Otherwise, as long as your DECwindows Motif session remains
active, even though you may be doing other tasks, such as graphing, you still
have the file locked.
A reminder of the status of the parameter file appears in the main window.
Chapter 8: Use the DECwindows Motif Interface 307
How You Customize
Workload Definitions
To create or modify workload definitions in the parameters file, pull down the
parameter submenu and choose the Workload Definitions menu item. The
Performance Manager displays the Workload Definitions dialog box, as shown
in the following screen:
The menu bar contains Control and Help menus. A list of defined workload
definitions appears at the top of the dialog box. To close the dialog box, pull
down the Control menu and click the Exit menu item. The Workload Definitions
dialog box lets you do the following:
■
Create a workload definition
■
Delete a workload definition
■
Modify a workload definition
308 Performance Manager Administrator Guide
How You Customize
Create a Workload Definition
Use the following options to create workload definitions.
Workload name
Enter the name of the workload definition. The workload definition's name
is limited to 20 characters.
Workload is unique by
lets you specify a category for workload summarization. A workload will be
defined for each unique element of the category you choose.
Click the Workload is unique by toggle button and then click MB1 on the
box beneath this that displays Account name when first accessed. The
option menu will appear displaying the following items:
■
Account name
■
Process name
■
Image name
■
UIC group
■
User name
■
PID
Click MB1 on the category you want.
Include these processes
Set the toggle buttons to specify the processing modes to be included by
the workload definition.
■
Interactive
■
Batch
■
Network
■
Detached
Process base priority
Enter the minimum and maximum values for the process' Base Priority to
be included in the definition. Values can range from 0 to 31 and the
minimum value must be less than or equal to the maximum.
Workload is defined by sets of items
Selects the alternative to “unique by” criteria. lets you enter lists of user
criteria, or images, or both for defining a workload.
Matching requirement:
This is an option menu with two entries. Press MB1 on the current setting
to view the choices.
Chapter 8: Use the DECwindows Motif Interface 309
How You Customize
Either images or users
Indicates that the Performance Manager will match either the image
names or the user criteria of a process record to include the process data
in the workload.
Both images and users
Indicates that the Performance Manager must match both the image
names and the user criteria of a process record to include the process data
in the workload.
Transaction units
This is an option menu with two entries. Press MB1 on the current setting
to view the choices. Click either image termination or terminal responses
to indicate how response time should be evaluated. This will affect the
workload frequency when building a model. See the ADD/WORKLOAD
command in the CA Performance Management for OpenVMS Agent
Administrator Guide for information about transaction units.
Images
Click the text entry field to activate the text insertion cursor.
To add an Image name, enter a name and press Return or click the Enter
button. The name will appear in the list box and be cleared from the text
entry field. If you wish to preserve lower case characters, enclose image
names in double quotes when you enter them.
To delete an Image name, click the name in the image name list box, then
click the Delete button. The name is removed from the list box. To remove
multiple names, click all their names and then click the Delete button.
A list of image names can be provided through a file. Use the at sign (@)
as the first character to indicate that the text is to be interpreted as a file
name. The default directory is assumed if not supplied, as is a file type of
.DAT. The format of the file must be a series of image names separated by
white space or commas. Supply only the filename field; do not include the
file type.
Image names can contain wildcard characters. Image names can contain
up to 39 characters. If you wish to preserve lower case characters, enclose
image names in double quotes when you enter them.
310 Performance Manager Administrator Guide
How You Customize
Users
Press MB1 on the Users option menu to view the categories available.
Release MB1 on the entry indicating the type of user you want to create.
You cannot create a list until you make this selection.
To add a user field, enter the appropriate string and press the Return key
or click the Enter button. The field will appear in the list box and be
cleared from the text entry field.
To delete a user field, click the entry in the user list box, then click the
Delete button. The entry is removed from the list box. To remove multiple
entries, click all entries to be deleted the fields and then click the Delete
button.
A list of user entries can be provided through a file. Use the at sign (@) as
the first character to indicate that the text is to be interpreted as a file
name. The default directory is assumed if not supplied, as is a file type of
.DAT. The format of the file must be a series of user fields separated by
white space or commas.
User names can contain wildcard characters. User names longer than 12
characters are truncated to 12 characters to ensure a match because the
Performance Agent compares up to 12 user name characters only. Account
names can be up to 8 characters in length, and process names up to 15. If
you wish to preserve lower case characters, enclose your entries in double
quotes.
User criteria can be specified in terms of UICs, account names, process
names, or user names.
A UIC group can be indicated by using an asterisk for the user number,
([200,*]).
Control Buttons
The Clear button removes all dialog box entries.
The Create button adds the workload name to the list and clears the
entries.
Chapter 8: Use the DECwindows Motif Interface 311
How You Customize
Delete a Workload Definition
To delete a workload definition
1.
Click a workload definition name.
The dialog box is updated to show the current definition field settings.
2.
Click the Delete control button to remove the workload definition.
The Performance Manager removes the workload definition name from the
workload list and clears the definition fields. If the definition is not deleted,
a message box is displayed, explaining why the request cannot be
executed. A failure can occur when a workload family has been defined in
terms of this workload. A list of those families displays.
3.
Modify the workload family to remove the reference to this workload
definition.
Modify Workload Definitions
To modify a workload definition
1.
Click a workload definition name.
The dialog box will display the current definition values.
2.
Modify settings as you wish and click Modify at the bottom of the box.
312 Performance Manager Administrator Guide
How You Customize
Workload Family Definitions
To define or modify workload families
1.
Pull down the Parameters submenu and choose the Workload Families...
menu item.
Performance Manager displays the Workload Family Definitions dialog box,
as shown in the following screen:
The menu bar contains Control and Help menus. A list of workload family
names appears at the top of the dialog box.
2.
To close the dialog box, pull down the Control menu, drag the pointer to
the Exit menu item and release MB1.
The Workload Family Definitions dialog box lets you do the following actions:
■
Create a workload family
■
Delete a workload family
■
Modify a workload family
Chapter 8: Use the DECwindows Motif Interface 313
How You Customize
Create a Workload Family
To create a workload family
■
Enter any of the following parameters:
Family Name
Enter the name of the workload family. The family name is limited to 20
characters.
Workload Specification
The Workloads Excluded list box contains a list of workload definitions. To
add a workload definition to a workload family, click the workload name
and click the Include transfer button (right arrow).
To indicate a position within this included workload list, click an existing
entry in the Workloads Included list box. All new workload definitions will
be placed ahead of this entry. To deselect a position entry, click it again.
All new entries will be placed at the end. The position of a workload within
a family can determine which workload will include a transaction. When a
transaction qualifies for more that one workload, it will be included in the
first listed matching workload.
To add multiple workload definitions, click all their names contained in the
Excluded list box. Then click the Include transfer button.
The Workloads Included list box contains a list of workload definitions in
the new workload family. To remove an entry from the INCLUDED list box,
click the name and click the Exclude transfer button (left arrow). To delete
multiple workload definitions, click all their names and then click the
Exclude transfer button.
Control Buttons
To remove all entries and cancel the definition, click the Clear button.
To add a family definition to the defined list and clear the entries, click the
Create button.
Modify or Delete a Workload Family
To modify a workload family
1.
Click a family name.
The family name and the Workload Included list box display the definition
of the selected family.
2.
Enter any of the following parameters:
Family Name
When you modify a family name, the Performance Manager assumes
that you want to create a workload family based on the displayed
definitions.
314 Performance Manager Administrator Guide
How You Customize
Workload Specifications
The Workloads Excluded list box contains a list of workload definitions
that are not part of this family. To add a workload, click the workload
definition name and click the Include transfer button (right arrow). To
add multiple workload definitions, click all their names contained in the
Excluded list box. Then click the Include transfer button.
To indicate a position within this included workload list, click an
existing entry in the Included list box. All new workload definitions will
be placed ahead of this entry. To deselect a position entry, click it
again. All new entries will be placed at the end.
The Workloads Included list box contains the names of the workload
definitions in the family. To remove an entry from the Included list
box, click the name and click the Exclude transfer button.
Control Buttons
■
The Clear button removes all entries.
■
The Modify button applies the changes and clears the entries.
■
The Delete button removes the selected family name and its
definition.
■
The Reset button redisplays all entries for the current family
definition.
Chapter 8: Use the DECwindows Motif Interface 315
How You Customize
History File Descriptors
To create, modify, or delete history file descriptors in the parameters
file
1.
Pull down the Parameter submenu and choose the History File Descriptors
menu item.
The Performance Manager displays the History File Descriptors dialog box.
The menu bar contains Control and Help menus. A list of history file
descriptors appears at the top of the dialog box.
2.
To close the dialog box, pull down the Control menu and click the Exit
menu item.
316 Performance Manager Administrator Guide
How You Customize
The History File descriptor dialog box lets you do the following actions:
■
Create a history file descriptor
■
Delete a history file descriptor
■
Modify a history file descriptor
For a detailed description of history file descriptors, see the Performance Agent
Administrator Guide.
Create a History File Descriptor
Enter any of the following parameters:
History Descriptor
Enter the name of the history file descriptor. The descriptor name is
limited to 20 characters.
Data Reduction Scheme
By default, the granularity value is monthly. Click and hold the pointer on
monthly and the granularity pop-up menu displays a list of value options.
Release the mouse button when the cursor is on your choice. The pop-up
menu disappears and your selection is displayed.
By default, the periodicity value is None. Click and hold the pointer on the
current value and the periodicity pop-up menu displays a list of value
options. Release the mouse button when the cursor is on your choice. The
pop-up menu disappears and your selection is displayed.
By default, the interval value, the time period over which the Performance
Manager averages daily data records into a single history data record, is
60 minutes. To display valid entries, click the up or down arrow. When
your selection is displayed, click the value. Your choice will be highlighted.
Archive Schedule
A 24-hour clock is displayed. A bar on the right side of the clock lets you
scroll to each day of the week. By default, archiving is set on for 24 hours
a day, seven days a week, including holidays.
To set the clock:
1.
Set or reset the square toggle button above the clock to turn archiving on
or off for an entire day.
2.
To turn archiving off for a specific hour, point to the hour on the clock and
click MB1. Holding down MB1 and dragging the pointer around the clock
will turn off archiving for a series of contiguous hours.
3.
Drag the slider on the scroll bar to display the archiving schedule for each
day of the week or click the up or down stepping arrows.
Chapter 8: Use the DECwindows Motif Interface 317
How You Customize
To duplicate a day's schedule
1.
Press and hold MB3 inside the clock. A pop-up menu is displayed. Release
on the Cut menu item.
2.
Scroll to another day and press MB3 inside the clock. Release on the Paste
menu item. The clock displays the copied schedule.
Workload Classification
By default, Performance Manager stores process data in the history file
summarized by workload families. To save modeling data in the history
file, click the model data (unlimited) button. When model data is enabled,
no workload families can be selected and raw process data will be
preserved. Specific classification can then be done when the archived data
is processed.
If you choose Classify by Families without specifying the workload families,
process data will be summarized into four records representing interactive,
batch, network, and detached processing. All other process data will be
lost such as process data based on image name, account name, and so on.
Workload Families Excluded
The Workload Families Excluded list box contains a list of workload
families. To add a workload family to a history file definition, click a
workload family name and click the transfer button.
To add multiple workload families, click all their names contained in the
Excluded list box. Then click the transfer button.
Workload Families Included
The Workload Families Included list box contains a list of workload family
names. These names specify the workload families that define the new
history descriptor. To remove an entry from the Included list box, click the
name and click the transfer button.
Control Buttons
■
The Clear button removes all entries and cancels the definitions.
■
The Create button adds the family definitions to the defined list and clears
the entries.
318 Performance Manager Administrator Guide
How You Customize
Delete a History File Descriptor
To delete a history file descriptor
1.
Click a defined history file descriptor name.
The dialog box displays the current definition values.
2.
Click the Delete button to remove the history file descriptor.
Performance Manager removes the descriptor name from the history file
descriptor list and clears the definition fields. If the history file descriptor is
not deleted, a message box displays explaining why your request was not
executed. A failure occurs when history files are created from this
definition; a list of these history file names displays.
3.
Delete the files, then remove the definition.
Modify a History File Descriptor
To modify a history file descriptor
■
Click a defined history file descriptor name.
The dialog box displays the current definition values. You can modify only
the archive schedule.
Control Buttons
■
The Clear button removes all entries and cancels the modifications.
■
The Modify button applies the changes and clears the entries.
■
The Delete button removes a selected family definition.
■
The Reset button redisplays the current family definition.
Parameter Settings
To view parameter settings
1.
Pull down the Parameters submenu and choose the Parameter Settings
menu item.
Performance Manager displays the Parameter Settings dialog box, as
shown in the following screen:
Chapter 8: Use the DECwindows Motif Interface 319
View the Main Window
Highlighted buttons indicate the current settings. Your changes in the
Parameter Settings box are applied when you click OK or Apply.
2.
Click the Reset button to restore the last settings that have been applied.
OR
Click the Cancel button to close the dialog box without applying any
changes.
3.
From the Parameter Settings dialog box, you can set any of the following
parameters:
Auto Augment
Click the ON button to establish automatic augmentation of an auxiliary
knowledge base for analysis. The initial setting is OFF.
When auto augment is set on, the dialog box lets you enter the file
specification of the compiled auxiliary rules file.
For more information, see the SET AUTO AUGMENT command described in
the Performance Agent Administrator Guide.
Version Limit
Enter a decimal number to modify the file version limit on the Performance
Manager parameters file and history files. The initial setting is 180.
View the Main Window
To view the main window
■
Pull down the View menu and choose the Main Window sections you want
to display.
Depending on your processing mode, not all the sections in the Main window
may be relevant or of interest. To allow for smaller windows and the
elimination of distracting sections, the View menu contains a series of toggle
buttons that can be set or reset to add or remove sections of the Main window.
Resetting a toggle button causes a section to disappear; setting it restores the
section. Do not remove the File Locks section if you share editing access of
database files with other users.
320 Performance Manager Administrator Guide
Chapter 9: Use the DECwindows Motif
Real-time Display
This chapter provides information about the use and basic modification of the
default displays supplied with the Performance Manager real-time display.
These predefined displays consist of windows or instrument panels containing
bar graphs, strip charts, or meters. These instruments are used to view
OpenVMS system performance statistics.
To access performance data for use with the Real-time Display, you must have
the Performance Manager installed and access to the data established for the
target node using proxies or network objects. Refer to the Performance Agent
Administrator Guide for more information. To use the Real-time feature with
DECnet Phase V when Phase V Node Synonyms are not defined, you will need
to create a node name translation file and use the /DNS_NAME qualifier. For
more information on this logical name, PSPA$DNS_NAMES, and the translation
file, refer to the appendix Performance Manager Logical Names (see
page 405).
This section contains the following topics:
Start the Real-time Display (see page 321)
Control the Real-time Display (see page 322)
Navigate Within the Default Panels (see page 323)
Use the Panel Commands Menu (see page 324)
Default Panel Descriptions (see page 324)
Review Data in Playback Mode (see page 337)
Set the Thresholds and Ranges (see page 338)
Change the Colors and Patterns (see page 339)
Start the Real-time Display
To start the Real-time Display
■
Enter the following command:
$ ADVISE PERFORMANCE DISPLAY WINDOW _$ /MODE={NETWORK|DISKFILE}/NODE=(nodename[,...])
For more information about command syntax, see the chapter Performance
Manager Commands (see page 175).
Chapter 9: Use the DECwindows Motif Real-time Display 321
Control the Real-time Display
Note: The output for the Real-time Display must be directed to your display
using the DCL SET DISPLAY command. For more information on starting
Performance Manager Real-time and a complete description of all parameter
options, see the chapter Customize the DECwindows Motif Real-time Display
(see page 341).
The Real-time Display shows the following default panel on your display:
If the primary Performance Manager is not running on the monitored system,
or the Real-time data collector is unable to start, an informational message is
displayed. The Performance Agent Administrator Guide describes the steps
that the system manager needs to take to enable data collection for a user.
Control the Real-time Display
In addition to the initial default instrument panels, an icon for the Panel
Manager is displayed when you start the Real-time Display. To display the
Panel Manager, double-click the Real-time Display icon.
The Panel Manager is the control point for the Real-time Display:
■
To stop the display, including the Panel Manager and all other panel
windows that are invoked, choose the Exit menu item from the File menu
in the Panel Manager menu bar
■
To display previously recorded data, choose the Playback item from the
File menu.
322 Performance Manager Administrator Guide
Navigate Within the Default Panels
The Panel Manager lists the panels available to you. When you install
Performance Manager for the first time, the list contains the names of all the
default panels distributed with the Performance Manager.
Navigate Within the Default Panels
The Real-time Display default instrument panels facilitate a progressive
disclosure style of investigation in which increasingly detailed data is
presented to you. You inquire about a particular resource by double-clicking on
the resource name displayed. This process is known as launching. You are
then presented with panels of information about the use of the resource: the
top users or processes requiring the resource, for example. If you need more
detail, you can launch additional panels by double-clicking on a field in the
instrument.
You can determine if the panel launch capability of the Real-time Display is
enabled for an instrument by moving the pointer over the graph or label
displayed within the instrument. The pointer changes to a plus sign if more
information is available for this performance metric. For example, the four
graphs displayed in the System Overview panel are entry points for disclosing
additional information on CPU utilization, page faulting, and disk I/O activity.
Moving the pointer into the graphs causes the pointer to change shape,
informing you that a double-click operation here causes a new panel to be
displayed.
To close a panel
■
Choose the Close menu item from the File menu.
Chapter 9: Use the DECwindows Motif Real-time Display 323
Use the Panel Commands Menu
Use the Panel Commands Menu
To specify commands
■
Pull down the Commands menu and release on the menu item you want.
You can choose any of the following commands:
Connect
Connects instruments to online data.
Disconnect
Disconnects instruments from online data.
Set Interval...
Changes the update frequency of data in an instrument panel (default
of 10 seconds). The interval is specified in minutes and seconds. The
instrument panel must be disconnected before this option is available.
Default Panel Descriptions
The default panels within the Real-time Display alert you to potential
performance problems in any of the following four major resource categories:
■
CPU utilization
■
CPU queuing
■
Memory page faulting
■
Disk I/O activity
When the Real-time Display is started, the System Overview default panel is
displayed, which provides a summary for these four performance indicators.
System Overview
The System Overview Panel is the control panel for accessing information on
any of these key system resources using the panel launch capability of the
Real-time Display. The following table provides the panel information:
Label
Metric
Units
Next Panel
CPU Utilization
CPU utilization
Percentage (100%
maximum)
CPU
CPU Queue
Computable queue
length
Process count
324 Performance Manager Administrator Guide
Default Panel Descriptions
Label
Metric
Units
Next Panel
Hard Fault Rate Hard page fault rate
Faults per second
Page Faults
Disk IO/second Total disk I/O
operation rate
Operations per second Disk
To navigate from one level of panels to the next, double-click a label shown on
a panel.
Default Panel Hierarchy
The following table shows the hierarchy of the default panels:
Resource
Level 2 Panel
Level 3 Panel
Level 4 Panel
CPU Utilization
CPU
CPU Modes
--
User CPU
Process CPU
Image CPU
CPU Queue
Process Wait
Image CPU
--
Hard Fault Rate
Page Faults
Fault Rates
--
User Faults
Process Faults
Memory
Memory Allocation
User Memory
Page File Allocation
Disk IO/second
Disk
Volume Info
--
Disk Info
--
Each of the panels accessed from the System Overview panel are discussed in
the following sections.
CPU Utilization Panel Descriptions
The CPU Utilization graph on the System Overview panel lets you access the
following panels:
■
CPU
■
CPU Modes
■
User CPU
Chapter 9: Use the DECwindows Motif Real-time Display 325
Default Panel Descriptions
■
Process CPU
■
Image CPU
This series of panels lets you investigate the use of the CPU on the monitored
system. You can investigate the top users of the CPU and view what processes
and images each user is executing.
The following tables describe the information presented within each panel:
CPU Panel
Label
Metric
Units
Next Panel
CPU Utilization
CPU utilization
Percentage
(100%
maximum)
CPU Modes
CPU Only
CPU is busy and no disk
I/O is busy
Percentage
--
CPU & I/O Busy
CPU is busy and disk I/O
is also busy
Percentage
--
I/O Only
Disk I/O is busy when
CPU is not busy
Percentage
--
CPU & I/O Idle
CPU and I/O are not busy
Percentage
--
Top Users (list)
CPU Utilization by User
Percentage
User CPU
Label
Metric
Units
Next Panel
Int
Interrupt mode time
Percentage
--
MP
MultiProcessor
synchronization mode
time
Percentage
--
Ker
Kernel mode time
Percentage
--
Exc
Executive mode time
Percentage
--
Sup
Supervisor mode time
Percentage
--
Usr
User mode time
Percentage
--
Cmpt
Compatibility mode time
Percentage
--
CPU Modes Panel
326 Performance Manager Administrator Guide
Default Panel Descriptions
User CPU Panel
Label
Metric
Units
Next
Panel
CPU Utilization
(with history)
CPU utilization
Percentage
--
CPU Utilization
(current)
CPU utilization
Percentage
--
Direct IO Rate
Direct I/O for this user
Operations per
second
--
Disk IO Rate
Disk I/O for this user
Operations per
second
--
Disk Thruput
Disk throughput
Kilobytes per
second
--
Hard Fault Rate
Hard page fault rate
Faults per second
--
Soft Fault Rate
Soft page fault rate
Faults per second
--
Buf I/O Rate
Buffered I/O rate
Operations per
second
--
User Processes
(list)
CPU utilization by process
for this user
Percentage
Process
CPU
User Images
(list)
CPU utilization by image
for this user
Percentage
Image CPU
Label
Metric
Units
Next
Panel
CPU Utilization
(with history)
CPU utilization for this
process
Percentage
-(100% maximum)
CPU Utilization
(current)
CPU utilization for this
process
Percentage
-(100% maximum)
Direct IO Rate
Direct I/O for this process Operations per
second
--
Disk IO Rate
Disk I/O for this process
Operations per
second
--
Disk Thruput
Disk throughput
Kilobytes per
second
--
Hard Fault Rate
Hard page fault rate
Faults per second
--
Process CPU Panel
Chapter 9: Use the DECwindows Motif Real-time Display 327
Default Panel Descriptions
Label
Metric
Units
Next
Panel
Soft Fault Rate
Soft page fault rate
Faults per second
--
Buf I/O Rate
Buffered I/O rate
Operations per
second
--
Wssize
Working Set size for this
process
Pages
--
Wsdefault
Working set default
setting for this process
Pages
--
Wsquota
Working set quota setting Pages
for this process
--
Wsext
Working set extent
setting for this process
Pages
--
Private
Private memory size for
this process
Pages
--
Global
Global memory size for
this process
Pages
--
Virtual Addr
Virtual address size for
this process
Pages
--
User Name
User name for this
process
Alphabetic
--
Account
User account for this
process
Alphabetic
--
Process ID
Process ID (PID) for this
process
Numeric
--
Image Name
Current image name for
this process
Alphabetic
--
Process State
Current process state
Alphabetic
--
Process Priority
Current priority for this
process
Numeric
--
Base Priority
Base priority for this
process
Numeric
--
328 Performance Manager Administrator Guide
Default Panel Descriptions
CPU Queue Panel Descriptions
The CPU Queue graph on the System Overview panel lets you access the
following panels:
■
Process Wait
■
Image CPU
This series of panels lets you investigate the cause of high CPU queues on the
monitored system. You can investigate the top images using the CPU.
The following tables describe the information presented within each panel:
Process Wait Panel
Label
Metric
Units
Next Panel
Computable
Process Count
(with history)
Number of processes in
COM queue
Count
--
Total Processes
Number of processes
scheduled
Count
--
Computable
(current)
Number of processes on
COM queue
Count
--
Hibernating
Number of processes in
HIB state
Count
--
LEF Wait
Number of processes in
LEF state
Count
--
Page Fault Wait
Number of processes in
PFW state
Count
--
Top Images (list) CPU utilization of top
images
Percentage
Image CPU
Label
Metric
Units
Next Panel
CPU Utilization
(with history)
CPU utilization for this
image
Percentage
--
CPU Utilization
(current)
CPU utilization for this
image
Percentage
--
Direct IO Rate
Direct I/O for this image
Operations per
second
--
Image CPU Panel
Chapter 9: Use the DECwindows Motif Real-time Display 329
Default Panel Descriptions
Label
Metric
Units
Next Panel
Disk IO Rate
Disk I/O for this image
Operations per
second
--
Disk Thruput
Disk throughput
Kilobytes per
second
--
Hard Fault Rate
Hard page fault rate
Faults per
second
--
Soft Fault Rate
Soft page fault rate
Faults per
second
--
Buf I/O Rate
Buffered I/O rate
Operations per
second
--
CPU Utilization
(list)
CPU Utilization for image
by user
Percentage
--
Pages
Total Mem Pages Total of all Working Sets
for processes running this
image
--
WSdefault
Working set default
setting for this process
Pages
--
WSquota
Working set quota setting Pages
for this process
--
WSext
Working set extent
setting for this process
Pages
--
Private
Private memory size for
this process
Pages
--
Global
Global memory size for
this process
Pages
--
Hard Fault Rate Panel Descriptions
The Fault Rate graph on the System Overview panel lets you access the
following panels:
■
Page Faults
■
User Faults
■
Process Faults
■
Fault Types
■
Memory
■
Memory Allocation
330 Performance Manager Administrator Guide
Default Panel Descriptions
■
User Memory
■
Page File Allocation
This series of panels lets you investigate the causes of hard page faulting on
the monitored system. You can investigate the top faulting and top memory
users and view what processes each user is executing.
The following tables describe the information presented within each panel:
Page Faults Panel
Label
Metric
Units
Next Panel
Hard Fault Rate
Hard page fault rate
Faults per
second
Fault Rates
Hard Fault Rate
for Top Users
(list)
Hard page faults by user
Faults per
second
User faults
Total Memory
Utilization
Total memory utilization
Percentage
Memory
Label
Metric
Units
Next Panel
Soft Faults
Soft page fault rate
Faults per
second
--
Hard Faults
Hard page fault rate
Faults per
second
--
Demand Zero
Demand zero page fault
rate
Faults per
second
--
System Faults
System page fault rate
Faults per
second
--
In Swap
In swap operations rate
Swaps per
second
--
Out Swap
Out swap operations rate
Swaps per
second
--
Faults Rates Panel
Chapter 9: Use the DECwindows Motif Real-time Display 331
Default Panel Descriptions
User Faults Panel
Label
Metric
Units
Next Panel
Hard Faults for
User
Hard page fault rate for
this user
Faults per
second
--
Hard Fault Rate
by User Process
(list)
Hard page faults by
process for this user
Faults per
second
Process
Faults
Total Memory
Pages
Memory for this user
Pages
--
Process Faults Panel
Label
Metric
Units
Next Panel
Hard Faults for
Proc
Hard page fault rate for
this process
Faults per
second
--
User Name
User name for this
process
Alphabetic
--
Image Name
Image name executed
by this process
Alphabetic
--
Account
User account for this
process
Alphabetic
--
PID
Process ID for this
process
Numeric
--
Mode
Process mode
(interactive, batch,
network, detached,
other)
Alphabetic
--
CPU Utilization
CPU utilization for this
process
Percentage
--
Disk IO Rate
Disk I/O for this image
Operations per
second
--
Disk Thruput
Disk throughput
Kilobytes per
second
--
Hard Fault Rate
Hard page fault rate
Faults per
second
--
Soft Fault Rate
Soft page fault rate
Faults per
second
--
332 Performance Manager Administrator Guide
Default Panel Descriptions
Label
Metric
Units
Next Panel
Buf I/O Rate
Buffered I/O rate
Operations per
second
--
Direct IO Rate
Direct I/O rate
Operations per
second
--
Memory Panel
Label
Metric
Units
Next Panel
Free List Pages
Number of pages on free Pages
list
Memory Allocation
Total Memory
Pages by Users
(list)
Memory by user name
Pages
User Memory
Page File
Utilization
Page file utilization
Percentage
Page File
Allocation
Memory Allocation Panel
Label
Metric
Units
Next Panel
Free List Fault
Rate
Free list fault rate
Faults per
second
--
Top Memory
Processes (list)
Memory by process name
Pages
--
Paged Bytes
Number of pages in paged Pages
pool
--
NonPaged Bytes
Number of pages in
nonpaged pool
Pages
--
Free Balance
Slots
Number of free balance
set slots
Count
--
IRPs Used*
Number of IRP packets in
use
Count
--
SRPs Used*
Number of SRP packets in Count
use
--
LRPs Used*
Number of LRP packets in
use
--
Count
The fields marked with the "*" are obsolete and are set to zero.
Chapter 9: Use the DECwindows Motif Real-time Display 333
Default Panel Descriptions
User Memory Panel
Label
Metric
Units
Next Panel
Total Memory
Pages for User
Memory utilization for this Pages
user
--
CPU Utilization
CPU utilization for this
user
Percentage
--
Disk IO Rate
Disk I/O for this user
Operations per
second
--
Disk Thruput
Disk throughput
Kilobytes per
second
--
Hard Fault Rate
Hard page fault rate
Faults per
second
--
Soft Faults Rate
Soft page fault rate
Faults per
second
--
Buf I/O Rate
Buffered I/O rate
Operations per
second
--
Direct IO Rate
Direct I/O rate
Operations per
second
--
User Processes
(list)
Memory utilization by
process for this user
Percentage
--
Label
Metric
Units
Next Panel
Page File Write
Rate
Page file write rate
Pages per
second
--
Page/Swap I/O
Rate Top
Volumes (list)
Page/Swap I/O Rate by
volume
Faults per
second
--
Read Rate
Page read operation rate
Operations per
second
--
Write Rate
Page write operation rate
Operations per
second
--
Read I/O Rate
Page read disk operation
rate
Operations per
second
--
Write I/O Rate
Page write disk operation
rate
Operations per
second
--
Page File Allocation Panel
334 Performance Manager Administrator Guide
Default Panel Descriptions
Label
Metric
Units
Next Panel
Swap Busy
Swapper busy
Percentage
--
Swap Wait
Swapper wait
Percentage
--
Disk Rate Panel Descriptions
The Disk Rate graph on the System Overview panel lets you access the
following panels:
■
Disk
■
Volume Info
■
Disk Info
This series of panels lets you investigate the I/O activity on the monitored
system. You can investigate the top volumes and devices.
The following tables describe the information presented within each panel:
Disks Panel
Label
Metric
Units
Next Panel
Disk IO/second
Disk I/O operation rate
Operations per
second
--
Top Volume
(list)
Disk I/O operation rate
for top volumes
Operations per
second
Volume Info
Top Device (list)
Disk I/O operation rate
for top devices
Operations per
second
Disk Info
Label
Metric
Units
Next Panel
I/O Rate for
Volume (with
history)
Disk I/O operation rate
for this volume
Operations per
second
--
I/O Rate
(current)
Disk I/O operation rate
for this volume
Operations per
second
--
KB/second
Disk throughput for this
volume
Kilobytes per
second
--
Volume Info Panel
Chapter 9: Use the DECwindows Motif Real-time Display 335
Default Panel Descriptions
Label
Metric
Units
Next Panel
Disk
Reads/second
Disk read I/O operations
for this volume
Operations per
second
--
Disk
Writes/second
Disk write I/O operations
for this volume
Operations per
second
--
Page/Swap I/O
Rate
Disk page and swap I/O
Operations per
operations for this volume second
--
Label
Metric
Units
Next Panel
I/O Rate for
Device (with
history)
Disk I/O operation rate
Operations per
second
--
I/O Rate
(current)
Disk I/O operation rate
for this device
Operations per
second
--
KB/second
Disk thruput for this
device
Kilobytes per
second
--
Disk
Reads/second
Disk read I/O operations
for this device
Operations per
second
--
Disk
Writes/second
Disk write I/O operations
for this device
Operations per
second
--
Page/Swap I/O
Rate
Disk page and swap I/O
operations for this device
Operations per
second
--
Disks Info Panel
336 Performance Manager Administrator Guide
Review Data in Playback Mode
Review Data in Playback Mode
Playback mode lets you display data recorded earlier. Select the Playback item
from the File menu in the Panel Manager window.
Node
Click the node for which you want to display data.
Time
Time displays the time for which data is being displayed. To select a time
from which to display data records, click Stop and then on the time box.
Edit the date and time to select the beginning time you want. Click Play to
start the display. Alternately, you can click the arrows to the right of the
box to increment the time ahead or back.
Play
Click Play to start a continuous display of the data from the time
displayed.
Step
Click Step to display data from the next interval.
Chapter 9: Use the DECwindows Motif Real-time Display 337
Set the Thresholds and Ranges
Set the Thresholds and Ranges
You can set threshold values for strip charts and bar graphs to alert you to
potential performance problems. When a threshold value is exceeded, the
color of the indicator changes. For example, the CPU utilization threshold on
the strip chart in the CPU panel is set to alert you when CPU utilization
exceeds 70 percent. If the percent utilization exceeds 70 percent the bar on
the strip chart changes from black to red for the period of time during which
the threshold is exceeded.
To set a threshold value:
1.
Click MB1 anywhere in the instrument to be modified. The instrument
appears to be depressed to show that it has been selected.
2.
Press and hold MB3 to display the pop-up editing menu. The menu lets
you edit the following items:
3.
■
Ranges and thresholds
■
Patterns and colors
Choose Ranges and Thresholds by moving the cursor over this selection
and releasing the MB3 button. For example, the following dialog box is
displayed when one of the graphs on the System Overview panel is
selected, as shown in the following screen:
This dialog box is also used to set the scale for an instrument. The maximum
and minimum data values to be displayed for the bar or strip chart can be set.
In addition, the strip chart can be set to automatic scaling whereby the height
of the chart is dynamically adjusted to match the largest data value shown.
338 Performance Manager Administrator Guide
Change the Colors and Patterns
The Ranges and Thresholds dialog box lets you set two levels of thresholds.
To modify a threshold value
■
Click the threshold field and type the new value.
The x-axis on the strip chart can be changed by specifying a new value for
the Number of Time Units. This value, with the display interval, determines
the amount of time represented on the strip chart.
To apply your changes
1.
Click the Apply button at the bottom of the dialog box.
2.
When you are satisfied with all your changes and want to exit the dialog
box, click OK; to exit without saving any changes, click Cancel.
Change the Colors and Patterns
You can customize the colors used in any part of a PA Real-time Display panel
or instrument.
To change the high threshold color for the strip chart in the CPU panel
1.
Select the instrument by pressing MB1 within the instrument's border. The
instrument will appear depressed to indicate that it has been selected.
2.
Press MB3 and hold to get the pop-up menu.
3.
Choose Colors and Patterns by moving the cursor over this selection and
releasing the MB3 button. The following dialog box is displayed:
This dialog box lets you set colors for the thresholds set in the Ranges and
Thresholds dialog. You can use these colors to alert you to potential
performance problems.
Chapter 9: Use the DECwindows Motif Real-time Display 339
Change the Colors and Patterns
4.
Alter the background or the threshold colors by clicking on the associated
button on this dialog. The Pattern Editor dialog is displayed.
5.
Select new patterns and colors for each graph part, click OK on all dialoges
to effect the change.
340 Performance Manager Administrator Guide
Chapter 10: Customize the DECwindows
Motif Real-time Display
This chapter provides information about using the Panel Manager to customize
the DECwindows Motif Real-time Display.
This section contains the following topics:
Access the Panel Manager (see page 341)
Specify Actions on Panels (see page 342)
Terminate the Session (see page 345)
How You Edit the Panel Instruments (see page 345)
How You Set the Panel Options (see page 366)
Access the Panel Manager
Use the following steps to access the Panel Manager:
1.
Start the DECwindows Motif Real-time display by entering the following
command:
$ ADVISE PERFORMANCE DISPLAY WINDOWS/MODE=NETWORK
For more information about the DISPLAY WINDOWS command syntax, see
the chapter “Performance Manager Commands.”
Performance Manager displays the Panel Manager icon and the System
Overview panel, as shown in the following screen:
Equation 1: System Overview Panel
Chapter 10: Customize the DECwindows Motif Real-time Display 341
Specify Actions on Panels
2.
Double-click the Panel Manager icon or from the System Overview Panel,
pull down the File menu, and click the Panel Manager... menu item.
Performance Manager displays the Real-time Panel Manager window, as
shown in the following screen:
Performance Manager displays the Real-time Panel Manager window, which
lets you do the following actions:
■
Specify actions on panels
■
Close the DECwindows session
Specify Actions on Panels
To specify actions on selected panels, pull down the Panel menu and click the
menu item you want. The Panel menu lets you:
Open panels
You open a panel either to view it for modifications or to connect it to a
node for displaying real-time data.
Click the panel name to select a panel. Pull down the Panel menu and click
the Open menu item. Performance Manager displays the selected panel.
You can also open a panel by double-clicking on the panel name.
Rename panels
Specifies a panel name change.
342 Performance Manager Administrator Guide
Specify Actions on Panels
Create panels
Click the Create menu item from the Panel menu and Performance
Manager displays the Panel Name dialog, as shown in the following screen:
Type a panel name and click the OK button.
When you enter a panel name, the Panel Name dialog is removed and the
name you specified is listed in the Instrument Panel Directory of the Panel
Manager.
Copy panels
Click a panel name to select a panel. Pull down the Panel menu and click
the Copy menu item. The Copy Panel dialog is displayed, as shown in the
following screen:
Type the new panel name and click the OK button.
Delete panels
Click a panel name to select a panel. Pull down the Panel menu and click
the Delete menu item. The following message box is displayed, as shown
in the following screen:
If you click OK, that panel is deleted.
Chapter 10: Customize the DECwindows Motif Real-time Display 343
Specify Actions on Panels
Auto Startup
Enable or disable a panel to startup automatically. When you enable
automatic startup for a panel, it will be displayed and an attempt to
connect will be made when you invoke the Real-time Display software. You
can have several panels set for automatic startup.
To enable a panel to startup automatically
1.
Select a panel from the Instrument Panel Directory in the Panel
Manager by clicking on the panel name.
2.
Choose Enable from the Auto Startup menu.
The Instrument Panel Directory is updated. The label /auto_startup is
appended to the panel name.
To disable a panel from starting automatically
1.
Select a panel from the Instrument Panel Directory in the Panel
Manager by clicking on the panel name.
2.
Choose Disable from the Auto Startup menu.
The Instrument Panel Directory is updated. The label /auto_startup
appended to the panel name is removed.
Auto Connect
Enable or disable a panel to connect automatically. When you enable
automatic connection for a panel, it will to connect when you open the
panel. You can have several panels set for automatic connection.
To enable a panel to connect automatically
1.
Select a panel from the Instrument Panel Directory in the Panel
Manager by clicking on the panel name.
2.
Choose Enable from the Auto Connect menu.
The Instrument Panel Directory is updated. The label /auto_connect is
appended to the panel name.
To disable a panel from connecting automatically
1.
Select a panel from the Instrument Panel Directory in the Panel
Manager by clicking on the panel name.
2.
Choose Disable from the Auto Connect menu.
The Instrument Panel Directory is updated. The label /auto_connect
appended to the panel name is removed.
344 Performance Manager Administrator Guide
Terminate the Session
Terminate the Session
To end a DECwindows session
1.
Pull down the File menu in the Panel Manager window and click the Exit
menu item.
If you have modified panels, Performance Manager displays the following
message:
2.
Click Yes and your changes are not saved.
OR
Click No and the exit process is aborted.
3.
To save a panel, use the Save or Save As... menu entry in the panel.
See the section Set the Panel Options (see page 366) section for more
information about saving a panel.
How You Edit the Panel Instruments
To edit instruments
■
Pull down the Edit menu on any open panel and release on the menu item
you want.
The Edit menu lets you perform the following actions:
■
Modify instruments
■
Enable build mode
■
Create instruments
Strip charts
A graphical representation of a data item in an X, Y wide grid. New
data items enter from the right and the entire chart moves to the left
with the oldest data disappearing at the left edge. A strip chart gives a
pictorial view of historical data. An example of a strip chart is a
medical electrocardiogram (EKG).
Chapter 10: Customize the DECwindows Motif Real-time Display 345
How You Edit the Panel Instruments
Bar graphs
A graphical representation of a data item in which the height or length
of the bar represents the magnitude of the data item. At each interval
the bar is redrawn for the new value of the data item, so the bar
grows or shrinks as intervals progress.
Meters
The numerical or string representation of the data item.
An automobile odometer is an example of a meter.
■
Copy instruments
■
Delete instruments
■
Assign metrics
■
Assign launch panels
To edit instruments
1.
Enable build mode.
2.
Select an instrument.
3.
Select an editing function.
Enable the Build Mode
Enabling the build mode lets you create and edit instruments within the
displayed panel.
To enable the build mode
1.
Pull down the Edit menu.
2.
Click the Build Mode menu item
3.
Click the Enable menu item in the submenu.
Modify the Instruments
To modify the instruments
1.
Pull down the Edit menu, choose the Build Mode menu item and click the
Enable submenu item.
2.
Select an instrument.
3.
Pull down the Edit menu, choose the Modify menu item and select a menu
item in the submenu.
346 Performance Manager Administrator Guide
How You Edit the Panel Instruments
This Modify submenu lets you do the following actions:
■
Set ranges and thresholds
■
Set patterns and colors
■
Modify parts
The contents of the Modify submenu varies depending on the type of
instrument selected. These submenu items are also available in a pop-up
menu when you press MB3 in the window work area.
Set Ranges and Thresholds
Clicking on the Ranges and Thresholds menu item, Performance Manager
displays the Ranges and Thresholds dialog for the selected instrument.
Depending on your selected instrument, Performance Manager displays one of
the following dialoges:
■
Bar Graph Range and Thresholds dialog
■
Strip Chart Range and Thresholds dialog
The following example shows the Bar Graph Range and Thresholds screen:
The Bar Graph Range and Thresholds dialog lets you do the following actions:
■
Set maximum and minimum data values
■
Set low and high thresholds
■
Set peak hold units
Chapter 10: Customize the DECwindows Motif Real-time Display 347
How You Edit the Panel Instruments
You can enter any of the following values:
Maximum Data Value
Specifies the maximum value of the graph's scale. The default value is
100.
Minimum Data Value
Specifies the minimum value of the graph's scale. The default value is 0.
Low Threshold
Enables and specifies a value line to be displayed on the graph. Data
below this line is displayed in the patterns and colors you set for low
threshold.
High Threshold
Enables and specifies a value line to be displayed on the graph. Data
above this line is displayed in the patterns and colors you set for high
threshold.
Peak Hold Units
Enables peak hold and specifies the number of units of time the peak
(maximum value attained by the metric) is held in the display. This peak
value indicator is displayed in the patterns and colors you set for the peak
hold.
Strip Chart
348 Performance Manager Administrator Guide
How You Edit the Panel Instruments
The Strip Chart Range and Thresholds dialog lets you do the following actions:
■
Set automatic scaling
■
Set maximum and minimum data values
■
Set number of time units along the x-axis
■
Set low and high thresholds
You can enter any of the following values:
Automatic Scaling
Specifies that the height of the chart is to be dynamically adjusted to
match the largest data value shown.
Maximum Data Value
Specifies the maximum value of the chart's scale. The default value is 100.
Minimum Data Value
Specifies the minimum value of the chart's scale. The default value is 0.
Number of Time Units
Specifies the number of time intervals to display in the chart. For example,
if the data collection time interval is 10 seconds and the number of time
interval units is set at 30, then up to 300 seconds, or 5 minutes of data is
displayed.
Low Threshold
Enables and specifies a value line to be displayed on the chart. Data below
this line appears in the patterns and colors you set for low threshold.
High Threshold
Enables and specifies a value line to be displayed on the chart. Data above
this line appears in the patterns and colors you set for high threshold.
Set Patterns and Colors
To set patterns and colors for the selected instrument
1.
Pull down the Modify submenu.
2.
Choose the Pattern and Colors menu item.
Performance Manager displays the appropriate Patterns and Colors dialog for
that instrument.
Chapter 10: Customize the DECwindows Motif Real-time Display 349
How You Edit the Panel Instruments
Bar Graph
The Bar Graph Patterns and Colors dialog allows you set the pattern and color
of the instrument graph, as shown in the following screen:
You can set the bar graph with the following attributes:
■
Background
■
Normal Range
■
Low Threshold
■
High Threshold
■
Peak Hold
350 Performance Manager Administrator Guide
How You Edit the Panel Instruments
To set the Patterns and Colors for each of these attributes
1.
Click the appropriate button.
Performance Manager displays the Pattern Editor dialog, as shown in the
following screen:
2.
Click a pattern in the dialog and the selected pattern is displayed in the
pattern viewer.
To change the graph's pattern color, click the Foreground or Background
button. Performance Manager displays a color mixing dialog.
3.
Click Help for information on how to use the color mixing dialog.
Strip Chart
Chapter 10: Customize the DECwindows Motif Real-time Display 351
How You Edit the Panel Instruments
The Strip Chart Patterns and Colors dialog lets you set the pattern and color of
the chart with the following attributes:
■
Background
■
Normal Range
■
Low Threshold
■
High Threshold
To set the Patterns and Colors for each of these attributes
1.
Click the appropriate button.
Performance Manager displays the Pattern Editor dialog.
2.
Click a pattern in the dialog and the selected pattern is displayed in the
pattern viewer.
3.
To change the chart's pattern color, click the Foreground or Background
button.
Performance Manager displays a color mixing dialog.
4.
Click Help for information on how to use the color mixing dialog.
Modify Parts
To modify the parts of an instrument
1.
Pull down the Edit menu, choose the Build Mode menu item and click the
Enable submenu item.
2.
Select the instrument by clicking on it.
3.
Pull down the Edit menu, choose the Modify menu item and click the
Parts... menu item in the submenu.
Performance Manager displays the appropriate Parts dialog for the selected
graph or chart in one of the following boxes:
■
Bar Graph Parts Definition dialog
■
Strip Chart Parts Definition dialog
■
Meter Parts Definition dialog
The Bar Graph Parts Definition dialog lets you specify:
■
Title String-Set the toggle button to display a title. Enter a title in the text
entry box.
■
Data Name-Set the toggle button to specify the title to be the metric
name, overriding any supplied string.
352 Performance Manager Administrator Guide
How You Edit the Panel Instruments
Bar Graph Parts
Title Font
Click the Title Font... button and Performance Manager displays the Font
Selection dialog, as shown in the following screen:
The Font Selection dialog lets you specify the following font characteristics:
–
Family
–
Size
–
Weight
–
Slant
Chapter 10: Customize the DECwindows Motif Real-time Display 353
How You Edit the Panel Instruments
Note: Font options not available on your server are disabled.
Metric Type
Specifies a list of instances of one metric or a list of metrics.
For example, to show the CPU Utilization for multiple processes on the
system, use the List of Instances option.
To show a CPU mode (Interrupt, Kernel, Supervisor, and so on) for the
system, choose the List of Metrics option since each metric has only one
value associated with it.
Number of List Entries
Specifies the number of bars to be displayed.
Orientation
Specifies the orientation of the bar graph's maximum value.
Data labels: width (in characters)
Specifies the space available for the data labels, based on the
characteristics of the font you have selected.
Meter: width (in characters)
Specifies the space available for the meter, based on the characteristics of
the font you have selected.
Set the toggle button to include a meter for the bars. Specify the space for
the meter in characters.
Units label: width (in characters)
Specifies the space available for the units label, based on the
characteristics of the font you have selected.
Set the toggle button to include a units label for the bars. Specify the
space for the units label in characters.
Label Fonts
The Font Selection dialog lets you specify label font characteristics.
Location of Tags and Ticks
Specifies whether tags (numeric values indicating a chart's scale) and tick
marks are displayed on the left or right side or top or bottom of the chart.
Tick marks can be displayed without tags. When tags are selected, tick
marks are displayed automatically.
354 Performance Manager Administrator Guide
How You Edit the Panel Instruments
Number of Tags/Ticks
Specifies the number of tags and corresponding tick marks to be
displayed. The default is six tags.
Number of Short Ticks
Specifies number of minor tick marks to be displayed between the major
tick marks set in Number of Tags/Ticks. The default is one.
Strip Chart Parts
The Strip Chart Parts dialog lets you specify the following attributes:
Title
Set the toggle button to display a title. Enter a title in the text entry box.
Data Name
Set the toggle button to specify the title to be the metric name, overriding
any supplied string.
Title Font
The Font Selection dialog lets you specify the following font characteristics:
–
Family
–
Size
–
Weight
–
Slant
Font options not available on your server will be disabled.
Chapter 10: Customize the DECwindows Motif Real-time Display 355
How You Edit the Panel Instruments
Data:
Tags
Specifies whether the tags are displayed on the left or right side of the
chart, or both.
Tick Marks
Specifies whether tick marks are displayed on the left or right side of
the chart, or both. Tick marks can be displayed without tags. When
tags are selected, tick marks are displayed automatically.
Number of Tags/Tick Marks
Specifies the number of tags and corresponding tick marks to be
displayed. The default is six tags.
Number of Short Tick Marks
Specifies the number of minor tick marks to be displayed. The default
is one.
Units Label
Specifies whether the units label is included in the display.
Time:
Display
Specifies whether the time display will include hours, minutes, and
seconds or a subset of these.
Tick Marks
Specifies whether tick marks are displayed on the top or bottom of the
chart, or both.
Units Labe
Specifies whether the time units label in included in the display.
Labels Font
The Font Selection dialog lets you specify font characteristics.
Meter Parts
The Meter Parts Definition dialog lets you specify the following attributes:
Title String
Set the toggle button to display a title. Enter a title in the text entry box.
Data Name
Set the toggle button to specify the title to be the metric name, overriding
any supplied string.
356 Performance Manager Administrator Guide
How You Edit the Panel Instruments
Title Font
The Font Selection dialog lets you specify the following font characteristics:
–
Family
–
Size
–
Weight
–
Slant
Font options not available on your server will be disabled.
Metric Type
Specifies a list of instances of one metric or a list of metrics.
For example, to show the CPU Utilization for multiple processes on the
system, use the List of Instances option.
To show a CPU mode (Interrupt, Kernel, Supervisor, and so forth) for the
system, choose the List of Metrics option since each metric has only one
value associated with it.
Number of List Entries
Specifies the number of meters to be displayed.
Label Fonts
The Font Selection dialog lets you specify label font characteristics.
Data labels: width (in characters)
Specifies the space available for the data labels, based on the
characteristics of the font you have selected.
Metric fields: width (in characters)
Specifies the space available for the meter, based on the characteristics of
the font you have selected.
Units label: width (in characters)
Specifies the space available for the units label, based on the
characteristics of the font you have selected.
Set the toggle button to include a units label for the meters. Specify the
space for the units label in characters.
Create Instruments
To create an instrument
1.
Pull down the Edit menu, choose the Build Mode option, and click the
Enable submenu option.
2.
Pull down the Edit menu, choose the Create menu item, and click the
submenu entry.
Chapter 10: Customize the DECwindows Motif Real-time Display 357
How You Edit the Panel Instruments
You can choose from the following instruments:
■
Strip Chart
■
Bar Graph
■
Meter
Copy Instruments
To copy instruments:
1.
Pull down the Edit menu, choose the Build Mode option and release on the
Enable submenu option.
2.
Select the instrument.
3.
Pull down the Edit menu and choose the Copy menu item.
The cursor changes to an indicator that represents the upper left corner of the
instrument. Position the cursor at the desired location for the new instrument
in the panel. Click MB1 and the instrument is displayed.
Delete Instruments
To delete instruments
1.
Pull down the Edit menu, choose the Build Mode menu item and release on
e Enable submenu item.
2.
Select the instrument.
3.
Pull down the Edit menu and choose the Delete menu item.
Performance Manager displays the following message box:
358 Performance Manager Administrator Guide
How You Edit the Panel Instruments
Assign Metrics
To specify metrics to be displayed:
1.
Pull down the Edit menu, choose the Build Mode menu item and click the
Enable submenu item.
2.
Select the instrument.
3.
Pull down the Edit menu and choose the Assign Metrics... menu item.
Performance Manager displays an Instrument Metric Selections dialog, as
shown in the following screen:
When Assign Metrics is chosen, the first metric field in the instrument to be
assigned a metric will appear with a solid outline. If the instrument has more
than one field, the others will appear with a dashed outline.
Chapter 10: Customize the DECwindows Motif Real-time Display 359
How You Edit the Panel Instruments
The Instrument Metric Selection dialog lets you perform the following actions:
■
Select a metric class
■
Select a metric name
■
Sort metric classes in ascending or descending order
■
Filter metric selections by value or instance
■
Include the class name in the instrument label
■
Specify a metric alias (a user supplied string which is displayed instead of
the metric name)
The first metric field will automatically be selected, as shown by the solid
outline. If another field is desired, click the instrument's outlined metric field.
You may have to move the dialog out of the way if it occludes the instrument
being modified. The Instrument Metric Selections dialog displays the
instrument's current metric name and class. Hold MB1 down on the class name
option menu to see all available choices. Release MB1 on the desired class
name. A list of applicable metrics is displayed. Click the metric name you want
to display. See Appendix C for a description of each metric.
Once you are satisfied with the metric selection for the field and you wish to
specify another field in the instrument, press Apply and then select another
field by clicking with MB1 within the dashed outline defining the field.
360 Performance Manager Administrator Guide
How You Edit the Panel Instruments
A sort option can be selected for all metric classes other than System.
To display only the data that matches a specific filtering criteria
1.
Select the Filter toggle.
This makes available the Metric... button.
2.
Click Metric... to display the Filter Metric Selection dialog.
The Filter Metric Selection dialog lets you perform the following actions:
■
Select a filter type
■
Select a filter metric name
■
Select the filter criteria
■
Specify filter values
To enable filtering, position the mouse cursor over the Type option menu and
hold down MB1. The following options are displayed:
■
No Filter
■
By Value
■
By Instance
To enable filtering based on a metric value, select the By Value option. To
enable filtering based on a specific data item identifier such as a specific user
name, process name, disk name, and so on, select the By Instance option.
Chapter 10: Customize the DECwindows Motif Real-time Display 361
How You Edit the Panel Instruments
For the By Value option, you can then specify the range of values to be
displayed using the Filter option menu. Press and hold MB1 over the Filter
options to see the following range of options:
■
Less
■
Less or Equal
■
Equal
■
Not Equal
■
Greater or Equal
■
Greater
■
In Range
■
Out of Range
The value to be compared for range determination can be entered in the
Compare Value fields or can be based on a value from a parent panel, as
described below.
If the Filter metric is a string then the value specified is interpreted as all
uppercase unless the string is contained within double quotes.
If the instrument being modified is launched from another panel, then a value
may be implicitly passed to this panel. In this case, this value is considered
the instance value. See the Launching Panels section for more information. If
you want to use this instance value, select By Instance in the Type option
menu and select the applicable Filter Metric Name corresponding to the passed
value and leave the Compare Value field empty.
Clicking on the Apply button, applies your choices without closing the dialog.
The OK button applies your choices and closes the dialog.
Assign Launch Panels
Performance Manager allows a panel to be activated, or launched, from an
instrument within a different panel. In addition, a data item can be passed to
the launched panel. This data item (the instance value) can then be used in a
subsequent filtering of information displayed in the launched panel's
instruments.
362 Performance Manager Administrator Guide
How You Edit the Panel Instruments
To assign launch panels:
1.
Pull down the Edit menu, choose the Build Mode menu item and click the
Enable submenu item.
2.
Select the instrument that will launch a new panel.
3.
Pull down the Edit menu, and choose the Assign Launch Panel... menu
item.
Performance Manager displays a Launch Panel Selection dialog as shown in
the following screen:
When you chose assign launch panel, the first metric field in the
instrument to be assigned a launch panel will appear with a solid outline. If
the instrument has more than one field that can launch panels, these
appear with a dashed outline.
4.
When you are satisfied with the launch panel assignment for the field and
you wish to specify another field in the instrument, click Apply and select
another field by clicking with MB1 within the dashed outline defining the
field.
5.
When you are satisfied with all the selections, click OK.
Chapter 10: Customize the DECwindows Motif Real-time Display 363
How You Edit the Panel Instruments
Launch Panels
Once launch panels are set and you are connected, double-click the metric
name or metric instance name you want to pass to the specified launch panel.
Performance Manager displays this panel using the information passed.
For strip charts, digital meters, and bar graphs with one or more different
metrics displayed (List of Metrics as the type), you can now launch the
selected panel by double-clicking on the instrument title. For bar graphs that
display multiple instances of a metric, for example, a bar graph of the CPU
utilization for the top 7 users, you can double-click an instance identified by
user name and have that name passed to the launched panel. The launched
panel can then filter its displayed metrics based on the specific user.
See the section Assigning Metrics (see page 359) for information on metric
filtering.
To disable panel launching, select the Remove Launch Panel menu item and
click OK.
The following example illustrates progressive disclosure using panel launching:
364 Performance Manager Administrator Guide
How You Edit the Panel Instruments
In the following example, double-clicking on the metric CPU Utilization
instrument in the Performance Manager System Overview panel launches the
CPU panel on node YQUEM. The node YQUEM and the current interval are
passed to the panel CPU.
Chapter 10: Customize the DECwindows Motif Real-time Display 365
How You Set the Panel Options
Double-clicking on the Top Users metric name SAPIRO launches the user CPU
panel passing it the current interval, the node YQUEM, and the user name
SAPIRO, as shown in the following screen:
Each of the metrics in the panel are filtered by the user name SAPIRO. For
example, the User Processes instrument is set up as follows:
The instrument's main metric is Process CPU Utilization sorted in ascending
order. The metric is filtered by instance with a filter metric of user name. The
filter compare value is left blank so the value is passed from the panel. The
instrument's second metric is process name using an alias of User Processes.
How You Set the Panel Options
To set the panel options:
1.
Pull down the Options menu of the Instrument Panel.
2.
Choose the menu item you want.
366 Performance Manager Administrator Guide
How You Set the Panel Options
The Options menu lets you perform the following actions:
■
Set panel status
■
Specify panel background
■
Specify panel title
■
Specify panel node and instance type
■
Remove panel menu
Set the Panel Status
To set the panel status
1.
Pull down the Options menu.
2.
Choose the Status Display menu item.
3.
Choose either the Restore or Remove submenu items.
The panel status is either displayed or removed from the panel's lower border.
The Panel Status displays the following items:
■
Panel mode
–
Connected, indicated by a circle enclosing a vertical line
–
Disconnected, indicated by a circle enclosing a broken vertical line
■
Last instrument update time, if connected
■
Interval in minutes and seconds
Specify the Panel Background
To specify the panel background
■
Pull down the Options menu and choose the Panel Background... menu
item.
Performance Manager displays the Pattern Editor.
See the section Set Patterns and Colors (see page 349) section for a
discussion on how to use the Pattern Editor.
Chapter 10: Customize the DECwindows Motif Real-time Display 367
How You Set the Panel Options
Specify a Panel Title
To specify a title
1.
Pull down the Options menu and choose the Panel Title... menu item.
Performance Manager displays the Panel Title dialog, as shown in the
following screen:
2.
Enter the title and click the OK button.
The supplied string can optionally have appended to it the node name and
the instance value.
368 Performance Manager Administrator Guide
How You Set the Panel Options
Specify the Panel Node and Metric Instance Data
To specify the node for which data is to be displayed:
1.
Pull down the Options menu.
2.
Choose the Node and Metric Instance Name... menu item.
Performance Manager displays the Node and Metric Instance Name dialog,
as shown in the following screen:
The Node and Metric Instance Name dialog lets you perform the following
actions:
■
Show the current node assigned to the panel
This would have been specified by you as a default, or at connect time, or
when the panel was launched. If the panel was launched, the node passed
in the launch overrides the default.
■
Include the node in the panel's title display
■
Specify the node as the default
■
Show the current metric instance name
This would have been specified by you as a default, by a prompt dialog at
connect time, or when the panel was launched. If the panel was launched,
the metric instance name passed in the launch overrides the default.
You can also change the metric instance name by entering a new name in
the Metric Instance text entry box. The metric name is interpreted as all
uppercase unless you contain the name within double quotes.
■
Include the metric instance name in the panel's title display
■
Specify the name as the default
Chapter 10: Customize the DECwindows Motif Real-time Display 369
How You Set the Panel Options
■
Select prompting at connect time if a metric instance name is not defined
■
Define the prompt string
For example, if the instruments in a panel are set up to look at metrics for
a specific user, a user name is required to specify the metric fully. In this
case, the prompt might be: “Enter User Name:”. If prompting is selected,
then a prompt dialog appears at connect time requesting a user name.
Panels requiring specific metric instance names (such as user name or
process name), must be provided with a prompt for the appropriate name.
This lets the panel to be invoked from the panel manager and to display
without errors. An example is the User_CPU panel (labeled User=SAPIRO)
described in the Launching Panels section.
Note: Any changes to the node selection or the metric instance name will
have no affect on the instruments until the panel is connected or reconnected.
Remove Panel Menu
To remove the panel menu
1.
Pull down the Options menu and click the Remove Panel menu item.
The menu is removed from the panel.
2.
To restore the menu, click MB3 and a pop-up menu displays.
3.
Click the Restore Panel Menu option.
If no instrument is active when there is no panel menu, the pop-up menu
options are limited to the following actions:
■
Close
■
Save
■
Restore Panel Menu
370 Performance Manager Administrator Guide
How You Set the Panel Options
Save the Panel
To save a panel
1.
Pull down the File menu and release on the Save menu item.
2.
To specify a new panel name, click the Save As... menu item.
The Panel Name dialog appears.
3.
Enter the new panel name and click the OK button.
Close the Panel
To close an instrument pane
1.
Pull down the File menu and click the Close menu item.
If you modified the instrument, Performance Manager displays the
following message:
2.
Click Yes to save the modifications and close.
OR
Click No to close without saving your changes.
Chapter 10: Customize the DECwindows Motif Real-time Display 371
Chapter 11: Use the Character-Cell
Real-time Display
This chapter provides information about the Performance Manager charactercell Real-time Display.
This section contains the following topics:
Character-Cell Display Functions (see page 373)
Start the Character-Cell Displays (see page 374)
Control the Displays (see page 374)
Display Multi-node Statistics (see page 376)
Display Single-Node Statistics (see page 378)
Display Process Information (see page 381)
Display Disk Information (see page 384)
Display Rules Information (see page 385)
Display RESOURCE Information (see page 385)
The INVESTIGATE Command (see page 391)
Evaluate Performance Using the Investigate Displays (see page 392)
Exit the Character-Cell Displays (see page 401)
Character-Cell Display Functions
The Performance Manager character-cell displays gather and present
performance data using a video terminal. Some displays are available on
terminals that support DEC_CRT characteristics, such as the VT100. Use the
SET TERMINAL/DEC_CRT command to set characteristics for these terminals.
Other displays are available only for ReGIS-compatible terminals, such as the
VT340. If the terminal supports color, or if an external color monitor is
attached, a multicolored display is generated. The display can also be printed
on a graphics dot matrix printer.
Prerequisites
The Performance Manager character-cell displays have the following
mandatory software and hardware requirements:
■
For real-time remote data collection (/MODE=NETWORK command), see
the discussion about establishing remote access in the Performance Agent
Administrator Guide.
■
For file access (/MODE=DISKFILE command), SYSLCK privilege is
required.
Chapter 11: Use the Character-Cell Real-time Display 373
Start the Character-Cell Displays
■
A ReGIS-compatible terminal such as the VT125, VT240, VT241, VT330, or
VT340 is needed for most displays invoked through the INVESTIGATE
command.
■
A terminal with DEC_CRT characteristics, such as a VT100, is needed for
all other displays.
Any number of users with these resources can simultaneously run the
Performance Manager Real-time character-cell displays.
Start the Character-Cell Displays
Character-cell displays can be invoked for either a single node or multiple
nodes of a cluster system.
To begin collecting data for all nodes in a cluster system and to display
system metrics in realtime mode
1.
Enter the following command:
$ ADVISE PERFORMANCE DISPLAY CHARACTER_CELL
PA displays a multi-node screen.
2.
To view previously recorded data in playback mode, use the /BEGINNING
qualifier.
For more information on how to use the ADVISE PERFORMANCE DISPLAY
command, see the chapter Performance Manager Commands (see
page 175).
Control the Displays
Once you have started a character-cell display, you can control the display and
its characteristics with commands.
The following table shows the Performance Manager character-cell commands
available at the PSRT> prompt. These commands control which displays and
metrics are shown on the terminal.
The keypad keys perform other functions such as selecting users, nodes, and
metrics for display, and controlling the playback of data.
Command
Function
CPU
Provides a multi-node display of CPU
utilization.
374 Performance Manager Administrator Guide
Control the Displays
Command
Function
DISKS
Provides a composite display for all disks,
servers, or volumes.
DISPLAY x
Provides a multi-node display for the
desired metric.
FREEZE
Stops the input data stream.
STEP
Advances to the next interval while display
is suspended.
IMAGENAME name
Provides a process display for the specified
image name.
INVESTIGATE
SYSTEM_OVERVIEW_DISPLAY
Provides the ReGIS display for
investigating the selected system.
INVESTIGATE
MEMORY_DISPLAY
Provides the ReGIS display for
investigating the selected system's
memory.
INVESTIGATE IO_DISPLAY
Provides the ReGIS display for
investigating the selected system's IO rate.
INVESTIGATE CPU_DISPLAY
Provides the ReGIS display for
investigating the selected system's CPU.
INVESTIGATE
LOAD_BALANCE_DISPLAY
Provides the ReGIS or ANSI display for
investigating the selected system's load
balance.
INVESTIGATE
Provides the ReGIS display for
investigating the last selected display or
the system display if none had been
selected.
IO
Provides a multi-node display of direct,
paging and swapping IO rate.
MEMORY
Provides a multi-node display of memory
utilization.
PAGEFILE
Provides a multi-node display of Pagefile
Utilization.
PID n
Provides a process display for the specified
PID.
RESOURCE CPU_DISPLAY
Provides a multi-node display of CPU
resources.
RESOURCE DISK_DISPLAY
Provides a multi-node display of disk
resources.
Chapter 11: Use the Character-Cell Real-time Display 375
Display Multi-node Statistics
Command
Function
RESOURCE
MEMORY_DISPLAY
Provides a multi-node display of memory
resources.
RESOURCE
Provides the multi-node resource display
for the last selected display or the CPU
display if none had been selected.
RESUME
Resumes the data input stream that was
stopped by the FREEZE command
RULES
Provides a per-node display of rules that
have fired on that node.
SET SCALING
PROCESS n
WORKING_SET n
RATE_PER_SECOND n
Changes scale (number within a tick mark)
for process, working set size, and I/Os per
second scales.
USERNAME name
Provides a process display for the specified
user name.
Display Multi-node Statistics
A bar-graph style screen appears when you start Performance Manager
character-cell displays. By default, the percentage of CPU utilization for each
node in the cluster is displayed.
If you are collecting data at two-minute intervals, factory rule IDs or user rule
IDs, or both, may also appear after the time stamp. For shorter intervals, the
user rules may appear.
See the RULES command and the /RULES qualifier for more information.
376 Performance Manager Administrator Guide
Display Multi-node Statistics
You can display in the following metrics previous screen:
■
Percentage of memory utilization
■
Disk I/Os per second
■
Percentage of pagefile utilization
■
Any other system data cell collected and provided. For a list of the system
metrics you can select, see Appendix C. Only numeric metrics in Domain
LOCAL can be requested.
Use the multi-node keypad to perform the following tasks:
■
Get Help
■
Zoom in on node
■
Change to the next node
■
Change to the previous node
■
Change to the resource display
■
Change to the next metric
■
Change to the investigate display
■
Change to the previous metric
The following illustration shows the functions of the multi-node display
keypad:
Chapter 11: Use the Character-Cell Real-time Display 377
Display Single-Node Statistics
Display Single-Node Statistics
To navigate through the list of nodes
1.
Press KP2 or KP5.
The arrow identifies the node you choose to monitor.
2.
Press the zoom-in-on-node key (KP7) in the multi-node keypad.
Performance Manager displays a single-node screen.
The Performance Manager single-node screen provides the following three
sections:
■
CPU utilization and mode statistics
■
Top processes statistics
■
Top device statistics
The Process Statistics and Device Statistics sections can be updated with a
new set of metrics. The title of the currently selected section is in reverse
video. Press KP3 to select a different section.
378 Performance Manager Administrator Guide
Display Single-Node Statistics
3.
Enter the Help command or press PF2 to display the single-node display
keypad.
The following table shows the functions of the single-node display keypad:
Display CPU Utilization
The CPU Utilization screen displays total utilization and the percentage of CPU
utilization of each of the following processor modes:
■
Interrupt stack
■
MP synchronization
■
Kernel mode
■
Executive mode
■
Supervisor mode
■
User mode
■
Compatibility mode
Chapter 11: Use the Character-Cell Real-time Display 379
Display Single-Node Statistics
Display Top Processes Statistics
Process statistics are summarized and presented by the process key. The
process statistics are presented in descending order by the selected metric
value.
To summarize the process statistics according to a different key
■
Press KP6.
The available process keys are as follows:
■
TOP User metric
■
TOP Image metric
■
TOP Process metric
■
TOP Account metric
■
TOP PID metric
To change the metric displayed
■
Press KP9.
The available metrics are as follows:
■
CPU
■
Disk IO
■
Disk Thruput
■
Soft Faults
■
Hard Faults
■
Buffered IO
■
Direct IO
■
WS pgs
■
Private pages
■
Global pages
■
V/A pages
380 Performance Manager Administrator Guide
Display Process Information
Display Top Device Statistics
Device statistics are summarized and presented by the device key. The device
statistics are presented in descending order by the selected metric value.
To summarize the device statistics according to a different key
■
Press KP6.
The available device keys areas follows:
■
TOP Volume metric
■
TOP Disk metric
■
TOP Server metric
To change the metric displayed
■
Press KP9.
The available metrics are as follows:
■
IO Rate
■
KB per second
■
Read Rate
■
Write Rate
■
Page/Swap IO Rate
Display Process Information
Performance Manager provides a Process display when you press KP7 from the
single-node display when the Process Statistics section is selected or when you
enter any of the following commands to the PSRT> prompt:
■
USERNAME name
■
IMAGENAME name
■
PID n
Chapter 11: Use the Character-Cell Real-time Display 381
Display Process Information
The following illustration is an example of a user name Process display:
In the upper left corner is a line describing the current summarization and sort
position of the Process information. This text follows the format "nth TOP key
metric", where you select the key by pressing KP6 (either User, Image,
Processname, Accountname, or PID), and metric is selected by KP9 (see the
previous section for a list of available metrics). To proceed to the nth + 1
entry, press KP1, or KP4 to go back. To lock the display on a specific process,
enter PID nnnnnnnn for the desired PID.
Also in the upper left corner is the process identification section: user name,
image name, process name, account name PID, and process mode for the
currently displayed process. If any of these fields have an asterisk (*), more
than one process has been summarized for this screen, and the given field had
more than one value.
The following screen is an example of the Performance Manager Real-time
Process Display, Single Process:
382 Performance Manager Administrator Guide
Display Process Information
In the upper right corner is the name of the node and the current time of the
data being viewed. Next, on the right side, are three bar charts that show CPU
utilization, memory utilization and the processes working set as a percentage
of the total system's memory, and the number of disk I/Os as a rate per
second.
The mid-section of the screen contains the process statistics for the selected
process, as in the previous illustration. If more than one process matches the
selection criteria (such as a given user name), the working set data and state
information is replaced by a list of processes that match the criteria, as in an
earlier illustration (Performance Manager Real-time Process Display, Multiple
Processes).
You can scroll through the process instances, as appear in the previous
illustration, by using NextScreen and PrevScreen keys. If there is a particular
PID, user name or image name that you want to lock the display on, enter the
USERNAME, IMAGENAME, or PID command to do so.
For example:
PSRT> USER HOFFMAN
The last section of the display is the “volumes” section (also appearing in the
earlier illustration showing Performance Manager Real-time Process Display,
Multiple Processes), where disk volumes and I/O rates appear. These represent the
top disks that the processes use and are list up to the top five disk volumes
recorded by the main collector. By pressing KP3, you can view the top files being
used by the processes. The top volumes and files data is available only when the
/MODE=DISKFILE command and the default collection definition is used
(/COLLECTION=CPD).
Press PF2 to view the keypad for Process displays. The following illustration
shows the functions of the Process display keypad:
Chapter 11: Use the Character-Cell Real-time Display 383
Display Disk Information
Display Disk Information
Performance Manager provides a Disks display when you enter the following
command:
PSRT> DISKS
The following illustration is an example of a Disks display:
Press PF2 to view the keypad for the Disks display. The following illustration
shows the functions of the Disks display keypad.
Press KP6 (to scroll through Disk keys and KP9) to scroll through disk metrics.
To return to the multi-node display, press KP0.
384 Performance Manager Administrator Guide
Display Rules Information
Display Rules Information
To obtain the Rules display
■
Enter the RULES command.
If any factory or user rules fire for the last data record processed, the rule
ID and a brief explanation are displayed. If data is displayed at less than
two-minute intervals, then only user rules are displayed.
Note: Rules in the Cluster and Summary domain are not displayed.
The following illustration is an example of a Rules display:
Display RESOURCE Information
The purpose of the Resource displays is to permit evaluation of resource
utilization in interactive mode for one or more nodes in a cluster system.
RESOURCE CPU_DISPLAY
RESOURCE MEMORY_DISPLAY
RESOURCE DISK_DISPLAY
RESOURCE or press PF3
Chapter 11: Use the Character-Cell Real-time Display 385
Display RESOURCE Information
RESOURCE Keypad
The following illustration shows the functions of the RESOURCE keypad:
Balance Cluster System Utilization Using the Resource Display
Use the Resource displays to determine the workload on nodes and disks on
your cluster system, and balance the workload as necessary. For example, if
your Resource display shows one node that has a high percentage of a
resource in use, you may wish to move work from that node to other nodes to
balance resource utilization on your cluster system.
Each display shows cluster-wide information consisting of memory, disk, or
CPU metrics for selected nodes and disks in a cluster. Each display consists of
the following two parts:
■
An upper part containing metrics appropriate to the display name (for
example, memory-related metrics). This part is unique for each different
type of display.
■
A lower part containing memory utilization, direct I/O rate, and CPU
utilization for selected nodes in the cluster. This part is the same for each
of the three displays.
The lower portion of a display common to all three displays is described in the
following section.
386 Performance Manager Administrator Guide
Display RESOURCE Information
Lower (Common) Resource Display
The lower or common portion of each resource display contains bar graphs for
nodes in the cluster. An example is the lower portion of the next illustration.
The scale at left and right is graduated from 0 to 100, and is interpreted either
as a percentage or an absolute value depending on the particular metric.
There is a bar graph for each node in the current group set for display, the
node name being displayed at the bottom of each graph.
The bar graph for a node contains three separate columns (metrics) as
follows:
Memory Utilization (M)
This column is headed by the letter M, and is a percentage value as
indicated by the percent sign (%) at the bottom of the column. The value
is that of Total MEMutl expressed as a percentage. Total MEMutl is given
by
(((Total Memory)-(Free Pages))/(Total Memory)).
I/O Rate (I)
This column is headed by the letter I, and is an absolute value (rate) as
indicated by the letter R at the bottom of the column. The value is the
Direct I/O rate (number of direct I/Os per second) for the node. If the rate
exceeds 100 direct I/Os per second, the column is filled with asterisks.
CPU Utilization (C)
This column is headed by the letter C, and is a percentage value as
indicated by the percent sign (%) at the bottom of the column. The value
is the percentage of the CPU being utilized, which is equal to the sum of
the System and Task CPU percentages given in the tabular reports.
Chapter 11: Use the Character-Cell Real-time Display 387
Display RESOURCE Information
Memory Display
The Memory display contains memory statistics for analyzing a memory
resource limitation is a cluster-wide manner.
An example of a resource Memory display is shown in the following illustration:
The top half of the memory display contains a bar graph for each cluster node
currently set for display. The scale shown at right and left shows a percentage
value ranging from 0 to 100%.
The name of the node is given at the top of an individual node graph, while
the total page fault rate (faults per second) for the node is shown as a number
at bottom right. Each node graph has two columns as follows:
Hard Faults (H)
This column is headed by the letter H, and is a percentage value. The value is
not only given by the column height, but is also shown as a number at the
bottom of the column. The value is the percentage of the total faults for the
node that were hard (required a read from disk).
Soft Faults (S)
This column is headed by the letter S, and is a percentage value. The value is
not only given by the column height, but is also shown as a number at the
bottom of the column. The value is the percentage of the total faults for the
node that were soft (resolved from memory without requiring a read from
disk).
Note: The bottom value in this column is the total page fault rate (faults per
second both hard and soft) for the node.
388 Performance Manager Administrator Guide
Display RESOURCE Information
Disk Display
The Disk display contains disk statistics for analyzing an I/O resource
limitation in a cluster-wide manner.
An example of a resource Disk display is shown in the following illustration:
The top half of the disk display contains a bar graph for each disk currently set
for display. The scale shown at right and left shows an absolute value ranging
from 0 to 100. The scale at left is headed with the word Rate, while the scale
at right is head Msec (Milliseconds). The rate scale is used with the leftmost
column in the bar graph for a particular disk, while the Msec scale is used with
the rightmost column.
The name of the disk is given at the top of an individual disk graph. Preceding
the disk name is a number, which corresponds to the number assigned the
disk when listing disk groups with the SHOW GROUP command. This number
allows a partial disk name, as given at the top of each disk graph, to be
associated with the full disk name as given by SHOW GROUP subcommand.
The number of I/O packets in the disk queue for each disk is shown as a
number at the bottom right of each disk graph. Each disk graph has two
columns as follows:
Rate (R)
This leftmost column is headed by the letter R, and is an absolute value.
The value is not only given by the column height, using the leftmost scale
(Rate scale), but is also shown as a number at the bottom of the column.
The value is the number of direct I/Os per second for the disk.
Chapter 11: Use the Character-Cell Real-time Display 389
Display RESOURCE Information
Response (R)
This rightmost column is headed by the letter R, and is an absolute value.
The value is not only given by the column height, using the rightmost
scale (Msec scale), but is also shown as a number at the bottom of the
column. The value is the response time of the disk in milliseconds. This is
the average time to process one I/O including both queuing time and
service time.
Note that the bottom value in this column is the average number of I/O
packets in the disk queue. If the value of the Rate or Response time
exceeds 100, asterisks are shown at the top of the column, but the value
is still given at the bottom of the column. If the actual value should exceed
three digits, then asterisks are shown in place of the value.
CPU Display
The CPU display contains CPU statistics for analyzing a CPU resource limitation
in a cluster-wide manner.
An example of a resource CPU display is shown in the following table:
The top half of the CPU display contains a bar graph for each cluster node
currently set for display. The scale shown at right and left shows a percentage
value ranging from 0 to 100%.
The name of the node is given at the top of an individual node graph, while
the average number of processes in the CPU queue for the node is shown as a
number at bottom right. There is a real queue if this number is greater than 1.
This number is equivalent to the sum of processes in the computable queue
(COM). Each node graph has two columns as follows:
390 Performance Manager Administrator Guide
The INVESTIGATE Command
System CPU (S)
This column is headed by the letter S, and is a percentage value. The
value is not only given by the column height, but is also shown as a
number at the bottom of the column. The value is the percentage of the
total CPU time used by the System (Interrupt stack, Kernel mode,
Executive mode).
Task CPU (T)
This column is headed by the letter T, and is a percentage value. The
value is not only given by the column height, but is also shown as a
number at the bottom of the column. The value is the percentage of the
total CPU time used by user tasks (Supervisor, User, and Compatibility
modes).
Note that the bottom value in this column is the average number of
processes in the CPU queue. For a real queue to exist, this value must be
at least 2.
The INVESTIGATE Command
The purpose of the Investigate displays is to help you evaluate performance on
one node. All displays except one require use of a ReGIS-compatible terminal.
You may use the keypad or INVESTIGATE commands to control the display
and its characteristics.
INVESTIGATE Command Options
The INVESTIGATE commands are shown in the following table:
Command
Function
INVESTIGATE CPU_DISPLAY
Displays CPU
statistics.
INVESTIGATE IO_DISPLAY
Displays I/O
statistics.
INVESTIGATE
LOAD_BALANCE_DISPLAY
Displays load
balance statistics.
INVESTIGATE MEMORY_DISPLAY
Displays memory
statistics.
INVESTIGATE
SYSTEM_OVERVIEW_DISPLAY
Displays system
overview statistics.
Chapter 11: Use the Character-Cell Real-time Display 391
Evaluate Performance Using the Investigate Displays
The Load Balance display is the only Investigate display available for both
ReGIS and DEC_CRT terminals. It contains the same information in both
cases. On ReGIS terminals, it is a Kiviat graph, and for DEC_CRT terminals, it
is a bar graph.
The System Overview is the default Investigate display for ReGIS-compatible
terminals, and for non-ReGIS or DEC_CRT terminals the default is the Load
Balance display.
The following illustrations show an example of the ReGIS version of the system
Overview display, an example of the ReGIS Load Balance display (Kiviat), and
an example of the DEC_CRT (ANSI) version of the Load Balance display.
Additional displays show memory, I/O, and CPU statistics and require a ReGIScompatible terminal. There is also an example of the Memory display, an
example of the I/O display, and an example of the CPU display.
INVESTIGATE Keypad
The following illustration shows the functions of the INVESTIGATE keypad:
Evaluate Performance Using the Investigate Displays
The System and Load Balance displays provide graphic information to
determine which of the three main system resources (memory, I/O, or CPU) is
a limitation. To investigate a limitation in more detail, use the Memory, I/O,
and CPU displays.
Note: For a detailed description of a system tuning methodology, see HP's
OpenVMS Performance Management guide.
392 Performance Manager Administrator Guide
Evaluate Performance Using the Investigate Displays
When determining a limitation in a main resource, investigate the resources in
the following order:
1.
Memory
2.
I/O
3.
CPU
The order is important because memory limitations cause paging and
swapping, which lead to I/O and CPU problems.
Begin your tuning investigation by using the System Overview or Load Balance
displays, as shown in the following screens:
ReGIS System Overview Display
System Load Balance Display (ReGIS)
Chapter 11: Use the Character-Cell Real-time Display 393
Evaluate Performance Using the Investigate Displays
LOAD_BALANCE Display (ANSI)
Investigate a Memory Limitation
The chief indicators of a memory limitation are as follows:
No free memory
Look at the value of free pages, the memory bar histogram, and the
memory queue (Mem que).
If the value of free pages approaches that of FREELIM (the system
parameter that sets a lower limit on the number of pages on the free list),
this indicates a memory shortage.
The memory bar histogram shows the amount of memory used by the free
and modified page lists with respect to that available for user working
sets. Again, a shortage of memory for the page caches (free plus modify
lists) indicates a high degree of user memory utilization, and consequently
a memory shortage.
A nonzero value of Mem que indicates processes in the memory queue in
computable outswapped states, awaiting memory that is unavailable.
Page fault high
Look at the value of Pgflts (page faults), Sysflts (system faults), and
paging in the IO_window for disks.
394 Performance Manager Administrator Guide
Evaluate Performance Using the Investigate Displays
For a VAX-11/780 CPU, a value of Pgflts (page fault rate, or number of
faults [hard and soft, including system] per second) greater than 100 is
cause for concern. For other CPUs, use an appropriate threshold such as
that supplied with the factory knowledge base. If Pgflts is greater than this
number, page faults might be excessive on your system.
Sysflts (the rate at which pages are faulted into the system working set)
should be no more than 1 fault per second; otherwise, the system is
faulting itself to do work on the users' behalf. If system faults are high, it
might be necessary to increase the value of system parameter
SYSMWCNT, which controls the system working set size.
If disks are spending an excessive percentage of their time doing paging
(indicated by the disk bars in the IO_window), then a memory limitation is
causing harmful I/O effects.
Swapping high
Look at the value of “Inswaps,” the value of “Mem que,” and the amount
of swapping and modified page writing done by the disks (Swap/Mod in
the disk bars).
Inswaps gives the number of processes that were swapped back into
memory during the last sample interval, and Mem que is the number of
processes waiting for memory. If these are significant, then swapping is a
problem on your system, and either indicates a memory limitation or
memory management problem.
If disks are spending an excessive percentage of their time doing swapping
and modified page writing (indicated by the disk bars in the IO_window),
then a memory limitation is causing harmful I/O effects.
Investigate an I/O Limitation
The chief indicators of an I/O limitation are as follows:
Direct I/O high
Look at the value of Dir I/O, as well as Data in the disk bar histogram.
Dir I/O gives the system-wide direct I/O rate, including all disks. If there is
a high direct I/O rate for your system, the disks might be a bottleneck. A
value for direct I/O rate that exceeds this number indicates a high direct
I/O rate.
Data in the disk bars shows how much of the disk's time is spent doing I/O
on behalf of the user. A high rate for a given disk may indicate that the
disk is a bottleneck.
Buffered I/O high
A high value of Buf I/O (the buffered I/O rate) may indicate an I/O
limitation. If the value of Buf I/O exceeds this number, a high buffered I/O
rate is indicated.
Chapter 11: Use the Character-Cell Real-time Display 395
Evaluate Performance Using the Investigate Displays
Investigate a CPU Limitation
The chief indicators of a CPU limitation are as follows:
Processes in the CPU queue
Look at the value of CPU queue and at processes in the COM/CUR states in
the Priority bars.
CPU que gives the number of processes waiting for the CPU (COM state).
There is a real queue if this value is greater than 1. (The process displaced
by Performance Manager; the NULL process is not counted.) The existence
of a real CPU queue indicates a CPU limitation.
A significant number of processes in the COM/CUR states (COM =
computable, waiting for the CPU; CUR = the current process) also
indicates a CPU queue, and consequently a CPU limitation.
No idle time
Look at the Idle (Idl) bar in the center of the display. If there is no CPU
idle time, then the CPU is a limitation.
System CPU time high
Compare the system CPU time (sum of Int/Ker/Exe bars) with the task
CPU time (sum of Sup/Com/Use bars). The system CPU time is the sum of
time spent on the interrupt stack, and in kernel and executive modes. The
task CPU time is the sum of time spent in supervisor, compatibility, and
user modes. The sum of interrupt and kernel CPU time should not exceed
40 percent in most environments.
396 Performance Manager Administrator Guide
Evaluate Performance Using the Investigate Displays
Isolate the Cause of a Memory Limitation
If an examination of the system overview reveals a memory limitation, you
can investigate the cause of the limitation in more detail using the Memory
display. The following illustration is an example of the Memory display:
The Memory display draws attention to the following indicators:
Hard versus Soft faults
Look at the value of Hard flt and Soft flt. Hard flt gives the number of page
faults per second that were resolved by reading from the disk. Soft flt
gives the number of faults per second resolved from memory. A hard fault
involves I/O and is more expensive than a soft fault. Hard faults in a
properly managed system should be no more than about 10 percent of the
total faults (Hard flt + Soft flt).
Inappropriate working set (WS) sizes
Look at the Process bars at the right on the Memory display. This shows
the working set size and page fault rate for the top faulting processes.
Adjust the scaling factors, if necessary. Look for processes that are
faulting heavily but have small working sets. If your system has ample
memory, increase the working set quota (WSQUOTA) and the working set
extent (WSEXTENT) for these processes. If memory is short on your
system, increase WSQUOTA and WSEXTENT for these processes at the
expense of processes that are not faulting but have large working sets.
Chapter 11: Use the Character-Cell Real-time Display 397
Evaluate Performance Using the Investigate Displays
Inappropriate automatic working set adjustment (AWSA) parameters
Look at the Process bars at the right on the Memory display. Look for top
faulting processes with fluctuating working set sizes. If the working set
size for such a process increases and decreases accompanied by page
faulting, then the AWSA parameters might be out of adjustment. System
parameters that affect automatic working set adjustment are PFRATH,
PFRATL, WSINC, WSDEC, AWSTIME, AWSMIN, GROWLIM, BORROWLIM,
and QUANTUM. Automatic decrementing can be turned off by setting
PFRATL = 0 (this is normally recommended). Do not change any of the
other parameters without a thorough understanding of the AWSA
mechanism.
The automatic memory reclamation mechanism of OpenVMS should be
enabled. This is controlled with the SYSGEN parameter MMG.CTLFLAGS.
Too many image activations
Look at the value of Dzero flts. A large number of demand zero faults
indicates an excessive number of image activations. Activating an image in
a process involves considerable overhead. If Dzero faults is a large
percentage of total faults (Hard flt + Soft flt), image activations might be
excessive. Paging induced by image activations is unlikely to respond to
system parameter changes. Application design changes are needed.
Balance set too small
Look at Proc cnt (number of processes on system), Balset (number of
processes in balance set), Free pgs (number of pages of free memory),
and swapped processes. If the balance set count is too small, processes
are swapped even if there is still free memory. If Balset is significantly less
than Proc cnt, and Free pgs is adequate, then the balance set count is too
low. Set the system parameter BALSETCNT to a value two less than the
system parameter MAXPROCESSCNT.
A few active processes consuming memory
Look at the Process bars, in particular for active processes with large
working sets. For example, a low priority compute-bound process is less
likely to be swapped than one that performs terminal I/O. They may cause
other processes to swap.
Decreasing DORMANTWAIT may help if the large processes are above their
working set quotas. You can also suspend the large process with SET
PROCESS/SUSPEND and allow the swapper to trim it back to
SWPOUTPGCNT. The underlying problem might be that WSQUOTA is too
large for the process.
398 Performance Manager Administrator Guide
Evaluate Performance Using the Investigate Displays
Large processes with swapping disabled
Look at the Working Set and Process bars for inactive processes with large
working sets. If these processes have swapping disabled, they cannot be
swapped but retain memory at the expense of other processes. Use the
system dump analyzer (SDA) to see if a large, inactive process has the
PSWAPM (prohibit swap mode) bit set.
Inappropriate page cache sizes
Look at the page fault rate (Hard flt and Soft flt), free memory (Free pgs),
and swapping (Working Set and Process bars).
If the overall fault rate is high, and the faults are mostly soft faults, the
page cache might be too large. This may also be accompanied by
swapping and extensive free and modified page lists. The page cache is
encroaching on memory that could be made available for working sets.
If the overall faulting rate is low while the hard fault rate is high, the page
cache is ineffective; that is, the free page list and/or modified page list is
too small. There is ample memory for working sets but the caching
effectiveness is low.
The sizes of the page caches are controlled by the system parameters
FREELIM, FREEGOAL, MPW_LOLIMIT, and MPW_THRESH.
Isolate the Cause of an I/O Limitation
If an examination of the system overview reveals an I/O limitation, you can
investigate the cause of the limitation in more detail using the I/O display.
The following illustration is an example of the I/O display:
Chapter 11: Use the Character-Cell Real-time Display 399
Evaluate Performance Using the Investigate Displays
Isolate the Cause of a CPU Limitation
If an examination of the system overview reveals a CPU limitation, you can
investigate the cause of the limitation in more detail using the CPU display.
The following illustration is an example of the CPU display:
Examine the following CPU display indicators:
Any available CPU
Look at the Idl bar (CPU Idle time) in the CPU mode bars in the middle of
the CPU display. If there is no idle time, the CPU is a bottleneck.
A few processes blocking other processes
The blocking high-priority process might be: running an inefficient
program, acting as a server, or acting as a process with which other
processes must communicate.
Look at the Priority bars for high-priority, active processes, or at the
Process bars for high-priority processes with a high CPU time percentage.
Corrective action might include changing process priorities in the user
authorization file, defining priorities in the user login command file, or
changing the priorities of processes while they execute.
Lost CPU time
Look at Page wait, Swap wait, and Pg+Swp Wt. CPU time might be lost
because the CPU has to wait for disk transfers, or page or swap I/O to
complete.
A high value of Pg+Swp Wt is cause for concern. It indicates a memory
problem resulting in a CPU limitation.
400 Performance Manager Administrator Guide
Exit the Character-Cell Displays
High device CPU usage
Look at the CPU mode bars, Int (interrupt stack). A high value for Int
might be cause for concern. Processes might be blocked from using the
CPU because of too many device interrupts.
Use the ADVISE COLLECT SYSTEM command to collect system-wide PC
samples and determine the system module usage (for example, the device
driver); hence, the device(s) responsible for the excessive interrupts.
Excessive kernel and/or executive CPU time
Look at the Ker (Kernel) and Exe (Executive) bars in the CPU mode bars. If
time in Kernel mode is excessive and is not due to page faulting, or if time
in Executive mode is excessive, use the ADVISE COLLECT SYSTEM
command to collect system-wide PC samples, and determine the processes
and system modules responsible.
Interrupt plus kernel CPU time should not be greater than 40 percent of
total CPU time.
Exit the Character-Cell Displays
To exit the Performance Manager Real-time character-cell displays
■
Press Ctrl+Z at the PSRT> prompt.
Chapter 11: Use the Character-Cell Real-time Display 401
Appendix A: Performance Manager
Messages and Recovery Procedures
This appendix describes messages that the Performance Manager software
generates.
This section contains the following topics:
Sample Performance Manager Message (see page 403)
Severity Codes (see page 403)
Sample Performance Manager Message
The following illustration illustrates the parts of a sample Performance
Manager message:
Severity Codes
The following table defines the severity codes that are assigned to messages:
Severity Code
Explanation
I
Informational; the Performance Manager software
sometimes provides additional information about an action.
W
Warning; the command may have performed some, but
not all, of a requested action; verify the command or
output.
Appendix A: Performance Manager Messages and Recovery Procedures 403
Severity Codes
Severity Code
Explanation
E
Error; The output or program result is incorrect, but the
Performance Manager software attempts to continue the
execution.
F
Fatal; the Performance Manager software terminates
execution of the request.
To display error messages
■
Type the following command:
$ HELP ADVISE PERFORMANCE ERROR
Each description includes a recovery procedure. Messages are listed
alphabetically by the identification code that precedes the text of each
message.
404 Performance Manager Administrator Guide
Appendix B: Performance Manager
Logical Names
Performance Manager logical names begin with the prefix PSPA$. This
appendix lists those names and describes how they are used to control various
aspects of the Performance Manager module.
This section contains the following topics:
PSPA$DISPLAY_PROCESS_CPU_UNNORMALIZED (see page 405)
PSPA$DNS_NAMES (see page 406)
PSPA$EXAMPLES (see page 406)
PSPA$GIVE_DEVICE_SERVICE (see page 406)
PSPA$GRAPH_CHARS (see page 406)
PSPA$GRAPH_FILE_DEVICE (see page 407)
PSPA$GRAPH_FILE_DIRECTORY (see page 407)
PSPA$GRAPH_LEGEND_FONT_POINT (see page 407)
PSPA$GRAPH_PATH (see page 407)
PSPA$HLS (see page 407)
PSPA$PIE_FONT_POINT (see page 408)
PSPA$PS_RGB_1 through PSPA$PS_RGB_6 (see page 408)
PSPA$SKIP_DISK_FILTER (see page 409)
PSPA$SKIP_PIE_PERCENT (see page 409)
PSPA$SUPRESS_TAPE_STATS_BY_VOLUME (see page 409)
PSPA$UNNORMALIZE_CUSTOM_CPU (see page 409)
PSPA$DISPLAY_PROCESS_CPU_UNNORMALIZED
When this logical name is defined to anything, the Real-time Character-Cell
display utility (ADVISE PERFORMANCE DISPLAY CHARACTER_CELL) displays
the process CPU Utilization percentage relative to a single CPU, rather than to
the total CPU time available for all CPUs in the system. This has an effect only
when viewing processes on an SMP system containing more than one CPU. By
default all CPU percentages are displayed relative to the total CPU time across
all CPUs in the system.
This logical name has an effect on the single-node display and the process
display when the current process key is either Top PID or Top Process. Top
Users, Images, or Accounts will always show the CPU utilization percentage
normalized with respect to the total system CPU time.
Appendix B: Performance Manager Logical Names 405
PSPA$DNS_NAMES
PSPA$DNS_NAMES
Define this logical name in the Process table to a node name translation file
specification. Create this file to enable Real-time data transport in DECnet
Phase V environments when Node Synonyms are not defined.
The file contains translations from OpenVMS cluster to DECnet Phase V
fullname. The format of this ASCII file is one translation per line that consists
of two names separated by a comma. The first name is a one to six character
OpenVMS cluster name and the second name is a one to five hundred eleven
character DECnet Phase V fullname (or segment thereof) or address that
DECnet/OSI Phase V software will accept to establish a network connection.
For example:
LATOUR,DEC:.TAY.StanWilks
PSPA$EXAMPLES
A system logical name defined by PSPA$STARTUP.COM indicating the directory
where Performance Manager example files are located. This area may contain
the following commands or rules:
PSPA$DAILY.COM
Template command procedure to generate daily
reports
PSPA$GETDATA.COM
Command procedure to create image from
PSPA$GETDATA.MAR and .C
PSPA$KB.VPR
Performance Manager factory rules source file
PSPA$GIVE_DEVICE_SERVICE
For the disk statistics section of the Performance Evaluation Report, the
column labeled “Busy %” is changed to “Service Time,” when this logical name
is defined to anything.
PSPA$GRAPH_CHARS
A user defined logical which specifies a string of six characters to be used in
place of the normal ANSI graph legend characters.
406 Performance Manager Administrator Guide
PSPA$GRAPH_FILE_DEVICE
PSPA$GRAPH_FILE_DEVICE
A user defined logical which when defined to anything causes the graph
metrics for File Names to be displayed by file name and device.
PSPA$GRAPH_FILE_DIRECTORY
A user defined logical which when defined to anything causes the graph
metrics for File Names to be displayed by file name and directory.
PSPA$GRAPH_LEGEND_FONT_POINT
Define this logical name to a number specifying a font point size for the
PostScript graph item labels. If the PostScript Graph labels are longer than 24
characters, and you do not want the labels truncated, use this logical name to
cause the labels to not truncate, and to be reduced in size, so as to fit on the
page. By default, the graph legend font point is 10. Defining
PSPA$GRAPH_LEGEND_FONT_POINT to 7 should reduce the font sufficiently,
and a 5 makes the font size very small, but accommodates up to 50
characters.
PSPA$GRAPH_PATH
When this logical name is defined to anything, the graph metrics for “SCS
Nodes” is displayed by pathname instead of nodename. This provides more
detailed information about the load on each adapter for a given node.
PSPA$HLS
Specifies ReGIS HLS encodings enabling user specifications of color planes for
the Performance Manager Color ReGIS graphs. The equivalence string must be
a sequence of 4 plane definitions. The following example demonstrates the
setting for the default graph colors:
$ DEFINE PSPA$HLS "H0L0S0 H0L50S50 H160L42S100 H0L100S0"
In this example, plane 0 is black (L0 - lightness zero%)and plane 3 is white
(L100 - lightness 100%). H is HUE (0-360), S is SATURATION (0-100).
Appendix B: Performance Manager Logical Names 407
PSPA$PIE_FONT_POINT
PSPA$PIE_FONT_POINT
Define this logical name to a number specifying a font point size for the
PostScript pie chart item labels. If the pie chart labels are so long that they
extend beyond the sides of the paper, use this logical name to cause the labels
to fit on the page. By default PSPA$PIE_FONT_POINT is set to 10. Setting it to
7 should reduce the font sufficiently.
PSPA$PS_RGB_1 through PSPA$PS_RGB_6
These logical names allow the setting of the RGB color settings for the
Performance Manager Color PostScript graphs. You can also use them to
specify grey shades for black and white printers.
Each logical name pertains to one of the 6 colors that may appear.
PSPA$PS_RGB_1 refers to the first color, appearing at the bottom of the
graph, whose legend is located at the lower right of the display.
Specify a triplet of decimal values, separated by spaces, in the range of 0-1,
where the first is for red, then green, and blue. A lower value produces a
darker shade. For example the following settings establish the default colors
for Performance Manager PostScript Graph Colors:
DEFINE PSPA$PS_RGB_1 ".22 1 .55"
Green
DEFINE PSPA$PS_RGB_2 ".77 .44 1 "
Magenta
DEFINE PSPA$PS_RGB_3 ".88 .77 .11"
Yellow
DEFINE PSPA$PS_RGB_4 ".33 .33 .22"
Brown
DEFINE PSPA$PS_RGB_5 "1 .22 0 "
Red, slightly Orange
DEFINE PSPA$PS_RGB_6 "0 0 1 "
Blue
If you want to specify grey shades, make the values for red, green and blue
the same. For example:
DEFINE PSPA$PS_RGB_1 "0 0 0"
Black
DEFINE PSPA$PS_RGB_2 ".2 .2 .2"
DEFINE PSPA$PS_RGB_3 ".4 .4 .4"
DEFINE PSPA$PS_RGB_4 ".6 .6 .6"
DEFINE PSPA$PS_RGB_5 ".8 .8 .8"
DEFINE PSPA$PS_RGB_6 ".95 .95 .95"
408 Performance Manager Administrator Guide
near White
PSPA$SKIP_DISK_FILTER
PSPA$SKIP_DISK_FILTER
For the disk reports, you can enable this logical name to have entries for
shadowset member units included. By default, shadowset member units are
not included in the disk reports. The logical name is enabled when defined to
anything.
PSPA$SKIP_PIE_PERCENT
Define this logical to anything to suppress the printing of the percentages on
the pie charts. If the pie chart labels are so long that they extend beyond the
sides of the paper, the use of this logical name may make the labels fit.
PSPA$SUPRESS_TAPE_STATS_BY_VOLUME
The Tape Statistics section of the Performance Evaluation Report has a section
for volumes, and a section for tape devices. If you define this logical name to
anything, the tape statistics by volume is suppressed.
PSPA$UNNORMALIZE_CUSTOM_CPU
When this logical name is defined to anything, custom graphs of CPU
utilization, depicting more than one node, will not have the percentage scaled
by the nodes' Relative CPU power. By default, all composite graphs of CPU
Utilization are scaled by each node's Relative CPU Power.
Appendix B: Performance Manager Logical Names 409
Appendix C: Performance Manager
Data Cells
Data cells provide access to Performance Manager data for writing analysis
rules or for writing your own applications. Each data cell entry is displayed in
the following format:
■
Data cell name (derived)
■
Description
■
Data Type
■
Domains
■
Target Domain
The data cell name is the name used when writing auxiliary rules. If a data cell
is calculated from other data cells, thresholds, or provided routines, the word
derived will be displayed in parentheses after its name.
The description explains the contents of the data cell. The data type describes
the format of the data. Valid data types are:
■
INDEX-SPECIFIER
■
NUMERIC
■
SCAN-ROUTINE
■
STRING
■
TALLY
■
TIME
Domains identify the valid domains, by name, from which a rule may reference
a data cell. When writing rules, specify a domain name as the rule's domain to
access the data cell.
This section contains the following topics:
Data Cell Navigation Table (see page 412)
Performance Manager Data Cells (see page 413)
Appendix C: Performance Manager Data Cells 411
Data Cell Navigation Table
Data Cell Navigation Table
Use the following commands to navigate the data cells:
Click... To move to this set of data cell descriptions...
A
ACTIVE_PROCESSORS through AWSA_IS_SLOW
B
BADPAGE_FAULT_RATE through BYTES_IN_PAGED_POOL
C
CHANNEL_OVER_THRESH_PORT through CW_VOLUME_NAME
D
DATAGRAMS_DISCARDED through DYN_MAXLEN
E
ENQUEUE_LOCKS_NOT_QUEUED_RATE through EXEC
F
FAMILY_NAME through FREE_BALANCE_SET_SLOTS
G
GLOBALPAGE_FAULT_RATE through GLOBAL_PGS_TALLY
H
HARD_FAULT_RATE through HSC_TYPE_HSC90
I
IDLE through IS_A_VAX
K
KB_MAPPED through KERNEL
L
LARGEST_BLK_IN_NONPAGED_POOL through LRP_MAXLEN
M
MAILBOX_READ_RATE through MULTI_IO
N
NETWORK_COUNT through NUM_PROCS_NOT_USING_WS_LOANS
O
OPEN_FILES through OUT_SWAP_RATE
Pa
PAGEFILE_PAGE_READ_RATE through PRIORITY_LOCKOUT
Pr
PROCESSES_IN_CEF through PSWP_WAIT
Q
QUOTA_CACHE_AR through QUOTA_CACHE_HR
R
RDTS_IN_LIST through RDT_WAIT_RATE
Sc
SCS_ADAPTERNAME through SWAP_WAIT
Sy
SYSGEN_ACP_DINDXCACHE through SYSTEM_FAULT_RATE
T
TAPE_CONTROLLER through TROLLER_IS_ON
U
USER through USER_NAME
V
VBS_INTSTK through VOLUME_NAME
W
WINDOW_TURN_RATE through WS_DECREMENTING_TOO_SEVERE
X
XQP_ACCESS_LOCK_RATE through
XQP_VOL_SYNCH_LOCK_WAIT_RATE
412 Performance Manager Administrator Guide
Performance Manager Data Cells
Performance Manager Data Cells
ACTIVE_PROCESSORS (Derived)
This is the number of active CPUs for the local node for the current interval
record in LOCAL domain, and for the local node for the last interval record in
SUMMARY domain.
Data Type:
NUMERIC
Domains:
COM,CFG,CPU,DSK,FIL,LOC,PRO,SUM,TAP
ANYIO_BUSYMET_F_SPMIOBUSY
Percentage of time that at least one disk device was busy for the local node for
the current interval record.
Data Type:
NUMERIC
Domains:
COM,CFG,CPU,DSK,FIL,LOC,PRO,TAP
ANY_DISK_FULL (Derived)
This contains a Boolean value zero or one; where one (truth) represents the
fact that the percentage of free space on any disk is less than or equal to the
minimum disk free space percentage threshold, TD_MIN_DSKSPC_PCT. The
data cell refers to the local node for the current interval record.
Data Type:
NUMERIC
Domains:
COM,CFG,CPU,DSK,FIL,LOC,PRO,TAP
ANY_DISK_OVER_QL_THRESHOLD (Derived)
This contains a Boolean value zero or one; where one (truth) represents the
fact that the queue length on any disk is greater than or equal to the
maximum disk queue length threshold, TD_DISK_QL_MAX. The data cell refers
to the local node for the current interval record.
Data Type:
NUMERIC
Domains:
COM,CFG,CPU,DSK,FIL,LOC,PRO,TAP
Appendix C: Performance Manager Data Cells 413
Performance Manager Data Cells
ANY_DISK_OVER_THRESHOLD (Derived)
This contains a Boolean value zero or one; where one (truth) represents the
fact that the operations rate on any disk is greater than or equal to the
threshold for that disk type. The disk I/O threshold, such as TD_T21_RA81, is
of the form TD_Tn_xxxx where n is the integer disk type as defined in
STARLET, and xxxx is the disk model name. The data cell refers to the local
node for the current interval record.
Data Type:
NUMERIC
Domains:
COM,CFG,CPU,DSK,FIL,LOC,PRO,TAP
ARRIVG_DECNET_PACKET_RATEMET_F_ARRLOCPK
Average DECNET arriving local packet rate per second for the local node for
the current interval record.
Data Type:
NUMERIC
Domains:
COM,CFG,CPU,DSK,FIL,LOC,PRO,TAP
AVERAGE_IRPS_INUSE (Derived)
This contains a value representing the average number of IRPs in use on the
local node for all of the intervals.
Data Type:
NUMERIC
Domains:
SUMMARY
AVERAGE_LOCKS_INUSE (Derived)
This contains a value representing the average number of locks in use on the
local node for all of the intervals.
Data Type:
NUMERIC
Domains:
SUMMARY
AVERAGE_LRPS_INUSE (Derived)
This contains a value representing the average number of LRPsin use on the
local node for all of the intervals.
Data Type:
NUMERIC
Domains:
SUMMARY
414 Performance Manager Administrator Guide
Performance Manager Data Cells
AVERAGE_RESOURCES_INUSE (Derived)
This contains a value representing the average number of resources in use on
the local node for all of the intervals.
Data Type:
NUMERIC
Domains:
SUMMARY
AVERAGE_SRPS_INUSE (Derived)
This contains a value representing the average number of SRPs in use on the
local node for all of the intervals.
Data Type:
NUMERIC
Domains:
SUMMARY
AVERAGE_WORKING_SET_SIZE (Derived)
This contains the value of the average working set size for all processes for the
local node for the current interval.
Data Type:
NUMERIC
Domains:
COM,CFG,CPU,DSK,FIL,LOC,PRO,TAP
AVG_NONPAGEDPOOLBYTES_INUSE (Derived)
This contains a value representing the average number of non-page pool bytes
in use on the local node for all of the intervals.
Data Type:
NUMERIC
Domains:
SUMMARY
AWSA_IS_SLOW (Derived)
This contains a Boolean value zero or one where one (truth) represents the
presence of slow automatic working set adjustment for 2 or more processes on
the local node for the current interval.
Data Type:
NUMERIC
Domains:
COM,CFG,CPU,DSK,FIL,LOC,PRO,TAP
BADPAGE_FAULT_RATEMET_F_BADPAGE_FAULTS
Average number of page faults per second from the bad page list for the local
node for the current interval record.
Data Type:
NUMERIC
Domains:
COM,CFG,CPU,DSK,FIL,LOC,PRO,TAP
Appendix C: Performance Manager Data Cells 415
Performance Manager Data Cells
BATCH_COUNTMET_F_BATCH
This contains a value representing the average number of batch processes on
the local node for the current interval.
Data Type:
NUMERIC
Domains:
COM,CFG,CPU,DSK,FIL,LOC,PRO,TAP
BIG_WS_AND_BIG_QUOTAS (Derived)
This contains a Boolean value representing the presence of large working sets
and quotas on the local node for the current interval.
Data Type:
NUMERIC
Domains:
COM,CFG,CPU,DSK,FIL,LOC,PRO,TAP
BLKS_FREE_IN_NONPAGED_POOLMET_F_NP_FREE_BLOCKS
This contains the number of free blocks in non-paged pool for the current
interval for the local node.
Data Type:
NUMERIC
Domains:
COM,CFG,CPU,DSK,FIL,LOC,PRO,TAP
BLKS_FREE_IN_PAGED_POOLMET_F_PG_FREE_BLOCKS)
This contains the number of free blocks in paged pool for the current interval
for the local node.
Data Type:
NUMERIC
Domains:
COM,CFG,CPU,DSK,FIL,LOC,PRO,TAP
BLOCK_REQUEST_DATAS_INITIATEDSCS_F_REQDATS
This contains the value representing the number of block transfers initiated
per second for request data's on the local node to the remote node for the
current configuration record and interval.
Data Type:
NUMERIC
Domains:
CFG
416 Performance Manager Administrator Guide
Performance Manager Data Cells
BLOCK_REQUEST_DATAS_INIT_TALLY (Derived)
This contains the sum of the values representing the number of block transfers
initiated per second for request data's on the local node to the remote node for
all the current configuration subrecords which were selected by the most
recent CONFIGURATION_SCAN routine operation.
Data Type:
TALLY
Domains:
COM,CFG,CPU,DSK,FIL,LOC,PRO,TAP
Target Domains: CFG
BLOCK_SEND_DATAS_INITIATEDSCS_F_SNDATS
This contains the value representing the number of block transfers initiated
per second on the local node to the remote node for the current configuration
record and interval.
Data Type:
NUMERIC
Domains:
CFG
BLOCK_SEND_DATAS_INIT_TALLY (Derived)
This contains the sum of the values representing the number of block transfers
initiated per second on the local node to the remote node for all the current
configuration subrecords that were selected by the most recent
CONFIGURATION_SCAN routine operation.
Data Type:
TALLY
Domains:
COM,CFG,CPU,DSK,FIL,LOC,PRO,TAP
Target Domains: CFG
BUFFERED_IO_RATEMET_F_BUFIO
Average buffered I/O rate per second for the local node for the current interval
record.
Data Type:
NUMERIC
Domains:
COM,CFG,CPU,DSK,FIL,LOC,PRO,TAP
BUFFER_DESC_QUEUE_RATESCS_F_QBDT_CNT
This contains the value representing the number of times per second that a
block transfer was queued because there were no available buffers on the local
node to receive data from the remote node for the current configuration record
and interval.
Data Type:
NUMERIC
Appendix C: Performance Manager Data Cells 417
Performance Manager Data Cells
Domains:
CFG
BUFFER_DESC_QUEUE_TALLY (Derived)
This contains the sum of the values representing the number of times per
second that a block transfer was queued because there were no available
buffers on the local node to receive data from the remote node for all the
current configuration subrecords which were selected by the most recent
CONFIGURATION_SCAN routine operation.
Data Type:
TALLY
Domains:
COM,CFG,CPU,DSK,FIL,LOC,PRO,TAP
Target Domains: CFG
BYTES_FREE_IN_NONPAGED_POOLMET_F_NP_FREE
This contains the number of free bytes in non-paged pool for the current
interval for the local node.
Data Type:
NUMERIC
Domains:
COM,CFG,CPU,DSK,FIL,LOC,PRO,TAP
BYTES_FREE_IN_PAGED_POOLMET_F_PG_FREE
This contains the number of free bytes in paged pool for the current interval
for the local node.
Data Type:
NUMERIC
Domains:
COM,CFG,CPU,DSK,FIL,LOC,PRO,TAP
BYTES_IN_NONPAGED_POOLMET_F_NP_POOL_MAX
This contains the number of bytes in non-paged pool for the current interval
for the local node.
Data Type:
NUMERIC
Domains:
COM,CFG,CPU,DSK,FIL,LOC,PRO,TAP
BYTES_IN_PAGED_POOLMET_F_PG_POOL_MAX
This contains the number of bytes in paged pool for the current interval for the
local node.
Data Type:
NUMERIC
Domains:
COM,CFG,CPU,DSK,FIL,LOC,PRO,TAP
418 Performance Manager Administrator Guide
Performance Manager Data Cells
CACHE_FREEMET_F_CACHE_FREE
This contains the number of free pages in the I/O Cache for the current
interval for the local node.
Data Type:
NUMERIC
Domains:
COM,CFG,CPU,DSK,FIL,LOC,PRO,TAP
CACHE_MAXIMUMMET_F_CACHE_MAXI
This contains the maximum number of pages (SPTEs) in the I/O Cache for the
current interval for the local node.
Data Type:
NUMERIC
Domains:
COM,CFG,CPU,DSK,FIL,LOC,PRO,TAP
CACHE_MISSES_LT33MET_F_CACHE_MISS_LT33
The number of read operations with a block size less than 33 that bypassed
the XFC for the current interval for the local node.
Data Type:
NUMERIC
Domains:
LOC
CACHE_MISSES_3364MET_F_CACHE_MISS_3364
The number of read operations with a block size from 33 to 65 that bypassed
the XFC for the current interval for the local node
Data Type:
NUMERIC
Domains:
LOC
CACHE_MISSES_65127MET_F_CACHE_MISS_65127
The number of read operations with a block size from 33 to 65 that bypassed
the XFC for the current interval for the local node
Data Type:
NUMERIC
Domains:
LOC
CACHE_MISSES_128255MET_F_CACHE_MISS_128255
The number of read operations with a block size from 128 to 255 that
bypassed the XFC for the current interval for the local node
Data Type:
NUMERIC
Domains:
LOC
Appendix C: Performance Manager Data Cells 419
Performance Manager Data Cells
CACHE_MISSES_GT255MET_F_CACHE_MISS_GT255
The number of read operations with a block size greater than 255 that
bypassed the XFC for the current interval for the local node
Data Type:
NUMERIC
Domains:
LOC
CACHE_RBYPASSMET_F_CACHE_RBYPASS
This contains the number of read I/O operations per second bypassing the I/O
cache for the current interval for the local node.
Data Type:
NUMERIC
Domains:
COM,CFG,CPU,DSK,FIL,LOC,PRO,TAP
CACHE_READHITSMET_F_CACHE_READHITS
This contains the number of read I/O operations per second to the I/O Cache
that were satisfied by the cache, for the current interval for the local node.
Data Type:
NUMERIC
Domains:
COM,CFG,CPU,DSK,FIL,LOC,PRO,TAP
CACHE_READIOMET_F_CACHE_RDIO
This contains the number of read I/O operations per second to the I/O Cache
for the current interval for the local node.
Data Type:
NUMERIC
Domains:
COM,CFG,CPU,DSK,FIL,LOC,PRO,TAP
CACHE_SIZEMET_F_CACHE_SIZE
This contains the current size (in pages) of the I/O Cache for the current
interval for the local node.
Data Type:
NUMERIC
Domains:
COM,CFG,CPU,DSK,FIL,LOC,PRO,TAP
CACHE_USEDMET_F_CACHE_USED
This contains the number of used pages in the I/O Cache for the current
interval for the local node.
Data Type:
NUMERIC
Domains:
COM,CFG,CPU,DSK,FIL,LOC,PRO,TAP
420 Performance Manager Administrator Guide
Performance Manager Data Cells
CACHE_WBYPASSMET_F_CACHE_WBYPASS
This contains the number of write I/O operations per second bypassing the I/O
Cache for the current interval for the local node.
Data Type:
NUMERIC
Domains:
COM,CFG,CPU,DSK,FIL,LOC,PRO,TAP
CACHE_WRITEIOMET_F_CACHE_WRIO
This contains the number of write I/O operations per second to the I/O Cache
for the current interval for the local node.
Data Type:
NUMERIC
Domains:
COM,CFG,CPU,DSK,FIL,LOC,PRO,TAP
CHANNEL_OVER_THRESH_PORT (Derived)
This contains the adapter nexus number that is experiencing excessive
throughput on the local node for the current interval, or a zero. It is zero if the
Boolean data cell EXCESS_THRUPUT_ON_ANY_CHANNEL is zero.
Data Type:
NUMERIC
Domains:
COM,CFG,CPU,DSK,FIL,LOC,PRO,TAP
CHANNEL_OVER_THRESH_THRUPUT (Derived)
This contains a value representing the throughput rate through the adapter
nexus port that is experiencing excessive throughput on the local node for the
current interval, or a zero. It is zero if the Boolean data cell
EXCESS_THRUPUT_ON_ANY_CHANNEL is zero.
Data Type:
NUMERIC
Domains:
COM,CFG,CPU,DSK,FIL,LOC,PRO,TAP
CHANNEL_OVER_THRESH_TYPE (Derived)
This contains a text string representing the type of I/O adapter such as "CI",
"MASSBUS",... that is experiencing excessive throughput on the local node for
the current interval, or "None". It is "None" if the Boolean data cell
EXCESS_THRUPUT_ON_ANY_CHANNEL is zero.
Data Type:
NUMERIC
Domains:
COM,CFG,CPU,DSK,FIL,LOC,PRO,TAP
Appendix C: Performance Manager Data Cells 421
Performance Manager Data Cells
COMMUNICATION_SCAN (Derived)
Provides the count of communication subrecords for which the specified rule
expression is true. The expression will be evaluated for each communication
subrecord.
Data Type:
SCAN
Domains:
COM,CFG,CPU,DSK,FIL,LOC,PRO,TAP
Target Domains: COM
COMM_CONTROLLER_NAMECOM_A_CTLR_NAME
This contains a string indicating the terminal controller of the current
communication subrecord for the current interval.
Data Type:
STRING
Domains:
COM
COMM_OPERATION_RATECOM_F_OPCNT
This contains a value representing the average operations rate for the current
communications subrecord on the local node for the current interval.
Data Type:
NUMERIC
Domains:
COM
COMM_OPERATION_RATE_TALLY (Derived)
This contains a value representing the sum of values of the average operations
rate for all the current communications subrecords which were selected by the
most recent COMMUNICATION_SCAN routine operation.
Data Type:
TALLY
Domains:
COM,CFG,CPU,DSK,FIL,LOC,PRO,TAP
Target Domains: COM
COMO_PROCESSES_ARE_AT_BPRI (Derived)
This contains a Boolean value zero or one, one (true) representing the
presence of processes in computable outswapped state and running at base
priority on the local node for the current interval.
Data Type:
NUMERIC
Domains:
COM,CFG,CPU,DSK,FIL,LOC,PRO,TAP
422 Performance Manager Administrator Guide
Performance Manager Data Cells
COMPATMET_F_COMPAT
Average percentage of CPU time spent in Compatibility mode for all processors
in the local node for the current interval record.
Data Type:
NUMERIC
Domains:
COM,CFG,CPU,DSK,FIL,LOC,PRO,TAP
COMPUTABLE_PROCESSES (Derived)
This contains a value representing the number of computable processes
(MET_F_COM + MET_F_COMO) on the local node for the current interval.
Data Type:
NUMERIC
Domains:
COM,CFG,CPU,DSK,FIL,LOC,PRO,TAP
COMPUTABLE_PROCESSES_OVR_DEFPRI (Derived)
This contains a value representing the number of computable processes with a
scheduling priority at or above the default priority DEFPRI on the local node for
the current interval.
Data Type:
NUMERIC
Domains:
COM,CFG,CPU,DSK,FIL,LOC,PRO,TAP
COM_SCALING (Derived)
This contains a value representing scaling factor for the compute queue length
for the local node. The value is obtained from the threshold
TD_COM_SCALING_n where n is the hardware model number of the local
node. By default, if the local node is a VAX 11-780, the value would be 1.0.
The value of this data cell can be modified using a threshold construct.
Data Type:
NUMERIC
Domains:
COM,CFG,CPU,DSK,FIL,LOC,PRO,TAP
CONFIGURATION_SCAN (Derived)
Provides the count of configuration subrecords for which the specified rule
condition is true. The condition will be evaluated for each configuration
subrecord.
Data Type:
SCAN
Domains:
COM,CFG,CPU,DSK,FIL,LOC,PRO,TAP
Target Domains: CFG
Appendix C: Performance Manager Data Cells 423
Performance Manager Data Cells
CPUIO_BUSYMET_F_SPMCPUIO
Percentage of time that both the CPU and at least one disk device were busy
for the local node for the current interval record.
Data Type:
NUMERIC
Domains:
COM,CFG,CPU,DSK,FIL,LOC,PRO,TAP
CPUIO_IDLEMET_F_SPMSYSIDLE
Percentage of time that the CPU and all disk devices were idle for the local
node for the current interval record.
Data Type:
NUMERIC
Domains:
COM,CFG,CPU,DSK,FIL,LOC,PRO,TAP
CPU_BUSYMET_F_SPMBUSY
Percentage of time that the CPU was busy for the local node for the current
interval record.
Data Type:
NUMERIC
Domains:
COM,CFG,CPU,DSK,FIL,LOC,PRO,TAP
CPU_COMPATCPU_F_COMPAT
This contains the value representing the percent of time spent in
COMPATIBILITY mode for the physical CPU represented by the current CPU
subrecord and interval.
Data Type:
NUMERIC
Domains:
CPU
CPU_COMPAT_TALLY (Derived)
This contains the sum of the values representing the percent of time in
COMPATIBILITY mode for the current CPU subrecords which were selected by
the most recent CPU_SCAN routine operation.
Data Type:
TALLY
Domains:
COM,CFG,CPU,DSK,FIL,LOC,PRO,TAP
Target Domains: CPU
424 Performance Manager Administrator Guide
Performance Manager Data Cells
CPU_EXECCPU_F_EXEC
This contains the value representing the percent of time spent in EXEC mode
for the physical CPU represented by the current CPU subrecord and interval.
Data Type:
NUMERIC
Domains:
CPU
CPU_EXEC_TALLY (Derived)
This contains the sum of the values representing the percent of time in EXEC
mode for the current CPU subrecords which were selected by the most recent
CPU_SCAN routine operation.
Data Type:
TALLY
Domains:
COM,CFG,CPU,DSK,FIL,LOC,PRO,TAP
Target Domains: CPU
CPU_IDLECPU_F_NULL
This contains the value representing the percent of time the CPU was idle for
the physical CPU represented by the current CPU subrecord and interval.
Data Type:
NUMERIC
Domains:
CPU
CPU_IDLE_TALLY (Derived)
This contains the sum of the values representing the percent of time the CPU
was idle for the current CPU subrecords which were selected by the most
recent CPU_SCAN routine operation.
Data Type:
TALLY
Domains:
COM,CFG,CPU,DSK,FIL,LOC,PRO,TAP
Target Domains: CPU
CPU_INTERRUPTCPU_F_INTERRUPT
This contains the value representing the percent of time spent on the interrupt
stack for the physical CPU represented by the current CPU subrecord and
interval.
Data Type:
NUMERIC
Domains:
CPU
Appendix C: Performance Manager Data Cells 425
Performance Manager Data Cells
CPU_INTERRUPT_TALLY (Derived)
This contains the value representing the percent of time spent on the interrupt
stack for the physical CPU represented by the current CPU subrecord and
interval.
Data Type:
TALLY
Domains:
COM,CFG,CPU,DSK,FIL,LOC,PRO,TAP
Target Domains: CPU
CPU_IS_PRIMARYCPU_C_PRIMID
This contains either the values 1, if the CPU for the current CPU subrecord is
the primary CPU, or a 0 if it is not the primary CPU.
Data Type:
NUMERIC
Domains:
CPU
CPU_IS_RUNNINGCPU_C_RUN
This contains either the values 1, if the physical CPU for the current CPU
subrecord is running, or a 0 if it is stopped.
Data Type:
NUMERIC
Domains:
CPU
CPU_KERNELCPU_F_KERNEL
This contains the value representing the percent of time spent in KERNEL
mode for the physical CPU represented by the current CPU subrecord and
interval.
Data Type:
NUMERIC
Domains:
CPU
CPU_KERNEL_TALLY (Derived)
This contains the sum of the values representing the percent of time in
KERNEL mode for the current CPU subrecords which were selected by the most
recent CPU_SCAN routine operation.
Data Type:
TALLY
Domains:
COM,CFG,CPU,DSK,FIL,LOC,PRO,TAP
Target Domains: CPU
426 Performance Manager Administrator Guide
Performance Manager Data Cells
CPU_MP_SYNCHCPU_F_MP_SYNCH
This contains the value representing the percent of time spent in MP_SYNCH
mode for the physical CPU represented by the current CPU subrecord and
interval.
Data Type:
NUMERIC
Domains:
CPU
CPU_MP_SYNCH_TALLY (Derived)
This contains the sum of the values representing the percent of time in
MP_SYNCH mode for the current CPU subrecords which were selected by the
most recent CPU_SCAN routine operation.
Data Type:
TALLY
Domains:
COM,CFG,CPU,DSK,FIL,LOC,PRO,TAP
Target Domains: CPU
CPU_ONLYMET_F_SPMCPUONLY
Percentage of time that a CPU was busy and all disk devices were idle for the
local node for the current interval record.
Data Type:
NUMERIC
Domains:
COM,CFG,CPU,DSK,FIL,LOC,PRO,TAP
CPU_PHYSICAL_ID (Derived)
This contains a string indicating the CPU's physical ID of the current CPU
subrecord for the current interval.
Data Type:
STRING
Domains:
CPU
CPU_SCAN (Derived)
Provides the count of CPU subrecords for which the specified rule condition is
true. The condition will be evaluated for each CPU subrecord.
Data Type:
SCAN
Domains:
COM,CFG,CPU,DSK,FIL,LOC,PRO,TAP
Target Domains: CPU
Appendix C: Performance Manager Data Cells 427
Performance Manager Data Cells
CPU_SUPERCPU_F_SUPER
This contains the value representing the percent of time spent in SUPERVISOR
mode for the physical CPU represented by the current CPU subrecord and
interval.
Data Type:
NUMERIC
Domains:
CPU
CPU_SUPER_TALLY (Derived)
This contains the sum of the values representing the percent of time in
SUPERVISOR mode for the current CPU subrecords which were selected by the
most recent CPU_SCAN routine operation.
Data Type:
TALLY
Domains:
COM,CFG,CPU,DSK,FIL,LOC,PRO,TAP
Target Domains: CPU
CPU_USERCPU_F_USER
This contains the value representing the percent of time spent in USER mode
for the physical CPU represented by the current CPU subrecord and interval.
Data Type:
NUMERIC
Domains:
CPU
CPU_USER_TALLY (Derived)
This contains the sum of the values representing the percent of time in USER
mode for the current CPU subrecords which were selected by the most recent
CPU_SCAN routine operation.
Data Type:
TALLY
Domains:
COM,CFG,CPU,DSK,FIL,LOC,PRO,TAP
Target Domains: CPU
CPU_VUP_RATING (Derived)
This contains a value representing the VAX Unit of Processing (VUP) for a
single physical processor for the local node.
Data Type:
NUMERIC
Domains:
COM,CFG,CPU,DSK,FIL,LOC,PRO,TAP
428 Performance Manager Administrator Guide
Performance Manager Data Cells
CW_DISK_CHANNEL_IO (Derived)
This contains a value representing the disk operations rate to the HSC's K.SDI
channel associated with the current disk for all nodes during the current
interval.
Data Type:
NUMERIC
Domains:
CLU
CW_DISK_CHANNEL_RATIO (Derived)
This contains a percentage value representing the cluster-wide ratio of disk
operations for the current disk to the operations on the HSC's K.SDI channel
associated with the current disk for all nodes during the current interval.
Data Type:
NUMERIC
Domains:
CLU
CW_DISK_ERROR_COUNT (Derived)
This contains a value representing the cluster-wide disk error count for the
current disk for all nodes during the current interval.
Data Type:
NUMERIC
Domains:
CLU
CW_DISK_IO_RATE (Derived)
This contains a value representing the cluster-wide disk operations rate for the
current disk for all nodes during the current interval.
Data Type:
NUMERIC
Domains:
CLU
CW_DISK_THRUPUT_RATE (Derived)
This contains a value representing the cluster-wide disk throughput rate in
bytes per second for the current disk for all nodes during the current interval.
Data Type:
NUMERIC
Domains:
CLU
CW_TOP_FILE_NAME (Derived)
This contains a text string representing the file name of the file with the
highest disk operations rate for all nodes for the current disk.
Data Type:
STRING
Appendix C: Performance Manager Data Cells 429
Performance Manager Data Cells
Domains:
CLU
CW_TOP_FILE_OPCNT (Derived)
This contains a value representing the disk operations rate of the file with the
highest disk operations rate for the current disk for all nodes during the
current interval.
Data Type:
NUMERIC
Domains:
CLU
CW_VOLUME_NAME (Derived)
This contains a string of text representing the cluster-wide volume name for
the current disk during the current interval.
Data Type:
STRING
Domains:
CLU
DATAGRAMS_DISCARDEDSCS_F_DGDISCARD
This contains the value representing the number of datagrams discarded per
second by the local node and received from the remote node for the current
configuration record and interval.
Data Type:
NUMERIC
Domains:
CFG
DATAGRAMS_DISCARDED_TALLY (Derived)
This contains the sum of the values representing the number of datagrams
discarded per second by the local node and received from the remote node for
all the current configuration subrecords which were selected by the most
recent CONFIGURATION_SCAN routine operation.
Data Type:
TALLY
Domains:
COM,CFG,CPU,DSK,FIL,LOC,PRO,TAP
Target Domains: CFG
DATAGRAMS_RECEIVEDSCS_F_DGRCVD
This contains the value representing the number of datagrams received per
second on the local node from the remote node for the current configuration
record and interval.
Data Type:
NUMERIC
Domains:
CFG
430 Performance Manager Administrator Guide
Performance Manager Data Cells
DATAGRAMS_RECEIVED_TALLY (Derived)
This contains the sum of the values representing the number of datagrams
received per second on the local node from the remote node for all the current
configuration subrecords which were selected by the most recent
CONFIGURATION_SCAN routine operation.
Data Type:
TALLY
Domains:
COM,CFG,CPU,DSK,FIL,LOC,PRO,TAP
Target Domains: CFG
DATAGRAMS_SEND_RATESCS_F_DGSENT
This contains the value representing the number of datagrams sent per second
from the local node to the remote node for the current configuration record
and interval.
Data Type:
NUMERIC
Domains:
CFG
DATAGRAMS_SEND_TALLY (Derived)
This contains the sum of the values representing the number of datagrams
sent per second from the local node to the remote node for all the current
configuration subrecords which were selected by the most recent
CONFIGURATION_SCAN routine operation.
Data Type:
TALLY
Domains:
COM,CFG,CPU,DSK,FIL,LOC,PRO,TAP
Target Domains: CFG
DEADLOCK_FIND_RATEMET_F_DLCKFND
This contains the number of deadlock finds per second for the current interval
for the local node.
Data Type:
NUMERIC
Domains:
COM,CFG,CPU,DSK,FIL,LOC,PRO,TAP
DEADLOCK_SEARCH_RATEMET_F_DLCKSRCH
This contains the number of deadlock searches per second for the current
interval for the local node.
Data Type:
NUMERIC
Domains:
COM,CFG,CPU,DSK,FIL,LOC,PRO,TAP
Appendix C: Performance Manager Data Cells 431
Performance Manager Data Cells
DECNET_RECV_BUFF_FAIL_RATEMET_F_RCVBUFFL
This contains the number of times per second the DECNET receiver buffer
failed for the current interval for the local node.
Data Type:
NUMERIC
Domains:
COM,CFG,CPU,DSK,FIL,LOC,PRO,TAP
DECNET_TRANSIT_CONGSN_LOSS_RATEMET_F_TRCNGLOS
Average DECNET transit congestion loss rate per second for the local node for
the current interval record.
Data Type:
NUMERIC
Domains:
COM,CFG,CPU,DSK,FIL,LOC,PRO,TAP
DECNET_TRANSIT_PACKET_RATEMET_F_ARRTRAPK
Average rate per second for the local node for the current interval record.
Data Type:
NUMERIC
Domains:
COM,CFG,CPU,DSK,FIL,LOC,PRO,TAP
DEMANDZERO_FAULT_RATEMET_F_DZROFLTS
Average number of demand zero pagefaults per second for the local node for
the current interval record.
Data Type:
NUMERIC
Domains:
COM,CFG,CPU,DSK,FIL,LOC,PRO,TAP
DEPARTG_DECNET_PACKET_RATEMET_F_DEPLOCPK
Average DECNET departing local packet rate per second for the local node for
the current interval record.
Data Type:
NUMERIC
Domains:
COM,CFG,CPU,DSK,FIL,LOC,PRO,TAP
DEVICE_NAMEDEV_A_DEVNAME
This contains a string indicating the disk device of the disk for which the
current disk subrecord pertains (e.g., $2$DUA11).
Data Type:
STRING
Domains:
DSK
432 Performance Manager Administrator Guide
Performance Manager Data Cells
DIRECTORY_DATA_CACHE_AR (Derived)
Attempt rate per second to the directory data cache for the local node for the
current interval record.
Data Type:
NUMERIC
Domains:
COM,CFG,CPU,DSK,FIL,LOC,PRO,TAP
DIRECTORY_DATA_CACHE_HR (Derived)
Hit ratio to the directory data cache for the local node for the current interval
record. Calculated by dividing the number of directory data cache hits by the
number of directory data cache attempts (hits + misses), times 100.
Data Type:
NUMERIC
Domains:
COM,CFG,CPU,DSK,FIL,LOC,PRO,TAP
DIRECTORY_INDEX_CACHE_AR (Derived)
Attempt rate per second to the directory index cache for the local node for the
current interval record.
Data Type:
NUMERIC
Domains:
COM,CFG,CPU,DSK,FIL,LOC,PRO,TAP
DIRECTORY_INDEX_CACHE_HR (Derived)
Hit ratio to the directory index cache for the local node for the current interval
record. Calculated by dividing the number of directory index cache hits by the
number of directory index cache attempts (hits + misses), times 100.
Data Type:
NUMERIC
Domains:
COM,CFG,CPU,DSK,FIL,LOC,PRO,TAP
DIRECT_IO_RATEMET_F_DIRIO
Average direct I/O rate per second for the local node for the current interval
record.
Data Type:
NUMERIC
Domains:
COM,CFG,CPU,DSK,FIL,LOC,PRO,TAP
Appendix C: Performance Manager Data Cells 433
Performance Manager Data Cells
DISK_BUSY_PERCENTDEV_F_BUSY
This contains a value representing the average percent of time the I/O
requests were outstanding to the current disk on the local node for the current
interval.
Data Type:
NUMERIC
Domains:
DSK
DISK_BUSY_PERCENT_TALLY (Derived)
This contains the sum of the values representing the average busy percentage
for the current disk subrecords which were selected by the most recent
DISK_SCAN routine operation.
Data Type:
TALLY
Domains:
COM,CFG,CPU,DSK,FIL,LOC,PRO,TAP
Target Domains: DSK
DISK_CACHE_NAMEDEV_A_CACHENAME
This contains a string representing the file specification of the cache for the
current disk on the local node for the current interval.
Data Type:
STRING
Domains:
DSK
DISK_CONTROLLERDEV_A_CTLR_NAME
This contains a string indicating the controller name of the current disk on the
local node for the current interval (e.g., DUA).
Data Type:
STRING
Domains:
DSK
DISK_DINDX_CACHE_SIZEDEV_F_DINDXSIZE
This contains a value representing the number of entries in the directory index
cache for the current disk on the local node for the current interval.
Data Type:
NUMERIC
Domains:
DSK
434 Performance Manager Administrator Guide
Performance Manager Data Cells
DISK_DIRDATA_CACHE_SIZEDEV_F_DIRSIZE
This contains a value representing the number of entries in the directory data
cache for the current disk on the local node for the current interval.
Data Type:
NUMERIC
Domains:
DSK
DISK_ERROR_COUNTDEV_F_ERRCNT
This contains a value representing the number of errors recorded for the
current disk on the local node for the current interval.
Data Type:
NUMERIC
Domains:
DSK
DISK_ERROR_COUNT_TALLY (Derived)
This contains the sum of the values representing the number of errors for the
current disk subrecords which were selected by the most recent DISK_SCAN
routine operation.
Data Type:
TALLY
Domains:
COM,CFG,CPU,DSK,FIL,LOC,PRO,TAP
Target Domains: DSK
DISK_EXTENT_CACHE_SIZEDEV_F_EXTSIZE
This contains a value representing the number of entries in the file extent
cache for the current disk on the local node for the current interval.
Data Type:
NUMERIC
Domains:
DSK
DISK_FID_CACHE_SIZEDEV_F_FIDSIZE
This contains a value representing the number of entries in the file ID cache
for the current disk on the local node for the current interval.
Data Type:
NUMERIC
Domains:
DSK
DISK_FREE_PAGESDEV_F_FREE
This contains a value representing the average number of free pages on the
current disk on the local node for the current interval.
Data Type:
NUMERIC
Appendix C: Performance Manager Data Cells 435
Performance Manager Data Cells
Domains:
DSK
DISK_FREE_PAGES_TALLY (Derived)
This contains the sum of the values representing the number of free pages for
the current disk subrecords which were selected by the most recent
DISK_SCAN routine operation.
Data Type:
TALLY
Domains:
COM,CFG,CPU,DSK,FIL,LOC,PRO,TAP
Target Domains: DSK
DISK_HAS_A_PAGING_FILE (Derived)
This contains a Boolean value representing true (1.0) if there is a paging file
installed on the current disk on the local node for the current interval.
Data Type:
NUMERIC
Domains:
DSK
DISK_HAS_A_SWAPPING_FILE (Derived)
This contains Boolean a value representing true (1.0) if there is a swapping file
installed on the current disk on the local node for the current interval.
Data Type:
NUMERIC
Domains:
DSK
DISK_HEADER_CACHE_SIZEDEV_F_HDRSIZE
This contains a value representing the number of entries in the file header
cache for the current disk on the local node for the current interval.
Data Type:
NUMERIC
Domains:
DSK
DISK_INTERVAL_MSDEV_F_ITVL
This contains a value representing the uptime of the disk in milliseconds for
the current disk on the local node for the current interval.
Data Type:
NUMERIC
Domains:
DSK
436 Performance Manager Administrator Guide
Performance Manager Data Cells
DISK_IO_RATEDEV_F_OPCNT
This contains a value representing the average number of I/O requests per
second to and from the current disk on the local node for the current interval.
Data Type:
NUMERIC
Domains:
DSK
DISK_IO_RATE_TALLY (Derived)
This contains the sum of the values representing the average I/O rate for the
current disk subrecords which were selected by the most recent DISK_SCAN
routine operation.
Data Type:
NUMERIC
Domains:
COM,CFG,CPU,DSK,FIL,LOC,PRO,TAP
Target Domains: DSK
DISK_IO_RATE_THRESHOLD (Derived)
This contains a value representing the disk I/O rate threshold for the current
disk during the current interval. This value is obtained from the threshold
TD_Tn_xxxx where n is the disk type model number found in STARLET
($DCDEF) for the current disk, and xxxx is its type (e.g., TD_T21_RA81).
Data Type:
NUMERIC
Domains:
CLU
DISK_IS_SERVED (Derived)
This contains a Boolean value indicating whether the current disk is MSCP
served during the current interval.
Data Type:
NUMERIC
Domains:
CLU
DISK_MAP_CACHE_SIZEDEV_F_MAPSIZE
This contains a value representing the number of entries in the bitmap cache
for the current disk on the local node for the current interval.
Data Type:
NUMERIC
Domains:
DSK
Appendix C: Performance Manager Data Cells 437
Performance Manager Data Cells
DISK_MAX_BLOCKSDEV_F_MAXBLOCK
This contains a value representing the maximum number of blocks on the
current disk on the local node for the current interval.
Data Type:
NUMERIC
Domains:
DSK
DISK_MOST_FULL_X (Derived)
This contains an index pointing to the disk subrecord experiencing excessively
limited free space on a disk on the local node for the current interval. It is set
up when the cell ANY_DISK_FULL becomes true.
Data Type:
INDEX
Domains:
COM,CFG,CPU,DSK,FIL,LOC,PRO,TAP
Target Domains: DSK
DISK_MSCP_IO_RATEDEV_F_MSCPOP
This contains a value representing the average number of MSCP served I/O
requests per second to and from the current disk on the local node for the
current interval.
Data Type:
NUMERIC
Domains:
DSK
DISK_MSCP_IO_RATE_TALLY (Derived)
This contains the sum of the values representing the average MSCP served I/O
rate for the current disk subrecords which were selected by the most recent
DISK_SCAN routine operation.
Data Type:
TALLY
Domains:
COM,CFG,CPU,DSK,FIL,LOC,PRO,TAP
Target Domains: DSK
DISK_MSCP_PAGING_IO_RATEDEV_F_MSCPPG
This contains a value representing the average number of MSCP served paging
I/O requests per second to and from the current disk on the local node for the
current interval.
Data Type:
NUMERIC
Domains:
DSK
438 Performance Manager Administrator Guide
Performance Manager Data Cells
DISK_MSCP_PAGING_IO_TALLY (Derived)
This contains the sum of the values representing the average MSCP served
paging I/O rate for the current disk subrecords which were selected by the
most recent DISK_SCAN routine operation.
Data Type:
TALLY
Domains:
COM,CFG,CPU,DSK,FIL,LOC,PRO,TAP
Target Domains: DSK
DISK_MSCP_THRUPUT_RATEDEV_F_MSCPIO
This contains a value representing the average number of bytes per second
transferred to and from the current disk on the local node for the current
interval.
Data Type:
NUMERIC
Domains:
DSK
DISK_MSCP_THRUPUT_TALLY (Derived)
This contains the sum of the values representing the average MSCP served
throughput rate for the current disk subrecords which were selected by the
most recent DISK_SCAN routine operation.
Data Type:
TALLY
Domains:
COM,CFG,CPU,DSK,FIL,LOC,PRO,TAP
Target Domains: DSK
DISK_OVER_QL_THRESHOLD_X (Derived)
This contains an index pointing to the disk subrecord experiencing an
excessive queue length on a disk on the local node for the current interval. It
is set up when the cell ANY_DISK_OVER_QL_THRESHOLD becomes true.
Data Type:
INDEX
Domains:
COM,CFG,CPU,DSK,FIL,LOC,PRO,TAP
Target Domains: DSK
DISK_OVER_THRESHOLD_X (Derived)
This contains an index pointing to the disk subrecord experiencing an
excessive operations rate on a disk on the local node for the current interval.
It is set up when the cell ANY_DISK_OVER_THRESHOLD becomes true.
Data Type:
INDEX
Appendix C: Performance Manager Data Cells 439
Performance Manager Data Cells
Domains:
COM,CFG,CPU,DSK,FIL,LOC,PRO,TAP
Target Domains: DSK
DISK_PAGING_IO_RATEDEV_F_PAGOP
This contains a value representing the average number of paging I/O requests
per second to and from the current disk on the local node for the current
interval.
Data Type:
NUMERIC
Domains:
DSK
DISK_PAGING_IO_RATE_TALLY (Derived)
This contains the sum of the values representing the average paging I/O rate
for the current disk subrecords which were selected by the most recent
DISK_SCAN routine operation.
Data Type:
TALLY
Domains:
COM,CFG,CPU,DSK,FIL,LOC,PRO,TAP
Target Domains: DSK
DISK_PAGING_THRUPUT_RATEDEV_F_PAGIO
This contains a value representing the average number of bytes per second for
paging I/Os transferred to and from the current disk on the local node for the
current interval.
Data Type:
NUMERIC
Domains:
DSK
DISK_PAGING_THRUPUT_TALLY (Derived)
This contains the sum of the values representing the average paging
throughput rate for the current disk subrecords which were selected by the
most recent DISK_SCAN routine operation.
Data Type:
TALLY
Domains:
COM,CFG,CPU,DSK,FIL,LOC,PRO,TAP
Target Domains: DSK
440 Performance Manager Administrator Guide
Performance Manager Data Cells
DISK_QUEUE_AT_SERVER (Derived)
This contains a value representing the OpenVMS node server queue length for
the local disk during the current interval. For an HSC based disk, this cell This
contains the highest queue for all nodes on the CI.
Data Type:
NUMERIC
Domains:
CLU
DISK_QUEUE_LENGTHDEV_F_QLEN
This contains a value representing the average number of outstanding I/O
requests for the current disk on the local node for the current interval.
Data Type:
NUMERIC
Domains:
DSK
DISK_QUEUE_LENGTH_TALLY (Derived)
This contains the sum of the values representing the average queue length for
the current disk subrecords which were selected by the most recent
DISK_SCAN routine operation.
Data Type:
TALLY
Domains:
COM,CFG,CPU,DSK,FIL,LOC,PRO,TAP
Target Domains: DSK
DISK_QUOTA_CACHE_SIZEDEV_F_QUOSIZE
This contains a value representing the number of entries in the quota cache for
the current disk on the local node for the current interval.
Data Type:
NUMERIC
Domains:
DSK
DISK_READ_IO_RATEDEV_F_RDCNT
This contains a value representing the average number of read I/O requests
per second from the current disk on the local node for the current interval.
Data Type:
NUMERIC
Domains:
DSK
Appendix C: Performance Manager Data Cells 441
Performance Manager Data Cells
DISK_READ_IO_RATE_TALLY (Derived)
This contains the sum of the values representing the average read I/O rate for
the current disk subrecords which were selected by the most recent
DISK_SCAN routine operation.
Data Type:
TALLY
Domains:
COM,CFG,CPU,DSK,FIL,LOC,PRO,TAP
Target Domains: DSK
DISK_SCAN (Derived)
Provides the count of disk subrecords for which the specified rule condition is
true. The condition will be evaluated for each disk subrecord.
Data Type:
SCAN
Domains:
COM,CFG,CPU,DSK,FIL,LOC,PRO,TAP
Target Domains: DSK
DISK_SERVER_HWNAMEDEV_A_HWNAME
This contains a string indicating the hardware name of the Integrity server, or
Alpha node which serves the current disk to the local node for the current
interval. If the server is an HSC, this field is blank.
Data Type:
STRING
Domains:
DSK
DISK_SERVER_HWTYPEDEV_A_HWTYPE
This contains a string indicating the hardware type of the cluster node which
serves the current disk's data to the local node for the current interval (e.g.,
HS50, ALPHA, IA64).
Data Type:
STRING
Domains:
DSK
DISK_SERVER_NODENAMEDEV_A_NODENAME
This contains a string indicating the cluster node name of the node which
serves the current disk's data to the local node for the current interval.
Data Type:
STRING
Domains:
DSK
442 Performance Manager Administrator Guide
Performance Manager Data Cells
DISK_SERVICE_TIMEDEV_F_SERVICE
This contains a value representing the average number of milliseconds
between the I/O events START-IO and END-IO for all I/Os for the current disk
on the local node for the current interval.
Data Type:
NUMERIC
Domains:
DSK
DISK_SERVICE_TIME_TALLY (Derived)
This contains the sum of the values representing the average number of
milliseconds between the I/O events START-IO and END-IO for all I/Os for the
current disk subrecords which were selected by the most recent DISK_SCAN
routine operation.
Data Type:
TALLY
Domains:
COM,CFG,CPU,DSK,FIL,LOC,PRO,TAP
Target Domains: DSK
DISK_SPLIT_IO_RATEDEV_F_SPLIT
This contains a value representing the average number of split I/O requests
per second to and from the current disk on the local node for the current
interval.
Data Type:
NUMERIC
Domains:
DSK
DISK_SPLIT_IO_TALLY (Derived)
This contains the sum of the values representing the average split I/O rate for
the current disk subrecords which were selected by the most recent
DISK_SCAN routine operation.
Data Type:
TALLY
Domains:
COM,CFG,CPU,DSK,FIL,LOC,PRO,TAP
Target Domains: DSK
DISK_SWAPPING_IO_RATEDEV_F_SWPOP
This contains a value representing the average number of swapping I/O
requests per second to and from the current disk on the local node for the
current interval.
Data Type:
NUMERIC
Domains:
DSK
Appendix C: Performance Manager Data Cells 443
Performance Manager Data Cells
DISK_SWAPPING_IO_TALLY (Derived)
This contains the sum of the values representing the average swapper I/O rate
for the current disk subrecords which were selected by the most recent
DISK_SCAN routine operation.
Data Type:
TALLY
Domains:
COM,CFG,CPU,DSK,FIL,LOC,PRO,TAP
Target Domains: DSK
DISK_SWAPPING_THRUPUT_RATEDEV_F_SWPIO
This contains a value representing the average number of bytes per second
(for swapping I/Os) transferred to and from the current disk on the local node
for the current interval.
Data Type:
NUMERIC
Domains:
DSK
DISK_SWAPPING_THRUPUT_TALLY (Derived)
This contains the sum of the values representing the average swapper
throughput rate for the current disk subrecords which were selected by the
most recent DISK_SCAN routine operation.
Data Type:
TALLY
Domains:
COM,CFG,CPU,DSK,FIL,LOC,PRO,TAP
Target Domains: DSK
DISK_THRUPUT_RATEDEV_F_IOCNT
This contains a value representing the average number of bytes per second
transferred to and from the current disk on the local node for the current
interval.
Data Type:
NUMERIC
Domains:
DSK
DISK_THRUPUT_RATE_THRESHOLD (Derived)
This contains a value representing the disk throughput rate threshold for the
current disk. This value is obtained from the threshold TD_In_xxxx where n is
the disk type model number found in STARLET ($DCDEF) for the current disk,
and xxxx is its type (e.g., TD_I21_RA81).
Data Type:
NUMERIC
Domains:
CLU
444 Performance Manager Administrator Guide
Performance Manager Data Cells
DISK_THRUPUT_TALLY (Derived)
This contains the sum of the values representing the average throughput rate
for the current disk subrecords which were selected by the most recent
DISK_SCAN routine operation.
Data Type:
TALLY
Domains:
COM,CFG,CPU,DSK,FIL,LOC,PRO,TAP
Target Domains: DSK
DISK_TOP_OPERATION_FILE_X (Derived)
This contains an index specifier identifying the hot file subrecord for the
hottest file in terms of I/O operations per second on the current disk on the
local node for the current interval.
Data Type:
INDEX
Domains:
DSK
Target Domains: FIL
DISK_TOP_SPLIT_IO_FILE_X (Derived)
This contains an index specifier identifying the hot file subrecord for the
hottest file in terms of split I/O operations per second on the current disk on
the local node for the current interval.
Data Type:
INDEX
Domains:
DSK
Target Domains: FIL
DYN_EXPANSION_COUNT (Derived)
A count of the number of times nonpaged pool is increased, for the local node
for all of the intervals.
Data Type:
NUMERIC
Domains:
SUMMARY
DYN_MAXLEN (Derived)
The maximum number of bytes in nonpaged pool for the local node for all of
the intervals.
Data Type:
NUMERIC
Domains:
SUMMARY
Appendix C: Performance Manager Data Cells 445
Performance Manager Data Cells
ENQUEUE_LOCKS_NOT_QUEUED_RATEMET_F_ENQNOTQD
This contains the number of enqueue lock requests not queued per second for
the current interval for the local node.
Data Type:
NUMERIC
Domains:
COM,CFG,CPU,DSK,FIL,LOC,PRO,TAP
ENQUE_LOCKS_FORCED_TO_WAIT_RATEMET_F_ENQWAIT)
This contains the number of enqueue lock requests per second that had to
enter the lock wait queue for the current interval for the local node.
Data Type:
NUMERIC
Domains:
COM,CFG,CPU,DSK,FIL,LOC,PRO,TAP
ERASE_QIO_RATEMET_F_ERASEIO
Average erase QIO rate per second for the local node for the current interval
record.
Data Type:
NUMERIC
Domains:
COM,CFG,CPU,DSK,FIL,LOC,PRO,TAP
EXCESS_THRUPUT_ON_ANY_CHANNEL (Derived)
This contains a Boolean value of zero or one; one (true) represents the
presence of excessive throughput on an I/O channel on the local node for the
current interval. This is determined if the channel I/O exceeds the amount
indicated by the appropriate threshold, TD_MASSBUS_CHANNEL_IO,
TD_UNIBUS_CHANNEL_IO, TD_KDA_CHANNEL_IO, TD_KDB_CHANNEL_IO, or
TD_CI_PORT_IO.
Data Type:
NUMERIC
Domains:
COM,CFG,CPU,DSK,FIL,LOC,PRO,TAP
EXECMET_F_EXEC
Average percentage of CPU time spent in Executive mode for all processors in
the local node for the current interval record.
Data Type:
NUMERIC
Domains:
COM,CFG,CPU,DSK,FIL,LOC,PRO,TAP
446 Performance Manager Administrator Guide
Performance Manager Data Cells
FAMILY_NAMEPRO_A_FAMILY
This contains a string indicating the family name for which the current process
subrecord pertains on the local node. This filled in when the data is supplied
from a history file, otherwise it is blank.
Data Type:
STRING
Domains:
PRO
FASTER_TERMINAL_IO (Derived)
This contains a value representing the sum of terminal operations rate to all
but TTx terminals on the local node for the current interval.
Data Type:
NUMERIC
Domains:
COM,CFG,CPU,DSK,FIL,LOC,PRO,TAP
FILE_DEVICEFIL_A_DEVICE
This contains a string indicating the disk device on which the current file in the
hot file subrecord is located.
Data Type:
STRING
Domains:
FIL
FILE_DIRECTORYFIL_A_DIRECTORY
This contains a string indicating the disk directory in which the current file in
the hot file subrecord is located.
Data Type:
STRING
Domains:
FIL
FILE_EXTENT_CACHE_AR (Derived)
Attempt rate per second to the extent cache for the local node for the current
interval record.
Data Type:
NUMERIC
Domains:
COM,CFG,CPU,DSK,FIL,LOC,PRO,TAP
FILE_EXTENT_CACHE_HR (Derived)
Hit ratio to the extent cache for the local node for the current interval record.
Calculated by dividing the number of extent cache hits by the number of
extent cache attempts (hits + misses), times 100.
Data Type:
NUMERIC
Appendix C: Performance Manager Data Cells 447
Performance Manager Data Cells
Domains:
COM,CFG,CPU,DSK,FIL,LOC,PRO,TAP
FILE_HEADER_CACHE_AR (Derived)
Attempt rate per second to the file header cache for the local node for the
current interval record.
Data Type:
NUMERIC
Domains:
COM,CFG,CPU,DSK,FIL,LOC,PRO,TAP
FILE_HEADER_CACHE_HR (Derived)
Hit ratio to the file header cache for the local node for the current interval
record. Calculated by dividing the number of file header cache hits by the
number of file header cache attempts (hits + misses), times 100.
Data Type:
NUMERIC
Domains:
COM,CFG,CPU,DSK,FIL,LOC,PRO,TAP
FILE_ID_CACHE_AR (Derived)
Attempt rate per second to the file ID cache for the local node for the current
interval record.
Data Type:
NUMERIC
Domains:
COM,CFG,CPU,DSK,FIL,LOC,PRO,TAP
FILE_ID_CACHE_HR (Derived)
Hit ratio to the file ID cache for the local node for the current interval record.
Calculated by dividing the number of file ID cache hits by the number of file ID
cache attempts (hits + misses), times 100.
Data Type:
NUMERIC
Domains:
COM,CFG,CPU,DSK,FIL,LOC,PRO,TAP
FILE_MSCP_IO_RATEFIL_F_MSCPOP
This contains a value indicating the number of MSCP (served) I/O operations
per second issued to the file (indicated by FILE_DEVICE, FILE_DIRECTORY and
FILE_NAME) for the current interval.
Data Type:
NUMERIC
Domains:
FIL
448 Performance Manager Administrator Guide
Performance Manager Data Cells
FILE_NAMEFIL_A_FILE
This contains a string indicating the name of the file for which the current hot
file subrecord pertains, in domain FILE.
Data Type:
STRING
Domains:
FIL
FILE_OPEN_RATEMET_F_OPENS
Average file open rate per second for the local node for the current interval
record.
Data Type:
NUMERIC
Domains:
COM,CFG,CPU,DSK,FIL,LOC,PRO,TAP
FILE_OPERATION_RATEFIL_F_OPCNT
This contains a value indicating the number of I/O operations per second
issued to the file (indicated by FILE_DEVICE, FILE_DIRECTORY and
FILE_NAME) for the current interval.
Data Type:
NUMERIC
Domains:
FIL
FILE_OPERATION_TALLY (Derived)
This contains the sum of the values indicating the number of I/Os per second
transferred to and from all hot files (indicated by FILE_DEVICE,
FILE_DIRECTORY and FILE_NAME) for the current hot file subrecords which
were selected by the most recent FILE_SCAN routine operation.
Data Type:
TALLY
Domains:
COM,CFG,CPU,DSK,FIL,LOC,PRO,TAP
Target Domains: FIL
FILE_PAGING_IO_RATEFIL_F_PAGOP
This contains a value indicating the number of paging I/O operations per
second issued to the file (indicated by FILE_DEVICE, FILE_DIRECTORY and
FILE_NAME) for the current interval.
Data Type:
NUMERIC
Domains:
FIL
Appendix C: Performance Manager Data Cells 449
Performance Manager Data Cells
FILE_PAGING_IO_TALLY (Derived)
This contains the sum of the values indicating the number of Paging I/Os per
second transferred to and from all hot files (indicated by FILE_DEVICE,
FILE_DIRECTORY and FILE_NAME) for the current hot file subrecords which
were selected by the most recent FILE_SCAN routine operation.
Data Type:
TALLY
Domains:
COM,CFG,CPU,DSK,FIL,LOC,PRO,TAP
Target Domains: FIL
FILE_READ_RATEFIL_F_RDCNT
This contains a value indicating the number of read I/O operations per second
issued to the file (indicated by FILE_DEVICE, FILE_DIRECTORY and
FILE_NAME) for the current interval.
Data Type:
NUMERIC
Domains:
FIL
FILE_READ_TALLY (Derived)
This contains the sum of the values indicating the number of Read I/Os per
second transferred from all hot files (indicated by FILE_DEVICE,
FILE_DIRECTORY and FILE_NAME) for the current hot file subrecords which
were selected by the most recent FILE_SCAN routine operation.
Data Type:
TALLY
Domains:
COM,CFG,CPU,DSK,FIL,LOC,PRO,TAP
Target Domains: FIL
FILE_SCAN (Derived)
Provides the count of hot file subrecords for which the specified rule condition
is true. The condition will be evaluated for each hot file subrecord.
Data Type:
SCAN
Domains:
COM,CFG,CPU,DSK,FIL,LOC,PRO,TAP
Target Domains: FIL
FILE_SPLIT_IO_RATEFIL_F_SPLITS
This contains a value indicating the number of split I/O operations per second
issued to the file (indicated by FILE_DEVICE, FILE_DIRECTORY and
FILE_NAME) for the current interval.
Data Type:
NUMERIC
450 Performance Manager Administrator Guide
Performance Manager Data Cells
Domains:
FIL
FILE_SPLIT_IO_TALLY (Derived)
This contains the sum of the values indicating the number of Split I/Os per
second transferred to and from all hot files (indicated by FILE_DEVICE,
FILE_DIRECTORY and FILE_NAME) for the current hot file subrecords which
were selected by the most recent FILE_SCAN routine operation.
Data Type:
TALLY
Domains:
COM,CFG,CPU,DSK,FIL,LOC,PRO,TAP
Target Domains: FIL
FILE_SWAPPING_IO_RATEFIL_F_SWPOP
This contains a value indicating the number of I/O operations per second
issued by the SWAPPER to the file (indicated by FILE_DEVICE,
FILE_DIRECTORY and FILE_NAME) for the current interval.
Data Type:
NUMERIC
Domains:
FIL
FILE_SWAPPING_IO_TALLY (Derived)
This contains the sum of the values indicating the number of swapping I/Os
per second transferred to and from all hot files (indicated by FILE_DEVICE,
FILE_DIRECTORY and FILE_NAME) for the current hot file subrecords which
were selected by the most recent FILE_SCAN routine operation.
Data Type:
TALLY
Domains:
COM,CFG,CPU,DSK,FIL,LOC,PRO,TAP
Target Domains: FIL
FILE_THROUGHPUTFIL_F_IOCNT
This contains a value indicating the number of bytes per second transferred to
and from the file (indicated by FILE_DEVICE, FILE_DIRECTORY and
FILE_NAME) for the current interval.
Data Type:
NUMERIC
Domains:
FIL
Appendix C: Performance Manager Data Cells 451
Performance Manager Data Cells
FILE_THROUGHPUT_TALLY (Derived)
This contains the sum of the values indicating the number of bytes per second
transferred to and from all hot files (indicated by FILE_DEVICE,
FILE_DIRECTORY and FILE_NAME) for the current hot file subrecords which
were selected by the most recent FILE_SCAN routine operation.
Data Type:
TALLY
Domains:
COM,CFG,CPU,DSK,FIL,LOC,PRO,TAP
Target Domains: FIL
FREELIST_FAULT_RATEMET_F_FREFLTS
Average number of page faults per second from the free page list for the local
node for the current interval record.
Data Type:
NUMERIC
Domains:
COM,CFG,CPU,DSK,FIL,LOC,PRO,TAP
FREE_BALANCE_SET_SLOTS (Derived)
This contains a value representing the number of balance set slots on the local
node for the current interval.
Data Type:
NUMERIC
Domains:
COM,CFG,CPU,DSK,FIL,LOC,PRO,TAP
GLOBALPAGE_FAULT_RATEMET_F_GVALID
Average number of global page faults per second for the local node for the
current interval record.
Data Type:
NUMERIC
Domains:
COM,CFG,CPU,DSK,FIL,LOC,PRO,TAP
GLOBAL_PGS_TALLY (Derived)
This contains the sum of the values representing the number of global pages
in the working sets for all of the current process subrecords which were
selected by the most recent PROCESS_SCAN routine operation.
Data Type:
TALLY
Domains:
COM,CFG,CPU,DSK,FIL,LOC,PRO,TAP
Target Domains: PRO
452 Performance Manager Administrator Guide
Performance Manager Data Cells
HARD_FAULT_RATE (Derived)
Average number of hard page faults per second for the local node for the
current interval record. This is derived from the sum of MET_F_PREADIO and
MET_F_PWRITIO.
Data Type:
NUMERIC
Domains:
COM,CFG,CPU,DSK,FIL,LOC,PRO,TAP
HARD_FAULT_SCALING (Derived)
This contains a value representing scaling factor for the hard page fault rate
for the local node. The value is obtained from the threshold
TD_HARD_FAULT_SCALING_n where n is the hardware model number of the
local node. By default, if the local node is a VAX 11-780, the value would be
1.0. The value of this data cell can be modified using a threshold construct.
Data Type:
NUMERIC
Domains:
COM,CFG,CPU,DSK,FIL,LOC,PRO,TAP
HEAD_IN_SWAP_RATEMET_F_HISWPCNT
Average process header inswap rate per second for the local node for the
current interval record.
Data Type:
NUMERIC
Domains:
COM,CFG,CPU,DSK,FIL,LOC,PRO,TAP
HEAD_OUT_SWAP_RATEMET_F_HOSWPCNT
Average process header outswap rate per second for the local node for the
current interval record.
Data Type:
NUMERIC
Domains:
COM,CFG,CPU,DSK,FIL,LOC,PRO,TAP
HIGHEST_IO_RATE_DISK_X (Derived)
This contains an index pointing to the disk subrecord that has the highest I/O
operations rate on the local node for the current interval.
Data Type:
INDEX
Domains:
COM,CFG,CPU,DSK,FIL,LOC,PRO,TAP
Target Domains: DSK
Appendix C: Performance Manager Data Cells 453
Performance Manager Data Cells
HIGHEST_QUEUE_DISK_X (Derived)
This contains an index pointing to the disk subrecord that has the highest
queue on the local node for the current interval.
Data Type:
INDEX
Domains:
COM,CFG,CPU,DSK,FIL,LOC,PRO,TAP
Target Domains: DSK
HIGHEST_SPLITIO_RATE_DISK_X (Derived)
This contains an index pointing to the disk subrecord that has the highest split
I/O operations rate on the local node for the current interval.
Data Type:
INDEX
Domains:
COM,CFG,CPU,DSK,FIL,LOC,PRO,TAP
Target Domains: DSK
HIGH_IMG_ACTIVATIONS_PID_X (Derived)
This contains an index pointing to the process subrecord whose PID has the
highest number of image activations on the local node for the current interval.
Data Type:
INDEX
Domains:
COM,CFG,CPU,DSK,FIL,LOC,PRO,TAP
Target Domains: PRO
HSC_IO_RATE (Derived)
This contains a value representing the disk operations rate of the current HSC
controller.
Data Type:
NUMERIC
Domains:
CLU
HSC_NODE_NAME (Derived)
This contains a text string representing the node name of the current HSC
controller.
Data Type:
STRING
Domains:
CLU
454 Performance Manager Administrator Guide
Performance Manager Data Cells
HSC_THRUPUT_RATE (Derived)
This contains a value representing the disk throughput rate in bytes per
second of the current HSC controller.
Data Type:
NUMERIC
Domains:
CLU
HSC_TYPE_HSC40 (Derived)
This contains a Boolean value 1 if the current HSC controller is an HSC40.
Data Type:
NUMERIC
Domains:
CLU
HSC_TYPE_HSC50 (Derived)
This contains a Boolean value 1 if the current HSC controller is an HSC50.
Data Type:
NUMERIC
Domains:
CLU
HSC_TYPE_HSC60 (Derived)
This contains a Boolean value 1 if the current HSC controller is an HSC60.
Data Type:
NUMERIC
Domains:
CLU
HSC_TYPE_HSC65 (Derived)
This contains a Boolean value 1 if the current HSC controller is an HSC65.
Data Type:
NUMERIC
Domains:
CLU
HSC_TYPE_HSC70 (Derived)
This contains a Boolean value 1 if the current HSC controller is an HSC70.
Data Type:
NUMERIC
Domains:
CLU
HSC_TYPE_HSC90 (Derived)
This contains a Boolean value 1 if the current HSC controller is an HSC90.
Data Type:
NUMERIC
Appendix C: Performance Manager Data Cells 455
Performance Manager Data Cells
Domains:
CLU
HSC_TYPE_HSC95 (Derived)
This contains a Boolean value 1 if the current HSC controller is an HSC95.
Data Type:
NUMERIC
Domains:
CLU
IDLEMET_F_IDLE
Average percentage of CPU idle time for the local node for the current interval
record.
Data Type:
NUMERIC
Domains:
COM,CFG,CPU,DSK,FIL,LOC,PRO,TAP
IDLE_PROC_WITH_BIG_WS (Derived)
This contains a Boolean value representing the presence of one or more idle
processes with overly large working sets on the local node for the current
interval.
Data Type:
NUMERIC
Domains:
COM,CFG,CPU,DSK,FIL,LOC,PRO,TAP
IMAGE_ACTIVATION_RATEMET_F_IMGACTS
This contains the number of image activations per second for the current
interval for the local node.
Data Type:
NUMERIC
Domains:
COM,CFG,CPU,DSK,FIL,LOC,PRO,TAP
IMAGE_HUNG_IN_MWAIT_NOT_RWAST (Derived)
This contains a Boolean value of zero or one, one (true) representing the
presence of an image hung in an MWAIT state other than an AST resource wait
state on the local node for the current interval.
Data Type:
NUMERIC
Domains:
COM,CFG,CPU,DSK,FIL,LOC,PRO,TAP
456 Performance Manager Administrator Guide
Performance Manager Data Cells
IMAGE_HUNG_IN_RWAST (Derived)
This contains a Boolean value of zero or one, one (true) representing the
presence of an image hung in an RWAST resource wait state on the local node
for the current interval.
Data Type:
NUMERIC
Domains:
COM,CFG,CPU,DSK,FIL,LOC,PRO,TAP
IMAGE_NAMEPRO_A_IMAGENAME
This contains a string indicating the image name for which the current process
subrecord pertains on the local node for the current interval.
Data Type:
STRING
Domains:
PRO
IMAGE_TERMINATION_RATEMET_F_IMGTRMS
This contains the number of image terminations per second for the current
interval for the local node.
Data Type:
NUMERIC
Domains:
COM,CFG,CPU,DSK,FIL,LOC,PRO,TAP
IMG_ACTIVATIONS_PER_PID (Derived)
This contains a value representing the average image activation rate for the
PID indicated by the process subrecord indexed by the cell
HIGH_IMAGE_ACTIVATIONS_PID_X on the local node for the current interval.
Data Type:
NUMERIC
Domains:
COM,CFG,CPU,DSK,FIL,LOC,PRO,TAP
IMG_ACT_RATE_SCALING (Derived)
This contains a value representing scaling factor for the image activation rate
for the local node. The value is obtained from the threshold
TD_IMG_ACT_SCALING_n where n is the hardware model number of the local
node. By default, if the local node is a VAX 11-780, the value would be 1.0.
The value of this data cell can be modified using a threshold construct.
Data Type:
NUMERIC
Domains:
COM,CFG,CPU,DSK,FIL,LOC,PRO,TAP
Appendix C: Performance Manager Data Cells 457
Performance Manager Data Cells
INCOMING_BLOCKING_AST_RATEMET_F_BLK_IN
This contains the number of incoming blocking ASTs queued per second for the
current interval for the local node.
Data Type:
NUMERIC
Domains:
COM,CFG,CPU,DSK,FIL,LOC,PRO,TAP
INCOMING_DEADLOCK_MESSAGE_RATEMET_F_DLCKMSGS_IN
This contains the number of incoming deadlock detection messages per second
for the current interval for the local node.
Data Type:
NUMERIC
Domains:
COM,CFG,CPU,DSK,FIL,LOC,PRO,TAP
INCOMING_DIRECTORY_FUNCT_RATEMET_F_DIR_IN
This contains the number of incoming directory operations per second for the
current interval for the local node.
Data Type:
NUMERIC
Domains:
COM,CFG,CPU,DSK,FIL,LOC,PRO,TAP
INCOMING_LOCK_CONVERSION_RATEMET_F_ENQCVT_IN
This contains the number of incoming enqueue lock conversion requests per
second for the current interval for the local node.
Data Type:
NUMERIC
Domains:
COM,CFG,CPU,DSK,FIL,LOC,PRO,TAP
INCOMING_LOCK_DEQUEUE_RATEMET_F_DEQ_IN
This contains the number of incoming dequeue lock requests per second for
the current interval for the local node.
Data Type:
NUMERIC
Domains:
COM,CFG,CPU,DSK,FIL,LOC,PRO,TAP
INCOMING_LOCK_ENQUEUE_RATEMET_F_ENQNEW_IN
This contains the number of new incoming enqueue requests per second for
the current interval for the local node.
Data Type:
NUMERIC
Domains:
COM,CFG,CPU,DSK,FIL,LOC,PRO,TAP
458 Performance Manager Administrator Guide
Performance Manager Data Cells
INTERACTIVE_COUNTMET_F_INTERACTIVE
This contains a value representing the average number of interactive
processes on the local node for the current interval.
Data Type:
NUMERIC
Domains:
COM,CFG,CPU,DSK,FIL,LOC,PRO,TAP
INTERRUPT_STACKMET_F_INTSTK
Average percentage of CPU time on the Interrupt Stack for all processors in
the local node for the current interval record.
Data Type:
NUMERIC
Domains:
COM,CFG,CPU,DSK,FIL,LOC,PRO,TAP
IN_SWAP_RATEMET_F_ISWPCNT
Average inswap rate per second for the local node for the current interval
record.
Data Type:
NUMERIC
Domains:
COM,CFG,CPU,DSK,FIL,LOC,PRO,TAP
IO_ONLYMET_F_SPMIOONLY
Percentage of time that the CPU or all CPUs in a multiprocessing system were
idle and at least one disk device was busy for the local node for the current
interval record.
Data Type:
NUMERIC
Domains:
COM,CFG,CPU,DSK,FIL,LOC,PRO,TAP
IRPS_IN_LISTMET_F_IRP_MAX
This contains the total number of IRPs for the current interval for the local
node.
Data Type:
NUMERIC
Domains:
COM,CFG,CPU,DSK,FIL,LOC,PRO,TAP
IRPS_IN_USEMET_F_IRP_CNT
This contains the number of IRPs in use for the current interval for the local
node.
Data Type:
NUMERIC
Domains:
COM,CFG,CPU,DSK,FIL,LOC,PRO,TAP
Appendix C: Performance Manager Data Cells 459
Performance Manager Data Cells
IRP_EXPANSION_COUNT (Derived)
A count of the number of times that the number of intermediate request
packets needed to be increased, for the local node for all of the intervals.
Data Type:
NUMERIC
Domains:
SUMMARY
IRP_MAXLEN (Derived)
The maximum size of the IRP list for the local node for all of the intervals.
Data Type:
NUMERIC
Domains:
SUMMARY
IS_AN_ALPHA (Derived)
This contains a one if the hardware model is an Alpha (zero if not) for the local
node for the current interval record in LOCAL domain, and for the local node
for the last interval record in SUMMARY domain.
Data Type:
NUMERIC
Domains:
COM,CFG,CPU,DSK,FIL,LOC,PRO,SUM,TAP
IS_AN_IA64 (Derived)
This contains a one if the hardware model is an Integrity server (zero if not)
for the local node for the current interval record in LOCAL domain, and for the
local node for the last interval record in SUMMARY domain.
Data Type:
NUMERIC
Domains:
COM,CFG,CPU,DSK,FIL,LOC,PRO,SUM,TAP
IS_A_VAX (Derived)
This contains a one if the hardware model is a VAX (zero if not) for the local
node for the current interval record in LOCAL domain, and for the local node
for the last interval record in SUMMARY domain.
Data Type:
NUMERIC
Domains:
COM,CFG,CPU,DSK,FIL,LOC,PRO,SUM,TAP
460 Performance Manager Administrator Guide
Performance Manager Data Cells
KB_MAPPEDSCS_F_KBYTMAPD
This contains the value representing the number of kilobytes mapped per
second between the local node and the remote node (indicated by the cell
SCS_NODENAME) for the current configuration record and interval.
Data Type:
NUMERIC
Domains:
CFG
KB_MAPPED_TALLY (Derived)
This contains the sum of the values representing the number of kilobytes
transferred per second between the local node and the remote node for all the
current configuration subrecords which were selected by the most recent
CONFIGURATION_SCAN routine operation.
Data Type:
TALLY
Domains:
COM,CFG,CPU,DSK,FIL,LOC,PRO,TAP
Target Domains: CFG
KB_RECEIVED_VIA_REQST_DATASSCS_F_KBYTREQD
This contains the value representing the number of kilobytes transferred per
second via request data's to the local node from the remote node for the
current configuration record and interval.
Data Type:
NUMERIC
Domains:
CFG
KB_RECVD_VIA_REQST_DATAS_TALLY (Derived)
This contains the sum of the values representing the number of kilobytes
transferred per second via request data's from the local node to the remote
node for all the current configuration subrecords which were selected by the
most recent CONFIGURATION_SCAN routine operation.
Data Type:
TALLY
Domains:
COM,CFG,CPU,DSK,FIL,LOC,PRO,TAP
Target Domains: CFG
KB_SENT_VIA_SEND_DATASSCS_F_KBYTSENT
This contains the value representing the number of kilobytes transferred per
second via send data's from the local node to the remote node for the current
configuration record and interval.
Data Type:
NUMERIC
Appendix C: Performance Manager Data Cells 461
Performance Manager Data Cells
Domains:
CFG
KB_SENT_VIA_SEND_DATAS_TALLY (Derived)
This contains the sum of the values representing the number of kilobytes
transferred per second via sent data's from the local node to the remote node
for all the current configuration subrecords which were selected by the most
recent CONFIGURATION_SCAN routine operation.
Data Type:
TALLY
Domains:
COM,CFG,CPU,DSK,FIL,LOC,PRO,TAP
Target Domains: CFG
KERNELMET_F_KERNEL
Average percentage of CPU time spent in Kernel mode for all processors in the
local node for the current interval record.
Data Type:
NUMERIC
Domains:
COM,CFG,CPU,DSK,FIL,LOC,PRO,TAP
LARGEST_BLK_IN_NONPAGED_POOLMET_F_NP_MAX_BLOCK
This contains the number of bytes in the largest block in non-paged pool for
the current interval for the local node.
Data Type:
NUMERIC
Domains:
COM,CFG,CPU,DSK,FIL,LOC,PRO,TAP
LARGEST_BLK_IN_PAGED_POOLMET_F_PG_MAX_BLOCK
This contains the number of bytes the largest block in paged pool for the
current interval for the local node.
Data Type:
NUMERIC
Domains:
COM,CFG,CPU,DSK,FIL,LOC,PRO,TAP
LARGEST_WS_PROC_X (Derived)
This contains an index pointing to the process subrecord, for a unique
username, with the largest working set on the local node for the current
interval.
Data Type:
INDEX
Domains:
COM,CFG,CPU,DSK,FIL,LOC,PRO,TAP
Target Domains: PRO
462 Performance Manager Administrator Guide
Performance Manager Data Cells
LARGE_BATCH_PROCESSES_EXISTS (Derived)
This contains a Boolean value representing the presence of one or more large
batch processes on the local node for the current interval.
Data Type:
NUMERIC
Domains:
COM,CFG,CPU,DSK,FIL,LOC,PRO,TAP
LARGE_COM_PROCESS_EXISTS (Derived)
This contains a Boolean value representing the presence of a large process in
computable state, on the local node for the current interval.
Data Type:
NUMERIC
Domains:
COM,CFG,CPU,DSK,FIL,LOC,PRO,TAP
LARGE_NOSWAP_PROCESS_EXISTS (Derived)
This contains a Boolean value representing the presence of a large process
where the PSWAPM privilege inhibited swapping on the local node for the
current interval.
Data Type:
NUMERIC
Domains:
COM,CFG,CPU,DSK,FIL,LOC,PRO,TAP
LARGE_NOSWAP_PROCESS_X (Derived)
This contains an index pointing to the process subrecord, for a unique
username, for a large process with the PSWAPM privilege enabled on the local
node for the current interval.
Data Type:
INDEX
Domains:
COM,CFG,CPU,DSK,FIL,LOC,PRO,TAP
Target Domains: PRO
LARGE_PROCESSES_EXIST (Derived)
This contains a Boolean value representing the presence of one or more large
processes on the local node for the current interval.
Data Type:
NUMERIC
Domains:
COM,CFG,CPU,DSK,FIL,LOC,PRO,TAP
Appendix C: Performance Manager Data Cells 463
Performance Manager Data Cells
LCK_EXPANSION_COUNT (Derived)
A count of the number of times the LOCKIDTBL needed to be extended when
the system ran out of LOCKIDTBL entries, for the local node for all of the
intervals.
Data Type:
NUMERIC
Domains:
SUMMARY
LCK_MAXLEN (Derived)
The maximum number of entries in the Lock ID table for the local node for all
of the intervals.
Data Type:
NUMERIC
Domains:
SUMMARY
LOCAL_BLOCKING_AST_RATEMET_F_BLK_LOC
This contains the number of local blocking ASTs queued per second for the
current interval for the local node.
Data Type:
NUMERIC
Domains:
COM,CFG,CPU,DSK,FIL,LOC,PRO,TAP
LOCAL_LOCK_CONVERSION_RATEMET_F_ENQCVT_LOC
This contains the number of new local enqueue lock conversion requests per
second for the current interval for the local node.
Data Type:
NUMERIC
Domains:
COM,CFG,CPU,DSK,FIL,LOC,PRO,TAP
LOCAL_LOCK_DEQUEUE_RATEMET_F_DEQ_LOC
This contains the number of local dequeue lock requests per second for the
current interval for the local node.
Data Type:
NUMERIC
Domains:
COM,CFG,CPU,DSK,FIL,LOC,PRO,TAP
LOCAL_LOCK_ENQUEUE_RATEMET_F_ENQNEW_LOC
This contains the number of new local enque requests per second for the
current interval for the local node.
Data Type:
NUMERIC
Domains:
COM,CFG,CPU,DSK,FIL,LOC,PRO,TAP
464 Performance Manager Administrator Guide
Performance Manager Data Cells
LOCKIDS_IN_USEMET_F_LOCK_CNT
This contains the number lock IDs for the current interval for the local node.
Data Type:
NUMERIC
Domains:
COM,CFG,CPU,DSK,FIL,LOC,PRO,TAP
LOCKID_TABLE_SIZEMET_F_LOCK_MAX
This contains the lock ID table length in entries. for the current interval for the
local node.
Data Type:
NUMERIC
Domains:
COM,CFG,CPU,DSK,FIL,LOC,PRO,TAP
LOCK_RESOURCES_IN_USEMET_F_RESOURCE_CNT
This contains the number lock resources known by the local node for the
current interval.
Data Type:
NUMERIC
Domains:
COM,CFG,CPU,DSK,FIL,LOC,PRO,TAP
LOGICAL_NAME_TRANSLATION_RATEMET_F_LOGNAM
Average logical name translation rate per second for the local node for the
current interval record.
Data Type:
NUMERIC
Domains:
COM,CFG,CPU,DSK,FIL,LOC,PRO,TAP
LRPS_IN_LISTMET_F_LRP_MAX
This contains the total number of LRPs for the current interval for the local
node.
Data Type:
NUMERIC
Domains:
COM,CFG,CPU,DSK,FIL,LOC,PRO,TAP
LRPS_IN_USEMET_F_LRP_CNT
This contains the number of LRPs in use for the current interval for the local
node.
Data Type:
NUMERIC
Domains:
COM,CFG,CPU,DSK,FIL,LOC,PRO,TAP
Appendix C: Performance Manager Data Cells 465
Performance Manager Data Cells
LRP_EXPANSION_COUNT (Derived)
A count of the number of times that the number of large request packets
needed to be increased, for the local node for all of the intervals.
Data Type:
NUMERIC
Domains:
SUMMARY
LRP_MAXLEN (Derived)
The maximum size of the LRP list for the local node for all of the intervals.
Data Type:
NUMERIC
Domains:
SUMMARY
MAILBOX_READ_RATEMET_F_MBREADS
Average mailbox read rate per second for the local node for the current
interval record.
Data Type:
NUMERIC
Domains:
COM,CFG,CPU,DSK,FIL,LOC,PRO,TAP
MAILBOX_WRITE_RATEMET_F_MBWRITES
Average mailbox write rate per second for the local node for the current
interval record.
Data Type:
NUMERIC
Domains:
COM,CFG,CPU,DSK,FIL,LOC,PRO,TAP
MASTER_PIDPRO_L_MPID
This contains a hexadecimal representation of the master PID for the current
process subrecord on the local node for the current interval record.
Data Type:
NUMERIC
Domains:
PRO
MAXIMUM_DISK_QUEUE (Derived)
This contains a value representing the maximum queue length for the current
disk for all cluster members during the current interval.
Data Type:
NUMERIC
Domains:
CLU
466 Performance Manager Administrator Guide
Performance Manager Data Cells
MAXIMUM_IRPS_INUSE (Derived)
This contains a value representing the maximum number of IRPs in use on the
local node for all of the intervals.
Data Type:
NUMERIC
Domains:
SUMMARY
MAXIMUM_LOCKS_INUSE (Derived)
This contains a value representing the maximum number of locks in use on the
local node for all of the intervals.
Data Type:
NUMERIC
Domains:
SUMMARY
MAXIMUM_LRPS_INUSE (Derived)
A count of the maximum number of large request packs in use for the local
node for all of the intervals.
Data Type:
NUMERIC
Domains:
SUMMARY
MAXIMUM_RESOURCES_INUSE (Derived)
This contains a value representing the maximum number of resources known
by the local node for all of the intervals.
Data Type:
NUMERIC
Domains:
SUMMARY
MAXIMUM_SRPS_INUSE (Derived)
This contains a value representing the maximum number of SRPs in use on the
local node for all of the intervals.
Data Type:
NUMERIC
Domains:
SUMMARY
MAXIMUM_WORKING_SET_SIZE (Derived)
This contains the value of the maximum working set size of all processes for
the local node for the current interval.
Data Type:
NUMERIC
Domains:
COM,CFG,CPU,DSK,FIL,LOC,PRO,TAP
Appendix C: Performance Manager Data Cells 467
Performance Manager Data Cells
MAX_NONPAGEDPOOLBYTES_INUSE (Derived)
This contains a value representing the maximum number of non-paged pool
bytes in use on the local node of all of the intervals.
Data Type:
NUMERIC
Domains:
SUMMARY
MEMORY_PAGES_NOT_ALLOC_TO_VMSMET_F_USERPAGES
This contains the number of user memory pages for the current interval for
the local node.
Data Type:
NUMERIC
Domains:
COM,CFG,CPU,DSK,FIL,LOC,PRO,TAP
MODIFIEDLIST_FAULT_RATEMET_F_MFYFLTS
Average number of pagefaults per second from the modified page list for the
local node for the current interval record.
Data Type:
NUMERIC
Domains:
COM,CFG,CPU,DSK,FIL,LOC,PRO,TAP
MP_SYNCHMET_F_MP_SYNCH
Average percentage of CPU time spent in MP synchronization for the local node
for the current interval record.
Data Type:
NUMERIC
Domains:
COM,CFG,CPU,DSK,FIL,LOC,PRO,TAP
MULTI_IOMET_F_SPMIOBUSY
Percentage of time that two or more of the disk devices were busy for the local
node for the current interval record.
Data Type:
NUMERIC
Domains:
COM,CFG,CPU,DSK,FIL,LOC,PRO,TAP
NETWORK_COUNTMET_F_NETWORK
This contains a value representing the average number of network processes
on the local node for the current interval.
Data Type:
NUMERIC
Domains:
COM,CFG,CPU,DSK,FIL,LOC,PRO,TAP
468 Performance Manager Administrator Guide
Performance Manager Data Cells
NODENAME (Derived)
Name of the local node that the other data cells in the same domains refer.
Data Type:
STRING
Domains:
COM,CFG,CPU,DSK,FIL,LOC,PRO,TAP
NODE_INDX (Derived)
This contains a sequence value representing the current node.
Data Type:
NUMERIC
Domains:
COM,CFG,CPU,DSK,FIL,LOC,PRO,TAP
NONPRIMARY_IDLE (Derived)
Average percentage of CPU time idle for the processors other than the primary
processor in the local node for the current interval record.
Data Type:
NUMERIC
Domains:
COM,CFG,CPU,DSK,FIL,LOC,PRO,TAP
NO_IMAGES_SEEN_IN_RWAST (Derived)
This contains a value representing the count of images seen by the data
collector in an AST resource wait state on the local node for the current
interval.
Data Type:
NUMERIC
Domains:
COM,CFG,CPU,DSK,FIL,LOC,PRO,TAP
NO_IMAGES_SEEN_IN_RWBRK (Derived)
This contains a value representing the count of images seen by the data
collector in a breakthrough resource wait state on the local node for the
current interval.
Data Type:
NUMERIC
Domains:
COM,CFG,CPU,DSK,FIL,LOC,PRO,TAP
Appendix C: Performance Manager Data Cells 469
Performance Manager Data Cells
NO_IMAGES_SEEN_IN_RWCLU (Derived)
This contains a value representing the count of images seen by the data
collector in a cluster transition resource wait state on the local node for the
current interval.
Data Type:
NUMERIC
Domains:
COM,CFG,CPU,DSK,FIL,LOC,PRO,TAP
NO_IMAGES_SEEN_IN_RWIMG (Derived)
This contains a value representing the count of images seen by the data
collector in an image activation lock resource wait state on the local node for
the current interval.
Data Type:
NUMERIC
Domains:
COM,CFG,CPU,DSK,FIL,LOC,PRO,TAP
NO_IMAGES_SEEN_IN_RWLCK (Derived)
This contains a value representing the count of images seen by the data
collector in a lock ID resource wait state on the local node for the current
interval.
Data Type:
NUMERIC
Domains:
COM,CFG,CPU,DSK,FIL,LOC,PRO,TAP
NO_IMAGES_SEEN_IN_RWMBX (Derived)
This contains a value representing the count of images seen by the data
collector in a mailbox resource wait state on the local node for the current
interval.
Data Type:
NUMERIC
Domains:
COM,CFG,CPU,DSK,FIL,LOC,PRO,TAP
NO_IMAGES_SEEN_IN_RWMPB (Derived)
This contains a value representing the count of images seen by the data
collector in a modified page list busy resource wait state on the local node for
the current interval.
Data Type:
NUMERIC
Domains:
COM,CFG,CPU,DSK,FIL,LOC,PRO,TAP
470 Performance Manager Administrator Guide
Performance Manager Data Cells
NO_IMAGES_SEEN_IN_RWMPE (Derived)
This contains a value representing the count of images seen by the data
collector in a modified page list empty resource wait state on the local node for
the current interval.
Data Type:
NUMERIC
Domains:
COM,CFG,CPU,DSK,FIL,LOC,PRO,TAP
NO_IMAGES_SEEN_IN_RWNPG (Derived)
This contains a value representing the count of images seen by the data
collector in a nonpaged dynamic memory resource wait state on the local node
for the current interval.
Data Type:
NUMERIC
Domains:
COM,CFG,CPU,DSK,FIL,LOC,PRO,TAP
NO_IMAGES_SEEN_IN_RWPAG (Derived)
This contains a value representing the count of images seen by the data
collector in a paged dynamic memory resource wait state on the local node for
the current interval.
Data Type:
NUMERIC
Domains:
COM,CFG,CPU,DSK,FIL,LOC,PRO,TAP
NO_IMAGES_SEEN_IN_RWPFF (Derived)
This contains a value representing the count of images seen by the data
collector in a paging file resource wait state on the local node for the current
interval.
Data Type:
NUMERIC
Domains:
COM,CFG,CPU,DSK,FIL,LOC,PRO,TAP
NO_IMAGES_SEEN_IN_RWQUO (Derived)
This contains a value representing the count of images seen by the data
collector in a job quota resource wait state on the local node for the current
interval.
Data Type:
NUMERIC
Domains:
COM,CFG,CPU,DSK,FIL,LOC,PRO,TAP
Appendix C: Performance Manager Data Cells 471
Performance Manager Data Cells
NO_IMAGES_SEEN_IN_RWSCS (Derived)
This contains a value representing the count of images seen by the data
collector in an SCS resource wait state on the local node for the current
interval.
Data Type:
NUMERIC
Domains:
COM,CFG,CPU,DSK,FIL,LOC,PRO,TAP
NO_IMAGES_SEEN_IN_RWSWP (Derived)
This contains a value representing the count of images seen by the data
collector in a swapping file resource wait state on the local node for the
current interval.
Data Type:
NUMERIC
Domains:
COM,CFG,CPU,DSK,FIL,LOC,PRO,TAP
NUMBER_OF_INSWAPPED_PROCESSES (Derived)
This contains a value representing the number of processes in the balance set
on the local node for the current interval.
Data Type:
NUMERIC
Domains:
COM,CFG,CPU,DSK,FIL,LOC,PRO,TAP
NUMBER_OF_OUTSWAPPED_PROCESSES (Derived)
This contains a value representing the number of processes not in the balance
set on the local node for the current interval.
Data Type:
NUMERIC
Domains:
COM,CFG,CPU,DSK,FIL,LOC,PRO,TAP
NUMBER_OF_PROCESSESMET_F_PROCCNT
This contains a value representing the average number of processes on the
local node for the current interval.
Data Type:
NUMERIC
Domains:
COM,CFG,CPU,DSK,FIL,LOC,PRO,TAP
NUM_PROCS_NOT_USING_WS_LOANS (Derived)
This contains the value indicating a count of processes not using working set
loans on the local node for the current interval.
Data Type:
NUMERIC
472 Performance Manager Administrator Guide
Performance Manager Data Cells
Domains:
COM,CFG,CPU,DSK,FIL,LOC,PRO,TAP
OPEN_FILESMET_F_OPEN_FILES
Average number of open files for the local node for the current interval record.
Data Type:
NUMERIC
Domains:
COM,CFG,CPU,DSK,FIL,LOC,PRO,TAP
OUTGOING_BLOCKING_AST_RATEMET_F_BLK_OUT
This contains the number of outgoing blocking ASTs queued per second for the
current interval for the local node.
Data Type:
NUMERIC
Domains:
COM,CFG,CPU,DSK,FIL,LOC,PRO,TAP
OUTGOING_DEADLOCK_MESSAGE_RATEMET_F_DLCKMSGS_OUT
This contains the number of outgoing deadlock detection messages per second
for the current interval for the local node.
Data Type:
NUMERIC
Domains:
COM,CFG,CPU,DSK,FIL,LOC,PRO,TAP
OUTGOING_DIRECTORY_FUNCT_RATEMET_F_DIR_OUT
This contains the number of outgoing directory operations per second for the
current interval for the local node.
Data Type:
NUMERIC
Domains:
COM,CFG,CPU,DSK,FIL,LOC,PRO,TAP
OUTGOING_LOCK_CONVERSION_RATEMET_F_ENQCVT_OUT
This contains the number of outgoing enqueue lock conversion requests per
second for the current interval for the local node.
Data Type:
NUMERIC
Domains:
COM,CFG,CPU,DSK,FIL,LOC,PRO,TAP
OUTGOING_LOCK_DEQUEUE_RATEMET_F_DEQ_OUT
This contains the number of outgoing dequeue lock requests per second for
the current interval for the local node.
Data Type:
NUMERIC
Appendix C: Performance Manager Data Cells 473
Performance Manager Data Cells
Domains:
COM,CFG,CPU,DSK,FIL,LOC,PRO,TAP
OUTGOING_LOCK_ENQUEUE_RATEMET_F_ENQNEW_OUT
This contains the number of new outgoing enqueue lock requests per second
for the current interval for the local node.
Data Type:
NUMERIC
Domains:
COM,CFG,CPU,DSK,FIL,LOC,PRO,TAP
OUT_SWAP_RATEMET_F_OSWPCNT
Average outswap rate per second for the local node for the current interval
record.
Data Type:
NUMERIC
Domains:
COM,CFG,CPU,DSK,FIL,LOC,PRO,TAP
PAGEFILE_PAGE_READ_RATEMET_F_PREADS
Average number of pages per second read from the page files for the local
node for the current interval record.
Data Type:
NUMERIC
Domains:
COM,CFG,CPU,DSK,FIL,LOC,PRO,TAP
PAGEFILE_PAGE_WRITE_RATEMET_F_PWRITES
Average number of pages per second written to the page files for the local
node for the current interval record.
Data Type:
NUMERIC
Domains:
COM,CFG,CPU,DSK,FIL,LOC,PRO,TAP
PAGEFILE_READ_IO_RATEMET_F_PREADIO
Average number of reads per second from the page files for the local node for
the current interval record.
Data Type:
NUMERIC
Domains:
COM,CFG,CPU,DSK,FIL,LOC,PRO,TAP
PAGEFILE_UTILIZATION (Derived)
This contains the ratio of used (not free) to total pages in all paging files for
the current interval for the local node.
Data Type:
NUMERIC
474 Performance Manager Administrator Guide
Performance Manager Data Cells
Domains:
COM,CFG,CPU,DSK,FIL,LOC,PRO,TAP
PAGEFILE_WRITE_IO_RATEMET_F_PWRITIO
Average number of writes per second to the page files for the local node for
the current interval record.
Data Type:
NUMERIC
Domains:
COM,CFG,CPU,DSK,FIL,LOC,PRO,TAP
PAGES_ON_FREELISTMET_F_FREECNT
Average number pages on the free page list for the local node for the current
interval record.
Data Type:
NUMERIC
Domains:
COM,CFG,CPU,DSK,FIL,LOC,PRO,TAP
PAGES_ON_MODIFIEDLISTMET_F_MFYCNT
Average number pages on the modified page list for the local node for the
current interval record.
Data Type:
NUMERIC
Domains:
COM,CFG,CPU,DSK,FIL,LOC,PRO,TAP
PAGE_CONVERT (Derived)
This contains a one if the hardware model is a VAX (2 if not), necessary to
scale rules which depend on CPU-specific page counts, for the local node for
the current interval record in LOCAL domain, and for the local node for the last
interval record in SUMMARY domain.
Data Type:
NUMERIC
Domains:
COM,CFG,CPU,DSK,FIL,LOC,PRO,SUM,TAP
PAGE_WAITMET_F_SPMPAGEWAIT
Percentage of time that the CPU was idle and at least one disk device had
paging I/O in progress for the local node for the current interval record.
Data Type:
NUMERIC
Domains:
COM,CFG,CPU,DSK,FIL,LOC,PRO,TAP
Appendix C: Performance Manager Data Cells 475
Performance Manager Data Cells
PERCENT_CPU_TIME_IN_FILE_SYSTEMMET_F_FILECPU
Average percentage of CPU time spent in the file system on the local node for
the current interval record.
Data Type:
NUMERIC
Domains:
COM,CFG,CPU,DSK,FIL,LOC,PRO,TAP
PGLET_CONVERT (Derived)
This contains a one if the hardware model is a VAX (16 if not), necessary to
adjust rules which mix page and pagelet parameters, for the local node for the
current interval record in LOCAL domain, and for the local node for the last
interval record in SUMMARY domain.
Data Type:
NUMERIC
Domains:
COM,CFG,CPU,DSK,FIL,LOC,PRO,SUM,TAP
PORT_KB_MAPPED (Derived)
This contains the value representing the number of kilobytes mapped per
second from the local node's port to all other nodes for the current
configuration record and interval.
Data Type:
NUMERIC
Domains:
CFG
PORT_MESSAGES (Derived)
This contains the value representing the number of messages sent and
received per second from the local node's port to all other nodes for the
current configuration record and interval.
Data Type:
NUMERIC
Domains:
CFG
PRIMARY_IDLE (Derived)
Average percentage of CPU time idle for the primary processor in the local
node for the current interval record.
Data Type:
NUMERIC
Domains:
COM,CFG,CPU,DSK,FIL,LOC,PRO,TAP
476 Performance Manager Administrator Guide
Performance Manager Data Cells
PRIMARY_INTERRUPT_STACK (Derived)
Average percentage of CPU time on the Interrupt Stack for the primary
processor in the local node for the current interval record.
Data Type:
NUMERIC
Domains:
COM,CFG,CPU,DSK,FIL,LOC,PRO,TAP
PRIORITY_LOCKOUT (Derived)
This contains a Boolean value representing the presence of a priority lockout of
a computable process by another with excessive CPU utilization on the local
node for the current interval. The process's priority which is causing the
lockout must have a priority larger than DEFPRI.
Data Type:
NUMERIC
Domains:
COM,CFG,CPU,DSK,FIL,LOC,PRO,TAP
PRIVATE_PGS_TALLY (Derived)
This contains the sum of the values representing the number of physical
private pages in the working sets for all of the current process subrecords
which were selected by the most recent PROCESS_SCAN routine operation.
Data Type:
TALLY
Domains:
COM,CFG,CPU,DSK,FIL,LOC,PRO,TAP
Target Domains: PRO
PROCESSES_IN_CEFMET_F_CEF
This contains a value representing the average number of processes in
common event flag wait state on the local node for the current interval.
(Sampled every 5 seconds)
Data Type:
NUMERIC
Domains:
COM,CFG,CPU,DSK,FIL,LOC,PRO,TAP
PROCESSES_IN_COLPGMET_F_COLPG
This contains a value representing the average number of processes in collided
page wait state on the local node for the current interval. (Sampled every 5
seconds)
Data Type:
NUMERIC
Domains:
COM,CFG,CPU,DSK,FIL,LOC,PRO,TAP
Appendix C: Performance Manager Data Cells 477
Performance Manager Data Cells
PROCESSES_IN_COMMET_F_COM
This contains a value representing the average number of processes in the
computable state on the local node for the current interval. (Sampled every 5
seconds)
Data Type:
NUMERIC
Domains:
COM,CFG,CPU,DSK,FIL,LOC,PRO,TAP
PROCESSES_IN_COMOMET_F_COMO
This contains a value representing the average number of processes in the
outswapped computable state on the local node for the current interval.
(Sampled every 5 seconds)
Data Type:
NUMERIC
Domains:
COM,CFG,CPU,DSK,FIL,LOC,PRO,TAP
PROCESSES_IN_CURMET_F_CUR
This contains a value representing the average number of processes in the
currently executing state on the local node for the current interval. (Sampled
every 5 seconds)
Data Type:
NUMERIC
Domains:
COM,CFG,CPU,DSK,FIL,LOC,PRO,TAP
PROCESSES_IN_FPGMET_F_FPG
This contains a value representing the average number of processes in free
page wait state on the local node for the current interval. (Sampled every 5
seconds)
Data Type:
NUMERIC
Domains:
COM,CFG,CPU,DSK,FIL,LOC,PRO,TAP
PROCESSES_IN_HIBMET_F_HIB
This contains a value representing the average number of processes in
hibernate wait state on the local node for the current interval. (Sampled every
5 seconds)
Data Type:
NUMERIC
Domains:
COM,CFG,CPU,DSK,FIL,LOC,PRO,TAP
478 Performance Manager Administrator Guide
Performance Manager Data Cells
PROCESSES_IN_HIBOMET_F_HIBO
This contains a value representing the average number of processes in
outswapped hibernate wait state on the local node for the current interval.
(Sampled every 5 seconds)
Data Type:
NUMERIC
Domains:
COM,CFG,CPU,DSK,FIL,LOC,PRO,TAP
PROCESSES_IN_LEFMET_F_LEF
This contains a value representing the average number of processes in local
event flag wait state on the local node for the current interval. (Sampled every
5 seconds)
Data Type:
NUMERIC
Domains:
COM,CFG,CPU,DSK,FIL,LOC,PRO,TAP
PROCESSES_IN_LEFOMET_F_LEFO
This contains a value representing the average number of processes in
outswapped local event flag wait state on the local node for the current
interval. (Sampled every 5 seconds)
Data Type:
NUMERIC
Domains:
COM,CFG,CPU,DSK,FIL,LOC,PRO,TAP
PROCESSES_IN_MWAITMET_F_MWAIT
This contains a value representing the average number of processes in MUTEX
or resource wait state on the local node for the current interval. (Sampled
every 5 seconds)
Data Type:
NUMERIC
Domains:
COM,CFG,CPU,DSK,FIL,LOC,PRO,TAP
PROCESSES_IN_PFWMET_F_PFW
This contains a value representing the average number of processes in page
fault wait state on the local node for the current interval. (Sampled every 5
seconds)
Data Type:
NUMERIC
Domains:
COM,CFG,CPU,DSK,FIL,LOC,PRO,TAP
Appendix C: Performance Manager Data Cells 479
Performance Manager Data Cells
PROCESSES_IN_SUSPMET_F_SUSP
This contains a value representing the average number of processes in
suspend wait state on the local node for the current interval. (Sampled every 5
seconds)
Data Type:
NUMERIC
Domains:
COM,CFG,CPU,DSK,FIL,LOC,PRO,TAP
PROCESSES_IN_SUSPOMET_F_SUSPO
This contains a value representing the average number of processes in
outswapped suspend wait state on the local node for the current interval.
(Sampled every 5 seconds)
Data Type:
NUMERIC
Domains:
COM,CFG,CPU,DSK,FIL,LOC,PRO,TAP
PROCESSES_NEED_MORE_EXTENT (Derived)
This contains a Boolean value representing the presence of one or more
processes which need larger working set extents on the local node for the
current interval.
Data Type:
NUMERIC
Domains:
COM,CFG,CPU,DSK,FIL,LOC,PRO,TAP
PROCESSES_NEED_MORE_WSMAX (Derived)
This contains a Boolean value representing the presence of one or more
processes which need larger working set maximums on the local node for the
current interval.
Data Type:
NUMERIC
Domains:
COM,CFG,CPU,DSK,FIL,LOC,PRO,TAP
PROCESSES_WAIT_IN_RWSWP (Derived)
This contains a Boolean value representing the presence of processes waiting
in a swapping file resource wait state on the local node for the current interval.
Data Type:
NUMERIC
Domains:
COM,CFG,CPU,DSK,FIL,LOC,PRO,TAP
480 Performance Manager Administrator Guide
Performance Manager Data Cells
PROCESS_BASE_PRIORITYPRO_B_PRIB
This contains a value representing the process's base priority. This cell
pertains to the current process subrecord on the local node for the current
interval.
Data Type:
NUMERIC
Domains:
PRO
PROCESS_BUFFERED_IO_RATEPRO_F_BUFIOS
This contains a value representing the buffered I/O rate of the current process
subrecord on the local node for the current interval.
Data Type:
NUMERIC
Domains:
PRO
PROCESS_BUFFERED_IO_TALLY (Derived)
This contains the sum of the values representing the buffered I/O rate for all
of the current process subrecords which were selected by the most recent
PROCESS_SCAN routine operation.
Data Type:
TALLY
Domains:
COM,CFG,CPU,DSK,FIL,LOC,PRO,TAP
Target Domains: PRO
PROCESS_COMMAND_WAITPRO_F_COMMAND_WAIT
This contains a value representing the number of milliseconds elapsed from
the start of the most recent terminal read request to the end of the current
interval represented by this record.
Data Type:
NUMERIC
Domains:
PRO
PROCESS_COM_PERCENTPRO_F_COMPU
This contains a value representing the percent of time in the computable state
over the processes uptime for the current process subrecord on the local node
for the current interval. (Sampled every 5 seconds)
Data Type:
NUMERIC
Domains:
PRO
Appendix C: Performance Manager Data Cells 481
Performance Manager Data Cells
PROCESS_COM_PERCENT_TALLY (Derived)
This contains the sum of the values representing the percent of time in the
computable state for all of the current process subrecords which were selected
by the most recent PROCESS_SCAN routine operation.
Data Type:
TALLY
Domains:
COM,CFG,CPU,DSK,FIL,LOC,PRO,TAP
Target Domains: PRO
PROCESS_CPUTIMEPRO_F_CPUTIM
This contains a value representing the CPU time in milliseconds for the current
process subrecord on the local node.
Data Type:
NUMERIC
Domains:
PRO
PROCESS_CPUTIME_TALLY (Derived)
This contains the sum of the values representing the amount of CPU time of all
of the current process subrecords which were selected by the most recent
PROCESS_SCAN routine operation.
Data Type:
TALLY
Domains:
COM,CFG,CPU,DSK,FIL,LOC,PRO,TAP
Target Domains: PRO
PROCESS_CURRENT_PRIORITYPRO_B_PRIB
This contains a value representing the process's current priority. This cell
pertains to the current process subrecord on the local node for the current
interval.
Data Type:
NUMERIC
Domains:
PRO
PROCESS_DIRECT_IO_RATEPRO_F_DIRIOS
This contains a value representing the direct I/O rate of the current process
subrecord on the local node for the current interval.
Data Type:
NUMERIC
Domains:
PRO
482 Performance Manager Administrator Guide
Performance Manager Data Cells
PROCESS_DIRECT_IO_TALLY (Derived)
This contains the sum of the values representing the direct I/O rate for all of
the current process subrecords which were selected by the most recent
PROCESS_SCAN routine operation.
Data Type:
TALLY
Domains:
COM,CFG,CPU,DSK,FIL,LOC,PRO,TAP
Target Domains: PRO
PROCESS_DISABLED_ADJUSTMENTPRO_B_AWSA
This contains a Boolean value where a 1 means the process has working set
adjustment disabled. This cell pertains to the current process subrecord on the
local node for the current interval.
Data Type:
NUMERIC
Domains:
PRO
PROCESS_DISK_IO_RATEPRO_F_OPS
This contains a value representing the disk I/O rate of the current process
subrecord on the local node for the current interval.
Data Type:
NUMERIC
Domains:
PRO
PROCESS_DISK_IO_TALLY (Derived)
This contains the sum of the values representing the disk I/O rate for all of the
current process subrecords which were selected by the most recent
PROCESS_SCAN routine operation.
Data Type:
TALLY
Domains:
COM,CFG,CPU,DSK,FIL,LOC,PRO,TAP
Target Domains: PRO
PROCESS_DISK_THRUPUTPRO_F_THRUPUT
This contains a value representing the disk throughput of the current process
subrecord on the local node for the current interval.
Data Type:
NUMERIC
Domains:
PRO
Appendix C: Performance Manager Data Cells 483
Performance Manager Data Cells
PROCESS_DISK_THRUPUT_TALLY (Derived)
This contains the sum of the values representing the disk throughput for all of
the current process subrecords which were selected by the most recent
PROCESS_SCAN routine operation.
Data Type:
TALLY
Domains:
COM,CFG,CPU,DSK,FIL,LOC,PRO,TAP
Target Domains: PRO
PROCESS_IMAGE_ACTIVATIONPRO_B_IMGACT
This contains a Boolean value where for .CPD data, a 1 means the process's
activated the image during the current interval, and for History data, a 1
means that one or more activations took place for data summarized into this
process subrecord. This cell pertains to the current process subrecord on the
local node for the current interval.
Data Type:
NUMERIC
Domains:
PRO
PROCESS_IMAGE_ACTS_TALLY (Derived)
This contains the sum of the values representing the image activation rate for
all of the current process subrecords which were selected by the most recent
PROCESS_SCAN routine operation.
Data Type:
TALLY
Domains:
COM,CFG,CPU,DSK,FIL,LOC,PRO,TAP
Target Domains: PRO
PROCESS_IMAGE_ACT_RATEPRO_F_IMGACTS
This contains a value representing the image activation rate of the current
process subrecord on the local node for the current interval.
Data Type:
NUMERIC
Domains:
PRO
PROCESS_IMAGE_LOGINPRO_B_LOGIN
This contains a Boolean value where a 1 means the process logged in. For
history data, it means one or more processes. This cell pertains to the current
process subrecord on the local node for the current interval.
Data Type:
NUMERIC
Domains:
PRO
484 Performance Manager Administrator Guide
Performance Manager Data Cells
PROCESS_IMAGE_LOGOUTPRO_B_LOGOUT
This contains a Boolean value where a 1 means the process logged out. For
history data, it means one or more processes. This cell pertains to the current
process subrecord on the local node for the current interval.
Data Type:
NUMERIC
Domains:
PRO
PROCESS_IMAGE_TERMINATIONPRO_B_IMGTRM
This contains a Boolean value where for .CPD data, a 1 means the process's
terminated the image which triggered the creation of this subrecord, and for
History data, a 1 means that one or more image terminations took place for
data summarized into this process subrecord. This cell pertains to the current
process subrecord on the local node for the current interval.
Data Type:
NUMERIC
Domains:
PRO
PROCESS_RESPONSE_WAITPRO_F_RESPONSE_WAIT
This contains a value representing the number of milliseconds elapsed from
the completion of the most recent terminal read to the end of the current
interval represented by this record.
Data Type:
NUMERIC
Domains:
PRO
PROCESS_SCAN (Derived)
Provides the count of process subrecords for which the specified rule
expression is true on the local node for the current interval.
Data Type:
SCAN
Domains:
COM,CFG,CPU,DSK,FIL,LOC,PRO,TAP
Target Domains: PRO
PROCESS_STATEPROA_A_STATE
This contains a string representing the process's scheduling state at the end of
the sampling interval. This cell pertains to the current process subrecord on
the local node for the current interval.
Data Type:
STRING
Domains:
PRO
Appendix C: Performance Manager Data Cells 485
Performance Manager Data Cells
PROCESS_STATUSPRO_B_STATUS
This contains a code representing the process's status where 0 means
interactive, 1 means batch, and 2 means network. This cell pertains to the
current process subrecord on the local node for the current interval.
Data Type:
NUMERIC
Domains:
PRO
PROCESS_TAPE_IO_RATEPRO_F_TAPE_IO
This contains a value representing the tape I/O rate of the current process
subrecord on the local node for the current interval.
Data Type:
NUMERIC
Domains:
PRO
PROCESS_TAPE_THRUPUTPRO_F_TAPE_THRUPUT
This contains a value representing the tape throughput rate of the current
process subrecord on the local node for the current interval.
Data Type:
NUMERIC
Domains:
PRO
PROCESS_TERM_INPUTPRO_F_TERM_INPUT
This contains a value representing the rate of terminal inputs for the current
process subrecord on the local node for the current interval.
Data Type:
NUMERIC
Domains:
PRO
PROCESS_TERM_RESPONSE_TIMEPRO_F_RESPONSE_TIME
This contains a value representing the average number of milliseconds
between the completion of a read I/O request and the start of the next I/O on
the user's terminal, for the current process subrecord on the local node for the
current interval.
Data Type:
NUMERIC
Domains:
PRO
486 Performance Manager Administrator Guide
Performance Manager Data Cells
PROCESS_TERM_RESPONSE_TIME2PRO_F_RESPONSE_TIME2
This contains a value representing the average number of milliseconds
between the completion of a read I/O request and the start of the next read
I/O on the user's terminal, for the current process subrecord on the local node
for the current interval.
Data Type:
NUMERIC
Domains:
PRO
PROCESS_TERM_THINK_TIMEPRO_F_THINK_TIME
This contains a value representing the average number of milliseconds
between the start of a read I/O request to the user's terminal, and the
completion of that I/O, for the current process subrecord on the local node for
the current interval.
Data Type:
NUMERIC
Domains:
PRO
PROCESS_TERM_THRUPUTPRO_F_TERM_THRUPUT
This contains a value representing the I/O rate in bytes to terminal devices for
the current process subrecord on the local node for the current interval.
Data Type:
NUMERIC
Domains:
PRO
PROCESS_UPTIMEPRO_F_UPTIME
This contains a value representing the uptime in seconds of the current
process subrecord on the local node for the current interval.
Data Type:
NUMERIC
Domains:
PRO
PROCESS_UPTIME_TALLY (Derived)
This contains the sum of the values representing the uptime for all of the
current process subrecords which were selected by the most recent
PROCESS_SCAN routine operation.
Data Type:
TALLY
Domains:
COM,CFG,CPU,DSK,FIL,LOC,PRO,TAP
Target Domains: PRO
Appendix C: Performance Manager Data Cells 487
Performance Manager Data Cells
PROCESS_VIRTUAL_PAGESPRO_F_VA_USED
This contains a value representing the number of virtual pages used by this
process. This cell pertains to the current process subrecord on the local node
for the current interval.
Data Type:
NUMERIC
Domains:
PRO
PROCESS_WAS_IN_CEFPRO_V_SSS_CEF
This contains a Boolean value where 1 represents the fact that this process
was seen at least once by the Performance Manager in the common event flag
wait scheduler state. This cell pertains to the current process subrecord on the
local node for the current interval.
Data Type:
NUMERIC
Domains:
PRO
PROCESS_WAS_IN_COLPGPRO_V_SSS_COLPG
This contains a Boolean value where 1 represents the fact that this process
was seen at least once by the Performance Manager in the collided page wait
scheduler state. This cell pertains to the current process subrecord on the local
node for the current interval.
Data Type:
NUMERIC
Domains:
PRO
PROCESS_WAS_IN_COMPRO_V_SSS_COM
This contains a Boolean value where 1 represents the fact that this process
was seen at least once by the Performance Manager in the compute queue.
This cell pertains to the current process subrecord on the local node for the
current interval.
Data Type:
NUMERIC
Domains:
PRO
PROCESS_WAS_IN_COMOPRO_V_SSS_COMO
This contains a Boolean value where 1 represents the fact that this process
was seen at least once by the Performance Manager in the compute
outswapped queue. This cell pertains to the current process subrecord on the
local node for the current interval.
Data Type:
NUMERIC
Domains:
PRO
488 Performance Manager Administrator Guide
Performance Manager Data Cells
PROCESS_WAS_IN_CURPRO_V_SSS_CUR
This contains a Boolean value where 1 represents the fact that this process
was seen at least once by the Performance Manager in as the current process
scheduled. This cell pertains to the current process subrecord on the local
node for the current interval.
Data Type:
NUMERIC
Domains:
PRO
PROCESS_WAS_IN_FPGPRO_V_SSS_FPG
This contains a Boolean value where 1 represents the fact that this process
was seen at least once by the Performance Manager in the free page wait
scheduler state. This cell pertains to the current process subrecord on the local
node for the current interval.
Data Type:
NUMERIC
Domains:
PRO
PROCESS_WAS_IN_HIBPRO_V_SSS_HIB
This contains a Boolean value where 1 represents the fact that this process
was seen at least once by the Performance Manager in the hibernate scheduler
state. This cell pertains to the current process subrecord on the local node for
the current interval.
Data Type:
NUMERIC
Domains:
PRO
PROCESS_WAS_IN_HIBOPRO_V_SSS_HIBO
This contains a Boolean value where 1 represents the fact that this process
was seen at least once by the Performance Manager in the outswapped
hibernate scheduler state. This cell pertains to the current process subrecord
on the local node for the current interval.
Data Type:
NUMERIC
Domains:
PRO
PROCESS_WAS_IN_LEFPRO_V_SSS_LEF
This contains a Boolean value where 1 represents the fact that this process
was seen at least once by the Performance Manager in the local event flag wait
scheduler state. This cell pertains to the current process subrecord on the local
node for the current interval.
Data Type:
NUMERIC
Appendix C: Performance Manager Data Cells 489
Performance Manager Data Cells
Domains:
PRO
PROCESS_WAS_IN_LEFOPRO_V_SSS_LEFO
This contains a Boolean value where 1 represents the fact that this process
was seen at least once by the Performance Manager in the outswapped local
event flag wait scheduler state. This cell pertains to the current process
subrecord on the local node for the current interval.
Data Type:
NUMERIC
Domains:
PRO
PROCESS_WAS_IN_MWAITPRO_V_SSS_MWAIT
This contains a Boolean value where 1 represents the fact that this process
was seen at least once by the Performance Manager in the mutex wait
scheduler state. This cell pertains to the current process subrecord on the local
node for the current interval.
Data Type:
NUMERIC
Domains:
PRO
PROCESS_WAS_IN_PFWPRO_V_SSS_PFW
This contains a Boolean value where 1 represents the fact that this process
was seen at least once by the Performance Manager in the page fault wait
scheduler state. This cell pertains to the current process subrecord on the local
node for the current interval.
Data Type:
NUMERIC
Domains:
PRO
PROCESS_WAS_IN_RWASTPRO_V_RSN_ASTWAIT
This contains a Boolean value where 1 represents the fact that this process
was seen at least once by the Performance Manager in the RWAST mwait
state. This cell pertains to the current process subrecord on the local node for
the current interval.
Data Type:
NUMERIC
Domains:
PRO
490 Performance Manager Administrator Guide
Performance Manager Data Cells
PROCESS_WAS_IN_RWBRKPRO_V_RSN_BRKTHRU
This contains a Boolean value where 1 represents the fact that this process
was seen at least once by the Performance Manager in the RWBRK mwait
state. This cell pertains to the current process subrecord on the local node for
the current interval.
Data Type:
NUMERIC
Domains:
PRO
PROCESS_WAS_IN_RWCLUPRO_V_RSN_CLU
This contains a Boolean value where 1 represents the fact that this process
was seen at least once by the Performance Manager in the RWCLU mwait
state. This cell pertains to the current process subrecord on the local node for
the current interval.
Data Type:
NUMERIC
Domains:
PRO
PROCESS_WAS_IN_RWIMGPRO_V_RSN_IACLOCK
This contains a Boolean value where 1 represents the fact that this process
was seen at least once by the Performance Manager in the RWIMG mwait
state. This cell pertains to the current process subrecord on the local node for
the current interval.
Data Type:
NUMERIC
Domains:
PRO
PROCESS_WAS_IN_RWLCKPRO_V_RSN_LOCKID
This contains a Boolean value where 1 represents the fact that this process
was seen at least once by the Performance Manager in the RWLCK mwait
state. This cell pertains to the current process subrecord on the local node for
the current interval.
Data Type:
NUMERIC
Domains:
PRO
PROCESS_WAS_IN_RWMBXPRO_V_RSN_MAILBOX
This contains a Boolean value where 1 represents the fact that this process
was seen at least once by the Performance Manager in the RWMBX mwait
state. This cell pertains to the current process subrecord on the local node for
the current interval.
Data Type:
NUMERIC
Appendix C: Performance Manager Data Cells 491
Performance Manager Data Cells
Domains:
PRO
PROCESS_WAS_IN_RWMPBPRO_V_RSN_MPWBUSY
This contains a Boolean value where 1 represents the fact that this process
was seen at least once by the Performance Manager in the RWMPB mwait
state. This cell pertains to the current process subrecord on the local node for
the current interval.
Data Type:
NUMERIC
Domains:
PRO
PROCESS_WAS_IN_RWMPEPRO_V_RSN_MPLEMPTY
This contains a Boolean value where 1 represents the fact that this process
was seen at least once by the Performance Manager in the RWMPE mwait
state. This cell pertains to the current process subrecord on the local node for
the current interval.
Data Type:
NUMERIC
Domains:
PRO
PROCESS_WAS_IN_RWNPGPRO_V_RSN_NPDYNMEM
This contains a Boolean value where 1 represents the fact that this process
was seen at least once by the Performance Manager in the RWNPG mwait
state. This cell pertains to the current process subrecord on the local node for
the current interval.
Data Type:
NUMERIC
Domains:
PRO
PROCESS_WAS_IN_RWPAGPRO_V_RSN_PGDYNMEM
This contains a Boolean value where 1 represents the fact that this process
was seen at least once by the Performance Manager in the RWPAG mwait
state. This cell pertains to the current process subrecord on the local node for
the current interval.
Data Type:
NUMERIC
Domains:
PRO
492 Performance Manager Administrator Guide
Performance Manager Data Cells
PROCESS_WAS_IN_RWPFFPRO_V_RSN_PGFILE
This contains a Boolean value where 1 represents the fact that this process
was seen at least once by the Performance Manager in the RWPFF mwait state.
This cell pertains to the current process subrecord on the local node for the
current interval.
Data Type:
NUMERIC
Domains:
PRO
PROCESS_WAS_IN_RWQUOPRO_V_RSN_JQUOTA
This contains a Boolean value where 1 represents the fact that this process
was seen at least once by the Performance Manager in the RWQUO mwait
state. This cell pertains to the current process subrecord on the local node for
the current interval.
Data Type:
NUMERIC
Domains:
PRO
PROCESS_WAS_IN_RWSCSPRO_V_RSN_SCS
This contains a Boolean value where 1 represents the fact that this process
was seen at least once by the Performance Manager in the RWSCS mwait
state. This cell pertains to the current process subrecord on the local node for
the current interval.
Data Type:
NUMERIC
Domains:
PRO
PROCESS_WAS_IN_RWSWPPRO_V_RSN_SWPFILE
This contains a Boolean value where 1 represents the fact that this process
was seen at least once by the Performance Manager in the RWSWP mwait
state. This cell pertains to the current process subrecord on the local node for
the current interval.
Data Type:
NUMERIC
Domains:
PRO
PROCESS_WAS_IN_SUSPPRO_V_SSS_SUSP
This contains a Boolean value where 1 represents the fact that this process
was seen at least once by the Performance Manager in the suspended
scheduler state. This cell pertains to the current process subrecord on the local
node for the current interval.
Data Type:
NUMERIC
Appendix C: Performance Manager Data Cells 493
Performance Manager Data Cells
Domains:
PRO
PROCESS_WAS_IN_SUSPOPRO_V_SSS_SUSPO
This contains a Boolean value where 1 represents the fact that this process
was seen at least once by the Performance Manager in the outswapped
suspended scheduler state. This cell pertains to the current process subrecord
on the local node for the current interval.
Data Type:
NUMERIC
Domains:
PRO
PROCESS_WS_GTR_QUOTA_EXIST (Derived)
This contains a Boolean value representing the presence of one or more
processes where the working set is greater than its WSQUOTA on the local
node for the current interval.
Data Type:
NUMERIC
Domains:
COM,CFG,CPU,DSK,FIL,LOC,PRO,TAP
PROCESS_WS_GTR_QUOTA_PROC_X (Derived)
This contains an index pointing to the process subrecord, for a unique
username, for processes where the working set is greater than its WSQUOTA
on the local node for the current interval.
Data Type:
INDEX
Domains:
COM,CFG,CPU,DSK,FIL,LOC,PRO,TAP
Target Domains: PRO
PROC_NOT_USING_WS_LOAN_X (Derived)
This contains an index pointing to a process subrecord not using its working
set loans on the local node for the current interval.
Data Type:
INDEX
Domains:
COM,CFG,CPU,DSK,FIL,LOC,PRO,TAP
Target Domains: PRO
494 Performance Manager Administrator Guide
Performance Manager Data Cells
PROC_TYPEPRO_L_PROCTYPE
This contains a hexadecimal representation of the type of process (bit 0 =
interactive, bit 1 = batch, bit 2 = network, bit 3 = detached, bit 4 =
subprocess) for the current process subrecord on the local node for the current
interval record.
Data Type:
NUMERIC
Domains:
PRO
PSWP_WAITMET_F_SPMMMGWAIT
Percentage of time that the CPU was idle and at least one disk device had
either paging I/O or swapping I/O in progress for the local node for the current
interval record.
Data Type:
NUMERIC
Domains:
COM,CFG,CPU,DSK,FIL,LOC,PRO,TAP
QUOTA_CACHE_AR (Derived)
Attempt rate per second to the quota cache for the local node for the current
interval record.
Data Type:
NUMERIC
Domains:
COM,CFG,CPU,DSK,FIL,LOC,PRO,TAP
QUOTA_CACHE_HR (Derived)
Hit ratio to the quota cache for the local node for the current interval record.
Calculated by dividing the number of quota cache hits by the number of quota
cache attempts (hits + misses), times 100.
Data Type:
NUMERIC
Domains:
COM,CFG,CPU,DSK,FIL,LOC,PRO,TAP
RDTS_IN_LISTMET_F_RDT_MAX
This contains the total number entries in the I/O request descriptor table for
the current interval for the local node.
Data Type:
NUMERIC
Domains:
COM,CFG,CPU,DSK,FIL,LOC,PRO,TAP
Appendix C: Performance Manager Data Cells 495
Performance Manager Data Cells
RDT_WAIT_RATEMET_F_RDT_QUE
This contains the number entries in the I/O request descriptor table in a wait
queue for the current interval for the local node.
Data Type:
NUMERIC
Domains:
COM,CFG,CPU,DSK,FIL,LOC,PRO,TAP
SCS_ADAPTERNAMECFG_A_ADAPTER
This contains the adapter name string of the remote node's adapter for the
current configuration subrecord (e.g., "CIXCD").
Data Type:
INDEX
Domains:
CFG
SCS_ADAPTER_IDCFG_L_ADAPTER_ID
This contains the adapter code of the remote node's adapter for the current
configuration subrecord. See PSPA$LIB for a list of known codes.
Data Type:
NUMERIC
Domains:
CFG
SCS_NODENAMECFG_A_NODENAME
This contains the name of the remote node in the cluster system configuration
for the current configuration subrecord.
Data Type:
STRING
Domains:
CFG
SCS_NODE_HWNAMECFG_A_HWNAME
This contains the hardware type string of the remote node for the current
configuration subrecord.
Data Type:
STRING
Domains:
CFG
SCS_NODE_IS_HSCCFG_V_STATUS_HSC
This contains a Boolean of either the values 1, if the hardware type of the
remote node for the current configuration subrecord is a HSC, or a 0 if it is not
an HSC.
Data Type:
NUMERIC
Domains:
CFG
496 Performance Manager Administrator Guide
Performance Manager Data Cells
SCS_NODE_IS_MEMBERCFG_V_STATUS_MEMBER
This contains a Boolean of either the values 1, if the remote node for the
current configuration subrecord is a cluster member, or a 0 if it is not a
member.
Data Type:
NUMERIC
Domains:
CFG
SCS_NODE_IS_VAXCFG_V_STATUS_VAXNODE
This contains a Boolean of either the values 1, if the remote node for the
current configuration subrecord is a VAX, or a 0 if it is not a VAX.
Data Type:
NUMERIC
Domains:
CFG
SCS_NODE_ON_CICFG_V_STATUS_CI
This contains a Boolean of either the values 1, if the remote node for the
current configuration subrecord is accessed over the CI, or a 0 if it is not.
Data Type:
NUMERIC
Domains:
CFG
SCS_NODE_ON_NICFG_V_STATUS_NI
This contains a Boolean of either the values 1, if the remote node for the
current configuration subrecord is accessed over the NI, or a 0 if it is not.
Data Type:
NUMERIC
Domains:
CFG
SCS_NODE_ON_RFCFG_V_STATUS_RF
This contains a Boolean of either the values 1, if the remote node for the
current configuration subrecord is accessed over an RF controller, or a 0 if it is
not.
Data Type:
NUMERIC
Domains:
CFG
Appendix C: Performance Manager Data Cells 497
Performance Manager Data Cells
SCS_PATHNAMECFG_A_PATH
This contains the device name string for the path over which the local node
has SCS communications with the remote node indicated by SCS_NODENAME
for the current configuration subrecord (e.g., PAA0 or PEA0).
Data Type:
STRING
Domains:
CFG
SEND_CREDIT_QUEUE_RATESCS_F_QCR_CNT
This contains the value representing the number of times per second that SCS
messages had to be queued on the local node that were destined for the
remote node indicated by SCS_NODENAME for the current configuration record
and interval.
Data Type:
NUMERIC
Domains:
CFG
SEND_CREDIT_QUEUE_TALLY (Derived)
This contains the sum of the values representing the number of times per
second that an SCS message had to be queued on the local node that was
destined for the remote node for all the current configuration subrecords which
were selected by the most recent CONFIGURATION_SCAN routine operation.
Data Type:
TALLY
Domains:
COM,CFG,CPU,DSK,FIL,LOC,PRO,TAP
Target Domains: CFG
SEQUENCED_MESSAGES_RECD_TALLY (Derived)
This contains the sum of the values representing the number of messages
received per second on the local node from the remote node for all the current
configuration subrecords which were selected by the most recent
CONFIGURATION_SCAN routine operation.
Data Type:
TALLY
Domains:
COM,CFG,CPU,DSK,FIL,LOC,PRO,TAP
Target Domains: CFG
SEQUENCED_MESSAGES_RECEIVEDSCS_F_MSGRCVD
SEQUENCED_MESSAGES_RECEIVED This contains the value representing the
number of messages received per second on the local node from the remote.
Data Type:
NUMERIC
498 Performance Manager Administrator Guide
Performance Manager Data Cells
Domains:
CFG
SEQUENCED_MESSAGES_SENTSCS_F_MSGSENT
This contains the value representing the number of messages sent per second
from the local node to the remote node for the current configuration record
and interval.
Data Type:
NUMERIC
Domains:
CFG
SEQUENCED_MESSAGES_SENT_TALLY (Derived)
This contains the sum of the values representing the number of messages sent
per second from the local node to the remote node for all the current
configuration subrecords which were selected by the most recent
CONFIGURATION_SCAN routine operation.
Data Type:
TALLY
Domains:
COM,CFG,CPU,DSK,FIL,LOC,PRO,TAP
Target Domains: CFG
SMALLEST_BLK_IN_NONPAGED_POOLMET_F_NP_MIN_BLOCK
This contains the number of bytes in the smallest block in non-paged pool for
the current interval for the local node.
Data Type:
NUMERIC
Domains:
COM,CFG,CPU,DSK,FIL,LOC,PRO,TAP
SMALLEST_BLK_IN_PAGED_POOLMET_F_PG_MIN_BLOCK
This contains the number of bytes the smallest block in paged pool for the
current interval for the local node.
Data Type:
NUMERIC
Domains:
COM,CFG,CPU,DSK,FIL,LOC,PRO,TAP
SMALL_BLKS_FREE_NONPAGED_POOLMET_F_NP_FREE_LEQU_32
This contains the number of free blocks less than or equal to 32 bytes in nonpaged pool for the current interval for the local node.
Data Type:
NUMERIC
Domains:
COM,CFG,CPU,DSK,FIL,LOC,PRO,TAP
Appendix C: Performance Manager Data Cells 499
Performance Manager Data Cells
SMALL_BLKS_FREE_PAGED_POOLMET_F_PG_FREE_LEQU_32S
This contains the number of free blocks less than or equal to 32 in paged pool
for the current interval for the local node.
Data Type:
NUMERIC
Domains:
COM,CFG,CPU,DSK,FIL,LOC,PRO,TAP
SOFT_FAULT_RATE (Derived)
Average number of soft pagefaults per second for the local node for the
current interval record.
Data Type:
NUMERIC
Domains:
COM,CFG,CPU,DSK,FIL,LOC,PRO,TAP
SOFT_FAULT_SCALING (Derived)
This contains a value representing scaling factor for the soft page fault rate for
the local node. The value is obtained from the threshold
TD_SOFT_FAULT_SCALING_n where n is the hardware model number of the
local node. By default, if the local node is a VAX 11-780, the value would be
1.0. The value of this data cell can be modified using a threshold construct.
Data Type:
NUMERIC
Domains:
COM,CFG,CPU,DSK,FIL,LOC,PRO,TAP
SPLIT_IO_RATEMET_F_SPLIT
Average split I/O rate per second for the local node for the current interval
record.
Data Type:
NUMERIC
Domains:
COM,CFG,CPU,DSK,FIL,LOC,PRO,TAP
SRPS_IN_LISTMET_F_SRP_MAX
This contains the total number of SRPs for the current interval for the local
node.
Data Type:
NUMERIC
Domains:
COM,CFG,CPU,DSK,FIL,LOC,PRO,TAP
500 Performance Manager Administrator Guide
Performance Manager Data Cells
SRPS_IN_USEMET_F_SRP_CNT
This contains the number of SRPs in use for the current interval for the local
node.
Data Type:
NUMERIC
Domains:
COM,CFG,CPU,DSK,FIL,LOC,PRO,TAP
SRP_EXPANSION_COUNT (Derived)
A count of the number of times that the number of small request packets
needed to be increased, for the local node for all of the intervals.
Data Type:
NUMERIC
Domains:
SUMMARY
SRP_MAXLEN (Derived)
The maximum size of the SRP list for the local node for all of the intervals.
Data Type:
NUMERIC
Domains:
SUMMARY
STORAGE_MAP_CACHE_AR (Derived)
Attempt rate per second to the storage bit map cache for the local node for the
current interval record.
Data Type:
NUMERIC
Domains:
COM,CFG,CPU,DSK,FIL,LOC,PRO,TAP
STORAGE_MAP_CACHE_HR (Derived)
Hit ratio to the storage bit map cache for the local node for the current interval
record. Calculated by dividing the number of storage bit map cache hits by the
number of storage bit map cache attempts (hits + misses), times 100.
Data Type:
NUMERIC
Domains:
COM,CFG,CPU,DSK,FIL,LOC,PRO,TAP
SUPERMET_F_SUPER
Average percentage of CPU time spent in Supervisor mode for all processors in
the local node for the current interval record.
Data Type:
NUMERIC
Domains:
COM,CFG,CPU,DSK,FIL,LOC,PRO,TAP
Appendix C: Performance Manager Data Cells 501
Performance Manager Data Cells
SWAPPER_TRIMMING_TOO_SEVERE (Derived)
This contains a Boolean value representing severe swapper trimming on the
local node for the current interval.
Data Type:
NUMERIC
Domains:
COM,CFG,CPU,DSK,FIL,LOC,PRO,TAP
SWAP_BUSYMET_F_SPMSWPBUSY
Percentage of time that the Swapper was busy for the local node for the
current interval record.
Data Type:
NUMERIC
Domains:
COM,CFG,CPU,DSK,FIL,LOC,PRO,TAP
SWAP_WAITMET_F_SPMSWAPWAIT
Percentage of time that the CPU was idle and at least one disk device had
swapping I/O in progress for the local node for the current interval record.
Data Type:
NUMERIC
Domains:
COM,CFG,CPU,DSK,FIL,LOC,PRO,TAP
SYSGEN_ACP_DINDXCACHEPAR_F_ACP_DINDXCACHE
The value of the SYSGEN parameter ACP_DINDXCACHE which controls the size
(blocks) of the directory index cache and the number of buffers used on a
cache-wide basis, for the local node for the current interval record in LOCAL
domain, and for the local node for the last interval record in SUMMARY
domain.
Data Type:
NUMERIC
Domains:
COM,CFG,CPU,DSK,FIL,LOC,PRO,SUM,TAP
SYSGEN_ACP_DIRCACHEPAR_F_ACP_DIRCACHE
The value of the SYSGEN parameter ACP_DIRCACHE which sets the number of
pages (blocks) for caching directory blocks, for the local node for the current
interval record in LOCAL domain, and for the local node for the last interval
record in SUMMARY domain.
Data Type:
NUMERIC
Domains:
COM,CFG,CPU,DSK,FIL,LOC,PRO,SUM,TAP
502 Performance Manager Administrator Guide
Performance Manager Data Cells
SYSGEN_ACP_EXTCACHEPAR_F_ACP_EXTCACHE
The value of the SYSGEN parameter ACP_EXTCACHE which sets the number of
entries in the extent cache, for the local node for the current interval record in
LOCAL domain, and for the local node for the last interval record in SUMMARY
domain.
Data Type:
NUMERIC
Domains:
COM,CFG,CPU,DSK,FIL,LOC,PRO,SUM,TAP
SYSGEN_ACP_EXTLIMITPAR_F_ACP_EXTLIMIT
The value of the SYSGEN parameter ACP_EXTLIMIT which specifies the
maximum amount of free space to which the extent cache can point,
expressed in thousandths of the currently available free blocks on the disk, for
the local node for the current interval record in LOCAL domain, and for the
local node for the last interval record in SUMMARY domain.
Data Type:
NUMERIC
Domains:
COM,CFG,CPU,DSK,FIL,LOC,PRO,SUM,TAP
SYSGEN_ACP_FIDCACHEPAR_F_ACP_FIDCACHE
The value of the SYSGEN parameter ACP_FIDCACHE which sets the number of
file identification slots cached, for the local node for the current interval record
in LOCAL domain, and for the local node for the last interval record in
SUMMARY domain.
Data Type:
NUMERIC
Domains:
COM,CFG,CPU,DSK,FIL,LOC,PRO,SUM,TAP
SYSGEN_ACP_HDRCACHEPAR_F_ACP_HDRCACHE
The value of the SYSGEN parameter ACP_HDRCACHE which sets the number
of pages (blocks) for caching file header blocks, for the local node for the
current interval record in LOCAL domain, and for the local node for the last
interval record in SUMMARY domain.
Data Type:
NUMERIC
Domains:
COM,CFG,CPU,DSK,FIL,LOC,PRO,SUM,TAP
SYSGEN_ACP_MAPCACHEPAR_F_ACP_MAPCACHE
The value of the SYSGEN parameter ACP_MAPCACHE which sets the number of
pages (blocks) for caching index file bit map blocks, for the local node for the
current interval record in LOCAL domain, and for the local node for the last
interval record in SUMMARY domain.
Data Type:
NUMERIC
Appendix C: Performance Manager Data Cells 503
Performance Manager Data Cells
Domains:
COM,CFG,CPU,DSK,FIL,LOC,PRO,SUM,TAP
SYSGEN_ACP_QUOCACHEPAR_F_ACP_QUOCACHE
The value of the SYSGEN parameter ACP_QUOCACHE which sets the number
of quota file entries cached, for the local node for the current interval record in
LOCAL domain, and for the local node for the last interval record in SUMMARY
domain.
Data Type:
NUMERIC
Domains:
COM,CFG,CPU,DSK,FIL,LOC,PRO,SUM,TAP
SYSGEN_ACP_WORKSETPAR_F_ACP_WORKSET
The value of the SYSGEN parameter ACP_WORKSET which sets the default
size (pagelets) of a working set for an ACP, for the local node for the current
interval record in LOCAL domain, and for the local node for the last interval
record in SUMMARY domain.
Data Type:
NUMERIC
Domains:
COM,CFG,CPU,DSK,FIL,LOC,PRO,SUM,TAP
SYSGEN_AWSMINPAR_F_AWSMIN
The value of the SYSGEN parameter AWSMIN which establishes the lowest
number of pages (pagelets) to which a working set limit can be decreased by
automatic working set adjustment, for the local node for the current interval
record in LOCAL domain, and for the local node for the last interval record in
SUMMARY domain.
Data Type:
NUMERIC
Domains:
COM,CFG,CPU,DSK,FIL,LOC,PRO,SUM,TAP
SYSGEN_AWSTIMEPAR_F_AWSTIME
The value of the SYSGEN parameter AWSTIME which specifies the minimum
amount of processor time that must elapse for the system to collect a
significant sample of a working set's page fault rate, for the local node for the
current interval record in LOCAL domain, and for the local node for the last
interval record in SUMMARY domain.
Data Type:
NUMERIC
Domains:
COM,CFG,CPU,DSK,FIL,LOC,PRO,SUM,TAP
504 Performance Manager Administrator Guide
Performance Manager Data Cells
SYSGEN_BALSETCNTPAR_F_BALSETCNT
The value of the SYSGEN parameter BALSETCNT which is the number of
working sets which determines the maximum number of processes that can be
concurrently resident for the current interval for the local node.
Data Type:
NUMERIC
Domains:
COM,CFG,CPU,DSK,FIL,LOC,PRO,SUM,TAP
SYSGEN_BORROWLIMPAR_F_BORROWLIM
The value of the SYSGEN parameter BORROWLIM which defines the minimum
number of pages required on the free page list before the system will permit
process growth beyond the working set quota (WSQUOTA) for the process, for
the local node for the current interval record in LOCAL domain, and for the
local node for the last interval record in SUMMARY domain.
Data Type:
NUMERIC
Domains:
COM,CFG,CPU,DSK,FIL,LOC,PRO,SUM,TAP
SYSGEN_CACHE_STATEPAR_F_CACHE_STATE
The value of the SYSGEN parameter VCC_FLAGS in combination with the state
of the cluster and OpenVMS version, allow this data cell to reflect one of the
following states for the virtual IO Cache: (1) indicates the cache is enabled,
(2) a heterogeneous cluster disables the cache, (4) disabled cache, (8) in
determinant cache state; cannot decode data structures, (16) XFC is operating
in FULL mode, (32) XFC is operating in REDUCED mode.
Data Type:
NUMERIC
Domains:
COM,CFG,CPU,DSK,FIL,LOC,PRO,SUM,TAP
SYSGEN_DEADLOCK_WAITPAR_F_DEADLOCK_WAIT
The value of the SYSGEN parameter DEADLOCK_WAIT which defines the
number of seconds that a lock request must wait before the system initiates a
deadlock search on behalf of that lock, for the local node for the current
interval record in LOCAL domain, and for the local node for the last interval
record in SUMMARY domain.
Data Type:
NUMERIC
Domains:
COM,CFG,CPU,DSK,FIL,LOC,PRO,SUM,TAP
SYSGEN_DEFPRIPAR_F_DEFPRI
The value of the SYSGEN parameter DEFPRI which is the default priority for
job initiations for the current interval for the local node.
Data Type:
NUMERIC
Appendix C: Performance Manager Data Cells 505
Performance Manager Data Cells
Domains:
COM,CFG,CPU,DSK,FIL,LOC,PRO,SUM,TAP
SYSGEN_DORMANTWAITPAR_F_DORMANTWAIT
The value of the SYSGEN parameter DORMANTWAIT which indicates the
number of seconds that may elapse without a significant event before the
system treats a low priority computable process as a dormant process for
scheduling purposes for the current interval for the local node.
Data Type:
NUMERIC
Domains:
COM,CFG,CPU,DSK,FIL,LOC,PRO,SUM,TAP
SYSGEN_FREEGOALPAR_F_FREEGOAL
The value of the SYSGEN parameter FREEGOAL which establishes the number
of pages that you want to reestablish on the free page list following a system
memory shortage, for the local node for the current interval record in LOCAL
domain, and for the local node for the last interval record in SUMMARY
domain.
Data Type:
NUMERIC
Domains:
COM,CFG,CPU,DSK,FIL,LOC,PRO,SUM,TAP
SYSGEN_FREELIMPAR_F_FREELIM
The value of the SYSGEN parameter FREELIM which sets the minimum number
of pages that must be on the free page list, for the local node for the current
interval record in LOCAL domain, and for the local node for the last interval
record in SUMMARY domain.
Data Type:
NUMERIC
Domains:
COM,CFG,CPU,DSK,FIL,LOC,PRO,SUM,TAP
SYSGEN_GBLPAGEPSPAR_F_GBLPAGES
The value of the SYSGEN parameter GBLPAGES which is the global page table
entry count which establishes the size of the global page table and the limit for
the total number of global pages that can be created for the current interval
for the local node.
Data Type:
NUMERIC
Domains:
COM,CFG,CPU,DSK,FIL,LOC,PRO,SUM,TAP
506 Performance Manager Administrator Guide
Performance Manager Data Cells
SYSGEN_GBLSECTIONPSPAR_F_GBLSECTIONS
The value of the SYSGEN parameter GBLSECTIONS which sets the number of
global section descriptors allocated in the system header at bootstrap time, for
the local node for the current interval record in LOCAL domain, and for the
local node for the last interval record in SUMMARY domain.
Data Type:
NUMERIC
Domains:
COM,CFG,CPU,DSK,FIL,LOC,PRO,SUM,TAP
SYSGEN_GROWLIMPAR_F_GROWLIM
The value of the SYSGEN parameter GROWLIM which sets the number of
pages that the system must have on the free page list so that a process can
add a page to its working set when it is above quota, for the local node for the
current interval record in LOCAL domain, and for the local node for the last
interval record in SUMMARY domain.
Data Type:
NUMERIC
Domains:
COM,CFG,CPU,DSK,FIL,LOC,PRO,SUM,TAP
SYSGEN_IOTAPAR_F_IOTA
The value of the SYSGEN parameter IOTA which sets the I/O time allowance
(in 10 millisecond units) used to charge the current residence quantum for
each voluntary wait, for the local node for the current interval record in LOCAL
domain, and for the local node for the last interval record in SUMMARY
domain.
Data Type:
NUMERIC
Domains:
COM,CFG,CPU,DSK,FIL,LOC,PRO,SUM,TAP
SYSGEN_IRPCOUNTPAR_F_IRPCOUNT
The value of the SYSGEN parameter IRPCOUNT which sets the number of preallocated intermediate request packets, for the local node for the current
interval record in LOCAL domain, and for the local node for the last interval
record in SUMMARY domain.
Data Type:
NUMERIC
Domains:
COM,CFG,CPU,DSK,FIL,LOC,PRO,SUM,TAP
SYSGEN_IRPCOUNTVPAR_F_IRPCOUNTV
The value of the SYSGEN parameter IRPCOUNTV which is the virtual IRP count
which is the number of intermediate request packets to which the IRP list may
be extended for the current interval for the local node.
Data Type:
NUMERIC
Appendix C: Performance Manager Data Cells 507
Performance Manager Data Cells
Domains:
COM,CFG,CPU,DSK,FIL,LOC,PRO,SUM,TAP
SYSGEN_LCKMGR_MODEPAR_F_LCKMGR_MODE
The value of the SYSGEN parameter LCKMGR_MODE, which controls the use of
the Dedicated CPU Lock Manager, for the local node for the current interval
record in LOCAL domain, and for the local node for the last interval record in
SUMMARY domain.
Data Type:
NUMERIC
Domains:
COM,CFG,CPU,DSK,FIL,LOC,PRO,SUM,TAP
SYSGEN_LOAD_SYS_IMAGEPSPAR_F_LOAD_SYS_IMAGES
The value of the SYSGEN parameter LOAD_SYS_IMAGES, which controls the
loading of system images described in the system image data file
VMS$SYSTEM_IMAGES, for the local node for the current interval record in
LOCAL domain, and for the local node for the last interval record in SUMMARY
domain.
Data Type:
NUMERIC
Domains:
COM,CFG,CPU,DSK,FIL,LOC,PRO,SUM,TAP
SYSGEN_LOCKDIRWTPAR_F_LOCKDIRWT
The value of the SYSGEN parameter LOCKDIRWT which is the lock manager
directory system weight which determines the portion of the lock manager
directory which will be handled by this system for the current interval for the
local node.
Data Type:
NUMERIC
Domains:
COM,CFG,CPU,DSK,FIL,LOC,PRO,SUM,TAP
SYSGEN_LOCKIDTBLPAR_F_LOCKIDTBL
The value of the SYSGEN parameter LOCKIDTBL which sets the initial number
of entries in the system Lock ID table and defines the amount by which the
Lock ID table is extended whenever the system runs out of locks, for the local
node for the current interval record in LOCAL domain, and for the local node
for the last interval record in SUMMARY domain.
Data Type:
NUMERIC
Domains:
COM,CFG,CPU,DSK,FIL,LOC,PRO,SUM,TAP
508 Performance Manager Administrator Guide
Performance Manager Data Cells
SYSGEN_LONGWAITPAR_F_LONGWAIT
The value of the SYSGEN parameter LONGWAIT that defines how much real
time (in seconds) must elapse before the swapper considers a process to be
temporarily idle. This applies to the local node for the current interval record in
LOCAL domain, and for the local node for the last interval record in SUMMARY
domain.
Data Type:
NUMERIC
Domains:
COM,CFG,CPU,DSK,FIL,LOC,PRO,SUM,TAP
SYSGEN_LRPCOUNTPAR_F_LRPCOUNT
The value of the SYSGEN parameter LRPCOUNT which sets the number of preallocated large request packets, for the local node for the current interval
record in LOCAL domain, and for the local node for the last interval record in
SUMMARY domain.
Data Type:
NUMERIC
Domains:
COM,CFG,CPU,DSK,FIL,LOC,PRO,SUM,TAP
SYSGEN_LRPCOUNTVPAR_F_LRPCOUNTV
The value of the SYSGEN parameter LRPCOUNTV which establishes the upper
limit to which LRPCOUNT can be automatically increased by the system, for
the local node for the current interval record in LOCAL domain, and for the
local node for the last interval record in SUMMARY domain.
Data Type:
NUMERIC
Domains:
COM,CFG,CPU,DSK,FIL,LOC,PRO,SUM,TAP
SYSGEN_LRPSIZEPAR_F_LRPSIZE
The value of the SYSGEN parameter LRPSIZE which indicates the size (in
bytes) of the large request packets, for the local node for the current interval
record in LOCAL domain, and for the local node for the last interval record in
SUMMARY domain.
Data Type:
NUMERIC
Domains:
COM,CFG,CPU,DSK,FIL,LOC,PRO,SUM,TAP
SYSGEN_MAXPROCESSCNTPAR_F_MAXPROCESSCNT
The value of the SYSGEN parameter MAXPROCESSCNT which is the maximum
number of processes allowed on the system for the current interval for the
local node.
Data Type:
NUMERIC
Appendix C: Performance Manager Data Cells 509
Performance Manager Data Cells
Domains:
COM,CFG,CPU,DSK,FIL,LOC,PRO,SUM,TAP
SYSGEN_MINWSCNTPAR_F_MINWSCNT
The value of the SYSGEN parameter MINWSCNT which is the minimum
working set size - the minimum number of fluid pages not locked in a working
set required for the execution of a process for the current interval for the local
node.
Data Type:
NUMERIC
Domains:
COM,CFG,CPU,DSK,FIL,LOC,PRO,SUM,TAP
SYSGEN_MMG_CTLFLAGPSPAR_F_CTLFLAGS
The value of the SYSGEN parameter MMG_CTLFLAGS which sets the target
system memory management control settings, for the local node for the
current interval record in LOCAL domain, and for the local node for the last
interval record in SUMMARY domain.
Data Type:
NUMERIC
Domains:
COM,CFG,CPU,DSK,FIL,LOC,PRO,SUM,TAP
SYSGEN_MPW_HILIMITPAR_F_MPW_HILIMIT
The value of the SYSGEN parameter MPW_HILIMIT which sets un upper limit
for the modified page list, for the local node for the local node for the current
interval record in LOCAL domain, and for the local node for the last interval
record in SUMMARY domain.
Data Type:
NUMERIC
Domains:
COM,CFG,CPU,DSK,FIL,LOC,PRO,SUM,TAP
SYSGEN_MPW_LOLIMITPAR_F_MPW_LOLIMIT
The value of the SYSGEN parameter MPW_LOLIMIT which sets the lower limit
for the modified page list, for the local node for the current interval record in
LOCAL domain, and for the local node for the last interval record in SUMMARY
domain.
Data Type:
NUMERIC
Domains:
COM,CFG,CPU,DSK,FIL,LOC,PRO,SUM,TAP
510 Performance Manager Administrator Guide
Performance Manager Data Cells
SYSGEN_MPW_THRESHPAR_F_MPW_THRESH
The value of the SYSGEN parameter MPW_THRESH which sets the lower bound
of pages that must exist on the modified page list before the swapper writes
this list to acquire free pages, for the local node for the current interval record
in LOCAL domain, and for the local node for the last interval record in
SUMMARY domain.
Data Type:
NUMERIC
Domains:
COM,CFG,CPU,DSK,FIL,LOC,PRO,SUM,TAP
SYSGEN_MPW_WAITLIMITPAR_F_MPW_WAITLIMIT
The value of the SYSGEN parameter MPW_WAITLIMIT which sets the number
of pages on the modified page list that will cause a process to wait until the
next time the modified page writer writes the modified list, for the local node
for the current interval record in LOCAL domain, and for the local node for the
last interval record in SUMMARY domain.
Data Type:
NUMERIC
Domains:
COM,CFG,CPU,DSK,FIL,LOC,PRO,SUM,TAP
SYSGEN_MPW_WRTCLUSTERPAR_F_MPW_WRTCLUSTER
The value of the SYSGEN parameter MPW_WRTCLUSTER which sets the
number of pages to be written during one I/O operation from the modified
page list to the page file or a section file, for the local node for the current
interval record in LOCAL domain, and for the local node for the last interval
record in SUMMARY domain.
Data Type:
NUMERIC
Domains:
COM,CFG,CPU,DSK,FIL,LOC,PRO,SUM,TAP
SYSGEN_MULTIPROCESSINGPAR_F_MULTIPROC
The value of the SYSGEN parameter MULTIPROCESSING which enables fullchecking synchronization for the local node for the current interval record in
LOCAL domain, and for the local node for the last interval record in SUMMARY
domain.
Data Type:
NUMERIC
Domains:
COM,CFG,CPU,DSK,FIL,LOC,PRO,SUM,TAP
Appendix C: Performance Manager Data Cells 511
Performance Manager Data Cells
SYSGEN_MULTITHREADPAR_F_MULTITHREAD
The value of the SYSGEN parameter MULTITHREAD, which controls the
availability of kernel threads functions, for the local node for the current
interval record in LOCAL domain, and for the local node for the last interval
record in SUMMARY domain.
Data Type:
NUMERIC
Domains:
COM,CFG,CPU,DSK,FIL,LOC,PRO,SUM,TAP
SYSGEN_NPAGEDYNPAR_F_NPAGEDYN
The value of the SYSGEN parameter NPAGEDYN which sets the size of
nonpaged dynamic pool in bytes, for the local node for the current interval
record in LOCAL domain, and for the local node for the last interval record in
SUMMARY domain.
Data Type:
NUMERIC
Domains:
COM,CFG,CPU,DSK,FIL,LOC,PRO,SUM,TAP
SYSGEN_NPAGEVIRPAR_F_NPAGEVIR
The value of the SYSGEN parameter NPAGEVIR which defines the maximum
size to which NPAGEDYN can be increased, for the local node for the current
interval record in LOCAL domain, and for the local node for the last interval
record in SUMMARY domain.
Data Type:
NUMERIC
Domains:
COM,CFG,CPU,DSK,FIL,LOC,PRO,SUM,TAP
SYSGEN_PAGEDYNPAR_F_PAGEDYN
The value of the SYSGEN parameter PAGEDYN which sets the size of the paged
dynamic pool in bytes, for the local node for the current interval record in
LOCAL domain, and for the local node for the last interval record in SUMMARY
domain.
Data Type:
NUMERIC
Domains:
COM,CFG,CPU,DSK,FIL,LOC,PRO,SUM,TAP
SYSGEN_PFCDEFAULTPAR_F_PFCDEFAULT
The value of the SYSGEN parameter PFCDEFAULT which sets the page fault
cluster size for the local node for the current interval record in LOCAL domain,
and for the local node for the last interval record in SUMMARY domain.
Data Type:
NUMERIC
Domains:
COM,CFG,CPU,DSK,FIL,LOC,PRO,SUM,TAP
512 Performance Manager Administrator Guide
Performance Manager Data Cells
SYSGEN_PFRATHPAR_F_PFRATH
The value of the SYSGEN parameter PFRATH which specifies the page fault
rate above which the limit of a working set is automatically increased, for the
local node for the current interval record in LOCAL domain, and for the local
node for the last interval record in SUMMARY domain.
Data Type:
NUMERIC
Domains:
COM,CFG,CPU,DSK,FIL,LOC,PRO,SUM,TAP
SYSGEN_PFRATLPAR_F_PFRATL
The value of the SYSGEN parameter PFRATL which specifies the page fault rate
below which the limit of a working set is automatically decreased, for the local
node for the current interval record in LOCAL domain, and for the local node
for the last interval record in SUMMARY domain.
Data Type:
NUMERIC
Domains:
COM,CFG,CPU,DSK,FIL,LOC,PRO,SUM,TAP
SYSGEN_PHYSICALPAGEPSPAR_F_PHYSICALPAGES
The value of the SYSGEN parameter PHYSICALPAGES which sets the maximum
number of physical pages to be used for the local node for the current interval
record in LOCAL domain, and for the local node for the last interval record in
SUMMARY domain.
Data Type:
NUMERIC
Domains:
COM,CFG,CPU,DSK,FIL,LOC,PRO,SUM,TAP
SYSGEN_PIXSCANPAR_F_PIXSCAN
The value of the SYSGEN parameter PIXSCAN which determines the maximum
number of processes to scan for priority boosting, for the local node for the
current interval record in LOCAL domain, and for the local node for the last
interval record in SUMMARY domain.
Data Type:
NUMERIC
Domains:
COM,CFG,CPU,DSK,FIL,LOC,PRO,SUM,TAP
SYSGEN_POOLCHECKPAR_F_POOLCHECK
The value of the SYSGEN parameter POOLCHECK which enables a reserved
debugging aid in locating problems within OpenVMS data structures by
verifying memory allocations and deallocations for the local node for the
current interval record in LOCAL domain, and for the local node for the last
interval record in SUMMARY domain.
Data Type:
NUMERIC
Appendix C: Performance Manager Data Cells 513
Performance Manager Data Cells
Domains:
COM,CFG,CPU,DSK,FIL,LOC,PRO,SUM,TAP
SYSGEN_PQL_DWSDEFAULTPAR_F_PQL_DWSDEFAULT
The value of the SYSGEN parameter PQL_DWSDEFAULT, which sets the default
working set size for a process created by the Create Process ($CREPRC)
system service or the DCL command RUN (Process), for the local node for the
current interval record in LOCAL domain, and for the local node for the last
interval record in SUMMARY domain.
Data Type:
NUMERIC
Domains:
COM,CFG,CPU,DSK,FIL,LOC,PRO,SUM,TAP
SYSGEN_PQL_DWSEXTENTPAR_F_PQL_DWSEXTENT
The value of the SYSGEN parameter PQL_DWSEXTENT, which sets the default
working set extent for a process created by the Create Process ($CREPRC)
system service or the DCL command RUN (Process), for the local node for the
current interval record in LOCAL domain, and for the local node for the last
interval record in SUMMARY domain.
Data Type:
NUMERIC
Domains:
COM,CFG,CPU,DSK,FIL,LOC,PRO,SUM,TAP
SYSGEN_PQL_DWSQUOTAPAR_F_PQL_DWSQUOTA
The value of the SYSGEN parameter PQL_DWSQUOTA, sets the default
working set quota for a process created by the Create Process ($CREPRC)
system service or the DCL command RUN (Process), for the local node for the
current interval record in LOCAL domain, and for the local node for the last
interval record in SUMMARY domain.
Data Type:
NUMERIC
Domains:
COM,CFG,CPU,DSK,FIL,LOC,PRO,SUM,TAP
SYSGEN_PQL_MWSDEFAULTPAR_F_PQL_MWSDEFAULT
The value of the SYSGEN parameter PQL_MWSDEFAULT, which sets the
minimum default working set size for a process created by the Create Process
($CREPRC) system service or the DCL command RUN (Process), for the local
node for the current interval record in LOCAL domain, and for the local node
for the last interval record in SUMMARY domain.
Data Type:
NUMERIC
Domains:
COM,CFG,CPU,DSK,FIL,LOC,PRO,SUM,TAP
514 Performance Manager Administrator Guide
Performance Manager Data Cells
SYSGEN_PQL_MWSEXTENTPAR_F_PQL_MWSEXTENT
The value of the SYSGEN parameter PQL_MWSEXTENT, which sets the
minimum working set extent for a process created by the Create Process
($CREPRC) system service or the DCL command RUN (Process), for the local
node for the current interval record in LOCAL domain, and for the local node
for the last interval record in SUMMARY domain.
Data Type:
NUMERIC
Domains:
COM,CFG,CPU,DSK,FIL,LOC,PRO,SUM,TAP
SYSGEN_PQL_MWSQUOTAPAR_F_PQL_MWSQUOTA
The value of the SYSGEN parameter PQL_MWSQUOTA, which sets the
minimum working set quota for a process created by the Create Process
($CREPRC) system service or the DCL command RUN (Process), for the local
node for the current interval record in LOCAL domain, and for the local node
for the last interval record in SUMMARY domain.
Data Type:
NUMERIC
Domains:
COM,CFG,CPU,DSK,FIL,LOC,PRO,SUM,TAP
SYSGEN_QUANTUMPAR_F_QUANTUM
The value of the SYSGEN parameter QUANTUM which defines the maximum
amount of processor time a process can receive before control passes to
another process of equal priority that is ready to compute, for the local node
for the current interval record in LOCAL domain, and for the local node for the
last interval record in SUMMARY domain.
Data Type:
NUMERIC
Domains:
COM,CFG,CPU,DSK,FIL,LOC,PRO,SUM,TAP
SYSGEN_RESHASHTBLPAR_F_RESHASHTBL
The value of the SYSGEN parameter RESHASHTBL which defines the number
of entries in the lock management resource name hash table, for the local
node for the current interval record in LOCAL domain, and for the local node
for the last interval record in SUMMARY domain.
Data Type:
NUMERIC
Domains:
COM,CFG,CPU,DSK,FIL,LOC,PRO,SUM,TAP
Appendix C: Performance Manager Data Cells 515
Performance Manager Data Cells
SYSGEN_SMP_CPUPSPAR_F_SMP_CPUS
The value of the SYSGEN parameter SMP_CPUS, which sets which secondary
processors, if available, are to be booted into the multiprocessing system at
boot time, for the local node for the current interval record in LOCAL domain,
and for the local node for the last interval record in SUMMARY domain.
Data Type:
NUMERIC
Domains:
COM,CFG,CPU,DSK,FIL,LOC,PRO,SUM,TAP
SYSGEN_SPTREQPAR_F_SPTREQ
The value of the SYSGEN parameter SPTREQ which sets the number of system
page table (SPT) entries required for mapping the OpenVMS Executive image,
RMS image, SYSMSG.EXE file, multiport memory structures, and other
OpenVMS components, for the local node for the current interval record in
LOCAL domain, and for the local node for the last interval record in SUMMARY
domain.
Data Type:
NUMERIC
Domains:
COM,CFG,CPU,DSK,FIL,LOC,PRO,SUM,TAP
SYSGEN_SRPCOUNTPAR_F_SRPCOUNT
The value of the SYSGEN parameter SRPCOUNT which sets the number of preallocated small request packets, for the local node for the current interval
record in LOCAL domain, and for the local node for the last interval record in
SUMMARY domain.
Data Type:
NUMERIC
Data Type:
NUMERIC
Domains:
COM,CFG,CPU,DSK,FIL,LOC,PRO,SUM,TAP
SYSGEN_SRPCOUNTVPAR_F_SRPCOUNTV
The value of the SYSGEN parameter SRPCOUNTV which establishes the upper
limit to which SRPCOUNT can be automatically increased by the system, for
the local node for the current interval record in LOCAL domain, and for the
local node for the last interval record in SUMMARY domain.
Data Type:
NUMERIC
Domains:
COM,CFG,CPU,DSK,FIL,LOC,PRO,SUM,TAP
516 Performance Manager Administrator Guide
Performance Manager Data Cells
SYSGEN_SRPSIZEPAR_F_SRPSIZE
The value of the SYSGEN parameter SRPSIZE which indicates the size (in
bytes) of the small request packets, for the local node for the current interval
record in LOCAL domain, and for the local node for the last interval record in
SUMMARY domain.
Data Type:
NUMERIC
Domains:
COM,CFG,CPU,DSK,FIL,LOC,PRO,SUM,TAP
SYSGEN_SWPALLOCINCPAR_F_SWPALLOCINC
The value of the SYSGEN parameter SWPALLOCINC which sets the swap file
allocation increment value (in blocks), used to backup swap file allocation
space in the swap or page file, for the local node for the current interval record
in LOCAL domain, and for the local node for the last interval record in
SUMMARY domain.
Data Type:
NUMERIC
Domains:
COM,CFG,CPU,DSK,FIL,LOC,PRO,SUM,TAP
SYSGEN_SWPOUTPGCNTPAR_F_SWPOUTPGCNT
The value of the SYSGEN parameter SWPOUTPGCNT which defines the
minimum number of pages (pagelets) to which the swapper should attempt to
reduce a process before swapping it out, for the local node for the current
interval record in LOCAL domain, and for the local node for the last interval
record in SUMMARY domain.
Data Type:
NUMERIC
Domains:
COM,CFG,CPU,DSK,FIL,LOC,PRO,SUM,TAP
SYSGEN_SWPRATEPAR_F_SWPRATE
The value of the SYSGEN parameter SWPRATE which sets the swapping rate
and serves to limit the consumption of disk bandwidth by swapping, for the
local node for the current interval record in LOCAL domain, and for the local
node for the last interval record in SUMMARY domain.
Data Type:
NUMERIC
Domains:
COM,CFG,CPU,DSK,FIL,LOC,PRO,SUM,TAP
Appendix C: Performance Manager Data Cells 517
Performance Manager Data Cells
SYSGEN_SYSMWCNTPAR_F_SYSMWCNT
The value of the SYSGEN parameter SYSMWCNT which is the system working
set count which establishes the number of pages for the working set
containing the currently resident pages of pageable system space for the
current interval for the local node.
Data Type:
NUMERIC
Domains:
COM,CFG,CPU,DSK,FIL,LOC,PRO,SUM,TAP
SYSGEN_VBSS_ENABLEPAR_F_VBSSENA
The value of the SYSGEN parameter VBSS_ENABLE which determines whether
Virtual Balance Slots (available with OpenVMS V6.0 and above) are enabled
for the local node for the current interval record in LOCAL domain, and for the
local node for the last interval record in SUMMARY domain.
Data Type:
NUMERIC
Domains:
COM,CFG,CPU,DSK,FIL,LOC,PRO,SUM,TAP
SYSGEN_WSDECPAR_F_WSDEC
The value of the SYSGEN parameter WSDEC that specifies the number of
pages (pagelets) by which the limit of a working set is automatically decreased
at each adjustment interval. This value applies to the local node for the
current interval record in LOCAL domain, and for the local node for the last
interval record in SUMMARY domain.
Data Type:
NUMERIC
Domains:
COM,CFG,CPU,DSK,FIL,LOC,PRO,SUM,TAP
SYSGEN_WSINCPAR_F_WSINC
The value of the SYSGEN parameter WSINC which specifies the number of
pages (pagelets) by which the limit of a working set is automatically increased
at each adjustment interval, for the local node for the current interval record
in LOCAL domain, and for the local node for the last interval record in
SUMMARY domain.
Data Type:
NUMERIC
Domains:
COM,CFG,CPU,DSK,FIL,LOC,PRO,SUM,TAP
518 Performance Manager Administrator Guide
Performance Manager Data Cells
SYSGEN_WSMAXPAR_F_WSMAX
The value of the SYSGEN parameter WSMAX which is the maximum size of the
process working set which determines the system wide maximum size of a
process working set regardless of process quota for the current interval for the
local node.
Data Type:
NUMERIC
Domains:
COM,CFG,CPU,DSK,FIL,LOC,PRO,SUM,TAP
SYSTEM_FAULT_RATEMET_F_SYSFAULTS
Average number of system page faults per second for the local node for the
current interval record.
Data Type:
NUMERIC
Domains:
COM,CFG,CPU,DSK,FIL,LOC,PRO,TAP
TAPE_CONTROLLERMAG_A_CTLR_NAME
This contains hardware controller type string of the tape drive for the current
tape record in TAPE domain (e.g., MUA).
Data Type:
STRING
Domains:
TAP
TAPE_DEVNAMEMAG_A_DEVNAME
This contains the OpenVMS device name string for the current tape record in
TAPE domain (e.g., $2$MUA1).
Data Type:
STRING
Domains:
TAP
TAPE_ERROR_COUNTMAG_F_ERRCNT
This contains the number of errors accumulated over the current interval for
the current tape record in TAPE domain.
Data Type:
NUMERIC
Domains:
TAP
Appendix C: Performance Manager Data Cells 519
Performance Manager Data Cells
TAPE_ERROR_TALLY (Derived)
This contains the sum of the ERROR counts for tape drives for all the tape
subrecords which were selected by the most recent TAPE_SCAN routine
operation.
Data Type:
TALLY
Domains:
COM,CFG,CPU,DSK,FIL,LOC,PRO,TAP
Target Domains: TAP
TAPE_IO_RATEMAG_F_OPCNT
This contains the number of I/O's per second for the current tape record in
TAPE domain.
Data Type:
NUMERIC
Domains:
TAP
TAPE_IO_TALLY (Derived)
This contains the sum of all I/O rates to tape drives for all the tape subrecords
which were selected by the most recent TAPE_SCAN routine operation.
Data Type:
TALLY
Domains:
COM,CFG,CPU,DSK,FIL,LOC,PRO,TAP
Target Domains: TAP
TAPE_SCAN (Derived)
Provides the count of tape subrecords for which the specified rule condition is
true. The condition will be evaluated for each tape subrecord.
Data Type:
SCAN
Domains:
COM,CFG,CPU,DSK,FIL,LOC,PRO,TAP
Target Domains: TAP
TAPE_SERVER_HWTYPEMAG_A_HWTYPE
This contains hardware type string of the node which serves the tape drive to
the cluster, for the current tape record in TAPE domain.
Data Type:
STRING
Domains:
TAP
520 Performance Manager Administrator Guide
Performance Manager Data Cells
TAPE_SERVER_NODENAMEMAG_A_NODENAME
This contains nodename string of the node which serves the tape drive to the
cluster, for the current tape record in TAPE domain.
Data Type:
STRING
Domains:
TAP
TERMINAL_IO (Derived)
This contains a value representing the sum of terminal operations rate to all
communications terminals on the local node for the current interval.
Data Type:
NUMERIC
Domains:
COM,CFG,CPU,DSK,FIL,LOC,PRO,TAP
TICKER_IS_ON (Derived)
The value of the SYSGEN parameter MMG_CTLFLAGS has bit zero set for the
local node for the current interval record in LOCAL domain, and for the local
node for the last interval record in SUMMARY domain.
Data Type:
NUMERIC
Domains:
COM,CFG,CPU,DSK,FIL,LOC,PRO,SUM,TAP
TIME (Derived)
This contains the date and time associated with the current interval for either
the local node, or the cluster wide I/O data cells.
Data Type:
TIME
Domains:
COM,CFG,CLU,CPU,DSK,FIL,LOC,PRO,TAP
TOP_BDTW_SCS_NODE_X (Derived)
This contains an index pointing to the configuration subrecord, for the SCS
node with the most BDT waits on the local node for the current interval.
Data Type:
INDEX
Domains:
COM,CFG,CPU,DSK,FIL,LOC,PRO,TAP
Target Domains: CFG
TOP_BUFIO_PROCESS_X (Derived)
This contains an index pointing to the process subrecord that has the highest
buffered I/O operations rate on the local node for the current interval.
Data Type:
INDEX
Appendix C: Performance Manager Data Cells 521
Performance Manager Data Cells
Domains:
COM,CFG,CPU,DSK,FIL,LOC,PRO,TAP
Target Domains: PRO
TOP_COM_PROC_BPRI (Derived)
This contains a value representing the base priority of the process subrecord
with the most time in the COM state on the local node for the current interval.
Data Type:
NUMERIC
Domains:
COM,CFG,CPU,DSK,FIL,LOC,PRO,TAP
TOP_COM_PROC_BPRI_A (Derived)
This contains a value representing the base priority of the process subrecord
with the most time in the COM state. If PRIORITY_LOCKOUT is true (1.0), this
cell will contain the base priority of the process which is probably unable to
utilize the CPU because of a priority lockout, and pointed to by the cell
TOP_COM_PROC_X_A.
Data Type:
NUMERIC
Domains:
COM,CFG,CPU,DSK,FIL,LOC,PRO,TAP
TOP_COM_PROC_X (Derived)
This contains an index pointing to the process subrecord with the most time
spent in the scheduler computable state on the local node for the current
interval.
Data Type:
INDEX
Domains:
COM,CFG,CPU,DSK,FIL,LOC,PRO,TAP
Target Domains: PRO
TOP_COM_PROC_X_A (Derived)
This contains an index pointing to the process subrecord with the highest
percentage of time being computable. If PRIORITY_LOCKOUT is true (1.0), this
cell will point to the most computable process subrecord which has a lower
priority than the high priority process. This process is probably unable to
utilize the CPU because of a priority lockout.
Data Type:
INDEX
Domains:
COM,CFG,CPU,DSK,FIL,LOC,PRO,TAP
Target Domains: PRO
522 Performance Manager Administrator Guide
Performance Manager Data Cells
TOP_CPU_PROC_BPRI (Derived)
This contains a value representing the base priority of the process subrecord
with the highest CPU utilization on the local node for the current interval.
Data Type:
NUMERIC
Domains:
COM,CFG,CPU,DSK,FIL,LOC,PRO,TAP
TOP_CPU_PROC_CPU (Derived)
This contains a value representing the percent of CPU utilization of the process
with the highest CPU utilization on the local node for the current interval.
TOP_CPU_PROC_X indicates this process.
Data Type:
NUMERIC
Domains:
COM,CFG,CPU,DSK,FIL,LOC,PRO,TAP
TOP_CPU_PROC_X (Derived)
This contains an index pointing to a process subrecord whose process has the
highest CPU utilization on the local node for the current interval.
Data Type:
INDEX
Domains:
COM,CFG,CPU,DSK,FIL,LOC,PRO,TAP
Target Domains: PRO
TOP_CW_SCS_NODE_X (Derived)
This contains an index pointing to the configuration subrecord for the remote
SCS node for which the local node suffered the highest rate of credit waits for
the current interval.
Data Type:
INDEX
Domains:
COM,CFG,CPU,DSK,FIL,LOC,PRO,TAP
Target Domains: CFG
TOP_DIRIO_PROCESS_DIRIO (Derived)
This contains a value representing the highest direct I/O operations rate for a
process subrecord on the local node for the current interval.
Data Type:
NUMERIC
Domains:
COM,CFG,CPU,DSK,FIL,LOC,PRO,TAP
Appendix C: Performance Manager Data Cells 523
Performance Manager Data Cells
TOP_DIRIO_PROCESS_X (Derived)
This contains an index pointing to the process subrecord that has the highest
direct I/O operations rate on the local node for the current interval.
Data Type:
INDEX
Domains:
COM,CFG,CPU,DSK,FIL,LOC,PRO,TAP
Target Domains: PRO
TOP_DIRIO_PROC_TOPDSK_X (Derived)
This contains an index pointing to the disk record with the highest operations
rate for the process subrecord that has the highest direct I/O operations rate
on the local node for the current interval.
Data Type:
INDEX
Domains:
COM,CFG,CPU,DSK,FIL,LOC,PRO,TAP
Target Domains: DSK
TOP_DISKS_PROCESS_X (Derived)
This contains an index pointing to the process subrecord that has the highest
I/O operations rate to the highest I/O rate disk, on the local node for the
current interval.
Data Type:
INDEX
Domains:
COM,CFG,CPU,DSK,FIL,LOC,PRO,TAP
Target Domains: PRO
TOP_DSKIO_PROCESS_DSKIO (Derived)
This contains a value representing the highest disk I/O operations rate for a
process subrecord on the local node for the current interval.
Data Type:
NUMERIC
Domains:
COM,CFG,CPU,DSK,FIL,LOC,PRO,TAP
TOP_DSKIO_PROCESS_X (Derived)
This contains an index pointing to the process subrecord that has the highest
disk I/O operations rate on the local node for the current interval.
Data Type:
INDEX
Domains:
COM,CFG,CPU,DSK,FIL,LOC,PRO,TAP
Target Domains: PRO
524 Performance Manager Administrator Guide
Performance Manager Data Cells
TOP_DSKIO_PROC_TOPDSK_X (Derived)
This contains an index pointing to the disk record with the highest operations
rate for the process subrecord that has the highest disk I/O operations rate on
the local node for the current interval.
Data Type:
INDEX
Domains:
COM,CFG,CPU,DSK,FIL,LOC,PRO,TAP
Target Domains: DSK
TOP_HF_IMAGE_X (Derived)
This contains an index pointing to the process subrecord, whose image, has
the highest hard page fault rate of all process subrecords on the local node for
the current interval.
Data Type:
INDEX
Domains:
COM,CFG,CPU,DSK,FIL,LOC,PRO,TAP
Target Domains: PRO
TOP_HF_USER_X (Derived)
This contains an index pointing to the process subrecord, whose user has the
highest hard page fault rate of all process subrecords on the local node for the
current interval.
Data Type:
INDEX
Domains:
COM,CFG,CPU,DSK,FIL,LOC,PRO,TAP
Target Domains: PRO
TOP_QLEN_DISKS_PROCESS_X (Derived)
This contains an index pointing to the process subrecord that has the highest
I/O operations rate to the disk with the highest queue length, on the local
node for the current interval.
Data Type:
INDEX
Domains:
COM,CFG,CPU,DSK,FIL,LOC,PRO,TAP
Target Domains: PRO
TOTAL_FAULT_RATEMET_F_FAULTS
This contains a number representing the total page faults per second for the
local node for the current interval record.
Data Type:
NUMERIC
Appendix C: Performance Manager Data Cells 525
Performance Manager Data Cells
Domains:
COM,CFG,CPU,DSK,FIL,LOC,PRO,TAP
TOTAL_OF_WS_SIZES (Derived)
This contains the value representing the total number of pages
(PPGCNT+GPGCNT) that all processes are using on the local node for the
current interval.
Data Type:
NUMERIC
Domains:
COM,CFG,CPU,DSK,FIL,LOC,PRO,TAP
TRANSITION_FAULT_RATEMET_F_TRANSFLTS
Average number of global page faults per second for the local node for the
current interval record.
Data Type:
NUMERIC
Domains:
COM,CFG,CPU,DSK,FIL,LOC,PRO,TAP
TROLLER_IS_ON (Derived)
The value of the SYSGEN parameter MMG_CTLFLAGS has bit 1 set for the local
node for the current interval record in LOCAL domain, and for the local node
for the last interval record in SUMMARY domain.
Data Type:
NUMERIC
Domains:
COM,CFG,CPU,DSK,FIL,LOC,PRO,SUM,TAP
USERMET_F_USER
Average percentage of CPU time spent in User mode for all processors in the
local node for the current interval record.
Data Type:
NUMERIC
Domains:
COM,CFG,CPU,DSK,FIL,LOC,PRO,TAP
USER_NAMEPRO_A_USERNAME
This contains a string indicating the user name for which the current process
subrecord pertains on the local node for the current interval.
Data Type:
STRING
Domains:
PRO
526 Performance Manager Administrator Guide
Performance Manager Data Cells
VBS_INTSTKMET_F_VBSSCPUTICK
Average percentage of CPU time on the Interrupt Stack spent on behalf of VBS
(Virtual Balance Set) transitions only for all processors in the local node for the
current interval record.
Data Type:
NUMERIC
Domains:
COM,CFG,CPU,DSK,FIL,LOC,PRO,TAP
VMS543_OR_LATER (Derived)
This contains a one if the version of OpenVMS is V5.4-3 or later (zero if not)
for the local node for the current interval record in LOCAL domain, and for the
local node for the last interval record in SUMMARY domain.
Data Type:
NUMERIC
Domains:
COM,CFG,CPU,DSK,FIL,LOC,PRO,SUM,TAP
VMS60_OR_LATER (Derived)
This contains a one if the version of OpenVMS is V6.0 or later (zero if not) for
the local node for the current interval record in LOCAL domain, and for the
local node for the last interval record in SUMMARY domain.
Data Type:
NUMERIC
Domains:
COM,CFG,CPU,DSK,FIL,LOC,PRO,SUM,TAP
VMS732_OR_LATER (Derived)
This contains a one if the version is OpenVMS 7.3-2 or later (zero if not) for
the local node for the current interval record in LOCAL domain, and for the
local node for the last interval record in SUMMARY domain.
Data Type:
NUMERIC
Domains:
COM,CFG,CPU,DSK,FIL,LOC,PRO,SUM,TAP
VMS82_OR_LATER (Derived)
This contains a one if the version is OpenVMS 8.2 or later (zero if not) for the
local node for the current interval record in LOCAL domain, and for the local
node for the last interval record in SUMMARY domain.
Data Type:
NUMERIC
Domains:
COM,CFG,CPU,DSK,FIL,LOC,PRO,SUM,TAP
Appendix C: Performance Manager Data Cells 527
Performance Manager Data Cells
VMS83_OR_LATER (Derived)
This contains a one if the version is OpenVMS 8.3 or later (zero if not) for the
local node for the current interval record in LOCAL domain, and for the local
node for the last interval record in SUMMARY domain.
Data Type:
NUMERIC
Domains:
COM,CFG,CPU,DSK,FIL,LOC,PRO,SUM,TAP
VOLUME_NAMEDEV_A_VOLNAME
This contains a string indicating the volume label of the disk for which the
current disk subrecord pertains, in domain DISK.
Data Type:
STRING
Domains:
DSK
WINDOW_TURN_RATEMET_F_FCPTURN
Average window turn rate per second for the local node for the current interval
record.
Data Type:
NUMERIC
Domains:
COM,CFG,CPU,DSK,FIL,LOC,PRO,TAP
WORKING_SET_DEFAULTPRO_F_DFWSCNT
This contains a value representing the UAF parameter WSDEF of the current
process subrecord on the local node for the current interval.
Data Type:
NUMERIC
Domains:
PRO
WORKING_SET_DEFAULT_TALLY (Derived)
This contains the sum of the values representing the number of pages
allocated as working set defaults for all of the current process subrecords
which were selected by the most recent PROCESS_SCAN routine operation.
Data Type:
TALLY
Domains:
COM,CFG,CPU,DSK,FIL,LOC,PRO,TAP
Target Domains: PRO
528 Performance Manager Administrator Guide
Performance Manager Data Cells
WORKING_SET_EXTENTPRO_F_WSEXTENT
This contains a value representing the current working set extent of the
current process subrecord on the local node for the current interval.
Data Type:
NUMERIC
Domains:
PRO
WORKING_SET_EXTENT_TALLY (Derived)
This contains the sum of the values representing the number of pages
allocated as working set extents for all of the current process subrecords which
were selected by the most recent PROCESS_SCAN routine operation.
Data Type:
TALLY
Domains:
COM,CFG,CPU,DSK,FIL,LOC,PRO,TAP
Target Domains: PRO
WORKING_SET_FAULT_IO_RATEPRO_F_PGFLTIO
This contains a value representing the hard page fault rate per CPU second for
the current process subrecord on the local node for the current interval.
Data Type:
NUMERIC
Domains:
PRO
WORKING_SET_FAULT_IO_TALLY (Derived)
This contains the sum of the values representing the hard page fault rate per
CPU second for all of the current process subrecords which were selected by
the most recent PROCESS_SCAN routine operation.
Data Type:
TALLY
Domains:
COM,CFG,CPU,DSK,FIL,LOC,PRO,TAP
Target Domains: PRO
WORKING_SET_FAULT_RATEPRO_F_PAGEFLTS
This contains a value representing the soft page fault rate per CPU second for
the current process subrecord on the local node for the current interval.
Data Type:
NUMERIC
Domains:
PRO
Appendix C: Performance Manager Data Cells 529
Performance Manager Data Cells
WORKING_SET_FAULT_TALLY (Derived)
This contains the sum of the values representing the soft page fault rate per
CPU second for all of the current process subrecords which were selected by
the most recent PROCESS_SCAN routine operation.
Data Type:
TALLY
Domains:
COM,CFG,CPU,DSK,FIL,LOC,PRO,TAP
Target Domains: PRO
WORKING_SET_GLOBAL_PGSPRO_F_GPGCNT
This contains a value representing the number of physical global pages in the
current working set of the current process subrecord on the local node for the
current interval.
Data Type:
NUMERIC
Domains:
PRO
WORKING_SET_LISTPRO_F_WSSIZE
This contains a value representing the number of pages allowed in the current
working set of the current process subrecord on the local node for the current
interval.
Data Type:
NUMERIC
Domains:
PRO
WORKING_SET_LIST_TALLY (Derived)
This contains the sum of the values representing the number of total pages in
the working sets for all of the current process subrecords which were selected
by the most recent PROCESS_SCAN routine operation.
Data Type:
TALLY
Domains:
COM,CFG,CPU,DSK,FIL,LOC,PRO,TAP
Target Domains: PRO
WORKING_SET_PRIVATE_PGSPRO_F_PPGCNT
This contains a value representing the number of physical private pages in the
current working set of the current process subrecord on the local node for the
current interval.
Data Type:
NUMERIC
Domains:
PRO
530 Performance Manager Administrator Guide
Performance Manager Data Cells
WORKING_SET_QUOTAPRO_F_WSQUOTA
This contains a value representing the current working set quota of the current
process subrecord on the local node for the current interval.
Data Type:
NUMERIC
Domains:
PRO
WORKING_SET_QUOTA_TALLY (Derived)
This contains the sum of the values representing the number of pages
allocated as working set quotas for all of the current process subrecords which
were selected by the most recent PROCESS_SCAN routine operation.
Data Type:
TALLY
Domains:
COM,CFG,CPU,DSK,FIL,LOC,PRO,TAP
Target Domains: PRO
WORKLOAD_NAMEPRO_A_WORKLOAD
This contains a string indicating the workload name for which the current
process subrecord pertains on the local node. This filled in when the data is
supplied from a history file, otherwise it is blank.
Data Type:
STRING
Domains:
PRO
WRITE_IN_PROGRESS_FAULT_RATEMET_F_WRTINPROG
Average number of write-in-progress page faults per second for the local node
for the current interval record.
Data Type:
NUMERIC
Domains:
COM,CFG,CPU,DSK,FIL,LOC,PRO,TAP
WS_DECREMENTING_NEEDED (Derived)
This contains a Boolean value detecting a condition warranting working set
decrementing on the local node for the current interval.
Data Type:
NUMERIC
Domains:
COM,CFG,CPU,DSK,FIL,LOC,PRO,TAP
Appendix C: Performance Manager Data Cells 531
Performance Manager Data Cells
WS_DECREMENTING_TOO_SEVERE (Derived)
This contains a Boolean value representing severe working set decrementing
on the local node for the current interval.
Data Type:
NUMERIC
Domains:
COM,CFG,CPU,DSK,FIL,LOC,PRO,TAP
XQP_ACCESS_LOCK_RATEMET_F_ACCLCK
Average XQP access lock rate per second for the local node for the current
interval record.
Data Type:
NUMERIC
Domains:
COM,CFG,CPU,DSK,FIL,LOC,PRO,TAP
XQP_ACCESS_LOCK_WAIT_RATEMET_F_XQPCACHEWAIT
Average XQP access lock wait rate per second for the local node for the
current interval record.
Data Type:
NUMERIC
Domains:
COM,CFG,CPU,DSK,FIL,LOC,PRO,TAP
XQP_CACHE_HIT_RATEMET_F_HIT
Average XQP cache hit rate per second for the local node for the current
interval record.
Data Type:
NUMERIC
Domains:
COM,CFG,CPU,DSK,FIL,LOC,PRO,TAP
XQP_CACHE_HIT_RATIO (Derived)
This contains a value representing the ratio of disk cache hits to misses on the
local node for the current interval.
Data Type:
NUMERIC
Domains:
COM,CFG,CPU,DSK,FIL,LOC,PRO,TAP
XQP_CACHE_MISSEDIO_RATE (Derived)
This contains a value representing the disk cache miss rate on the local node
for the current interval.
Data Type:
NUMERIC
Domains:
COM,CFG,CPU,DSK,FIL,LOC,PRO,TAP
532 Performance Manager Administrator Guide
Performance Manager Data Cells
XQP_VOL_AND_DIR_LOCK_WAIT_RATEMET_F_SYNCHWAIT
Average XQP directory and volume synchronization lock wait rate per second
for the local node for the current interval record.
Data Type:
NUMERIC
Domains:
COM,CFG,CPU,DSK,FIL,LOC,PRO,TAP
XQP_VOL_AND_DIR_SYNCH_LOCK_RATEMET_F_SYNCHLCK
Average XQP directory and volume synchronization lock rate per second for
the local node for the current interval record.
Data Type:
NUMERIC
Domains:
COM,CFG,CPU,DSK,FIL,LOC,PRO,TAP
XQP_VOL_SYNCH_LOCK_RATEMET_F_VOLLCK
Average XQP volume synchronization lock rate per second for the local node
for the current interval record.
Data Type:
NUMERIC
Domains:
COM,CFG,CPU,DSK,FIL,LOC,PRO,TAP
XQP_VOL_SYNCH_LOCK_WAIT_RATEMET_F_VOLWAIT
Average XQP volume synchronization lock wait rate per second for the local
node for the current interval record.
Data Type:
NUMERIC
Domains:
COM,CFG,CPU,DSK,FIL,LOC,PRO,TAP
Appendix C: Performance Manager Data Cells 533
Appendix D: Estimate Virtual Memory
Needs
This appendix helps you to estimate the virtual memory requirements for the
Performance Manager when performing the following tasks:
■
Generating Reports and Graphs using the DCL user interface
■
Selecting daily or history data using the Command Mode interface
■
Selecting daily or history data using the DECwindows interface
The virtual address space that a process may use is governed by smallest of
either the process quota PGFLQUOTA, or the SYSGEN Parameter
VIRTUALPAGECNT. Since an image is generally forced to exit when its virtual
address space is exhausted, it is best to plan to have a sufficient amount for
the desired task.
This section contains the following topics:
How Performance Manager Uses Virtual Memory (see page 535)
For Graphs (see page 536)
For Reports (see page 537)
For Integrity Servers and Alpha Systems (see page 537)
How Performance Manager Uses Virtual Memory
Performance Manager uses process virtual address space to accumulate,
summarize, and sort performance data for the presentation of graphs and
reports. The input data that is provided to PA for reporting or graphing
determines the amount of memory required. You may either count or estimate
the number of items you have in the input data files to make an estimate for
the amount of virtual memory needed.
Process data is generally the most likely category of performance data that
occupies process virtual address space. PA allows you to save process data at
various levels of detail, from process_mode (interactive, batch, network, or
detached) to the most detailed level, by process ID (PID). If you choose the
most detailed level of reporting or graphing, more virtual memory is required.
The following estimates assume a page size of 512 bytes. On OpenVMS I64
and Alpha systems, these would be considered pagelets.
Appendix D: Estimate Virtual Memory Needs 535
For Graphs
For Graphs
To estimate the process virtual pages needed for ALL graphs
■
Use the following formula:
Pages required for graphing =
(xp / 128) * nn *
(126 +
18 * (nu + ni + nw) +
28 * nd +
8 * nf +
2 * nuid)
xp
# of x-points
nu
# of users
n
# of images
nw
# of workloads
nd
# of disks
nf
# of hotfiles
nuid
# of activity entries for users and images of specific disks.
nn
# number of nodes + 1
(set to 1, if BY-NODE graph option is off)
536 Performance Manager Administrator Guide
For Reports
For Reports
For the Performance Evaluation/Process Statistics, and the Tabular
Report/Process Metrics section,
To estimate the process virtual pages needed for the process reports:
■
Use the following formula:
Pages required for reporting =
number of process instances * 0.43
The number of process instances is the number of unique occurrences of a
process PID, imagename, username, processname, accountname, UIC group,
and execution mode. Each of these item keys may be disabled by selecting
reports or report options that do not require that level.
Performance Manager provides a set of default processing options that is
designed to provide a medium amount of detail for the reporting and graphing
functions, but that would require significantly less memory than if all
processing options were enabled.
For Integrity Servers and Alpha Systems
When selecting data for both reporting and graphing from either Command
Mode or DECwindows,
To estimate the number of pages needed (pagelets on Integrity and Alpha
systems)
■
Use the following formula:
Pages required for reporting +
Pages required for graphing + 20000
A safe approach is to provide as much process PFGLQUOTA as possible for the
Performance Manager process since any unneeded pages are not wasted.
Appendix D: Estimate Virtual Memory Needs 537
Appendix E: Output Format for ASCIICSV Data
This appendix describes the format of the data file you create when you use
the ADVISE PERFORMANCE EXPORT/TYPE=ASCII command. The appendix
shows examples of each data record followed by a table showing each example
value, data item, and a description of each item. The data is in CSV (Comma
Separated Variable) format with each item appearing as a fixed length field
within the record.
In an actual data file, the version record appears first indicating the node
processed, data version, and image. Each subsequent data record appears on
a line beginning with the record header. In the examples where a single data
record line is too long to show here, the record appears on several lines.
The records are described in the following sections:
■
Record Header
■
Version Data Record
■
Memory Statistics
■
CPU Statistics Data Record
■
Secondary CPU Statistics Data Record
■
Page Statistics Data Record
■
I/O Statistics Data Record
■
XQP Statistics Data Record
■
System Communications Services Data Record
■
Lock Statistics Data Record
■
Device Statistics Data Record
■
Disk Statistics Data Record
Appendix E: Output Format for ASCII-CSV Data 539
Record Header
■
Service Statistics Data Record
■
Process Metric Statistics Data Record
This section contains the following topics:
Record Header (see page 540)
Version Data Record (see page 541)
Memory Statistics Data Record (see page 541)
CPU Statistics Data Record (see page 543)
Secondary CPU Statistics Data Record (see page 544)
Page Statistics Data Record (see page 545)
I/O Statistics Data Record (see page 547)
XQP Statistics Data Record (see page 548)
System Communication Services Data Record (see page 549)
Lock Statistics Data Record (see page 551)
Device Statistics Data Record (see page 553)
Disk Statistics Data Record (see page 553)
Server Statistics Data Record (see page 555)
Process Metric Statistics Data Record (see page 556)
Record Header
This record header appears at the beginning of each data record.
"14-JAN-1997 10:00:00.00","14-JAN-1997 10:02:00.00","SNOLPD ","PROC", 120.0
Where "PROC" could be "CPU ", "DEVI", "DISK", "IO ", "LOCK", "MEMO",
"PAGE", "PROC", "SYST", or "XQP".
Example
Data item
Description
Position Lengt
h
"14-JAN-1997
10:00:00.00"
start_time
interval start time
2
23
"14-JAN-1997
10:02:00.00"
end_time
interval end time
29
23
"SNOLPD "
system_na
me
cluster node name
56
15
"PROC"
data_type
type of data in this
record
75
4
120.0
seconds
seconds of data in this 82
interval
7
540 Performance Manager Administrator Guide
Version Data Record
Version Data Record
The version record appears as the first record in the data file.
"Vx.x", "REPORT=LOG_FILE", "Vx.x", "CPD"
Example
Data item
Description
Positi
on
Length
"Vx.x"
image
image version
92
7
"REPORT=LOG_FILE report_progr type of report "
am
LOG_FILE/HISTO
RY
103
17
"Vx.x"
data_vers
122
7
"CPD"
input_source file - HISTORY or
_1
LOGFILE
133
22
version of data
file
Memory Statistics Data Record
The following example commands show how to export and display memory
statistics.
$ ADVISE PERFORMANCE EXPORT /NODE=ULTRA/OUTPUT=EXP.MEM/CLASS=(NODEFAULT, MEMORY)_$ /BEGINNING=26-JAN-1997:14:00:00.00/ENDING=26-JAN-1997:14:02:00.00
$ TYPE EXP.MEM
"ULTRA ", "VERS", "Vx.x", "REPORT=LOG_FILE", "Vx.x", "CPD
" "26-JAN-1997 14:00:00.00", "26-JAN-1997 14:02:00.00", "ULTRA ", "MEMO",
160.0, 327680, 78.5, 282821, 44859, 5000, 277821, 16352.0,
70438, 6.5, 2.0, 122.0, 89.2, 219.7, 0.0, 217.7,
0.0, 0.0, 0.0, 0.0
$
Example
Data item
Description
Position Length
160.0
mbytes
megabytes of phys
memory available
91
7
327680
pfn_phypgcn
t
pages of physical
memory available
100
7
78.5
mem_util
percentage of total
memory in use
109
7
282821
paged
# of pgs for pageable
memory
118
7
Appendix E: Output Format for ASCII-CSV Data 541
Memory Statistics Data Record
Example
Data item
Description
Position Length
44859
nonpaged
# of pgs for non-paged
memory
122
7
5000
sys_workset
# of pgs for the system
workingset
131
7
277821
user_workset # of pgs avail for user
workingsets
140
7
16352.0
modifyp
size of the modified
page list
149
7
70438
freep
size of the free page list
158
7
6.5
net_proc
# of network processes
167
7
2.0
bat_proc
# of batch processes
176
7
122.0
other_proc
# of other types of
processes
185
7
inter_proc
# of interactive
processes
194
7
219.7
total_proc
total process count
203
7
0.0
como_state
# of procs in comp
outswap state
212
7
217.7
balance_set
# of procs in the balance 221
set
7
0.0
inswp_count
# of inswap operations
230
7
0.0
outswp_coun # of outswap operations
t
239
7
0.0
hdr_inswp
# of header inswap
operations
248
7
0.0
hdr_outswp
# of header outswap
operations
257
7
542 Performance Manager Administrator Guide
CPU Statistics Data Record
CPU Statistics Data Record
The following example commands show how to export and display CPU
statistics:
$ ADVISE PERFORMANCE EXPORT /NODE=ULTRA/OUTPUT=EXP.CPU/CLASS=(NODEFAULT, CPU)_$ /BEGINNING=26-JAN-1997:14:00:00.00/ENDING=26-JAN-1997:14:02:00.00
$ TYPE
EXP.CPU
"ULTRA ", "VERS", "Vx.x", "REPORT=LOG_FILE", "Vx.x", "CPD "
"26-JAN-1997 14:00:00.00", "26-JAN-1997 14:02:00.00", "ULTRA ", "CPU",
56.8, 0.9, 0.3, 0.0, 1.3, 0.0, 40.4, 58.0,
1.3, 2315.0, 34.4, 0.1, 4.8, 35.1, 9.8, 0.0,
9.8, 42.9, 22.0, 12.4, 22.7, 0.15, 1, 0.3
$
Example
Data item
Description
Position
Length
56.8
interrupt
% of time in interrupt
mode
91
7
0.9
kernel
% of time in kernel
mode
100
7
0.3
exec
% of time in executive
mode
109
7
0.0
super
% of time in supervisor
mode
118
7
1.3
user
% of time in user mode
127
7
0.0
compat
% of time in
compatibility mode
136
7
40.0
idle
% of time in idle mode
145
7
58.0
system_cpu
% of time in system
mode (I+K+E)
154
7
1.3
task_cpu
% of time in task mode
(S+U+C)
163
7
2315.0
extcpu_samp number of extended CPU 172
les
samples
7
34.4
cpu_busy
% of time CPU found
busy
181
7
0.1
swap_busy
% of time swapper busy
190
7
4.8
multio_busy
% of time more than 1
disk busy
199
7
Appendix E: Output Format for ASCII-CSV Data 543
Secondary CPU Statistics Data Record
Example
Data item
Description
Position
Length
35.1
anyio_busy
% of time when at least
1 disk busy
208
7
9.8
pagewait
% of idle time with page 217
i/o outstand.
7
0.0
swapwait
% of idle time with swap 226
i/o outstand.
7
9.8
mmgwait
% of idle time with page 235
or swap i/o outstanding
7
42.9
sysidle
% of time CPU and disks 244
idle
7
22.0
cpu_only
% of time CPU busy and
disks idle
253
7
12.4
cpu_io
% of time CPU busy and
at least 1 disk busy
262
7
22.7
io_only
% of time at least 1 disk 272
busy and CPU idle
7
0
com_state
number of processes in
computable state
280
7
1
cpu_id
CPU id number, e.g., BI
node number CPU
board(s)
289
3
0.3
busy_wait
% of time in busy wait
(spin time)
294
7
Secondary CPU Statistics Data Record
The following example output shows these Secondary CPU statistics:
"ULTRA ", "VERS", "Vx.x", "REPORT=LOG_FILE", "Vx.x", "CPD "
"26-JAN-1997 14:00:00.00", "26-JAN-1997 14:02:00.00", "ULTRA ", "SECO",
0.8, 10.2, 1.6, 0.1, 2.9, 0.0, 76.1, 12.6,
3.0, 2, 8.3
Example
Data item
Description
Position
Length
0.8
sec_interrupt
% of time in interrupt
mode
91
7
10.2
sec_kernel
% of time in kernel mode
100
7
544 Performance Manager Administrator Guide
Page Statistics Data Record
Example
Data item
Description
Position
Length
1.6
sec_exec
% of time in executive
mode
109
7
0.1
sec_super
% of time in supervisor
mode
118
7
2.9
sec_user
% of time in user mode
127
7
0.0
sec_compat
% of time in compatibility 136
mode
7
76.1
sec_idle
% of time in idle mode
145
7
12.6
sec_system_c
pu
% of time in system mode 154
(I+K+E)
7
3.0
sec_task_cpu
% of time in task mode
(S+U+C)
163
7
fill_1
Obsolete
fill_2
Obsolete
2
sec_cpu_id
CPU id number
190
3
8.3
sec_busy_wait % of time in a busy wait
(spintime)
195
7
Page Statistics Data Record
The following example commands show how to export and display page
statistics:
$ ADVISE PERFORMANCE EXPORT /NODE=ULTRA/OUTPUT=EXP.PAGE/CLASS=(NODEFAULT, PAGE)_$ /BEGINNING=26-JAN-1997:14:00:00.00/ENDING=26-JAN-1997:14:02:00.00
$ TYPE EXP.PAGE
"ULTRA ", "VERS", "Vx.x", "REPORT=LOG_FILE", "Vx.x", "CPD "
"26-JAN-1997 14:00:00.00", "26-JAN-1997 14:02:00.00", "ULTRA ", "PAGE",
118.4, 0.0, 3.5, 28.9, 0.0, 33.5, 56.8, 18.0,
6.3, 0.0, 0.0, 0.1, 3.0, 97.0, 0.0
$
Example
Data item
Description
Position Length
118.4
tot_faults
total page faults/second
91
7
0.0
pwrite_fault pages write I/Os/second
s
100
7
Appendix E: Output Format for ASCII-CSV Data 545
Page Statistics Data Record
Example
Data item
3.5
readio_fault page read I/Os/second
s
109
7
28.9
pages_read number pages
read/second
118
7
0.0
pages_writt number pages
en
written/second
127
7
33.5
dzro_faults
136
7
56.8
gvalid_fault global valid faults/second
s
145
7
18.0
modify_faul modified list faults/second 154
ts
7
6.3
free_faults
free list faults/second
163
7
0.0
sys_faults
system page
faults/second
172
7
0.0
bad_faults
bad list faults/second
181
7
0.1
trans_faults transition state
faults/second
190
7
3.0
hard_faults
% of total faults which
were hard
199
7
97.0
soft_faults
% of total faults which
were soft
208
7
0.0
write_in_pr
og
write in progress
faults/second
217
7
546 Performance Manager Administrator Guide
Description
demand zero
faults/second
Position Length
I/O Statistics Data Record
I/O Statistics Data Record
The following example commands show how to export and display I/O
statistics:
$ ADVISE PERFORMANCE EXPORT /NODE=ULTRA/OUTPUT=EXP.IO/CLASS=(NODEFAULT, IO)_$ /BEGINNING=26-JAN-1997:14:00:00.00/ENDING=26-JAN-1997:14:02:00.00
$ TYPE EXP.IO
"ULTRA ", "VERS", "Vx.x", "REPORT=LOG_FILE", "Vx.x", "CPD "
"26-JAN-1997 14:00:00.00", "26-JAN-1997 14:02:00.00", "ULTRA ", "IO",
1.4, 0.2, 15.8, 91.6, 1066.0, 1.2, 13.8, 97.0,
45.4, 3.2, 3.2, 0.0
$
Example
Data item
Description
Position Length
1.4
w_turns
window turn
operations/second
91
7
0.2
splits
split I/O
operations/second
100
7
15.8
w_hits
window hits/second
109
7
91.6
w_hitr
window
hits+turns/window hits
118
7
1066.0
openf
number of open files
127
7
1.2
opens
number of file open
ops/sec
136
7
13.8
dirio
direct I/O
operations/second
145
7
97.0
bufio
buffered I/O
operations/second
154
7
45.4
lognam
logical name
translations/second
163
7
3.2
mbxread
mailbox read
operations/second
172
7
3.2
mbxwrites
mailbox write
operations/second
181
7
0.0
erase_ios
erase I/O
operations/second
190
7
Appendix E: Output Format for ASCII-CSV Data 547
XQP Statistics Data Record
XQP Statistics Data Record
The following example commands show how to export and display XQP
statistics:
$ ADVISE PERFORMANCE EXPORT /NODE=ULTRA/OUTPUT=EXP.XQP/CLASS=(NODEFAULT, XQP)_$ /BEGINNING=26-JAN-1997:14:00:00.00/ENDING=26-JAN-1997:14:02:00.00
$ TYPE EXP.XQP
"ULTRA ", "VERS", "Vx.x", "REPORT=LOG_FILE", "Vx.x", "CPD "
"26-JAN-1997 14:00:00.00", "26-JAN-1997 14:02:00.00", "ULTRA ", "XQP",
99.7, 3.0, 100.0, 0.1, 100.0, 0.2, 100.0, 0.3,
80.8, 5.5, 88.7, 4.5, 0.0, 0.0
$
Example
Data item
Description
Position Length
99.7
dir_hit
% directory FCB entries
found in cache
91
7
3.0
dir_rate
directory FCB cache
lookups/second
100
7
100.0
quota_hit
percent quota entries
found in cache
109
7
0.1
quota_rate
quota cache
lookups/second
118
7
100.0
fid_hit
percent file id entries
found in cache
127
7
0.2
fid_rate
file id cache
lookups/second
136
7
100.0
extent_hit
percent extent entries
found in cache
145
7
0.3
extent_rate
extent cache
lookups/second
154
7
80.8
filhdr_hit
% file header entries
found in cache
163
7
5.5
filhdr_rate
file header cache
lookups/second
172
7
88.7
dirdata_hit
% directory data entries
found in cache
181
7
4.5
dirdata_rate
directory data cache
lookups/second
190
7
548 Performance Manager Administrator Guide
System Communication Services Data Record
Example
Data item
Description
Position Length
0.0
stormap_hit
storage bitmap entries
found in cache
199
7
0.0
stormap_rate storage bitmap cache
lookups/second
208
7
System Communication Services Data Record
The following example commands show how to export and display system
communication statistics:
$ ADVISE PERFORMANCE EXPORT /NODE=SNOLPD/OUTPUT=EXP.SYS –
_$ /CLASS=(NODEFAULT, SYSTEM_COMMUNICATION)_$ /BEGINNING=26-JAN-1997:14:00:00.00/ENDING=26-JAN-1997:14:02:00.00
$ TYPE EXP.SYS "SNOLPD ", "VERS", "Vx.x", "REPORT=LOG_FILE", "Vx.x", "CPD "
"26-JAN-1997 14:00:00.00", "26-JAN-1997 14:02:00.00", "SNOLPD ", "SYST",
120.2, "SNOLPD ", 0.0, 0.0, 0.0, 10.2, 0.0,
0.0, 4.5, 4.5, 0.0, 0.0, 0.0, 0.0
$
Example
Data item
Description
Position
Length
"SNOLPD "
scs_node
name of node
92
17
0.0
data_gs_recvd
data gram msg
received/sec
111
7
0.0
data_gs_sent
data gram msg
sent/sec
120
7
0.0
data_gs_discd
data gram msg
discarded
129
7
10.2
k_bytes_mapd
138
KB of buffer
space to receivesend data from
this node by
local node
7
0.0
k_bytes_requst
KBytes of info to 147
receive from
some remote
node by local
node
7
Appendix E: Output Format for ASCII-CSV Data 549
System Communication Services Data Record
Example
Data item
Description
0.0
k_bytes_sent
KBytes of info to 156
send to some
remote node
from local node
7
4.5
msgs_recvd
# of msg
received from
this node by
local node
165
7
4.5
msgs_sent
# of msg send
by local node to
this node
174
7
0.0
qd_buf_descrs
183
# of times/sec
buffer descriptor
entry not
available
7
0.0
qd_buf_credit
192
# of times/sec
local node had to
wait for "credits"
on remote node
7
0.0
reqst_data
"read" ops/sec
initiated by local
node for some
remote node
201
7
0.0
sent_data
"write" ops/sec
initiated by local
node for some
remote node
210
7
550 Performance Manager Administrator Guide
Position
Length
Lock Statistics Data Record
Lock Statistics Data Record
The following example commands show how to export and display lock
statistics:
$ ADVISE PERFORMANCE EXPORT /NODE=ULTRA/OUTPUT=EXP.LOCK/CLASS=(NODEFAULT, LOCK)
_$ /BEGINNING=26-JAN-1997:14:00:00.00/ENDING=26-JAN-1997:14:02:00.00
$ TYPE
EXP.LOCK
"ULTRA ", "VERS", "Vx.x", "REPORT=LOG_FILE", "Vx.x", "CPD" "26-JAN-1997
14:00:00.00", "26-JAN-1997 14:02:00.00", "ULTRA ", "LOCK",
23.2, 12.6, 0.0, 19.8, 4.6, 0.0, 24.0, 12.8,
0.0, 0.1, 0.0, 0.1, 9.5, 0.0, 0.0, 0.0,
44.0, 0.0, 0.0, 0.0, 10308.0, 4835.0
$
Example
Data item
Description
Position Length
23.2
enq_local
enq ops/sec by lcl node
for lcl lcks
91
7
12.6
enq_in
enq ops/sec req by rem
node for lcl lcks
100
7
0.0
enq_out
enq ops/sec req by lcl
node for rem lcks
109
7
19.8
cvtenq_local
conv ops/sec by lcl node 118
for lcl lcks
7
4.6
cvtenq_in
conv ops/sec by rem
nodes for lcl lcks
127
7
0.0
cvtenq_out
conv ops/sec by lcl node 136
for remote lcks
7
24.0
deq_local
deq ops/sec by lcl node
for lcl lcks
145
7
12.8
deq_in
deq ops/sec by remote
nodes for lcl lcks
154
7
0.0
deq_out
deq ops/sec by lcl node
for remote lcks
163
7
0.1
blkast_local
blking ast/sec by lcl
node for lcl lcks
172
7
0.0
blkast_in
blking ast/sec by rem
nodes for lcl lcks
181
7
0.1
blkast_out
blking ast/sec by lcl
node for rem lcks
190
7
Appendix E: Output Format for ASCII-CSV Data 551
Lock Statistics Data Record
Example
Data item
Description
9.5
dirfunc_in
lcks/sec for directory ops 199
by remote node for lcl
directories
7
0.0
dirfunc_out
lcks/sec for directory ops 208
by lcl node for lcl
directories
7
0.0
dlckmsg_in
deadlock msg/sec
217
received from rem nodes
7
0.0
dlckmsg_out
deadlock msg/sec sent
to remote nodes
226
7
44.0
enq_wait
# of times lock
unavailable and process
waited
235
7
0.0
enq_notqd
# of times lock
unavailable and process
did not wait
244
7
0.0
dlck_search
# of times a deadlock
search initiated by lcl
system
253
7
0.0
dlck_find
# of times a deadlock
condition was found by
lcl system
262
7
10308.0
tot_locks
total # of lcks
outstanding
271
7
4835.0
tot_resources
total # of resources that
can be locked
280
7
552 Performance Manager Administrator Guide
Position Length
Device Statistics Data Record
Device Statistics Data Record
The following example commands show how to export and display device
statistics:
$ ADVISE PERFORMANCE EXPORT /NODE=ULTRA/OUTPUT=EXP.DEV/CLASS=(NODEFAULT, DEVICE)_$ /BEGINNING=26-JAN-1997:14:00:00.00/ENDING=26-JAN-1997:14:02:00.00
$ TYPE EXP.DEV
"ULTRA ", "VERS", "Vx.x", "REPORT=LOG_FILE", "Vx.x", "CPD "
"26-JAN-1997 14:00:00.00", "26-JAN-1997 14:02:00.00", "ULTRA ", "DEVI",
"$1$DAD0 ", 0.0
$
Example
Data item
Description
Position
Length
"$1$DAD0 "
device_name
device name
92
20
0.0
device_rate
I/O
operations/second
to device
115
7
Disk Statistics Data Record
The following example commands show how to export and display disk
statistics:
$ ADVISE PERFORMANCE EXPORT /NODE=ULTRA/OUTPUT=EXP.DISK/CLASS=(NODEFAULT, DISK)_$ /BEGINNING=26-JAN-1997:14:00:00.00/ENDING=26-JAN-1997:14:02:00.00
$ TYPE
EXP.DISK
"ULTRA ", "VERS", "Vx.x", "REPORT=LOG_FILE", "Vx.x", "CPD "
“26-JAN-1997 14:00:00.00", "26-JAN-1997 14:02:00.00", "ULTRA ", "DISK",
"$1$DUA30 ", 0.0, 0.0, 0.0, 0.0, -1.0,
0.0, -1.0, -1.0, 0.0, 0.0, 0.0, 0.0, 44.2,
2376153, 1324938, 0.0
$
Example
Data item
Description
Position Length
"$1$DUA30 "
disk_name
device name
92
20
0.0
work_avail
% of time work
was available for
disk
115
7
0.0
total_work
total # of work
request
124
7
Appendix E: Output Format for ASCII-CSV Data 553
Disk Statistics Data Record
Example
Data item
Description
Position Length
0.0
remote_work
# of work
requests from
remote systems
133
7
0.0
disk_paging
% of total work
marked as pagio
142
7
-1.0
rem_paging
% of total work
marked as pagio
from remote
systems
151
7
0.0
disk_swping
% of total work
160
marked as swapio
7
-1.0
rem_swping
169
% of total work
marked as swapio
from remote
systems
7
-1.0
server
% of server's
work charged to
this disk
178
7
0.0
disk_rate
I/O rate/second
187
7
0.0
service_time
service time in ms 196
7
0.0
response_time
response time in
ms
205
7
0.0
que_length
average queue
length
214
7
44.2
space_used
average % space
used
223
7
2376153
max_blocks
average
maximum space
for use
232
7
1324938
free_blocks
average free
space
241
7
0.0
read_cdrps
read operations
for this disk
250
7
554 Performance Manager Administrator Guide
Server Statistics Data Record
Server Statistics Data Record
The following example shows the server records that follow the Disk statistics
(shown in the Disk Statistics Data Record section) in the exported file:
$ TYPE EXP.SERV
"ULTRA ", "VERS", "Vx.x", "REPORT=LOG_FILE", "Vx.x", "CPD "
"26-JAN-1997 14:00:00.00", "26-JAN-1997 14:02:00.00", "ULTRA ", "SERV",
"HSC0 ", "HS70", 1, 0.2, 0.0, 0.0, 0.0
$
Example
Data item
Description
Position
Length
"HSC0 "
srv_name
name
92
16
"HS70"
srv_type
type
112
4
1
srv_alloc_cls
allocation class
119
7
0.2
srv_work_avail
% of time work was
avail for server
128
7
0.0
srv_paging
% of server's work
marked as pagio
137
7
0.0
srv_swping
% of server's work
marked as swapio
146
7
0.0
srv_que_length
average length of
server work queue
155
7
Appendix E: Output Format for ASCII-CSV Data 555
Process Metric Statistics Data Record
Process Metric Statistics Data Record
The following example commands show how to export and display process
statistics:
$ ADVISE PERFORMANCE EXPORT /NODE=ULTRA/OUTPUT=EXP.PROC _$ /CLASS=(NODEFAULT, PROCESS)_$ /BEGINNING=26-JAN-1997:14:00:00.00/ENDING=26-JAN-1997:14:02:00.00
$ TYPE EXP.PROC
"ULTRA ", "VERS", "Vx.x", "REPORT=LOG_FILE", "Vx.x", "CPD "
"26-JAN-1997 14:00:00.00", "26-JAN-1997 14:02:00.00", "ULTRA ", "PROC",
26E00824, "MACNEIL ", "[00750,000021]", 4, "LEF ", 0.0, 0.0,
0.0, 0.0, 0.0, 0.0, 408.0, 408.0, 408.0, "I",
"MACNEIL ", "CC_Y4Y ", 156.0, 156.0, 156.0, 252.0, 252.0,
252.0, 1024.0, 4096.0, 16000.0, 4620.0, 4620.0,
4620.0, "$1$DUA3: ","[SYS5.SYSCOMMON.][SYSEXE] ","SET "
$
Example
Data item
Description
Position
Length
26E00824
PID
Process ID
91
8
"MACNEIL "
proc_name
process name
102
16
"[00750,000021]" asc_uic
ASCII UIC
121
14
4
priority
software
priority
138
2
"LEF "
proc_state
process_state
144
5
0.0
image_count
image count
152
7
0.0
cpu_time
CPU time in
minutes
161
7
0.0
dir_io
direct i/o
rate/second
170
7
0.0
buf_io
buffered i/o
rate/second
179
7
0.0
faults
page
faults/second
188
7
0.0
fault_io
page fault
i/os/second
197
7
408.0
min_ws
minimum
working set
size
206
7
556 Performance Manager Administrator Guide
Process Metric Statistics Data Record
Example
Data item
Description
Position
Length
408.0
ave_ws
average
working set
size
215
7
408.0
max_ws
maximum
working set
size
224
7
"I"
mode
process mode - 233
interactive,batc
h,network,deta
ched, other
1
"MACNEIL "
user_name
user name
239
12
"CC_Y4Y "
account
account
255
8
156.0
min_gbl_pgs
minimum
global pages
266
7
156.0
ave_gbl_pgs
average global
pages
275
7
156.0
max_gbl_pgs
maximum
global pages
284
7
252.0
min_prv_pgs
minimum
private pages
293
7
252.0
ave_prv_pgs
average private 302
pages
7
252.0
max_prv_pgs
maximum
private pages
311
7
1024.0
ws_default
working set
default
320
7
4096.0
ws_quota
working set
quota
329
7
16000.0
ws_extent
working set
extent
338
7
4620.0
min_virt
minimum
virtual size
347
7
4620.0
ave_virt
average virtual
size
356
7
4620.0
max_virt
maximum
virtual size
365
7
Appendix E: Output Format for ASCII-CSV Data 557
Process Metric Statistics Data Record
Example
Data item
Description
Position
Length
"$1$DUA3: "
image_dev
image device
name
375
25
"[SYS5.SYSCOMMON.][SYSEXE] "
image.dir
image name
directory
404
37
"SET "
image_name
image file
name
445
39
"UTILITIES "
workload_name
488
the workload
name provided
with /CLASSIFY
qualifier
18
558 Performance Manager Administrator Guide
Appendix F: How You Graph Seven or
More CPUs
Performance Manager can graph six CPUs per command. If you need to create
a graph that displays seven or more CPUs for a node, you need to write CSV
files for 6 CPUs at a time, manually create a merged CSV file, move the file to
a Windows® machine, and then use Microsoft Excel® to create a graph.
To graph seven or more CPU's complete the following tasks in order:
1.
Create a CSV file
2.
Create More CSV Files as Necessary
3.
Create a Single CSV File
4.
Send the CSV file to a Windows Machine
5.
Create the graph in Excel
This section contains the following topics:
Step
Step
Step
Step
Step
1:
2:
3:
4:
5:
Create a CSV file (see page 559)
Create More CSV Files as Necessary (see page 560)
Create a Single CSV File (see page 560)
Send the CSV File to a Windows Machine (see page 562)
Create the Graph in Excel (see page 562)
Step 1: Create a CSV file
You need to create a CSV file that contains the custom graph data for first set
of six CPUs. The ADVISE PERFORM GRAPH command has a CUSTOM type
option.
Use this command with the following options:
$ ADVISE PERFORM GRAPH /NODE=nodename /OUT=nodename_cpus_nn1_nn2.CSV /FORMAT=CSV /BEGIN=dd-mmm-yyyy:hh:mm /END=dd-mmm-yyyy:hh:mm /TYPE=CUSTOM=(CPU_METRICS=P_BUSY, SELECTION=(cpuid,cpuid,cpuid,cpuid,cpuid,cpuid))
Appendix F: How You Graph Seven or More CPUs 559
Step 2: Create More CSV Files as Necessary
For example, the command for the first six CPUs of node RX8620
$ ADVISE PERFORM GRAPH /NODE=RX8620 /OUT=RX8620_CPUS_0_5.CSV /FORMAT=CSV /BEGIN=15-JAN-2008:13:00 /END=15-JAN-2008:13:10 /TYPE=CUSTOM=(CPU_METRICS=P_BUSY, SELECTION= (RX8620-0,RX8620-1,RX8620-2,RX8620-3,RX8620-4,RX8620-5))
Step 2: Create More CSV Files as Necessary
Repeat step 1 for each set of CPUs. Ensure you add no more than six CPUs to
each file.
Step 3: Create a Single CSV File
You need to append the CPU data for the same collection interval to the
existing record, and keep the order of the CPUs in each record.
To create a single CSV file
1.
Edit the first file.
2.
Open the second file.
3.
Append the CPU ids to the end of the “Time” record.
4.
Append the CPU data for each collection interval to the end of the record
for that collection interval.
5.
Repeat for any additional files.
6.
Insert a second comma after “Time” in the time record.
7.
Edit the format of the time fields for best display in the Excel graph.
Change the quoted string to comma-separated values.
For example, change
"15-JAN-2008 13:00"
To
15-JAN-2008,13:00
For example, for two files with a total of 12 CPUs
560 Performance Manager Administrator Guide
Step 3: Create a Single CSV File
File 1
"PSPA CUSTOM GRAPH"
"Node: RX8620"
"Date: 15-JAN-2008 13:00-13:10"
"Metric Values are Stacked (eg. Added to the left)"
"Units:
%PROCESSOR Total Busy"
"Time","RX8620-0","RX8620-1","RX8620-2","RX8620-3","RX8620-4","RX8620-5"
"15-JAN-2008 13:00",0.9183,0.2475,0.1250,0.1250,0.1108,0.0033
"15-JAN-2008 13:02",0.9192,0.2450,0.1233,0.1233,0.1100,0.0025
"15-JAN-2008 13:04",0.9192,0.2458,0.1250,0.1250,0.1058,0.0008
"15-JAN-2008 13:06",1.1150,0.3717,0.2358,0.2208,0.1892,0.0175
"15-JAN-2008 13:08",0.9175,0.2433,0.1242,0.1242,0.1067,0.0000
File 2
"PSPA CUSTOM GRAPH"
"Node: RX8620"
"Date: 15-JAN-2008 13:00-13:10"
"Metric Values are Stacked (eg. Added to the left)"
"Units:
%PROCESSOR Total Busy"
"Time","RX8620-6","RX8620-7","RX8620-8","RX8620-9","RX8620-10","RX8620-11"
"15-JAN-2008 13:00",0.0092,0.005,0,0,0,0
"15-JAN-2008 13:02",0.0092,0.005,0,0,0,0
"15-JAN-2008 13:04",0.0075,0.0017,0,0,0,0
"15-JAN-2008 13:06",0.1425,0.1233,0.1067,0.0425,0.0292, 0.015
"15-JAN-2008 13:08",0.0075,0.0017,0,0,0,0
Resulting File After Merge and Edits
"PSPA CUSTOM GRAPH"
"Node: RX8620"
"Date: 15-JAN-2008 13:00-13:10"
"Metric Values are Stacked (eg. Added to the left)"
"Units:
%PROCESSOR Total Busy"
"Time",,"RX8620-0","RX8620-1","RX8620-2","RX8620-3","RX8620-4","RX86205","RX8620-6","RX8620-7","RX8620-8","RX8620-9","RX8620-10","RX8620-11"
15-JAN-2008,13:00,0.9183,0.2475,0.1250,0.1250,0.1108,0.0033,0.0092,0.005,0,0,0,0
15-JAN-2008,13:02,0.9192,0.2450,0.1233,0.1233,0.1100,0.0025,0.0092,0.005,0,0,0,0
15-JAN-2008,13:04,0.9192,0.2458,0.1250,0.1250,0.1058,0.0008,0.0075,0.0017,0,0,0,0
15-JAN2008,13:06,1.1150,0.3717,0.2358,0.2208,0.1892,0.0175,0.1425,0.1233,0.1067,0.0425,
0.0292, 0.015
15-JAN-2008,13:08,0.9175,0.2433,0.1242,0.1242,0.1067,0.0000,0.0075,0.0017,0,0,0,0
Appendix F: How You Graph Seven or More CPUs 561
Step 4: Send the CSV File to a Windows Machine
Step 4: Send the CSV File to a Windows Machine
Send the CSV file to a Windows machine. Utilize whatever method works best
for you; FTP, for example.
Step 5: Create the Graph in Excel
To create the graph in Excel
1.
Open the .CSV file in Excel.
2.
Select the data beginning with cell A6 through the lower right cell you
want to graph.
3.
Click the Chart Wizard
OR
From the Worksheet Menu Bar, click Insert, Chart.
4.
Select Chart Type Column with chart sub-type from row three, left subtype 3-D Column, and then click Next.
5.
Select Columns and then click Next.
6.
Enter the title Processor Busy.
562 Performance Manager Administrator Guide
Step 5: Create the Graph in Excel
7.
Set the X-axis as Time, the Y-axis as CPU, and the Z-axis as % Processor
Total Busy, and then click Next.
8.
In Step 4 of the wizard, click As a new sheet for the chart location, and
then click Finish.
The chart appears on a new sheet in the current Excel file, as shown in
this example:
9.
To adjust the chart, right click in the chart and choose an option from the
pop-up menu.
Tips for viewing your data in the Excel Chart:
■
Use the 3-D View to rotate the chart.
■
If the collection intervals are all on a single day, you can choose to omit
Column A from your graph selection. Add the date to the worksheet title
for the chart, or to the Chart Title.
Appendix F: How You Graph Seven or More CPUs 563
Glossary
Actual or real workload
The actual or real workload is the work actually performed by the computer
system. Ideally, the actual workload is identical to the business workload.
Adapter
An adapter is a hardware interface between a device controller and a system
backplane or bus.
Analysis report
An analysis report is a report that identifies the effects of system parameter
settings, hardware configurations, and workload mixes on the performance of
any cluster node or the entire cluster system. This report provides conclusions
with supporting evidence and makes recommendations.
Analysis summary
The analysis summary is a short summary appearing in the analysis report
after each node analysis. The summary contains the following information:
- Number of Performance Manager records analyzed for the specific reporting
period
- Number of Performance Manager records that satisfied any rules
- Number of Performance Manager records that did not satisfy any rules
- Number of conclusions generated for the node being analyzed
Archive
Archive is the act of compressing Performance Manager daily data records into
history files, which can be used in place of daily data to create reports,
models, and graphs.
Auxiliary knowledge base
Auxiliary knowledge base is A collection of user-defined site-specific rules and
thresholds that have been compiled with the rules compiler (name.KB) and
used to augment the factory supplied rules.
Auxiliary rules
Auxiliary rules are the source files containing user-defined site-specific rules
and thresholds that collectively comprises the auxiliary knowledge base.
Baseline load
A Baseline load is the Performance Manager's measurements of your existing
system or cluster System. This data is stored in a model input file (.MDL).
Glossary 565
Baseline model
A baseline model is a model generated from historic or daily Performance
Manager data. The model output provides a workload characterization report.
An unmodified .MDL file, the baseline load, represents Performance Manager
measurements of your existing system. The model generated from this file is
known as the baseline model.
Buffered I/O operation
A buffered I/O operation occurs each time an intermediate system buffer is
used in place of the process context buffer.
Business workload
A business workload is the work the business expects its computer to perform.
Computer system
The computer system is all of the computer hardware on which business work
is performed.
Conclusions
Conclusions are Text displayed in an analysis report.
CPU branch explicit
In a modeling context, the CPU branch explicit is the probable distribution of
load across CPUs for a workload or transaction class. Probabilities must sum to
one. This data is included in the model input file.
Custom graph
A custom graph is a graph type which allows you to specify which Performance
Manager data items to graph.
Daily data files
Daily data files are created by the Performance Manager CPD data collector,
one for each node in the cluster, each day. The filename has the following
format:
PSDC$DATABASE:PSDC$nodename_yyyymmmdd.CPD
Data cell
A data cell is the basic unit of data used to create analysis reports. This data is
either retrieved directly from a field in a subrecord of a daily data record or
derived from it. The data cell is typically used as a variable in a rule
expression.
Data collection error log
The data collection error log is an ASCII file common to the entire cluster
system called PSDC$DATABASE:PSDC$DC.LOG. Errors that occur during data
collection are recorded in this file.
566 Performance Manager Administrator Guide
Data collection schedule
The data collection schedule is a user-defined schedule by which the
Performance Agent determines when to record data and what data to record
for each node in the cluster.
Data collection synchronization
Data collection synchronization is a method used to correlate intervals
measured on different nodes within a cluster system; those intervals must
represent the same real time to make analysis effective.
Data files
Data files are the files containing performance data from which reports and
graphs are constructed.
Data record
The data record contains performance data written by the data collector. The
CPD data collector writes one data record for each two-minute interval.
Database directory
The database directory is a directory located on a permanently mounted disk,
accessible to every node in the cluster. The data collection process writes the
daily data files to this area. Performance Manager software references this
area via the system wide logical name PSDC$DATABASE.
Dates file
The dates file contains a list of dates used to select data.
Device
A device is a piece of hardware in the computer system. It performs
measurable units of work.
Direct I/O
The number of direct I/O operations performed per second. This illustration is
tallied at the $QIO application interface layer.
Disk branch by source
In a modeling context, disk branch by source is the probable distribution of
load across disks by originating CPU for a workload or a transaction class.
Probabilities must sum to one. This data is included in the model input file.
Disk I/O
Disk I/O is the number of I/O operations per second for the device. This
illustration is tallied at the physical device driver layer.
Dump report
A dump report contains formatted output of data fields for each record of a
Performance Manager daily data file or history file.
Glossary 567
Evidence
Evidence supports lines of performance data displayed in an analysis report.
Factory rules
Factory rules are the performance rules supplied with the Performance
Manager in the PSPA$EXAMPLES area in the file named PSPA$KB.VPR.
Family name
Family name is an identifier for a group of workload definitions, also known as
a workload (transaction or usergroup) family.
Family type
There are two family types
- Usergroup families contain workload definitions based on user criteria.
- Transaction families contain workload definitions based on image and process
data.
Specify either family with the /CLASSIFY_BY qualifier to control use of the
family for the reporting facility.
File type
A file type is specified by one of the following extensions in its name:
- .COM Various command files
- .CPD Cluster Performance Data file
- .DAT Parameters and schedule file
- .EXE Various image files
- .HLB Parameter Editor help file
- .KB Compiled rules Knowledge Base file
- .LIB Model library file
- .LIS A report file
- .LOG Data collection process error log file
- .MAR Sample macro application file
- .MDL Model file
- .name History file, name is history file descriptor; also, alternate data file
name
- .name_JOU History journal file
- .REG A ReGIS graph written to a disk file
- .TXT Holidays and message files
- .VPR Performance Rules source file
Granularity
Granularity is a Performance Manager parameter file element that specifies for
each history file descriptor how often a history file is created.
Hard page fault
A hard page fault occurs each time a process references a virtual page that is
not in its working set and requires a read operation from disk, a hard page
fault is generated.
568 Performance Manager Administrator Guide
Histogram
A histogram is a (ASCII) graphic chronological chart showing resource use.
History database
The history database is reduced data from the daily data files, which resides in
the history files.
History file
The history file contains data archived from the daily data files. The number of
history files created and maintained depends upon the number of history file
descriptors and the associated granularity. The filename has the form
PSDC$DATABASE:PSDC$nodename_dd-mmm-yyyy_dd-mmm-yyyy.name.
History file descriptor
The history file descriptor contains the description that Performance Manager
uses to determine how to archive data to the file.
Holidays file
The holidays file contains a list of holiday dates. The Performance Agent uses
the holiday schedule on these dates. The file name is PSDC$HOLIDAYS.TXT.
Hot files
Hot files are the most frequently accessed files on each disk. The Performance
Agent collects hot file data when the length of a disk queue exceeds the
HOTFILE_QUEUE setting.
Interaction
An interaction with a device is a two-step process. First, a unit of work to be
done (job, user, process, and so forth) enters the queue of the device. Then,
the unit of work is serviced by the device (in a manner dependent on the
queueing discipline) and departs the device. The concept may be generalized
to the system as a whole. The set of device interactions required to process
each unit of work is called a transaction.
Interval
In the context of a history file, interval is an ADVISE EDIT ADD/HISTORY
qualifier and a Performance Manager parameter file element.
In the context of a daily CPD data file, the interval for writing records is fixed
at two minutes.
In the context of real-time displays, the interval is user-defined (default
interval=10 seconds, minimum=1 second).
Journal file
The journal file is when Performance Agent software creates one history
journal file for each history file. These are used by the update process in
conjunction with the daily data files to recreate corrupt or deleted history files.
The filename has the form PSDC$DATABASE:PSDC$nodename_dd-mmmyyyy_dd-mmm-yyyy.name_JOU. Do not delete these files. If they exist they
are needed.
Glossary 569
Knowledge base
The knowledge base is a file consisting of Performance Manager performance
rules used to analyze daily or historic Performance Manager data. It may be
augmented using an auxiliary knowledge base.
Measured workload
The measured workload is the workload that can be observed on the system.
Ideally, the measured workload is identical to the actual workload, but
specified in different terms.
The measured workload is specified by the resource demands it places on the
actual system. These demands, or loadings, are given as the service times of
the users at each device along with the number of expected transactions at
each device.
Model
A model is an abstraction of a system focusing on high-level performance
characteristics.
MODEL_TRANSACTIONS
Model_transactions are a default workload family defined in the parameters
file. It can be used to characterize workloads in the transaction class for
modeling.
MODEL_USERGROUPS
Model_usergroups is a default workload family defined in the parameters file.
It can be used to characterize workloads in the user group class for modeling.
Modeling
Modeling is the process of gathering, organizing, and evaluating principal
components of a system and the ways in which they interact for the purposes
of understanding and predicting system behavior.
MSCP
MSCP-Mass Storage Control Protocol. A software protocol used to
communicate between a VAX or Alpha processor and a disk controller such as
an HSC.
OpenVMS Cluster
An OpenVMS Cluster is a highly integrated organization of AlphaServer and HP
Integrity server system–or VAX and HP AlphaServer system–applications,
operating systems, and storage devices.
OTHER
All workload families have the catch-all workload OTHER to absorb process
data that does not match the selection criteria of any defined workload.
570 Performance Manager Administrator Guide
Parameters file
PSDC$PARAMS.DAT is the parameters file resides in the PSDC$DATABASE area
and serves as a repository for workload characterizations, history file
descriptors and other Performance Manager parameters.
Performance Agent
The Performance Agent is a detached process that collects and records
performance data for specified nodes in the cluster system according to a
weekly schedule.
Performance evaluation report
The performance evaluation report is a statistical report that helps you
determine whether changes that you implemented (based on
recommendations in the Analysis Report) improved or degraded system
performance.
Periodicity
Periodicity is a parameter file element for a history file descriptor that specifies
how often the averaging cycle is restarted.
Predefined graph
A predefined graph is a graph in which the Performance Manager defines the
metrics plotted.
Queue length
Queue length is the average number of outstanding requests, either waiting
for or receiving service.
Queueing network model
Queueing network model is a mathematical abstraction of a system where the
computer system is represented as a network of queues. Each queue in the
network is evaluated analytically.
Raw data file
Recommendation
A recommendation is the text presented in an analysis report that offers
system tuning advice based on rules firing. See Rule conclusion.
Residence time
Residence time is the time, in seconds, between image activation and image
termination. Average time that a request spends while waiting for and
receiving service.
Response time
Response time is the elapsed time between the arrival of a request and the
moment of completion. In the context of modeling, the interval between the
moment a request arrives at a device and request completion at a device.
Glossary 571
Rule
A rule is one or more rule conditions that are evaluated when Performance
Manager Analysis reports are generated. Rules are applied to daily or historic
data. If all conditions for a rule are true then there is a rule occurrence. Rules
are defined to expose areas of potential system problems. See Rule firing.
Rule conclusion
A rule conclusion is a rule element. The conclusions are Performance Manager
recommendations based on the conclusion text element of a rules file rule
construct.
Rule condition
A rule element. A rule condition is made up of one or more rule expressions.
Describes the circumstances that must be true to cause a rule occurrence.
Rule elements
The seven rule elements that can exist in a rule construct are as follows:
Brief Conclusion element
Conclusion element
Domain element
Evidence element
Occurrence element
Rule condition element
Rule ID element
Rule evidence
A rule element. Data satisfying a rule occurrence in a Performance Manager
analysis report. The evidence consists of data cell names and values. Typically
these data cells are some of those contained in the rule expressions.
Rule expressions
Components of rule conditions which may include the following:
572 Performance Manager Administrator Guide
Decimal values
Literal symbols
Tally data cells
Numeric data cells
Boolean data cells
Scan routine data cells
String operators
Numeric binary operators
Parentheses for precedence
Rule firing
After all the data has been processed, when creating a report, the
Performance Manager examines the number of rule occurrences for each rule.
If the rule occurrence threshold is met for a particular rule, the rule is said to
fire. For each rule that fires, an entry is made in the Analysis report. The entry
may include evidence and conclusions.
Rule identifier
A rule element. A five-character alphanumeric code enclosed in braces, for
example, {M0010} which uniquely identifies a rule. (A zero for the second
character is reserved for Digital use only.)
Rule occurrence
Each time all the rule conditions for a given rule are true, there is one rule
occurrence. See Rule firing.
Rules compiler
The rules compiler generates a binary knowledge base file (name.KB)from an
ASCII rules source file (name.VPR).
Rules file
The rules file is a compiled knowledge base file (name.KB). A Performance
Manager rules source file (name.VPR).
Rules file constructs
The following five constructs can exist in a Rules File:
- Comment construct
- Disable construct
- Literal construct
- Rule construct
- Threshold construct
Saturation
Saturation is the point at which response time at a device becomes
substantially higher than the service time.
Glossary 573
Schedule file
The schedule file is a file, PSDC$SCHEDULE.DAT, that resides in the
PSDC$DATABASE area and controls when Performance Manager daily data is
recorded.
Shadow set
A shadow set is one or more compatible physical disk volumes connected
together for volume shadowing and represented by a virtual unit. Thus, the
term shadow set refers to the physical unit and the virtual unit.
Soft page fault
Each time a process references a virtual page that is not in its working set but
is in memory, a soft page fault is generated.
Split I/O
Split I/O is the number of additional physical disk I/O operations required to
complete a single user's I/O request, which could not be satisfied in a single
I/O to a device.
Transaction
A transaction is a quantifiable unit of work that typically delineates a single
processing step in computer systems.
Transaction class
A transaction class is a group of related transactions. They may be related by
the function they perform, by the users who initiate them, or by other
quantities you define. Transactions may also be determined by the system
resource demands. The Performance Manager software generally refers to a
transaction class as a workload.
Transaction class workload
A transaction class workload is a workload that contains data bucketed by a
workload definition defined in terms of images.
Transaction workload family
A transaction workload family is a set of image based workload definitions.
User defined graph
Usergroup workload family
A usergroup workload family is a set of user based workload definitions.
Utilization
The percentage of a resource's capacity being used.
574 Performance Manager Administrator Guide
VAXcluster system
A multipurpose system configured by interconnecting or clustering VAX
processors and storage controllers to provide increased capabilities for sharing
data, distributing workloads, and providing greater system and data
availability.
VUP
VAX unit of processing speed. The VUP rating measures the CPU power of a
system compared to a VAX 11/780. A VAX 11/780 has a VUP rating of 1.0.
Wait time
Wait time, or queueing time, is the average time each request spends waiting
in a queue for service. During this time, the request accomplishes no useful
work. Wait time may be derived specifically for each device in the system or
for the system as a whole.
Workload
A representation of the actual system's resource demands. Performance
Manager software reports graphs and capacity plans based on workloads.
Workload definitions specify to Performance Manager software how to organize
the system load into workloads.
Workload definition
A workload definition can be one or more users, image names, or processes
that represent units of work on the system. Workload definitions are identified
and stored in the Performance Manager parameters file. The goal is to express
the system's total workload in manageable and meaningful units against which
Performance Manager can report. Use ADVISE EDIT to create, modify and
delete workload definitions.
A Transaction workload definition contains at least one image name.
Typically this workload will contain images with similar resource demands.
A Usergroup workload definition contains a user specifier (such as
accountname, username, processname, UIC code). Typically this workload
will contain a group of users who belong to the same business unit, such
as a department.
Transaction and Usergroup are terms applied to a workload by the
/CLASSIFY_BY qualifier.
Workload family
A workload family is a collection of workload definitions collectively
representing the entire work on a computer system.
Workload family name
A workload family name is a name that identifies a group of workloads that
collectively constitute a unit called a family.
Workload name
A workload name is a name that identifies a workload or workload definition.
Glossary 575
Workload selection criteria
A workload selection criteria is the criteria by which process data is assigned to
a workload. A workload is selected when process data matches on either or
both of a user specifier or image name.
576 Performance Manager Administrator Guide
Index
A
B
ADVISE PERFORMANCE
command • 175
for building a knowledge base • 175, 177
for converting data • 182
for graph generation • 191, 230, 245
for Performance Manager version • 238
for pie chart generation • 232, 249
for report generation • 234, 235
COMPILE command • 176
DISPLAY command • 178
DISPLAY, INVESTIGATE displays • 391
EXPORT command • 182
GRAPH command • 191
PIE_CHART command • 232
REPORT command • 234
Analysis and reporting facility • 15
Analysis report • 21, 29, 266
advice about performance • 18
contents • 235
effects of rule firing • 154
interpret • 22
order of conclusions • 21
rule
evaluation of • 137
identifier • 21
selection of • 274
use auxiliary knowledge base • 135, 173
window • 278
ANSI keyword • 191
Archive
graphing from archived data • 230
Archiving
schedule • 317
setting of • 317
AST • 84
Asterisk (*) in histogram • 65
Auto augmentation • 319
Automatic scaling, setting strip chart • 348
Auxiliary
knowledge base • 236
building • 176
rules, defined • 135
Bad list • 79
Balset count • 75
Bar graph
setting
high threshold • 347
low threshold • 347
maximum data value • 347
minimum data value • 347
patterns and colors • 350
peak hold units • 347
specifying
fonts • 353
parts • 352
Baseline model • 15
Binary graph data
loading of • 264
Bit map • 82
Block transfer • 85
Boolean operators • 153
Brief analysis report
contents • 235
Buffered I/O operation
defined • 34
Buffrd I/Os • 81
Build a knowledge base
ADVISE PERFORMANCE command • 175
See also Knowledge base • 175
Build mode
enabling of • 346
C
Cluster
data • 93
Disk • 101
rule
description • 29
heading descriptions • 29
Server • 104
Cluster-wide displays • 386
Collection definitions
create • 297
delete • 297
modify • 297
Index 577
COLOR keyword • 117
Colors and patterns
Change • 339
Command mode for interactive displays • 239
Compat • 77
Compute Queue graph type • 191
Conclusions • 15, 18, 236
Analysis report • 235
definition • 156
order and type in analysis report • 21
Copy panel instruments • 342
Coverage lists
device name • 298
process name • 298
CPU
ID • 77
Modes graph • 191
modes panel • 326
queue • 76
queue panel • 329
Utilization graph • 108, 191
Utilization histogram • 64
utilization panels • 325
create a CSV file • 559
create a graph in Excel • 562
Custom
graphs • 126, 191, 295
creating • 126
default title • 111
example • 127
metrics • 126
prompt mode • 126
pie charts • 232, 295
Customize menu • 306
D
Daily data • 268
Data
collection schedule • 298
file, minimizing file reads • 108
Data cell
as evidence • 154
associated with domains • 150
availability to rules • 150
effects of thresholds • 137
index specifiers • 156
list of predefined thresholds • 137
list of types • 156
type
578 Performance Manager Administrator Guide
Boolean • 158
index specifier • 162
numeric • 159
scan routine • 159
string • 159
tally • 160
time • 159
types and usage • 156
Datagram • 85
Deadlock • 84
Debugging user written rules • 150
DEC_CRT • 373
DECNET graph type • 191
DECnet Phase V support
node name translation • 406
DECwindows
interface • 17
Motif interface • 257, 260
controlling • 260
data collector status • 259
data selected for processing • 259
files locked • 259
main window • 258
quitting • 266
read parameter file • 264
saving reports • 260
work in progress • 261
write parameter file • 264
Motif Real-time display • 321
commands menu • 324
controlling • 322
CPU modes panel • 326
CPU queue panel • 329
CPU utilization panels • 325
default panel • 321
default panels • 324
Disk info panel • 336
Disk rate panels • 335
Disks panel • 335
Hard fault rate panels • 330
launching panels • 323
Memory allocation panel • 333
navigate panels • 323
Page faults panel • 330
Page file allocation panel • 334
panel hierarchy • 324
panel instrument • 341
panel manager • 322
Process wait panel • 329
starting • 321, 341
system overview panel • 324
User faults panel • 332
User memory panel • 334
DECwindows Motif interface, starting • 257
Default
ADVISE PERFORMANCE GRAPH
/BEGINNING • 191
/ENDING • 191
/ReGIS output file type • 191
/SCHEDULE • 191
/STACK • 191
Y_AXIS_MAXIMUM • 191, 245
ADVISE/GRAPH
/ANSI, TABULAR output file type • 191
/FORMAT overrides • 191
X_POINTS • 191
data, selection of • 266
domain for rule element • 150
graph type • 108, 191
number of hot files • 61
panels, navigating within • 323
rules file type • 176
threshold values • 137
X_POINTS value for • 123
Delete panel instruments • 342
DEQ • 84
Dir FCB • 82
Direct I/Os • 81
Disk
device metrics, for graphs • 126
info panel • 336
rate panels • 335
statistics • 88
DISKS graph type • 191
Disks panel • 335
Display interface
types of • 178
Displaying reports
brief analysis • 278
full analysis • 279
graphs • 286
edit of • 288
monochrome • 288
performance evaluation • 280
pie charts • 286
edit of • 288
process statistics • 282
selecting pie charts • 288
Domain element
definition • 150
position within a rule construct • 148
Dzero faults • 79
E
Edit panel instruments • 345
ENQ • 84
Erase I/Os • 81
Error messages
displaying • 403
Evidence • 236
effects of batch or output file • 21
factory evidence • 155
format
output • 154
rule element • 154
supporting evidence in analysis report • 21
Exec • 77
Expectations of the Performance Manager • 18
Extended process metrics • 90
Extent • 82
F
Factory rules • 15, 176, 236
Fatal message • 403
FAULTS graph type • 191
Faults types panel • 331
File
Index 579
cache effectivenesss • 83
cache hit and miss rates graph • 191
Hdr • 82
Id • 82
opens • 81
type • 177
G
Generate lock request, dequeue lock request •
54
Generate reports
average CPU and memory • 62
batch procedure • 16
CI, NI, and adapter statistics • 55
cluster lock request headings • 54
conversion lock request • 54
CPU mode statistics • 51
CPU statistics • 44
daily • 16
disk activity • 56
headings • 56
hot file activity • 61
I/O statistics • 46
lock traffic summary • 54
memory statistics • 48
pool statistics • 50
SCS message and transfer rates • 52
tape activity
headers • 58
headings • 58
Granularity • 317
Graph generation
modifying weekly schedule • 191
Graph type
Buffered I/O Images • 191
Compute Queue • 191
CPU Modes • 191
CPU_UTILIZATION • 191
Custom • 191
File Cache Hit and Miss Rates • 191
Most Resident
Images • 191
Users • 191
Workloads • 191
Number of
Jobs • 191
Processes • 191
Physical Memory Utilization • 191
predefined • 191
580 Performance Manager Administrator Guide
Systemwide
DECnet Traffic • 191
Disk I/O Rates • 191
Distributed Locking Activity • 191
Pagefaulting • 191
Terminal I/O Rates • 191
Terminal response time • 191
Top
BDT Wait Rate • 191
Blk Transfers Requested • 191
Blk Transfers Sent • 191
Buffered I/O Users • 191
Buffered I/O Workloads • 191
Busy Disk Devices • 191
Busy Disk Volume • 191
Busy Physical Processor • 191
Cluster Rule Occurrences • 191
Compat Mode Procesor • 191
CPU Images • 191
CPU Rule Occurrences • 191
CPU Users • 191
CPU Workloads • 191
Credit Wait Rate • 191
Datagrams Discarded • 191
Datagrams Received • 191
Datagrams Sent • 191
Direct I/O Images • 191
Direct I/O Users • 191
Direct I/O Workloads • 191
Exec Mode Procesor • 191
Faulting Images • 191
Faulting Users • 191
Faulting Workloads • 191
Freeblks Disk Device • 191
Freeblks Disk Volume • 191
Hard Faulting Images • 191
Hard Faulting Users • 191
Hard Faulting Workloads • 191
HSC Channel I/O • 191
HSC Channel Thruput • 191
HSC Disk IO • 191
HSC Disk Thruput • 191
HSC IO • 191
HSC Tape IO • 191
HSC Tape Thruput • 191
HSC Thruput • 191
Image Activations Users • 191
Image Activations Workload • 191
Image I/O Operations • 191
Images Activated • 191
Images Volume IO • 191
Interrupt Stack Procesor • 191
IO Rule Occurrences • 191
KB Sent Rate • 191
Kernel Mode Procesor • 191
Kilobyte Mapped Rate • 191
Kilobyte Received Rate • 191
Memory Rule Occurrences • 191
Messages Received • 191
Messages Sent • 191
MP Synch Mode Procesor • 191
MSCP I/O Operations files • 191
Operations Disk Device • 191
Operations Disk Volume • 191
Operations Files • 191
Percent Freeblks Disk Device • 191
Percent Freeblks Disk Volume • 191
Percent Usedblks Disk Device • 191
Percent Usedblks Disk Volume • 191
PG&SWP Operations Disk Device • 191
PG&SWP Operations Disk Volume • 191
PG&SWP Operations Files • 191
Pool Rule Occurrences • 191
Queue Disk Device • 191
Queue Disk Volume • 191
Queue HSC Channel • 191
Read Operations Disk Device • 191
Read Operations Disk Volume • 191
Read Operations Files • 191
Resource Rule Occurrences • 191
Response Time Disk Device • 191
Response Time Files • 191
Response time images • 191
Response time users • 191
Response time workloads • 191
Rule Occurrences • 191
Service Time Disk Volume • 191
Split Operations Disk Device • 191
Split Operations Disk Volume • 191
Split Operations Files • 191
Supervisor Mode Procesor • 191
Terminal Input Images • 191
Terminal Input Users • 191
Terminal Input Workloads • 191
Terminal Thruput Images • 191
Terminal Thruput Users • 191
Terminal Thruput Workloads • 191
Throughput Disk Device • 191
Throughput Disk Volume • 191
Throughput Files • 191
Throughput Images • 191
Throughput Users • 191
Throughput Workloads • 191
User Disk Operations • 191
User Mode Procesor • 191
User Volume IO • 191
Index 581
VA Space Images • 191
VA Space Users • 191
VA Space Workloads • 191
Workload Disk Operations • 191
Write Operations Disk Device • 191
Write Operations Disk Volume • 191
Write Operations Files • 191
WS Size Images • 191
WS Size Users • 191
WS Size Workloads • 191
Graphs
components of • 111, 117, 286
Custom • 126, 295
display of • 286, 293
legend • 111
selecting multiple • 108
selection of • 274
stacked • 288
top system use • 294
Gvalid faults • 79
H
Hard
fault rate panels • 330
faults • 79, 388
page fault in performance evaluation report
• 34
HEIGHT keyword
for generating graphs • 191
High threshold
bar graph,setting of • 347
strip chart
setting of • 348
Histogram • 64, 70
asterisk (* • 65
CPU utilization • 64
plot resident time for image system load
and performance • 64
provide finer resolution • 64
History
data, how to select • 191
file descriptors
582 Performance Manager Administrator Guide
archive schedule • 317
create • 317
create workload classifications • 317
data reduction • 317
deleting • 319
modify • 319
set archiving • 317
workload families • 317
file, where defined • 191
Hot file
queue, size of • 298
I
I/O rule • 26
Image
CPU panel • 329
name • 90, 309
Informational message • 403
Instruments
connect • 324
disconnect • 324
setting interval of • 324
InSWP • 77
Inter stack • 77
Interactive displays in Command mode • 239
Interval
record
frequency of • 156
time stamped • 159
value, history file descriptors • 317
INVESTIGATE
keypad • 392
J
JOBS graph type • 191
K
Kernel • 77
Key settings
primary keys • 34
secondary keys • 34
Keywords
[NO]STACK • 191, 245
ANSI • 191
COLOR • 117
HEIGHT • 191
LINE • 117, 230
PATTERN • 117
ReGIS • 117, 191
STACK • 245
TABULAR • 191
THRESHOLD • 245
TITLE • 191, 245
TODAY • 191
TOMORROW • 191
WIDTH • 191
X_POINTS • 191
Y_AXIS_MAXIMUM • 191, 245
YESTERDAY • 191
Knowledge base • 15
auxiliary
build • 135, 172
use • 135
definition • 176
L
Launch panels
assign • 362
Launching panels • 323
LINE keyword • 117, 230
Lock rates • 84
LOCKS graph type • 191
Logical names • 405
Lognam trans • 81
Lost CPU • 78
Low threshold
bar graph, setting of • 347
strip chart, setting of • 348
M
Mailbx
reads • 81
writes • 81
Maximum data value
bar graph,setting of • 347
strip chart
setting of • 348
Mem queue • 76
Memory
allocation panel • 333
panel • 333
MEMORY_UTITLIZATION graph type • 191
Messages • 403
Meter parts
specify • 356
Metric instance data
specify • 369
Minimum data value
bar graph,setting of • 347
strip chart
setting of • 348
Modify
MEMutl • 76
pages • 75
Modify panel instruments • 346
Most Resident
Images graph • 191
Users graph • 191
Workloads graph • 191
Motif Interface
customize parameters • 306
history file descriptors • 316
set parameters • 319
workload definitions • 308
workload family definitions • 313
Multi I/O was busy. • 79
N
Node
definition list • 298
maximum • 94
minimum • 94
Nonpaged memory field
in system configuration report • 72
Number of
Jobs graph • 191
Processes graph • 191
time units, strip chart, setting of • 348
Numeric operators • 153
O
Open files • 82
P
Page
faults • 79
faults panel • 330
file allocation panel • 334
Paged memory
in system configuration report • 72
Pages
read • 79
writen • 79
Panel
hierarchy • 324
instrument edit menu, functions of • 345
instrument metrics, assign • 359
Index 583
instruments
background, specifying of • 367
close • 371
copy • 342, 358
create • 342, 357
delete • 342, 358
edit • 345
filter metrics, select • 359
launch • 364
menu, removal of • 370
modify • 346
node, specify • 369
options, set • 366
remove • 342
rename • 342
save • 371
set auto displays of • 342
status, set • 367
title, specify • 368
manager, access • 341
Parameter
Editor, start • 306
settings
auto augment • 319
menu • 319
version limit • 319
Parameters file
change • 306
customize • 306
locked • 259, 306
PSDC$PARAMS.DAT • 306
release • 306
unlocked • 306
view • 306
when changes become effective • 239
PATTERN keyword • 117
Patterns and colors
bar graph, set • 350
set • 349
strip chart, set • 351
Peak hold units, bar graph, setting of • 347
Performance
activity report, navigation of • 282
Agent
584 Performance Manager Administrator Guide
collection schedule • 298
delete after • 298
disk space needed • 298
end date • 298
hot file queue • 298
node definition list • 298
setting parameters • 298
start date • 298
view settings • 296
work set quota • 298
evaluation report • 15, 62, 266
CI, NI, and adapter statistics • 55
CPU mode statistics • 51
cpu statistics • 44
disk statistics • 56
hot file statistics • 61
I/O statistics • 46
interpreting • 34, 62
lock traffic • 54
memory statistics • 48
navigation of • 280
pool statistics • 50
process statistics • 38, 40
SCS message and transfer rates • 52
selection of • 274
summary statistics • 62
tape statistics • 58
evaluation window • 280
Manager, reporting schedule • 269
Performance Agent
status • 259
Performance analysis
data
classification of • 268
source of • 268
display reports • 278
select
analysis • 274
dump reports • 274
graphs • 274
last hour • 277
performance • 274
report options • 274
tabular-final reports • 274
tabular-interval reports • 274
select data
default • 266
specific • 267
select nodes • 274
set reporting period • 269
Periodicity • 317
Phase V support
logical name definition • 406
Physical Memory Utilization graph • 191
Pie charts
components of • 286
custom • 295
display of • 286, 293
selecting • 288
top system use • 294
Playback data displays • 178, 337
Predefined
graph
generate all • 191, 245
identify the type • 111
types • 191
Primary keys • 34
Proc Count • 75
Process
data, options for reporting • 34
faults panel • 332
metric • 90
for graphs • 126
generate graphs by user in command mode •
130
generate graphs by user in prompt mode • 130
statistics window • 282
wait panel • 329
PROCESSES graph type • 191
PSPA$DAILY.COM • 16
PSPA$DISPLAY_PROCESS_CPU_UNNORMALIZE
D logical • 405
PSPA$DNS_NAMES logical • 406
PSPA$EXAMPLES
logical name described • 406
PSPA$GETDATA.COM file • 406
PSPA$GIVE_DEVICE_SERVICE logical • 406
PSPA$GRAPH_CHARS logical • 406
PSPA$GRAPH_FILE_DEVICE logical • 407
PSPA$GRAPH_FILE_DIRECTORY logical • 407
PSPA$GRAPH_LEGEND_FONT_POINT logical •
407
PSPA$GRAPH_PATH logical • 407
PSPA$HLS logical • 407
PSPA$PIE_FONT_POINT logical • 408
PSPA$PS_RGB_1 through PSPA$PS_RGB_6
logicals • 408
PSPA$SKIP_DISK_FILTER logical • 409
PSPA$SKIP_PIE_PERCENT logical • 409
PSPA$SUPRESS_TAPE_STATS_BY_VOLUME
logical • 409
PSPA$UNNORMALIZE_CUSTOM_CPU logical •
409
Q
Qualifier
[NO]STACK • 191, 230
AVERAGE • 191, 241
BEGINNING qualifier
for Playback data displays • 178
to export data • 182
to generate graphs • 191
CLASSIFY_BY • 191
COLLECTION_DEFINITION • 178, 191
COMPOSITE • 191
DATES • 182, 191
DISK_DEVICES qualifier
to create displays • 178
DNS_NAMES qualifier
to create displays • 178
ENDING • 191
FILTER
to select data in command mode • 241
FILTER qualifier
for pie charts • 232
to export data • 182
to graph data • 191
FORMAT • 117, 191
HISTORY • 191
INITIAL qualifier
for rule conclusions • 178
INTERVAL qualifier
to creat displays • 178
LINE • 191
MODE qualifier for creating displays • 178
NODE • 191
NODE_NAMES qualifier
for generating graphs • 191
to create displays • 178
OUTPUT • 191
OUTPUT qualifier
to generate graphs • 191
PERCENTAGE • 232, 249
PROCESS_STATISTICS • 34
to export data • 182
RULES qualifier
Index 585
for knowledge base file name • 177
for rule conclusions • 178
SCHEDULE • 191
TYPE • 108, 191, 245
to generate all graphs • 245
TYPE qualifier
to generate all graphs • 191
VOLUMES qualifier
for rule conclusions • 178
Queue length
analysis report • 29
disk devices • 191
disk volumes • 191
HSC channels • 191
R
Ranges and thresholds
set • 338, 347
Real-time
character-cell displays, start • 374
displays
character cell • 178
windows • 178
panel manager
display of • 341
Playback display from DECwindows • 322
sessions, terminate • 345
Recommendation • 18, 236
from analysis report • 21
Recovery procedures • 403
ReGIS
graph • 117
keyword • 117, 191
Remove panel instruments • 342
Rename panel instruments • 342
Reporting period
set • 269
Reports • 88
analysis report • 29
histograms • 64, 70
mailing • 16
performance evaluation report • 33, 62
how you interpret • 34, 62
types of • 15, 235
Residence time
histogram • 235
image residence histogram • 64
performance evaluation report • 34
Response • 389
586 Performance Manager Administrator Guide
time
highest disk device • 191
highest files • 191
RESPONSE_TIME graph type • 191
Rule
cluster rule • 191
compiler • 176
conclusion definition • 156
condition
accessibility of data cells • 156
definition • 152
display debugging information • 150
position within a rule construct • 148
request a list of • 21
string operators • 153
time data cell unavailable • 159
use string data cells • 159
constructs • 137
cpu rule • 191
element, list of elements • 148
evidence, accessibility of data cells • 156
example • 148
expression, as a scan routine argument •
159
factory rules • 176
factory rules, embedded in the product •
135
firing • 137
effects of rule occurrence • 154
identifier • 236
analysis report • 21
brief analysis report • 30
conventions • 149
definition and format • 149
position within a rule construct • 148
IO rule • 191
memory rule • 191
occurrence • 236
brief analysis report • 30
definition • 137, 154
other rule • 191
pool rule • 191
resource rule • 191
user rules • 176
Rule modification • 18
Rules
compiler • 15
invoke • 176
file
auxiliary • 173
contents • 137
format • 137
source file • 172
S
Save reports • 260
Schedule file
display contents • 236
locked • 259
SCS • 85
Secondary keys • 34
Selection Filters Dialog Box • 269
Sequenced message • 85
Service time
highest disk volume • 191
Set
auto displays of panel instruments • 342
parameters • 319
data collector • 298
ranges and thresholds • 347
Severity code explanation • 403
Soft
faults • 79, 388
page fault in performance evaluation report
• 34
Soft page fault
in performance evaluation report • 34
Space used • 88
Specific data
selection of • 267
Split I/Os • 81
STACK keyword • 245
Standard process metrics • 90
Start
DECwindows
Motif Real-time display • 321, 341
DECwindows Motif interface • 257
Real-time character-cell displays • 374
Strip chart
parts, specify • 355
set
automatic scaling • 348
high threshold • 348
low threshold • 348
maximum data value • 348
minimum data value • 348
minimum number of time units • 348
patterns and colors • 351
Super • 77
Swaper CPU • 77
SWAPPER • 75
System • 77
communication services • 85
metric
for graphs • 126
generate a graph in command mode • 127
generate a graph in prompt mode • 127
overview panel • 324
display of • 341
working set field
in system configuration report • 72
Systemwide
DECnet Traffic graph • 191
Disk I/O Rates graph • 191
Distributed Locking Activity graph • 191
Pagefaulting graph • 191
Terminal I/O Rates graph • 191
T
TABULAR keyword • 191
Tabular report
contents • 235
Task CPU • 390
Terminal
ReGIS • 373
response time graph • 191
VT100 • 373
VT240 • 373
TERMINALS graph type • 191
Terminating Real-time sessions • 345
THRESHOLD keyword • 245
Threshold value modification • 18
Throughput
highest
disk device • 191
disk volume • 191
files • 191
HSC channel • 191
HSC disk • 191
images with highest • 191
Index 587
users with highest • 191
workload with highest • 191
TITLE keyword • 191, 245
TODAY keyword • 191
TOMORROW keyword • 191
Top
BDT Wait Rate • 191
Blk
Transfers Requested graph • 191
Transfers Sent graph • 191
Buffered
I/O Images graph • 191
I/O Users graph • 191
I/O Workloads graph • 191
Busy
Disk Devices graph • 191
Disk Volume graph • 191
Physical Processor graph • 191
Cluster Rule Occurrences graph • 191
Compat Mode Processor • 191
CPU
Images graph • 191
Rule Occurrences graph • 191
Users graph • 191
Workloads graph • 191
Credit Wait Rate graph • 191
Datagrams
Discarded graph • 191
Received graph • 191
Sent graph • 191
Direct I/O
Images • 191
Users graph • 191
Workloads graph • 191
Exec Mode Processor • 191
Faulting
Images graph • 191
Users graph • 191
Workloads graph • 191
Freeblks
Disk Device graph • 191
Disk Volume graph • 191
Hard Faulting
graph • 191
Users graph • 191
Workloads graph • 191
HSC Channel
588 Performance Manager Administrator Guide
I/O graph • 191
Thruput • 191
HSC Disk
IO graph • 191
Thruput graph • 191
HSC IO graph • 191
HSC Tape
IO graph • 191
Thruput graph • 191
HSC Thruput graph • 191
Image
Activations Users graph • 191
Activations Workload graph • 191
I/O Operations • 191
Images
Activated graph • 191
Volume IO graph • 191
Interrupt Stack Processor • 191
IO Rule Occurrences graph • 191
KB Sent Rate graph • 191
Kernel Mode Processor • 191
Kilobyte
Mapped Rate graph • 191
Received Rate graph • 191
Memory Rule Occurrences graph • 191
Messages
Received graph • 191
Sent graph • 191
MP Synch Mode Processor • 191
MSCP I/O Operations files graph • 191
Operations
Files graph • 191
Operations Disk
Device graph • 191
Volume graph • 191
Percent Freeblks Disk
Device graph • 191
Volume graph • 191
Percent Usedblks Disk
Device graph • 191
Volume graph • 191
PG&SWP Operations
Disk Device • 191
Disk Volume graph • 191
Files • 191
Pool Rule Occurrences graph • 191
Queue
Disk Device graph • 191
Disk Volume graph • 191
HSC Channel • 191
Read Operations
Disk Device • 191
Disk Volume • 191
Files • 191
Resource Rule Occurrences graph • 191
Response Time
Disk Device graph • 191
File graph • 191
Images graph • 191
Users graph • 191
Workloads • 191
Rule Occurrences graph • 191
Service Time Disk Volume graph • 191
Split Operations
Disk Device graph • 191
Disk Volume graph • 191
Files graph • 191
Supervisor Mode Processor • 191
system use
graphs • 294
pie charts • 294
Terminal Input
Images graph • 191
Users graph • 191
Workloads graph • 191
Terminal Thruput
Images graph • 191
Users graph • 191
Workloads graph • 191
Throughput
Disk Device graph • 191
Disk Volume graph • 191
Files graph • 191
Images graph • 191
Users graph • 191
Workloads graph • 191
User
Disk Operations • 191
Mode Processor • 191
Volume IO • 191
VA Space
Images graph • 191
Users graph • 191
Workloads graph • 191
Workload Disk Operations • 191
Write Operations
Disk Device graph • 191
Disk Volume graph • 191
Files graph • 191
WS Size
Images graph • 191
Users graph • 191
Workloads graph • 191
TOP_BDT_W graph type • 191
TOP_BLKS_R graph type • 191
TOP_BLKS_S graph type • 191
TOP_BUFIO_IMAGES graph type • 191
TOP_BUFIO_USERS graph type • 191
TOP_BUFIO_WORKLOADS graph type • 191
TOP_BUSY_DISKS graph type • 191
TOP_BUSY_PROCESSOR graph type • 191
TOP_BUSY_VOLUMES graph type • 191
TOP_CHANNEL_IO graph type • 191
TOP_CHANNEL_QUELEN graph type • 191
TOP_CHANNEL_THRUPUT graph type • 191
TOP_CLUSTER_RULE_OCC graph type • 191
TOP_COMPAT_PROCESSOR graph type • 191
TOP_CPU_IMAGES graph type • 191
TOP_CPU_RULE_OCC graph type • 191
TOP_CPU_USERS graph type • 191
TOP_CPU_WORKLOADS graph type • 191
TOP_CR_W graph type • 191
TOP_DGS_D graph type • 191
TOP_DGS_R graph type • 191
TOP_DGS_S graph type • 191
TOP_DIRIO_IMAGES graph type • 191
TOP_DIRIO_USERS graph type • 191
TOP_DIRIO_WORKLOADS graph type • 191
TOP_DISKIO_IMAGES graph type • 191
TOP_DISKIO_USERS graph type • 191
TOP_DISKIO_WORKLOADS graph type • 191
TOP_EXEC_PROCESSOR graph type • 191
TOP_FAULTING_IMAGES graph type • 191
TOP_FAULTING_USERS graph type • 191
TOP_FAULTING_WORKLOADS graph type •
191
TOP_FREEBLK_DISKS graph type • 191
TOP_FREEBLK_VOLUMES graph type • 191
TOP_HARDFAULTING_IMAGES graph type •
191
TOP_HARDFAULTING_USERS graph type • 191
TOP_HARDFAULTING_WORKLOADS graph type
• 191
TOP_HSC_DISK_IO graph type • 191
TOP_HSC_DISK_THRUPUT graph type • 191
Index 589
TOP_HSC_IO graph type • 191
TOP_HSC_TAPE_IO graph type • 191
TOP_HSC_TAPE_THRPUT graph type • 191
TOP_HSC_THRUPUT graph type • 191
TOP_IMAGE_ACTIVATIONS graph type • 191
TOP_IMAGE_VOLUME_IO graph type • 191
TOP_INTERRUPT_PROCESSOR graph type •
191
TOP_IO_DISKS graph type • 191
TOP_IO_FILES graph type • 191
TOP_IO_RULE_OCC graph type • 191
TOP_IO_VOLUMES graph type • 191
TOP_KB_MAP graph type • 191
TOP_KB_RC graph type • 191
TOP_KB_S graph type • 191
TOP_KERNEL_PROCESSOR graph type • 191
TOP_MEMORY_RULE_OCC graph type • 191
TOP_MGS_R graph type • 191
TOP_MGS_S graph type • 191
TOP_MP_SYNCH_PROCESSOR graph type •
191
TOP_MSCPIO_FILES graph type • 191
TOP_PAGING_DISKS graph type • 191
TOP_PAGING_FILES graph type • 191
TOP_PAGING_VOLUMES graph type • 191
TOP_POOL_RULE_OCC graph type • 191
TOP_PRCT_FREE_DISKS graph type • 191
TOP_PRCT_FREE_VOLUMES graph type • 191
TOP_PRCT_USED_DISKS graph type • 191
TOP_PRCT_USED_VOLUMES graph type • 191
TOP_QUEUE_DISKS graph type • 191
TOP_QUEUE_VOLUMES graph type • 191
TOP_READ_DISKS graph type • 191
TOP_READ_FILES graph type • 191
TOP_READS_VOLUMES graph type • 191
TOP_RESIDENT_IMAGES graph type • 191
TOP_RESIDENT_USERS graph type • 191
TOP_RESIDENT_WORKLOADS graph type •
191
TOP_RESOURCE_RULE_OCC graph type • 191
TOP_RESPONSE_TIME_DISKS graph type •
191
TOP_RESPONSE_TIME_FILES graph type • 191
TOP_RESPONSE_TIME_IMAGES graph type •
191
TOP_RESPONSE_TIME_USERS graph type •
191
TOP_RESPONSE_TIME_WORKLOADS graph
type • 191
590 Performance Manager Administrator Guide
TOP_RULE_OCCURRENCES graph type • 191
TOP_SERVICE_VOLUMES graph type • 191
TOP_SPLITIO_DISKS graph type • 191
TOP_SPLITIO_FILES graph type • 191
TOP_SPLITIO_VOLUMES graph type • 191
TOP_SUPER_PROCESSOR graph type • 191
TOP_TERMINAL_INPUT_IMAGES graph type •
191
TOP_TERMINAL_INPUT_USERS graph type •
191
TOP_TERMINAL_INPUT_WORKLOADS graph
type • 191
TOP_TERMINAL_THRUPUT_IMAGES graph type
• 191
TOP_TERMINAL_THRUPUT_USERS graph type •
191
TOP_TERMINAL_THRUPUT_WORKLOADS graph
type • 191
TOP_THRUPUT_DISKS graph type • 191
TOP_THRUPUT_FILES graph type • 191
TOP_THRUPUT_IMAGES graph type • 191
TOP_THRUPUT_USERS graph type • 191
TOP_THRUPUT_VOLUMES graph type • 191
TOP_THRUPUT_WORKLOADS graph type • 191
TOP_USER_IMAGE_ACTIVATIONS graph type •
191
TOP_USER_PROCESSOR graph type • 191
TOP_USER_VOLUME_IO graph type • 191
TOP_VA_IMAGES graph type • 191
TOP_VA_USERS graph type • 191
TOP_VA_WORKLOADS graph type • 191
TOP_WORKLOAD_IMAGE_ACTIVATIONS graph
type • 191
TOP_WRITE_DISKS graph type • 191
TOP_WRITE_FILES graph type • 191
TOP_WRITE_VOLUMES graph type • 191
TOP_WSSIZE_IMAGES graph type • 191
TOP_WSSIZE_USERS graph type • 191
TOP_WSSIZE_WORKLOADS graph type • 191
Trans faults • 79
U
Unlock
parameters file • 259
schedule file • 259
User • 77
CPU panel • 327
faults panel • 332
memory
field in system configuration report • 72
panel • 334
name • 309
V
Video graphics • 373
Virtual Memory Requirements
estimating • 535
pagelets • 535
Volume info panel • 335
VT100 • 373
VT240 • 373
W
Warning message • 403
WCB • 81
Weekly schedule file
modifying • 191
WIDTH keyword • 191
Window
hits • 81
interface
for Performance Manager • 257
interface for Real-time displays • 321
turns • 81
Working set • 298
Workload • 15, 18, 40
classification • 236
definitions
base priority • 309
by sets of items • 309
creating • 309
defining • 308
deleting • 312
image • 309
image names • 309
included processes • 309
match both • 309
match either • 309
matching rquirement • 309
modifying • 308, 312
PID • 309
process name • 309
transaction units • 309
UIC group • 309
user • 309
user names • 309
highest
buffered IO • 191
cpu • 191
direct IO • 191
disk operations • 191
faulting • 191
hard faulting • 191
throughput • 191
interpret process statistics • 38
largest
VA space • 191
WS size • 191
most
image activations • 191
resident • 191
used with performance evaluation reports •
33
Workload family definitions
add workloads • 314
create • 314
define • 313
modify • 313
order precedence • 314
remove workloads • 314
workloads included • 314
WritIN Prog • 79
X
X_POINTS keyword • 191
XQP • 81
Y
Y_AXIS_MAXIMUM keyword • 191, 245
YESTERDAY keyword • 191
Index 591