1
Suite56™ Application Development System
(ADS)
Debugger User Manual, Release 6.3
DSPADSUM/D
Document Rev. 4.0, 07/1999
Suite56, OnCe, and MFAX are trademarks of Motorola, Inc.
Motorola reserves the right to make changes without further notice to any products herein. Motorola makes no
warranty, representation or guarantee regarding the suitability of its products for any particular purpose, nor does
Motorola assume any liability arising out of the application or use of any product or circuit, and specifically disclaims
any and all liability, including without limitation consequential or incidental damages. “Typical” parameters which may
be provided in Motorola data sheets and/or specifications can and do vary in different applications and actual
performance may vary over time. All operating parameters, including “Typicals” must be validated for each customer
application by customer’s technical experts. Motorola does not convey any license under its patent rights nor the
rights of others. Motorola products are not designed, intended, or authorized for use as components in systems
intended for surgical implant into the body, or other applications intended to support life, or for any other application in
which the failure of the Motorola product could create a situation where personal injury or death may occur. Should
Buyer purchase or use Motorola products for any such unintended or unauthorized application, Buyer shall indemnify
and hold Motorola and its officers, employees, subsidiaries, affiliates, and distributors harmless against all claims,
costs, damages, and expenses, and reasonable attorney fees arising out of, directly or indirectly, any claim of
personal injury or death associated with such unintended or unauthorized use, even if such claim alleges that
Motorola was negligent regarding the design or manufacture of the part.
Motorola and
are registered trademarks of Motorola, Inc. Motorola, Inc. is an Equal Opportunity/Affirmative
Action Employer.
All other tradenames, trademarks, and registered trademarks are the property of their respective owners.
© Copyright Motorola, Inc., 1999. All rights reserved.
Table of Contents
Chapter 1
Introduction
1.1
1.2
1.3
1.4
Features of the Debugger . . . . . . . . . . . . . . . . . . . . . . . . . . . . . . . . . . . . . . . . . . .
Configuring the Operating Environment . . . . . . . . . . . . . . . . . . . . . . . . . . . . . . .
Specifying a Command Converter . . . . . . . . . . . . . . . . . . . . . . . . . . . . . . . . . . . .
Entering Commands. . . . . . . . . . . . . . . . . . . . . . . . . . . . . . . . . . . . . . . . . . . . . . .
1-3
1-3
1-5
1-7
Chapter 2
Getting Started
2.1
2.2
2.3
2.4
2.5
2.6
2.7
2.8
Resetting the System . . . . . . . . . . . . . . . . . . . . . . . . . . . . . . . . . . . . . . . . . . . . . . 2-2
Setting and Clearing the Path. . . . . . . . . . . . . . . . . . . . . . . . . . . . . . . . . . . . . . . . 2-2
Loading Object Files . . . . . . . . . . . . . . . . . . . . . . . . . . . . . . . . . . . . . . . . . . . . . . 2-5
Setting Up the Display Environment . . . . . . . . . . . . . . . . . . . . . . . . . . . . . . . . . . 2-7
Using a Watch List. . . . . . . . . . . . . . . . . . . . . . . . . . . . . . . . . . . . . . . . . . . . . . . 2-10
Setting and Clearing Software Breakpoints . . . . . . . . . . . . . . . . . . . . . . . . . . . . 2-11
Setting and Clearing Hardware Breakpoints . . . . . . . . . . . . . . . . . . . . . . . . . . . 2-15
Starting Execution with Go . . . . . . . . . . . . . . . . . . . . . . . . . . . . . . . . . . . . . . . . 2-18
Chapter 3
Controlling Execution
3.1
3.2
3.3
3.4
3.5
3.6
3.7
3.8
3.9
3.10
3.11
3.12
3.13
3.14
Starting Execution with Go . . . . . . . . . . . . . . . . . . . . . . . . . . . . . . . . . . . . . . . . . 3-1
Step Through Instructions . . . . . . . . . . . . . . . . . . . . . . . . . . . . . . . . . . . . . . . . . . 3-3
Trace the Execution of Instructions . . . . . . . . . . . . . . . . . . . . . . . . . . . . . . . . . . . 3-4
Executing the Next Instruction . . . . . . . . . . . . . . . . . . . . . . . . . . . . . . . . . . . . . . 3-6
Providing an Until Condition. . . . . . . . . . . . . . . . . . . . . . . . . . . . . . . . . . . . . . . . 3-8
Software Breakpoints . . . . . . . . . . . . . . . . . . . . . . . . . . . . . . . . . . . . . . . . . . . . . . 3-9
Types of Software Breakpoints . . . . . . . . . . . . . . . . . . . . . . . . . . . . . . . . . . . . . 3-12
Hardware Breakpoints . . . . . . . . . . . . . . . . . . . . . . . . . . . . . . . . . . . . . . . . . . . . 3-16
Types of Hardware Breakpoints . . . . . . . . . . . . . . . . . . . . . . . . . . . . . . . . . . . . 3-20
Enabling and Disabling Breakpoints . . . . . . . . . . . . . . . . . . . . . . . . . . . . . . . . . 3-22
Using Expressions in Breakpoints . . . . . . . . . . . . . . . . . . . . . . . . . . . . . . . . . . . 3-23
Pausing Execution with Wait . . . . . . . . . . . . . . . . . . . . . . . . . . . . . . . . . . . . . . . 3-24
Allowing the Current Function to Finish . . . . . . . . . . . . . . . . . . . . . . . . . . . . . . 3-25
Stopping Program Execution . . . . . . . . . . . . . . . . . . . . . . . . . . . . . . . . . . . . . . . 3-26
Motorola
iii
Chapter 4
Object Files and Data Files
4.1
4.2
4.3
4.4
4.5
4.6
Displaying the Current Path. . . . . . . . . . . . . . . . . . . . . . . . . . . . . . . . . . . . . . . . .
To Set the Working Directory Path . . . . . . . . . . . . . . . . . . . . . . . . . . . . . . . . . . .
Loading Object Files . . . . . . . . . . . . . . . . . . . . . . . . . . . . . . . . . . . . . . . . . . . . . .
Saving Object Files . . . . . . . . . . . . . . . . . . . . . . . . . . . . . . . . . . . . . . . . . . . . . . .
Object Module Format . . . . . . . . . . . . . . . . . . . . . . . . . . . . . . . . . . . . . . . . . . . . .
Common Object File Format . . . . . . . . . . . . . . . . . . . . . . . . . . . . . . . . . . . . . . . .
4-1
4-2
4-4
4-5
4-7
4-8
Chapter 5
Managing Memory and Registers
5.1
5.2
5.3
5.4
5.5
5.6
5.7
5.8
Resetting the Device Registers . . . . . . . . . . . . . . . . . . . . . . . . . . . . . . . . . . . . . .
Displaying Register Values . . . . . . . . . . . . . . . . . . . . . . . . . . . . . . . . . . . . . . . . .
Changing Register Values . . . . . . . . . . . . . . . . . . . . . . . . . . . . . . . . . . . . . . . . . .
Displaying Memory Values . . . . . . . . . . . . . . . . . . . . . . . . . . . . . . . . . . . . . . . . .
Changing Memory Values . . . . . . . . . . . . . . . . . . . . . . . . . . . . . . . . . . . . . . . . . .
Copying Memory . . . . . . . . . . . . . . . . . . . . . . . . . . . . . . . . . . . . . . . . . . . . . . . . .
Disassembling Code Stored in Memory . . . . . . . . . . . . . . . . . . . . . . . . . . . . . . .
Using a Watch List. . . . . . . . . . . . . . . . . . . . . . . . . . . . . . . . . . . . . . . . . . . . . . . .
5-1
5-2
5-3
5-4
5-6
5-7
5-8
5-9
Chapter 6
Input and Output Files
6.1
6.2
6.3
6.4
6.5
How are I/O files formatted? . . . . . . . . . . . . . . . . . . . . . . . . . . . . . . . . . . . . . . . . 6-1
Assigning an Input File . . . . . . . . . . . . . . . . . . . . . . . . . . . . . . . . . . . . . . . . . . . . 6-4
Examples of How to Assign an Input File . . . . . . . . . . . . . . . . . . . . . . . . . . . . . . 6-7
Assigning an Output File . . . . . . . . . . . . . . . . . . . . . . . . . . . . . . . . . . . . . . . . . . 6-11
Examples of How to Assign an Output File . . . . . . . . . . . . . . . . . . . . . . . . . . . 6-13
Chapter 7
Debugger and Device Configurations
7.1
7.2
7.3
7.4
7.5
iv
To Set the Configuration of a Device . . . . . . . . . . . . . . . . . . . . . . . . . . . . . . . . .
Setting the Default Device . . . . . . . . . . . . . . . . . . . . . . . . . . . . . . . . . . . . . . . . . .
Changing the Radix . . . . . . . . . . . . . . . . . . . . . . . . . . . . . . . . . . . . . . . . . . . . . . .
Loading Debugger State Files . . . . . . . . . . . . . . . . . . . . . . . . . . . . . . . . . . . . . . .
Changing and Saving Window Preferences. . . . . . . . . . . . . . . . . . . . . . . . . . . . .
Suite56 ADS Debugger User’s Manual
7-2
7-4
7-5
7-7
7-8
Motorola
Chapter 8
Debugging C Source Code
8.1
8.2
8.3
8.4
8.5
8.6
Moving Up and Down the Call Stack . . . . . . . . . . . . . . . . . . . . . . . . . . . . . . . . .
Displaying the Call Stack . . . . . . . . . . . . . . . . . . . . . . . . . . . . . . . . . . . . . . . . . .
Monitoring C Function Calls . . . . . . . . . . . . . . . . . . . . . . . . . . . . . . . . . . . . . . . .
Enabling/Disabling IO Streams . . . . . . . . . . . . . . . . . . . . . . . . . . . . . . . . . . . . . .
Redirecting an I/O Stream . . . . . . . . . . . . . . . . . . . . . . . . . . . . . . . . . . . . . . . . . .
Displaying the Type of a C Expression . . . . . . . . . . . . . . . . . . . . . . . . . . . . . . . .
8-1
8-3
8-4
8-5
8-6
8-7
Chapter 9
Macros, Scripts, and Log Files
9.1
9.2
Creating and Running a Command Macro . . . . . . . . . . . . . . . . . . . . . . . . . . . . . 9-1
Logging Output from the Session Window . . . . . . . . . . . . . . . . . . . . . . . . . . . . . 9-2
Chapter 10
Expressions
10.1
10.2
10.3
10.4
10.5
10.6
10.7
Evaluate Expressions . . . . . . . . . . . . . . . . . . . . . . . . . . . . . . . . . . . . . . . . . . . . . 10-2
Using Memory Space Symbols . . . . . . . . . . . . . . . . . . . . . . . . . . . . . . . . . . . . . 10-3
Using Register Name Symbols . . . . . . . . . . . . . . . . . . . . . . . . . . . . . . . . . . . . . 10-3
Using Assembler Debug Symbols . . . . . . . . . . . . . . . . . . . . . . . . . . . . . . . . . . . 10-4
Using Constants . . . . . . . . . . . . . . . . . . . . . . . . . . . . . . . . . . . . . . . . . . . . . . . . . 10-6
Operators in Expressions . . . . . . . . . . . . . . . . . . . . . . . . . . . . . . . . . . . . . . . . . . 10-7
Setting Up and Modifying a Watch list . . . . . . . . . . . . . . . . . . . . . . . . . . . . . . 10-10
Chapter 11
Debugger Toolbar
11.1
11.2
11.3
11.4
11.5
11.6
11.7
11.8
Go Button. . . . . . . . . . . . . . . . . . . . . . . . . . . . . . . . . . . . . . . . . . . . . . . . . . . . . .
Stop Button . . . . . . . . . . . . . . . . . . . . . . . . . . . . . . . . . . . . . . . . . . . . . . . . . . . .
Step Button . . . . . . . . . . . . . . . . . . . . . . . . . . . . . . . . . . . . . . . . . . . . . . . . . . . .
Next Button . . . . . . . . . . . . . . . . . . . . . . . . . . . . . . . . . . . . . . . . . . . . . . . . . . . .
Finish Button . . . . . . . . . . . . . . . . . . . . . . . . . . . . . . . . . . . . . . . . . . . . . . . . . . .
Device Button . . . . . . . . . . . . . . . . . . . . . . . . . . . . . . . . . . . . . . . . . . . . . . . . . .
Repeat Button . . . . . . . . . . . . . . . . . . . . . . . . . . . . . . . . . . . . . . . . . . . . . . . . . .
Reset Button. . . . . . . . . . . . . . . . . . . . . . . . . . . . . . . . . . . . . . . . . . . . . . . . . . . .
Motorola
11-2
11-2
11-3
11-4
11-5
11-6
11-7
11-8
v
Chapter 12
Displayed Information
12.1
12.2
12.3
12.4
12.5
12.6
12.7
Displaying the Radix . . . . . . . . . . . . . . . . . . . . . . . . . . . . . . . . . . . . . . . . . . . . .
Display the Current Breakpoint . . . . . . . . . . . . . . . . . . . . . . . . . . . . . . . . . . . . .
Command Window . . . . . . . . . . . . . . . . . . . . . . . . . . . . . . . . . . . . . . . . . . . . . .
Session Window. . . . . . . . . . . . . . . . . . . . . . . . . . . . . . . . . . . . . . . . . . . . . . . . .
Assembly Window. . . . . . . . . . . . . . . . . . . . . . . . . . . . . . . . . . . . . . . . . . . . . . .
Source Window . . . . . . . . . . . . . . . . . . . . . . . . . . . . . . . . . . . . . . . . . . . . . . . . .
Stack Window . . . . . . . . . . . . . . . . . . . . . . . . . . . . . . . . . . . . . . . . . . . . . . . . . .
12-1
12-2
12-3
12-4
12-7
12-8
12-9
Chapter 13
Debugger Command Reference
13.1
13.2
13.3
13.4
13.5
13.6
13.7
13.8
13.9
13.10
13.11
13.12
13.13
13.14
13.15
13.16
13.17
13.18
13.19
13.20
13.21
13.22
13.23
13.24
13.25
13.26
13.27
vi
Entering Commands. . . . . . . . . . . . . . . . . . . . . . . . . . . . . . . . . . . . . . . . . . . . . . 13-4
Command Syntax. . . . . . . . . . . . . . . . . . . . . . . . . . . . . . . . . . . . . . . . . . . . . . . . 13-5
Command Parameters: List of Abbreviations . . . . . . . . . . . . . . . . . . . . . . . . . . 13-6
ASM - Single Line Interactive Assembler. . . . . . . . . . . . . . . . . . . . . . . . . . . . . 13-8
BREAK - Set, Modify, or Clear Breakpoints . . . . . . . . . . . . . . . . . . . . . . . . . 13-10
CCHANGE - Change Command Converter Memory . . . . . . . . . . . . . . . . . . . 13-15
CDISPLAY - Display Command Converter Flags and Memory . . . . . . . . . . 13-16
CFORCE - Assert Reset or Break on Command Converter . . . . . . . . . . . . . . 13-16
CGO - Execute OnCE Sequence . . . . . . . . . . . . . . . . . . . . . . . . . . . . . . . . . . . 13-17
CLOAD - Load OnCE Command Sequence . . . . . . . . . . . . . . . . . . . . . . . . . . 13-17
CSAVE - Save Command Converter Memory to a File . . . . . . . . . . . . . . . . . 13-18
CSTEP - Step Through OnCE Sequence . . . . . . . . . . . . . . . . . . . . . . . . . . . . . 13-18
CTRACE - Trace Through OnCE Sequence . . . . . . . . . . . . . . . . . . . . . . . . . . 13-19
CHANGE - Change Register or Memory Value . . . . . . . . . . . . . . . . . . . . . . . 13-20
COPY - Copy a Memory Block. . . . . . . . . . . . . . . . . . . . . . . . . . . . . . . . . . . . 13-21
DEVICE - Select Default Device. . . . . . . . . . . . . . . . . . . . . . . . . . . . . . . . . . . 13-22
DISASSEMBLE - Single Line Disassembler . . . . . . . . . . . . . . . . . . . . . . . . . 13-24
DISPLAY - Display Register or Memory . . . . . . . . . . . . . . . . . . . . . . . . . . . . 13-25
DOWN - Move Down the C Function Call Stack . . . . . . . . . . . . . . . . . . . . . . 13-26
EVALUATE - Evaluate an Expression . . . . . . . . . . . . . . . . . . . . . . . . . . . . . . 13-27
FINISH - Step Until End of Current Subroutine . . . . . . . . . . . . . . . . . . . . . . . 13-28
FORCE - Assert RESET or BREAK on Target. . . . . . . . . . . . . . . . . . . . . . . . 13-28
FRAME - Select C Function Call Stack Frame . . . . . . . . . . . . . . . . . . . . . . . . 13-29
GO - Execute DSP Program. . . . . . . . . . . . . . . . . . . . . . . . . . . . . . . . . . . . . . . 13-29
HELP - ADS Debugger Help. . . . . . . . . . . . . . . . . . . . . . . . . . . . . . . . . . . . . . 13-30
HOST - Change HOST Interface Address. . . . . . . . . . . . . . . . . . . . . . . . . . . . 13-31
INPUT - Assign Input File. . . . . . . . . . . . . . . . . . . . . . . . . . . . . . . . . . . . . . . . 13-32
Suite56 ADS Debugger User’s Manual
Motorola
13.28
13.29
13.30
13.31
13.32
13.33
13.34
13.35
13.36
13.37
13.38
13.39
13.40
13.41
13.42
13.43
13.44
13.45
13.46
13.47
13.48
13.49
13.50
13.51
13.52
13.53
13.54
13.55
13.56
13.57
13.58
13.59
13.60
13.61
13.62
13.63
LIST - List Source File Lines . . . . . . . . . . . . . . . . . . . . . . . . . . . . . . . . . . . . .
LOAD - Load DSP Files . . . . . . . . . . . . . . . . . . . . . . . . . . . . . . . . . . . . . . . . .
LOG - Log Commands or Session Output . . . . . . . . . . . . . . . . . . . . . . . . . . .
MORE - Enable/Disable Session Paging. . . . . . . . . . . . . . . . . . . . . . . . . . . . .
NEXT - Step Through Subroutine Calls or Macros . . . . . . . . . . . . . . . . . . . .
OUTPUT - Assign Output File . . . . . . . . . . . . . . . . . . . . . . . . . . . . . . . . . . . .
PATH - Define File Directory Path . . . . . . . . . . . . . . . . . . . . . . . . . . . . . . . . .
QUIT - Quit Debugger Session . . . . . . . . . . . . . . . . . . . . . . . . . . . . . . . . . . . .
RADIX - Change Input or Display Radix . . . . . . . . . . . . . . . . . . . . . . . . . . . .
REDIRECT - Redirect stdin/stdout/stderr for C Programs . . . . . . . . . . . . . . .
SAVE - Save Memory To File . . . . . . . . . . . . . . . . . . . . . . . . . . . . . . . . . . . .
STEP - Step Through DSP Program . . . . . . . . . . . . . . . . . . . . . . . . . . . . . . . .
STREAMS - Enable/Disable Handling of I/O for C Programs. . . . . . . . . . . .
SYSTEM - Execute Operating System Commands . . . . . . . . . . . . . . . . . . . .
TRACE - Trace Through DSP Program . . . . . . . . . . . . . . . . . . . . . . . . . . . . .
TYPE - Display the Result Type of a C Expression . . . . . . . . . . . . . . . . . . . .
UNLOCK - Unlock Password Protected Device Type . . . . . . . . . . . . . . . . . .
UNTIL - Step Until Address . . . . . . . . . . . . . . . . . . . . . . . . . . . . . . . . . . . . . .
UP - Move Up the C Function Call Stack . . . . . . . . . . . . . . . . . . . . . . . . . . . .
VIEW - Select Display Mode . . . . . . . . . . . . . . . . . . . . . . . . . . . . . . . . . . . . .
WAIT - Wait Specified Time . . . . . . . . . . . . . . . . . . . . . . . . . . . . . . . . . . . . .
WATCH - Set, Modify, View, or Clear Watch Item. . . . . . . . . . . . . . . . . . . .
WASM - GUI Assembly Window. . . . . . . . . . . . . . . . . . . . . . . . . . . . . . . . . .
WBREAKPOINT - GUI Breakpoint Window . . . . . . . . . . . . . . . . . . . . . . . .
WCALLS - GUI C Calls Stack Window . . . . . . . . . . . . . . . . . . . . . . . . . . . . .
WCOMMAND - GUI Command Window . . . . . . . . . . . . . . . . . . . . . . . . . . .
WHERE - GUI C Call Stack Window. . . . . . . . . . . . . . . . . . . . . . . . . . . . . . .
WINPUT - GUI File Input Window . . . . . . . . . . . . . . . . . . . . . . . . . . . . . . . .
WLIST - GUI List Window. . . . . . . . . . . . . . . . . . . . . . . . . . . . . . . . . . . . . . .
WMEMORY - GUI Memory Window . . . . . . . . . . . . . . . . . . . . . . . . . . . . . .
WOUTPUT - GUI File Output Window . . . . . . . . . . . . . . . . . . . . . . . . . . . . .
WREGISTER - GUI Register Window . . . . . . . . . . . . . . . . . . . . . . . . . . . . . .
WSESSION - GUI Session Window . . . . . . . . . . . . . . . . . . . . . . . . . . . . . . . .
WSOURCE - GUI Source Window . . . . . . . . . . . . . . . . . . . . . . . . . . . . . . . .
WSTACK - GUI Stack Window . . . . . . . . . . . . . . . . . . . . . . . . . . . . . . . . . . .
WWATCH - GUI Watch Window . . . . . . . . . . . . . . . . . . . . . . . . . . . . . . . . .
Motorola
13-35
13-36
13-37
13-38
13-39
13-40
13-42
13-43
13-44
13-44
13-45
13-46
13-47
13-47
13-48
13-49
13-50
13-50
13-51
13-51
13-51
13-52
13-53
13-53
13-54
13-54
13-54
13-55
13-55
13-56
13-56
13-56
13-57
13-57
13-58
13-58
vii
Chapter 14
Library Functions
14.1
14.2
14.3
14.4
14.5
14.6
14.7
14.8
viii
ADS Object Library Files . . . . . . . . . . . . . . . . . . . . . . . . . . . . . . . . . . . . . . . . . 14-2
Library Function Descriptions . . . . . . . . . . . . . . . . . . . . . . . . . . . . . . . . . . . . . . 14-7
Emulator Screen Management Functions . . . . . . . . . . . . . . . . . . . . . . . . . . . . 14-60
Non-Display Emulator . . . . . . . . . . . . . . . . . . . . . . . . . . . . . . . . . . . . . . . . . . . 14-64
Multiple Device Emulation . . . . . . . . . . . . . . . . . . . . . . . . . . . . . . . . . . . . . . . 14-68
Reserved Function Names . . . . . . . . . . . . . . . . . . . . . . . . . . . . . . . . . . . . . . . . 14-70
Emulator Global Variables. . . . . . . . . . . . . . . . . . . . . . . . . . . . . . . . . . . . . . . . 14-70
Modification of Emulator Global Structures . . . . . . . . . . . . . . . . . . . . . . . . . . 14-71
Suite56 ADS Debugger User’s Manual
Motorola
List of Tables
1-1
ADS Command Converter Switches . . . . . . . . . . . . . . . . . . . . . . . . . . . . 1-5
2-1
Software Breakpoint Actions . . . . . . . . . . . . . . . . . . . . . . . . . . . . . . . . . 2-13
2-2
Hardware Breakpoint Actions. . . . . . . . . . . . . . . . . . . . . . . . . . . . . . . . . 2-17
3-1
Software Breakpoint Actions . . . . . . . . . . . . . . . . . . . . . . . . . . . . . . . . . 3-11
3-2
Software Breakpoints (DEBUGcc) Available on the
DSP56000, DSP56100, DSP56300, and DSP56600 . . . . . . . . . . . . . 3-13
3-3
Software Breakpoints (FDEBUGcc) Available on the DSP96002. . . . . 3-15
3-4
Hardware Breakpoint Actions. . . . . . . . . . . . . . . . . . . . . . . . . . . . . . . . . 3-18
3-5
DSP56000 Device Family Hardware Breakpoint Types . . . . . . . . . . . . 3-20
3-6
DSP56100 Device Family Hardware Breakpoint Types . . . . . . . . . . . . 3-20
3-7
DSP56300 Device Family Hardware Breakpoint Types . . . . . . . . . . . . 3-20
3-8
DSP56600 Family Hardware Breakpoint Types. . . . . . . . . . . . . . . . . . . 3-21
3-9
DSP56800 Family Hardware Breakpoint Types. . . . . . . . . . . . . . . . . . . 3-21
3-10
DSP96000 Family Hardware Breakpoint Types. . . . . . . . . . . . . . . . . . . 3-21
3-11
List of Operators . . . . . . . . . . . . . . . . . . . . . . . . . . . . . . . . . . . . . . . . . . . 3-23
5-1
Sample P Memory Address Locations . . . . . . . . . . . . . . . . . . . . . . . . . . . 5-5
6-1
Input File Numbers for Specific Suite56 DSP Devices . . . . . . . . . . . . . . 6-5
6-2
Input File Memory Space and Destination Register . . . . . . . . . . . . . . . . . 6-5
6-3
Input File Assembly Code for DSP56000 Family . . . . . . . . . . . . . . . . . . 6-8
6-4
Input File Assembly Code for DSP56100 Family . . . . . . . . . . . . . . . . . . 6-8
6-5
Input File Assembly Code for DSP56300 Family . . . . . . . . . . . . . . . . . . 6-9
6-6
Input File Assembly Code for DSP56600 Family . . . . . . . . . . . . . . . . . . 6-9
6-7
Input File Assembly Code for DSP56800 Family . . . . . . . . . . . . . . . . . 6-10
6-8
Input File Assembly Code for DSP96000 Family . . . . . . . . . . . . . . . . . 6-10
6-9
Output File Designators for Specific Suite56 DSP Devices . . . . . . . . . . 6-11
6-10
Designations for Memory Space and Address Registers . . . . . . . . . . . . 6-12
6-11
Ouput File Assembly Code for DSP56000 Family. . . . . . . . . . . . . . . . . 6-14
6-12
Output File Assembly Code for DSP56100 Family . . . . . . . . . . . . . . . . 6-14
Motorola
ix
6-13
Output File Assembly Code for DSP56300 Family . . . . . . . . . . . . . . . . 6-15
6-14
Output File Assembly Code for DSP56600 Family . . . . . . . . . . . . . . . . 6-15
6-15
Output File Assembly Code for DSP56800 Family . . . . . . . . . . . . . . . . 6-16
6-16
Output File Assembly Code for DSP96000 Family . . . . . . . . . . . . . . . . 6-16
10-1
Symbol Names and Line Numbers . . . . . . . . . . . . . . . . . . . . . . . . . . . . . 10-5
13-1
Command Syntax . . . . . . . . . . . . . . . . . . . . . . . . . . . . . . . . . . . . . . . . . . 13-5
13-2
List of Abbreviations . . . . . . . . . . . . . . . . . . . . . . . . . . . . . . . . . . . . . . . 13-6
13-3
Examples of BREAK on DSP devices
with OnCE or JTAG/OnCE Ports . . . . . . . . . . . . . . . . . . . . . . . . . . 13-13
13-4
OUTPUT Command . . . . . . . . . . . . . . . . . . . . . . . . . . . . . . . . . . . . . . . 13-42
14-1
ads_—ADS-Specific Utility Routines. . . . . . . . . . . . . . . . . . . . . . . . . . 14-2
14-2
dspd_cc_—Command Converter Driver Level Routines . . . . . . . . . . 14-3
14-3
dspd_—Driver Level Routines . . . . . . . . . . . . . . . . . . . . . . . . . . . . . . . 14-3
14-4
dspt_—DSP Device Specific Routines . . . . . . . . . . . . . . . . . . . . . . . . 14-4
14-5
dsp_cc_—Command Converter Interface Routines. . . . . . . . . . . . . . . 14-4
14-6
dsp_—ADS Interface Routines . . . . . . . . . . . . . . . . . . . . . . . . . . . . . . . 14-5
14-7
sim_—User Interface Routines . . . . . . . . . . . . . . . . . . . . . . . . . . . . . . . 14-7
14-8
Emulator Screen Management Functions . . . . . . . . . . . . . . . . . . . . . . . 14-61
x
Suite56 ADS Debugger User’s Manual
Motorola
List of Figures
1-1
2-1
2-2
2-3
2-4
2-5
2-6
2-7
2-8
2-9
3-1
3-2
3-3
3-4
3-5
3-6
3-7
3-8
4-1
4-2
4-3
5-1
5-2
5-3
5-4
5-5
5-6
5-7
5-8
5-9
6-1
6-2
7-1
7-2
Motorola
DSP Debugger Command Window . . . . . . . . . . . . . . . . . . . . . . . . . . . . . . . 1-7
Setting the Working Directory Path. . . . . . . . . . . . . . . . . . . . . . . . . . . . . . . . 2-3
Loading a COFF (.cld) File . . . . . . . . . . . . . . . . . . . . . . . . . . . . . . . . . . . . . . . 2-5
Setting Up the Display Environment . . . . . . . . . . . . . . . . . . . . . . . . . . . . . . 2-7
A Typical Session Window Using the Suite56 Debugger. . . . . . . . . . . . . . 2-9
Add Item to a Watch List . . . . . . . . . . . . . . . . . . . . . . . . . . . . . . . . . . . . . . . 2-10
Setting a Software Breakpoint . . . . . . . . . . . . . . . . . . . . . . . . . . . . . . . . . . . 2-12
Clear Breakpoints Dialog Box. . . . . . . . . . . . . . . . . . . . . . . . . . . . . . . . . . . . 2-14
Setting a Hardware Breakpoint . . . . . . . . . . . . . . . . . . . . . . . . . . . . . . . . . . 2-16
Executing Instructions with Go . . . . . . . . . . . . . . . . . . . . . . . . . . . . . . . . . . 2-19
Executing Instructions with Go . . . . . . . . . . . . . . . . . . . . . . . . . . . . . . . . . . . 3-2
Step Through Program Instructions . . . . . . . . . . . . . . . . . . . . . . . . . . . . . . . 3-4
Trace Program Execution . . . . . . . . . . . . . . . . . . . . . . . . . . . . . . . . . . . . . . . . 3-5
Executing the Next Program Instruction . . . . . . . . . . . . . . . . . . . . . . . . . . . 3-6
Providing an Until Condition. . . . . . . . . . . . . . . . . . . . . . . . . . . . . . . . . . . . . 3-8
Setting a Software Breakpoint . . . . . . . . . . . . . . . . . . . . . . . . . . . . . . . . . . . 3-10
Setting a Hardware Breakpoint . . . . . . . . . . . . . . . . . . . . . . . . . . . . . . . . . . 3-17
Disable Breakpoints Dialog Box . . . . . . . . . . . . . . . . . . . . . . . . . . . . . . . . . . 3-22
Displaying Current Paths . . . . . . . . . . . . . . . . . . . . . . . . . . . . . . . . . . . . . . . . 4-1
Setting the Working Directory Path. . . . . . . . . . . . . . . . . . . . . . . . . . . . . . . . 4-2
Saving a COFF (.cld) File . . . . . . . . . . . . . . . . . . . . . . . . . . . . . . . . . . . . . . . . . 4-6
Open Register Window Dialog Box. . . . . . . . . . . . . . . . . . . . . . . . . . . . . . . . 5-2
Displaying the Register Values . . . . . . . . . . . . . . . . . . . . . . . . . . . . . . . . . . . 5-2
Changing the Value of Register . . . . . . . . . . . . . . . . . . . . . . . . . . . . . . . . . . . 5-3
Open Memory Window Dialog Box . . . . . . . . . . . . . . . . . . . . . . . . . . . . . . . 5-4
Displaying Memory Values . . . . . . . . . . . . . . . . . . . . . . . . . . . . . . . . . . . . . . 5-4
Changing the Value in Memory . . . . . . . . . . . . . . . . . . . . . . . . . . . . . . . . . . . 5-6
Copy Memory Dialog Box. . . . . . . . . . . . . . . . . . . . . . . . . . . . . . . . . . . . . . . . 5-7
Disassemble Memory Dialog Box . . . . . . . . . . . . . . . . . . . . . . . . . . . . . . . . . 5-8
Add Watch Expression to Window Dialog Box. . . . . . . . . . . . . . . . . . . . . . 5-9
Providing Input Data . . . . . . . . . . . . . . . . . . . . . . . . . . . . . . . . . . . . . . . . . . . . 6-6
Creating an Output File. . . . . . . . . . . . . . . . . . . . . . . . . . . . . . . . . . . . . . . . . 6-12
Setting the Configuration of a Device . . . . . . . . . . . . . . . . . . . . . . . . . . . . . . 7-2
Setting the Default Device. . . . . . . . . . . . . . . . . . . . . . . . . . . . . . . . . . . . . . . . 7-4
xi
7-3
7-4
7-5
8-1
8-2
8-3
8-4
8-5
8-6
10-1
10-2
11-1
11-2
11-3
11-4
11-5
11-6
11-7
11-8
12-1
12-2
12-3
12-4
12-5
12-6
13-1
xii
Changing the Radix of Input . . . . . . . . . . . . . . . . . . . . . . . . . . . . . . . . . . . . . 7-5
Displaying a Register or Memory Locations . . . . . . . . . . . . . . . . . . . . . . . . 7-6
Saving Window Status on Exit . . . . . . . . . . . . . . . . . . . . . . . . . . . . . . . . . . . . 7-8
Moving Up the Call Stack . . . . . . . . . . . . . . . . . . . . . . . . . . . . . . . . . . . . . . . . 8-1
Moving Down the Call Stack . . . . . . . . . . . . . . . . . . . . . . . . . . . . . . . . . . . . . 8-2
Displaying the Call Stack . . . . . . . . . . . . . . . . . . . . . . . . . . . . . . . . . . . . . . . . 8-3
Monitoring C Function Calls . . . . . . . . . . . . . . . . . . . . . . . . . . . . . . . . . . . . . 8-4
Redirecting the I/O Stream. . . . . . . . . . . . . . . . . . . . . . . . . . . . . . . . . . . . . . . 8-6
Displaying the Type of a C Variable or Expression . . . . . . . . . . . . . . . . . . 8-7
Evaluating an Expression . . . . . . . . . . . . . . . . . . . . . . . . . . . . . . . . . . . . . . . 10-2
Displaying a Value in a Watch List . . . . . . . . . . . . . . . . . . . . . . . . . . . . . . 10-10
Go Button. . . . . . . . . . . . . . . . . . . . . . . . . . . . . . . . . . . . . . . . . . . . . . . . . . . . . 11-2
Stop Button . . . . . . . . . . . . . . . . . . . . . . . . . . . . . . . . . . . . . . . . . . . . . . . . . . . 11-2
Step Button . . . . . . . . . . . . . . . . . . . . . . . . . . . . . . . . . . . . . . . . . . . . . . . . . . . 11-3
Next Button . . . . . . . . . . . . . . . . . . . . . . . . . . . . . . . . . . . . . . . . . . . . . . . . . . . 11-4
Finish Button . . . . . . . . . . . . . . . . . . . . . . . . . . . . . . . . . . . . . . . . . . . . . . . . . . 11-5
Device Button . . . . . . . . . . . . . . . . . . . . . . . . . . . . . . . . . . . . . . . . . . . . . . . . . 11-6
Repeat Button . . . . . . . . . . . . . . . . . . . . . . . . . . . . . . . . . . . . . . . . . . . . . . . . . 11-7
Reset Button . . . . . . . . . . . . . . . . . . . . . . . . . . . . . . . . . . . . . . . . . . . . . . . . . . 11-8
Breakpoints . . . . . . . . . . . . . . . . . . . . . . . . . . . . . . . . . . . . . . . . . . . . . . . . . . . 12-2
Command Window . . . . . . . . . . . . . . . . . . . . . . . . . . . . . . . . . . . . . . . . . . . . 12-3
Session Window . . . . . . . . . . . . . . . . . . . . . . . . . . . . . . . . . . . . . . . . . . . . . . . 12-5
Pausing Output to the Session Window . . . . . . . . . . . . . . . . . . . . . . . . . . . 12-6
Assembly Window. . . . . . . . . . . . . . . . . . . . . . . . . . . . . . . . . . . . . . . . . . . . . 12-7
Source Window . . . . . . . . . . . . . . . . . . . . . . . . . . . . . . . . . . . . . . . . . . . . . . . 12-8
ADS Debugger Command Window . . . . . . . . . . . . . . . . . . . . . . . . . . . . . . 13-4
Suite56 ADS Debugger User’s Manual
Motorola
List of Examples
1-1
6-1
6-2
6-3
13-1
13-2
13-3
13-4
13-5
13-6
13-7
13-8
13-9
13-10
13-11
13-12
13-13
13-14
13-15
13-17
13-16
13-18
13-19
13-21
13-20
13-22
13-24
13-23
13-26
13-25
13-27
13-28
Motorola
ADS Switches for Command Converters . . . . . . . . . . . . . . . . . . . . . . . . . . . 1-6
Repeating Data Values. . . . . . . . . . . . . . . . . . . . . . . . . . . . . . . . . . . . . . . . . . . 6-2
User Comment . . . . . . . . . . . . . . . . . . . . . . . . . . . . . . . . . . . . . . . . . . . . . . . . . 6-2
Input Data Values to Memory . . . . . . . . . . . . . . . . . . . . . . . . . . . . . . . . . . . . 6-3
ASM Commands . . . . . . . . . . . . . . . . . . . . . . . . . . . . . . . . . . . . . . . . . . . . . . 13-9
Examples of the CChange Command . . . . . . . . . . . . . . . . . . . . . . . . . . . . 13-15
CDISPLAY Commands . . . . . . . . . . . . . . . . . . . . . . . . . . . . . . . . . . . . . . . . 13-16
CFORCE Command . . . . . . . . . . . . . . . . . . . . . . . . . . . . . . . . . . . . . . . . . . . 13-17
CGO Command . . . . . . . . . . . . . . . . . . . . . . . . . . . . . . . . . . . . . . . . . . . . . . 13-17
CLOAD Command . . . . . . . . . . . . . . . . . . . . . . . . . . . . . . . . . . . . . . . . . . . 13-17
CSAVE Command . . . . . . . . . . . . . . . . . . . . . . . . . . . . . . . . . . . . . . . . . . . . 13-18
CSTEP Command. . . . . . . . . . . . . . . . . . . . . . . . . . . . . . . . . . . . . . . . . . . . . 13-19
CSTEP Command in a Macro . . . . . . . . . . . . . . . . . . . . . . . . . . . . . . . . . . . 13-19
CTRACE Command. . . . . . . . . . . . . . . . . . . . . . . . . . . . . . . . . . . . . . . . . . . 13-20
CTRACE Command in a Macro . . . . . . . . . . . . . . . . . . . . . . . . . . . . . . . . . 13-20
CHANGE Command . . . . . . . . . . . . . . . . . . . . . . . . . . . . . . . . . . . . . . . . . . 13-21
COPY Command . . . . . . . . . . . . . . . . . . . . . . . . . . . . . . . . . . . . . . . . . . . . . 13-22
DEVICE Command . . . . . . . . . . . . . . . . . . . . . . . . . . . . . . . . . . . . . . . . . . . 13-24
DISASSEMBLE Command . . . . . . . . . . . . . . . . . . . . . . . . . . . . . . . . . . . . . 13-24
DOWN Command . . . . . . . . . . . . . . . . . . . . . . . . . . . . . . . . . . . . . . . . . . . . 13-26
DISPLAY Command . . . . . . . . . . . . . . . . . . . . . . . . . . . . . . . . . . . . . . . . . . 13-26
EVALUATE Command . . . . . . . . . . . . . . . . . . . . . . . . . . . . . . . . . . . . . . . . 13-27
FINISH Command . . . . . . . . . . . . . . . . . . . . . . . . . . . . . . . . . . . . . . . . . . . . 13-28
FRAME Command. . . . . . . . . . . . . . . . . . . . . . . . . . . . . . . . . . . . . . . . . . . . 13-29
FORCE Command . . . . . . . . . . . . . . . . . . . . . . . . . . . . . . . . . . . . . . . . . . . . 13-29
GO Command . . . . . . . . . . . . . . . . . . . . . . . . . . . . . . . . . . . . . . . . . . . . . . . . 13-30
HOST Command . . . . . . . . . . . . . . . . . . . . . . . . . . . . . . . . . . . . . . . . . . . . . 13-31
HELP Command . . . . . . . . . . . . . . . . . . . . . . . . . . . . . . . . . . . . . . . . . . . . . 13-31
Examples of Input File Data . . . . . . . . . . . . . . . . . . . . . . . . . . . . . . . . . . . . 13-34
INPUT Command . . . . . . . . . . . . . . . . . . . . . . . . . . . . . . . . . . . . . . . . . . . . 13-34
Examples of Terminal Input Within an Input File . . . . . . . . . . . . . . . . . 13-35
LIST Command. . . . . . . . . . . . . . . . . . . . . . . . . . . . . . . . . . . . . . . . . . . . . . . 13-36
xiii
13-29
13-30
13-31
13-32
13-34
13-33
13-35
13-36
13-37
13-39
13-38
13-40
13-42
13-41
13-43
13-44
13-45
13-46
13-47
13-48
13-49
13-50
13-51
13-52
13-53
13-54
13-55
13-57
13-56
13-58
13-59
13-60
13-61
13-62
14-1
14-2
xiv
LOAD Command . . . . . . . . . . . . . . . . . . . . . . . . . . . . . . . . . . . . . . . . . . . . . 13-37
LOG Command . . . . . . . . . . . . . . . . . . . . . . . . . . . . . . . . . . . . . . . . . . . . . . 13-38
MORE Command . . . . . . . . . . . . . . . . . . . . . . . . . . . . . . . . . . . . . . . . . . . . . 13-39
NEXT Command . . . . . . . . . . . . . . . . . . . . . . . . . . . . . . . . . . . . . . . . . . . . . 13-39
QUIT Command . . . . . . . . . . . . . . . . . . . . . . . . . . . . . . . . . . . . . . . . . . . . . . 13-43
PATH Command . . . . . . . . . . . . . . . . . . . . . . . . . . . . . . . . . . . . . . . . . . . . . 13-43
RADIX Command . . . . . . . . . . . . . . . . . . . . . . . . . . . . . . . . . . . . . . . . . . . . 13-44
REDIRECT Command . . . . . . . . . . . . . . . . . . . . . . . . . . . . . . . . . . . . . . . . . 13-45
SAVE Command . . . . . . . . . . . . . . . . . . . . . . . . . . . . . . . . . . . . . . . . . . . . . 13-46
STREAMS Command . . . . . . . . . . . . . . . . . . . . . . . . . . . . . . . . . . . . . . . . . 13-47
STEP Command . . . . . . . . . . . . . . . . . . . . . . . . . . . . . . . . . . . . . . . . . . . . . . 13-47
SYSTEM Command . . . . . . . . . . . . . . . . . . . . . . . . . . . . . . . . . . . . . . . . . . . 13-48
TYPE Command . . . . . . . . . . . . . . . . . . . . . . . . . . . . . . . . . . . . . . . . . . . . . . 13-49
TRACE Command . . . . . . . . . . . . . . . . . . . . . . . . . . . . . . . . . . . . . . . . . . . . 13-49
UNLOCK Command . . . . . . . . . . . . . . . . . . . . . . . . . . . . . . . . . . . . . . . . . . 13-50
UNTIL Command . . . . . . . . . . . . . . . . . . . . . . . . . . . . . . . . . . . . . . . . . . . . 13-50
UP Command . . . . . . . . . . . . . . . . . . . . . . . . . . . . . . . . . . . . . . . . . . . . . . . . 13-51
VIEW Command . . . . . . . . . . . . . . . . . . . . . . . . . . . . . . . . . . . . . . . . . . . . . 13-51
WAIT Command . . . . . . . . . . . . . . . . . . . . . . . . . . . . . . . . . . . . . . . . . . . . . 13-52
WATCH Command . . . . . . . . . . . . . . . . . . . . . . . . . . . . . . . . . . . . . . . . . . . 13-52
WASM Command . . . . . . . . . . . . . . . . . . . . . . . . . . . . . . . . . . . . . . . . . . . . 13-53
WBREAKPOINT Command. . . . . . . . . . . . . . . . . . . . . . . . . . . . . . . . . . . . 13-53
WCALLS Command . . . . . . . . . . . . . . . . . . . . . . . . . . . . . . . . . . . . . . . . . . 13-54
WCOMMAND Command . . . . . . . . . . . . . . . . . . . . . . . . . . . . . . . . . . . . . 13-54
WHERE Command . . . . . . . . . . . . . . . . . . . . . . . . . . . . . . . . . . . . . . . . . . . 13-54
WINPUT Command . . . . . . . . . . . . . . . . . . . . . . . . . . . . . . . . . . . . . . . . . . 13-55
WLIST Command. . . . . . . . . . . . . . . . . . . . . . . . . . . . . . . . . . . . . . . . . . . . . 13-55
WOUTPUT Command . . . . . . . . . . . . . . . . . . . . . . . . . . . . . . . . . . . . . . . . 13-56
WMEMORY Command. . . . . . . . . . . . . . . . . . . . . . . . . . . . . . . . . . . . . . . . 13-56
WREGISTER Command . . . . . . . . . . . . . . . . . . . . . . . . . . . . . . . . . . . . . . . 13-57
WSESSION Command . . . . . . . . . . . . . . . . . . . . . . . . . . . . . . . . . . . . . . . . 13-57
WSOURCE Command. . . . . . . . . . . . . . . . . . . . . . . . . . . . . . . . . . . . . . . . . 13-57
WSTACK Command . . . . . . . . . . . . . . . . . . . . . . . . . . . . . . . . . . . . . . . . . . 13-58
WWATCH Command . . . . . . . . . . . . . . . . . . . . . . . . . . . . . . . . . . . . . . . . . 13-58
ads_cache_registers() . . . . . . . . . . . . . . . . . . . . . . . . . . . . . . . . . . . . . . . . . . . 14-8
ads_startup() . . . . . . . . . . . . . . . . . . . . . . . . . . . . . . . . . . . . . . . . . . . . . . . . . . 14-9
Suite56 ADS Debugger User’s Manual
Motorola
14-3
14-4
14-5
14-6
14-7
14-8
14-9
14-10
14-11
14-12
14-13
14-14
14-15
14-16
14-17
14-18
14-19
14-20
14-21
14-22
14-23
14-24
14-25
14-26
14-27
14-28
14-29
14-30
14-31
14-32
14-33
14-34
14-35
14-36
14-37
14-38
Motorola
dspd_break() . . . . . . . . . . . . . . . . . . . . . . . . . . . . . . . . . . . . . . . . . . . . . . . . .
dspd_cc_architecture() . . . . . . . . . . . . . . . . . . . . . . . . . . . . . . . . . . . . . . . .
dspd_cc_read_flag(). . . . . . . . . . . . . . . . . . . . . . . . . . . . . . . . . . . . . . . . . . .
dspd_cc_read_memory() . . . . . . . . . . . . . . . . . . . . . . . . . . . . . . . . . . . . . .
dspd_cc_reset() . . . . . . . . . . . . . . . . . . . . . . . . . . . . . . . . . . . . . . . . . . . . . . .
dspd_cc_revision() . . . . . . . . . . . . . . . . . . . . . . . . . . . . . . . . . . . . . . . . . . .
dspd_cc_write_flag() . . . . . . . . . . . . . . . . . . . . . . . . . . . . . . . . . . . . . . . . . .
dspd_cc_write_memory() . . . . . . . . . . . . . . . . . . . . . . . . . . . . . . . . . . . . . .
dspd_check_service_request() . . . . . . . . . . . . . . . . . . . . . . . . . . . . . . . . . .
dspd_fill_memory() . . . . . . . . . . . . . . . . . . . . . . . . . . . . . . . . . . . . . . . . . .
dspd_go(). . . . . . . . . . . . . . . . . . . . . . . . . . . . . . . . . . . . . . . . . . . . . . . . . . . .
dspd_jtag_reset() . . . . . . . . . . . . . . . . . . . . . . . . . . . . . . . . . . . . . . . . . . . . .
dspd_read_core_registers() . . . . . . . . . . . . . . . . . . . . . . . . . . . . . . . . . . . .
dspd_read_memory() . . . . . . . . . . . . . . . . . . . . . . . . . . . . . . . . . . . . . . . . .
dspd_read_once_registers() . . . . . . . . . . . . . . . . . . . . . . . . . . . . . . . . . . . .
dspd_reset(). . . . . . . . . . . . . . . . . . . . . . . . . . . . . . . . . . . . . . . . . . . . . . . . . .
dspd_status() . . . . . . . . . . . . . . . . . . . . . . . . . . . . . . . . . . . . . . . . . . . . . . . .
dspd_write_core_registers() . . . . . . . . . . . . . . . . . . . . . . . . . . . . . . . . . . . .
dspd_write_memory(). . . . . . . . . . . . . . . . . . . . . . . . . . . . . . . . . . . . . . . . .
dspd_write_once_registers() . . . . . . . . . . . . . . . . . . . . . . . . . . . . . . . . . . .
dspt_masm_xxxxx() . . . . . . . . . . . . . . . . . . . . . . . . . . . . . . . . . . . . . . . . . . .
dspt_unasm_xxxxx() . . . . . . . . . . . . . . . . . . . . . . . . . . . . . . . . . . . . . . . . . .
dsp_alloc() . . . . . . . . . . . . . . . . . . . . . . . . . . . . . . . . . . . . . . . . . . . . . . . . . . .
dsp_cc_fmem() . . . . . . . . . . . . . . . . . . . . . . . . . . . . . . . . . . . . . . . . . . . . . . .
dsp_cc_go() . . . . . . . . . . . . . . . . . . . . . . . . . . . . . . . . . . . . . . . . . . . . . . . . . .
dsp_cc_ldmem() . . . . . . . . . . . . . . . . . . . . . . . . . . . . . . . . . . . . . . . . . . . . . .
dsp_cc_reset() . . . . . . . . . . . . . . . . . . . . . . . . . . . . . . . . . . . . . . . . . . . . . . . .
dsp_cc_revision() . . . . . . . . . . . . . . . . . . . . . . . . . . . . . . . . . . . . . . . . . . . . .
dsp_cc_rmem() . . . . . . . . . . . . . . . . . . . . . . . . . . . . . . . . . . . . . . . . . . . . . . .
dsp_cc_rmem_blk() . . . . . . . . . . . . . . . . . . . . . . . . . . . . . . . . . . . . . . . . . . .
dsp_cc_wmem() . . . . . . . . . . . . . . . . . . . . . . . . . . . . . . . . . . . . . . . . . . . . . .
dsp_cc_wmem_blk() . . . . . . . . . . . . . . . . . . . . . . . . . . . . . . . . . . . . . . . . . .
dsp_check_service_request() . . . . . . . . . . . . . . . . . . . . . . . . . . . . . . . . . . .
dsp_findmem() . . . . . . . . . . . . . . . . . . . . . . . . . . . . . . . . . . . . . . . . . . . . . . .
dsp_findreg() . . . . . . . . . . . . . . . . . . . . . . . . . . . . . . . . . . . . . . . . . . . . . . . .
dsp_fmem() . . . . . . . . . . . . . . . . . . . . . . . . . . . . . . . . . . . . . . . . . . . . . . . . . .
14-10
14-10
14-11
14-12
14-13
14-14
14-15
14-16
14-17
14-18
14-19
14-19
14-20
14-21
14-22
14-23
14-24
14-25
14-26
14-26
14-27
14-28
14-29
14-30
14-30
14-31
14-32
14-32
14-33
14-34
14-35
14-36
14-37
14-38
14-38
14-39
xv
14-39
14-40
14-41
14-42
14-43
14-44
14-45
14-46
14-47
14-48
14-49
14-50
14-51
14-52
14-53
14-54
14-55
14-56
14-57
14-58
14-59
14-60
14-61
14-62
14-63
14-64
14-65
14-66
14-67
xvi
dsp_free() . . . . . . . . . . . . . . . . . . . . . . . . . . . . . . . . . . . . . . . . . . . . . . . . . . . .
dsp_free_mem() . . . . . . . . . . . . . . . . . . . . . . . . . . . . . . . . . . . . . . . . . . . . . .
dsp_go() . . . . . . . . . . . . . . . . . . . . . . . . . . . . . . . . . . . . . . . . . . . . . . . . . . . . .
dsp_go_address() . . . . . . . . . . . . . . . . . . . . . . . . . . . . . . . . . . . . . . . . . . . . .
dsp_go_reset(). . . . . . . . . . . . . . . . . . . . . . . . . . . . . . . . . . . . . . . . . . . . . . . .
dsp_init() . . . . . . . . . . . . . . . . . . . . . . . . . . . . . . . . . . . . . . . . . . . . . . . . . . . .
dsp_ldmem() . . . . . . . . . . . . . . . . . . . . . . . . . . . . . . . . . . . . . . . . . . . . . . . . .
dsp_load() . . . . . . . . . . . . . . . . . . . . . . . . . . . . . . . . . . . . . . . . . . . . . . . . . . .
dsp_new() . . . . . . . . . . . . . . . . . . . . . . . . . . . . . . . . . . . . . . . . . . . . . . . . . . .
dsp_load() . . . . . . . . . . . . . . . . . . . . . . . . . . . . . . . . . . . . . . . . . . . . . . . . . . .
dsp_realloc() . . . . . . . . . . . . . . . . . . . . . . . . . . . . . . . . . . . . . . . . . . . . . . . . .
dsp_reset() . . . . . . . . . . . . . . . . . . . . . . . . . . . . . . . . . . . . . . . . . . . . . . . . . . .
dsp_rmem() . . . . . . . . . . . . . . . . . . . . . . . . . . . . . . . . . . . . . . . . . . . . . . . . . .
dsp_rmem_blk() . . . . . . . . . . . . . . . . . . . . . . . . . . . . . . . . . . . . . . . . . . . . . .
dsp_rreg() . . . . . . . . . . . . . . . . . . . . . . . . . . . . . . . . . . . . . . . . . . . . . . . . . . .
dsp_save . . . . . . . . . . . . . . . . . . . . . . . . . . . . . . . . . . . . . . . . . . . . . . . . . . . .
dsp_spath() . . . . . . . . . . . . . . . . . . . . . . . . . . . . . . . . . . . . . . . . . . . . . . . . . .
dsp_startup() . . . . . . . . . . . . . . . . . . . . . . . . . . . . . . . . . . . . . . . . . . . . . . . . .
dsp_status() . . . . . . . . . . . . . . . . . . . . . . . . . . . . . . . . . . . . . . . . . . . . . . . . . .
dsp_step() . . . . . . . . . . . . . . . . . . . . . . . . . . . . . . . . . . . . . . . . . . . . . . . . . . .
dsp_stop() . . . . . . . . . . . . . . . . . . . . . . . . . . . . . . . . . . . . . . . . . . . . . . . . . . .
dsp_unlock() . . . . . . . . . . . . . . . . . . . . . . . . . . . . . . . . . . . . . . . . . . . . . . . . .
dsp_wmem() . . . . . . . . . . . . . . . . . . . . . . . . . . . . . . . . . . . . . . . . . . . . . . . . .
dsp_wmem_blk() . . . . . . . . . . . . . . . . . . . . . . . . . . . . . . . . . . . . . . . . . . . . .
dsp_wreg(). . . . . . . . . . . . . . . . . . . . . . . . . . . . . . . . . . . . . . . . . . . . . . . . . . .
sim_docmd() . . . . . . . . . . . . . . . . . . . . . . . . . . . . . . . . . . . . . . . . . . . . . . . . .
sim_gmcmd() . . . . . . . . . . . . . . . . . . . . . . . . . . . . . . . . . . . . . . . . . . . . . . . .
sim_gtcmd(). . . . . . . . . . . . . . . . . . . . . . . . . . . . . . . . . . . . . . . . . . . . . . . . . .
Device Structures Creation . . . . . . . . . . . . . . . . . . . . . . . . . . . . . . . . . . . . .
Suite56 ADS Debugger User’s Manual
14-40
14-41
14-41
14-42
14-43
14-43
14-44
14-44
14-45
14-46
14-47
14-47
14-48
14-49
14-50
14-51
14-52
14-52
14-53
14-54
14-54
14-55
14-56
14-57
14-58
14-59
14-59
14-60
14-65
Motorola
Chapter 1
Introduction
Motorola’s Suite56 DSP Application Development System (ADS) is a development tool
used to design real-time signal processing systems. The ADS consolidates complex
hardware and software development tools within a low-cost workstation environment and
runs on most of the well-supported operating systems, such as Windows, HP-UX, Sun and
Solaris. By providing a solid foundation for application development and test, the ADS
significantly reduces development costs and time-to-market. The versatile ADS not only
allows rapid initial development, but also supports comprehensive testing of prototype
designs.
The four ADS components are the following:
•
Host-Bus Interface Board—There are two types of boards available: 16-bit ISA bus
(for PC-compatibles and HP7xx workstations) and SBus (for Sun and SPARC
workstations).
•
Command Converter (CC)— The command converter takes care of communication
between your host computer and the target system. Motorola’s ADS offers several
different command converters, based on your development needs. For details of
each command converter, see the user manual for the particular command
converter that you are using.
•
Control, Development, and Debugging Software—This software is available for
the following operating systems: Windows® 95, Windows NT® 4.0, HP-UX 9.x,
Sun OS 4.x, and Solaris 5.x.
•
Application Development Module (ADM)—This module supports development
and testing with a specific device (a DSP chip).
Motorola DSPs have a common OnCE™ (on-chip emulation) module that allows the
development tools to have identical features. Using the concept of a common serial debug
port, Motorola has developed one set of tools which allows you to communicate with any
Motorola DSP architecture through a command converter. In some Motorola DSPs, this
module uses a dedicated OnCE serial port to access the internal module. In other Motorola
DSPs, the internal OnCE module is addressed by using the IEEE Joint Test Action Group
Motorola
Introduction
1-1
(JTAG) 4-wire Test Access Port (TAP) Boundary Scan Architecture protocol. Motorola’s
DSP software tools can use either the direct OnCE serial port or the JTAG serial port.
The ADS provides a tool for designing, debugging, and evaluating DSP-based systems. It
consists of three hardware circuit boards, and two software programs. The hardware
circuit boards are the host-bus interface, command converter, and the ADM. The two
software programs are the ADS user interface program which is executed on the host
computer and the Command Converter monitor program.
The ADM card has a 14-pin connector which provides an access point for the command
converter’s JTAG/OnCE interface. You can use the ADS as an emulator to debug the
hardware or software for a defined target system; to do so, you must provide an access
point on the target hardware for a 14-pin JTAG/OnCE interface cable, which may be as
simple as a 2 row x 7 set of test points.
The software program provides the routines necessary for the user to communicate with
the target DSP on the ADM or the target application. The software program’s powerful
commands enable you to perform a variety of tasks. You can make operating system
command calls from within the program, or you can make temporary exits to the operating
system without disturbing current setups to the target DSP.
Note that the individual ADM user’s manuals specify which version of the software to
load (e.g., DSP56301ADM uses the ADS56300 or GDS56300 software). The macro
command filename (default .cmd extension) is an optional parameter. The macro
command file should contain a sequence of commands to execute upon ADS start-up and
prior to command entry from the keyboard. You can “nest” macro commands to any level
(a macro command file may call another macro command file). You generate the macro
commands from within the ADS program using the log command. Refer to Section 13.30,
“LOG - Log Commands or Session Output,” on page 13-37 for further details. If you are
working on a host computer which invokes the ADS using a mouse, it may not be easy to
invoke the user interface program with a macro command file. To solve this problem the
ADS searches for a specific file named startup.cmd in the same directory from which the
ADS is invoked. If the ADS finds startup.cmd, it is opened as a macro command file and
the commands are executed prior to checking for the optional macro command file
argument.
The host-bus to ADM interface board provides a physical link between the host computer
and the ADM via a parallel data path and a control-bus cable. The parallel data path
enables high-speed data transfers. The control bus signals enable the host computer to
reset, interrupt, and send commands to ADMs simultaneously or sequentially.
The ADM is the basic platform for evaluating the DSP. It contains a DSP chip with a
JTAG/OnCE interface connector to configure it as a slave to the host computer or as a
1-2
Suite56 ADS Debugger User’s Manual
Motorola
Configuring the Operating Environment
stand-alone unit. In the slave configuration, the user controls the DSP processor and is
able to interrogate its status. This enables the user to debug hardware and software easily.
In the stand-alone configuration, a user program resident in ROM controls the ADM and
may be used as a prototype system for an end product.
For more information see section 1.1, “Features of the Debugger,” section 1.2,
“Configuring the Operating Environment,” section 1.3, “Entering Commands,” and See
“Getting Started” on page 1..
1.1 Features of the Debugger
Features of the Motorola DSP Debugger include the following:
•
Single/multiple stepping through DSP programs
•
Source-level symbolic debug of assembly and C source programs
•
Conditional or unconditional software and hardware breakpoints
•
Program patching using a single-line assembler
•
Session and/or command logging for later reference
•
Loading and saving of files to/from ADM memory
•
Macro command definition and execution
•
Display registers and memory
•
Debug commands supporting multiple DSP development
•
Hexadecimal/decimal/binary/fractional/floating-point calculator
•
Multiple input/output file access from DSP object programs
•
On-line help screens for each command and DSP register
•
Compatibility with Motorola’s Suite56 DSP Assembler & Simulator
•
Single command converter supporting OnCE and JTAG protocols
1.2 Configuring the Operating Environment
The ADS hardware and software is supported on the following platforms:
•
PC-compatibles
•
Hewlett Packard HP-UX 9.x operating system
•
Sun 4.x operating system
•
Solaris 5.x operating system
Motorola
Introduction
1-3
Specifying a Command Converter
1.2.1 PC-Compatible Requirements
A PC-compatible computer should meet the following minimum requirements:
•
Processor: 486, 100 MHZ or faster
•
Memory: 32 Mbytes of RAM
•
Operating system: Windows 95 or Windows NT 4.0
•
Storage: 8 Mbytes of free space on hard drive
•
Peripherals: mouse, keyboard, CD-ROM drive
•
Ports: One 16-bit I/O ISA expansion slot
•
Addresses: free I/O addresses 100-102 hex, or 200-202 hex, or 300-302 hex
1.2.2 Hewlett Packard Requirements
An HP workstation should meet the following minimum requirements:
•
HP workstation running HP-UX Version 9.x (10.x is not supported)
•
Hard drive with 12 Mbytes of free space
•
Mouse and keyboard
•
One EISA expansion slot
1.2.3 Sun Workstation Requirements
A Sun workstations should meet the following minimum requirements:
•
SUN Operating System Release 4.1.1 or later or SOLARIS Release 5.1 or later
•
Hard drive with 12 Mbytes of free space
•
Mouse and keyboard
•
One Sbus expansion slot
1.3 Specifying a Command Converter
Depending on the ADS that you using, you may have several options for the type of
command converter that you use. The type of command converter that you are using must
be indicated when you launch the ADS Debugger software. You indicate the type of
command converter by including certain switches with the command that starts the ADS
Debugger software. If you do not properly specify the type of command converter, the
ADS Debugger software will not be able to communicate with the target board (ADM).
1-4
Suite56 ADS Debugger User’s Manual
Motorola
Specifying a Command Converter
Table 1-1. ADS Command Converter Switches
Type of
Command
Converter
(CC)
Operating
System
Command Switch to use when starting the
ADS Debugger
Comments
UCC
Win 95/98
-d <port>
where port can equal 100,
200, or 300
UCC
Win NT
-d UCC
UCC indicates that a Universal
Command Converter (UCC) is
connected.
UCC
SunOS4,
Solaris,
HP-UX 9, and
HP-UX 10.2
-d <driver_name>
The default <driver_name>
is /dev/mdsp0
The driver name will vary if
installed to a directory other
than /dev
Parallel Port
Win 95/98/NT
-d parallel:#
# can be 1, 2, or 3 denoting
LPT1 LPT2 LPT3
Ethernet
all operating
systems
-d ethernet:<IP/hostname>
PCI
Win 95/98/NT
-d pci
Motorola
Introduction
<IP /hostname> denotes IP
address or hostname of the
command converter
1-5
Specifying a Command Converter
The following table contains examples of switches used to launch the ADS Debugger for
various command converters.
Example 1-1. ADS Switches for Command Converters
Command Example
Explanation
ads56300 -d 300
Launches the text version of the ADS Debugger for the
DSP56300. Assuming that the Debugger is running on
Win95 or Win98, the switch indicates that the command
converter being used is a Universal Command Converter
(UCC) addressed on port 300.
ads56300 -d UCC
Launches the text version of the ADS Debugger for the
DSP56300. Assuming that the Debugger is running on a
Win NT operating system, the switch indicates that the
command converter being used is a Universal Command
Converter (UCC).
ads56300 -d /dev/mdsp0
Launches the text version of the ADS Debugger for the
DSP56300. Assuming that the Debugger is running on a
UNIX operating system, the switch indicates that the
command converter being used is a Universal Command
Converter (UCC).
gds56300 -d parallel:3
Launches the GUI version of the ADS Debugger for the
DSP56300. The switch indicates that the command
converter being used is a parallel port command
converter located on the LPT3 port.
gds56800 -d pci
Launches the GUI version of the ADS Debugger for the
DSP56800. The switch indicates that the command
converter being used is a PCI command converter.
gds56600 -d ethernet:123.123.123.123
Launches the GUI version of the ADS Debugger for the
DSP56600. The switch indicates that the command
converter being used is an ethernet command converter
installed on the server with IP address 123.123.123.123.
1-6
Suite56 ADS Debugger User’s Manual
Motorola
Entering Commands
1.4 Entering Commands
You can perform most of the work with the debugger by using the menu bar and the
toolbar. However, you might sometimes find it useful to perform some commands from a
command line. Motorola’s DSP Debugger provides you the option of entering commands
at a command line.
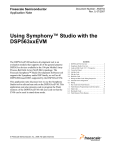
The command line is a part of the Command window, see Figure 1-1.
Figure 1-1. DSP Debugger Command Window
In the Command window, notice that several common commands are displayed on the
help line. The remaining commands can be displayed by pressing the SPACE bar when the
cursor is at the beginning of the command line.
It is not necessary to type the complete command. You only need to type the first one to
three characters of the command for the debugger to recognize the command. The
minimum number of required characters for each command is highlighted in red on the
help line.
You can display the complete syntax for a particular command by typing the command (or
the required characters) on the command line and then pressing the SPACE bar. The
complete syntax of the command that you began typing is displayed on the help line.
Any text that follows a semicolon on the command line is considered a user comment.
You might use comments if you were logging output from the Session window or creating
and running a command macro.
The command that you have typed in on the command line is executed when you press the
ENTER key or the CARRIAGE RETURN key. If the command is not a valid debugger
command, the debugger interprets the command as the name of a command macro and
executes the macro, if it exists.
For more information see Chapter 13, “Debugger Command Reference,” specifically
section 13.2, “Command Syntax,” on page 13-5.
Motorola
Introduction
1-7
Entering Commands
1-8
Suite56 ADS Debugger User’s Manual
Motorola
Chapter 2
Getting Started
The Motorola Suite56 DSP Debugger is designed to give you flexibility in how you debug
your object code. There are many approaches that you can take. There is no one way in
which to go about debugging your code. However, there are some fairly common
windows and commands with which you will want to become familiar. The following
steps describes how to begin a typical session with the DSP debugger.
Typically, you will want to:
1. Reset the device
2. Set the path of the working directory
3. Load an object file
4. Set up the display environment by opening windows to view the source code,
assembly code, register values, and memory values
5. Use a watch list
6. Set and modify breakpoints
7. Go or step through instructions
Once you are familiar with the debugger, you won’t need to perform each of the steps
described above. Instead you will probably already have your windows positioned as you
like them by making sure that the windows settings are saved in Window Preferences.
You will probably also have command macros that set the path, load the program, and set
up watch expressions.
Once you are comfortable with these basics, you can then become familiar with more
complex debugging by using simulated device input and output (I/O). If you are using C
code as your source code, you will also want to learn about specific commands useful in
debugging C source code.
For more information see Chapter 6, “Input and Output Files,” Chapter 7, “Debugger and
Device Configurations,” Chapter 8, “Debugging C Source Code,” Chapter 10,
“Expressions,” Chapter 13, “Debugger Command Reference,” Chapter 11, “Debugger
Toolbar,”
Motorola
Getting Started
2-1
Resetting the System
2.1 Resetting the System
The Debugger can reset the entire system at once, including the command converter. This
is useful when you want to reinitialize all registers, and peripherals, and also want to reset
the command converter to recognize that the target device is in Debug mode.
To reset the system:
•
From the execute menu, choose Reset, hen select System.
The command converter and the target device are both reset. The target device is
reset to the debug mode.
For more information see, section 13.22, “FORCE - Assert RESET or BREAK on
Target,” on page 13-28 ,section 13.8, “CFORCE - Assert Reset or Break on Command
Converter,” on page 13-16.
2.2 Setting and Clearing the Path
The Suite56 DSP Debugger makes use of two types of paths for saving and accessing
files:
•
the working directory path
•
alternate directory paths
The working directory is the primary path. It is the default directory used when searching
for an input file (assuming no path is explicitly specified with the input filename). If an
input file is not found in the working directory, alternate paths are automatically searched.
The advantage to you is that object files, source files, and command macros can each be
kept in separate directories, but still accessed without having to constantly redefine the
path.
2-2
Suite56 ADS Debugger User’s Manual
Motorola
Setting and Clearing the Path
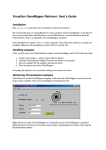
To set the path of the working directory:
1. From the File menu choose Path then select Set. A dialog box similar to Figure 2-1
appears.
Figure 2-1. Setting the Working Directory Path
2. If appropriate, select another drive from the Volumes menu.
3. Move up or down the directory tree until the directory you want is in the list of
subdirectories. There are a number of ways to do this. You can:
— move up and down the directory tree with the left arrow and right arrow
buttons;
— move down the tree by double clicking in the list of subdirectories;
— move up the tree by selecting a directory from the drop down box where the
parent directory is displayed;
— select a directory from the History menu, which shows recently selected
directories.
Motorola
Getting Started
2-3
Setting and Clearing the Path
4. Click once on the desired directory from the list of subdirectories so that it is
highlighted. Notice that the highlighted directory appears in the area labeled
Directory
5. Click Select.
The selected directory is now the working directory. Display the current path to see
the absolute path of the working directory
To set an alternate path:
1. From the File menu choose Path, then select Add.
2. If appropriate, select another drive from the Volumes menu.
3. Move up or down the directory tree until the directory you want is in the list of
subdirectories.
4. Highlight the desired directory by single clicking it in the list of subdirectories.
5. Click Select.
The selected directory is now added to the end of the list of alternate paths. Display the
current path to see the list of alternate paths.
To clear the alternate paths:
1. From the File menu, choose Path, then select Clear Alternate Path List.
The list of alternate paths is cleared for all devices. The path of the working directory is
not cleared.
Keep in mind that a separate working directory is maintained for each device. However,
all devices share the same alternate directory paths. To be safe, always check the path of
the working directory after adding a device or setting the default device.
Remember that in order to change the path of a device that is not currently the default
device, you must first change the default device.
For information see section 2.3, “Loading Object Files,” section 7.2, “Setting the Default
Device,” on page 7-4, section 13.34, “PATH - Define File Directory Path,” on page 13-42.
2-4
Suite56 ADS Debugger User’s Manual
Motorola
Loading Object Files
2.3 Loading Object Files
You can load DSP Object Module Format (OMF) files or Common Object File Format
(COFF) files directly into the Debugger memory. OMF files are identified by the .lod
extension. COFF files are identified by the .cld extension. Motorola’s Suite56 DSP
Assembler generates both file formats.
You can also generate both of the file formats with the DSP Debugger when saving object
files.
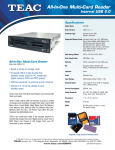
To load a COFF (.cld) file:
1. From the File menu, choose Load. then select Memory COFF. The dialog box in
Figure 2-2 appears:
Figure 2-2. Loading a COFF (.cld) File
2. Under Load, select Memory, Debug Symbols, or both.
The Debugger will process the symbol and line number information contained in a
COFF format object file (.cld file) only if the file was compiled or assembled with
debugging enabled. (In the Motorola DSP Assembler this is represented by the –g
option.)
If symbol information has been loaded, the evaluator will accept symbol names or
source file line numbers and translate them into an associated memory address.
3. Under Filename specify the filename of the object file to load or click on the File
button to browse for the file.
4. Click OK.
If the .cld file is not found in the selected directory, the Debugger will try to load
the file from the working directory. If the file does not exist in the working
directory, the Debugger will try to load the file from the alternate directories. An
error message is displayed if the file is not found in any of these directories.
Motorola
Getting Started
2-5
Loading Object Files
To load an OMF (.lod) file:
1. From the File menu, choose Load. then select Memory OMF.
2. Specify the filename in the dialog box.
It is not necessary to type the extension with the filename. The Debugger assumes
the .lod extension.
3. Click Open.
Keep in mind that the object file is loaded into the memory of the current device. If you
want to load the file into another device, you must first select that device as the default
device.
For more information see section 2.2, “Setting and Clearing the Path,”, section 4.4,
“Saving Object Files,” on page 4-5, section 7.2, “Setting the Default Device,” on page 7-4,
section 7.4, “Loading Debugger State Files,” on page 7-7, and section 13.29, “LOAD Load DSP Files,” on page 13-36.
2-6
Suite56 ADS Debugger User’s Manual
Motorola
Setting Up the Display Environment
2.4 Setting Up the Display Environment
Two windows are displayed when the Debugger first starts: the Session window and the
Command window. You might need to scroll around to get both windows into view at the
same time, but the screen should look something like Figure 2-3.
Figure 2-3. Setting Up the Display Environment
Motorola
Getting Started
2-7
Setting Up the Display Environment
The display environment refers to the way the windows of the Debugger are arranged on
your monitor. There is no right or wrong way to set up the display environment. However,
there are some windows that you will commonly want to have opened besides the Session
and Command windows. These include:
•
the Assembly window
•
the Source window (if a COFF file with debugging information is loaded)
You will also want to have windows for:
•
displaying register values,
•
displaying memory values , and perhaps
•
a watch list
If you are debugging a program written in C, you will also want to have the Stack window
open so that you can see the call stack.
Depending on the size and resolution of your monitor, having all of these windows open at
once means that there will be some overlapping. Your own experience with the Debugger
will lead you to the best configuration of these windows. However, in a typical session the
Debugger might look like Figure 2-4.
2-8
Suite56 ADS Debugger User’s Manual
Motorola
Setting Up the Display Environment
Figure 2-4. A Typical Session Window Using the Suite56 Debugger
For more information about customizing your work environment, see section 7.5,
“Changing and Saving Window Preferences,” on page 7-8, and section 11, “Debugger
Toolbar,” on page 11-1.
Motorola
Getting Started
2-9
Using a Watch List
2.5 Using a Watch List
You can watch the contents of a specific memory location, register, or expression by
setting up a watch list. The watch list is updated every time program execution is stopped.
The expression that you watch can be valid even if it is not calculated during program
execution. C expressions can be used, but must be enclosed in curly brackets:
{c_expression}. Symbolic references may be used if symbols have been loaded from the
object module.
To add an item to a watch list:
1. From the Windows menu choose Watch. The dialog box in Figure 2-5 appears.
Figure 2-5. Add Item to a Watch List
2. Under Window select the window number that you want to assign to the Watch
window. This is useful when you have more than one Watch window open.
3. Under Expression, type the expression that you want to appear in the Watch
window.
4. If the expression is a C expression, enclose it in curly brackets: {c_expression}.
5. Under Radix, select the radix format in which you want the variables displayed.
6. Click OK.
The expression that you specified now appears in the Watch window; if the
expression you type is not valid, you will get an error message explaining why the
expression is not valid.
2-10
Suite56 ADS Debugger User’s Manual
Motorola
Setting and Clearing Software Breakpoints
Keep in mind that a C expression that refers to C variables can only be evaluated in the
context in which the watch is established. That is, the variables in the expression are only
valid while they are in scope. If one of the variables in an expression goes out of scope
(either because a function call or return from a function), the value is replaced with the
message Expression out of scope. When all elements of the expression are back in scope,
the value is again displayed.
An expression that has gone out of scope because of a function call can be evaluated and
displayed by selecting the stack frame for the evaluation context. The stack frame
assignment remains in effect only until the next instruction is executed. An expression that
is out of scope because of a function exit cannot be evaluated until the function is again
invoked since the expression’s variables no longer exist.
For more information about watch lists, see section 8.1, “Moving Up and Down the Call
Stack,”section 10.7, “Setting Up and Modifying a Watch list,” on page 10-10,
section 12.1, “Displaying the Radix,” on page 12-1, and section 13.49, “WATCH - Set,
Modify, View, or Clear Watch Item,” on page 13-52.
2.6 Setting and Clearing Software Breakpoints
Software breakpoints are used to specify that a particular action be taken whenever a
certain condition is met. In this way, software breakpoints are very similar to hardware
breakpoints. However, software breakpoints are more limited than hardware breakpoints
in that:
•
software breakpoints can only be set on the first word of an instruction (they cannot
be set to detect the access of registers or data memory)
•
software breakpoints must be set in RAM (they cannot be set in ROM)
Despite the above limitations, it is recommended that you use software breakpoints
instead of hardware breakpoints whenever possible. Why? Because, effectively only one
hardware breakpoint can be set at a time whereas a virtually unlimited number of software
breakpoints can be set.
Motorola
Getting Started
2-11
Setting and Clearing Software Breakpoints
2.6.1 To Set a Software Breakpoint
1. From the Execute menu, choose Breakpoints, then select Set Software. The Set
Breakpoints dialog box shown in Figure 2-6 appears.
Figure 2-6. Setting a Software Breakpoint
2. Under Breakpoint Number select the number you want to assign to this
breakpoint. The default number that is shown is the next available number.
Breakpoint numbers do not have to be consecutive, they can be assigned arbitrarily.
For example, it may be convenient to allocate breakpoints so that one function is
assigned breakpoints 1 to 10, another 11 to 20, and so on.
3. Under Count specify how many times the Debugger should encounter the
breakpoint before performing the action. For example, if you set the count to 3, the
breakpoint will be triggered the third time that the breakpoint is encountered. Real
time execution will be affected if you set the count to more than one.
2-12
Suite56 ADS Debugger User’s Manual
Motorola
Setting and Clearing Software Breakpoints
4. If you have assigned an input file, you can mark EOF. The breakpoint will be acted
upon when the input file reaches an end-of-file. If you have marked EOF, under
Input File Number select the number of the input file. The input file number is the
number that you designated when you assigned the input file.
5. Under Type select the type of software breakpoint to set. If you select al, the
breakpoint will always be acted upon. Breakpoint types other than al are
conditional and device specific. See Table 3-2, “Software Breakpoints
(DEBUGcc) Available on the DSP56000, DSP56100, DSP56300, and DSP56600,”
on page 3-13 and Table 3-3, “Software Breakpoints (FDEBUGcc) Available on
the DSP96002,” on page 3-15 for a list of software breakpoints.
6. Under Address, type the address where you want the breakpoint to be set. For
example, to set a breakpoint at address $103 in p memory, type: p:$103
Note:
This address must be the first word of an instruction.
Note:
If you have set the breakpoint type (in step 5) to a conditional breakpoint (that
is, any type other than al), the breakpoint can only be set to an address which
contains a nop. Setting the breakpoint to an address which contains any other
opcode will cause your program to execute incorrectly.
7. Under Expression you can type an expression. The expression will be evaluated
when the address you specified is reached. If the expression is true, the breakpoint
will be triggered. If the expression is false, no action is taken and program
execution continues. Be aware that a side effect of evaluating an expression
(whether it is true or false) is that the program will not be executed in real time.
8. Under Action select what action is taken when the breakpoint is encountered:
Table 2-1. Software Breakpoint Actions
Breakpoint
Resulting Action
Halt
Stops program execution when the breakpoint is encountered.
Note
Displays the breakpoint expression in the Session window each time it is true. Program
execution continues. The display in the Session window is not updated until program
execution stops.
Show
Displays the enabled register/memory set. Program execution continues.
Command
Executes a Debugger command at the breakpoint. Device execution commands, such as
TRACE or GO, will not execute.
Increment[n]
Increments the n counter by one.
9. If the action specified is to execute a command, under Command type the
Debugger command.
10. Click OK.
Motorola
Getting Started
2-13
Setting and Clearing Software Breakpoints
2.6.2 To Clear a Software Breakpoint
1. From the Execute menu, choose Breakpoints, then select Clear.
The Clear Breakpoints dialog box shown in Figure 2-7 displays a list of all the
current breakpoints.
Figure 2-7. Clear Breakpoints Dialog Box
2. Select the breakpoint you want removed so that it is highlighted.
If you are clearing consecutive breakpoints, you can click and drag to highlight
more than one breakpoint. Or hold down the CTRL key while clicking on
breakpoints to select more than one.
3. Click OK.
The breakpoints you selected are now deleted.
Breakpoints will not be renumbered. For example, if you have set breakpoints #1,
#2, and #3, and then clear breakpoint #2, the remaining breakpoints will be
numbered #1 and #3.
Notice that breakpoints are indicated in the Assembly window and the Source window (if
applicable). Enabled breakpoints appear in blue. Disabled breakpoints appear in pink.
For more information see section 2.7, “Setting and Clearing Hardware Breakpoints,”
section 3.10, “Enabling and Disabling Breakpoints,” on page 3-22, Chapter 10,
“Expressions,” section 12.2, “Display the Current Breakpoint,” on page 12-2, and
section 13.5, “BREAK - Set, Modify, or Clear Breakpoints,” on page 13-10 in Chapter 13,
“Debugger Command Reference.”
2-14
Suite56 ADS Debugger User’s Manual
Motorola
Setting and Clearing Hardware Breakpoints
2.7 Setting and Clearing Hardware Breakpoints
Hardware breakpoints are used to specify that a particular action be taken whenever a
certain condition is met. In this way, hardware breakpoints are very similar to software
breakpoints. However, there are some differences. Hardware breakpoints:
•
use the OnCE circuitry on the device
•
can break on the execution of an instruction
•
can be set in ROM or RAM
•
can be set to detect an access of data memory
Although hardware breakpoints are more flexible than software breakpoints, you will
want to use hardware breakpoints judiciously. In effect, only one hardware breakpoint can
be enabled at any time.
Motorola
Getting Started
2-15
Setting and Clearing Hardware Breakpoints
2.7.1 To Set a Hardware Breakpoint
1. From the Execute menu, choose Breakpoints, then select Set Hardware. The
dialog box in Figure 2-8 appears.
Figure 2-8. Setting a Hardware Breakpoint
2. Under Type select the type of hardware breakpoint to set. Breakpoint types are
device specific. See Table 2-2 for an explanation of each type of breakpoint.
3. Under Memory Space, select the memory space in which the breakpoint is to be
set.
4. Under First Condition specify the conditions under which the breakpoint occurs.
Under Access indicate what kind of access should be detected by the breakpoint.
For example, if you want the breakpoint to detect when a memory location is read
but not written to, select Read. If you want either a read or a write to be detected,
chose Read/Write, etc.
Under Address Qualifier indicate the qualifier for the address location.
Under Address type the address that the breakpoint references.
2-16
Suite56 ADS Debugger User’s Manual
Motorola
Setting and Clearing Hardware Breakpoints
5. Under Option, indicate whether a second condition should be considered. And
indicates that both conditions must be met to trigger the breakpoint. Or indicates
that either condition can be met. Then indicates that the First Condition must be
satisfied followed by the Second Condition. Only indicates that only the first
condition must be met to trigger the breakpoint.
6. Under Second Condition specify the conditions for the second condition. This will
only apply if you have indicated so under Option in step 5.
7. Under Breakpoint Number select the number you want to assign to this
breakpoint. The default number shown is the next available number.
Breakpoint numbers do not have to be consecutive, they can be assigned arbitrarily.
For example, it may be convenient to allocate breakpoints so that one function is
assigned breakpoints 1 to 10, another uses 11 to 20, and so on.
8. Under Count specify how many times the Debugger should encounter the
breakpoint before stopping. For example, if you set the count to 3, the breakpoint
will be triggered the third time that the breakpoint is encountered.
Specifying a count will not affect real time execution.
9. Under Expression you can type an expression. The expression will be evaluated
when the first (and second) condition you specified is satisfied. If the expression is
true, the breakpoint will be triggered. If the expression is false, no action is taken
and program execution continues.
10. Under Action select what action is taken when the breakpoint is encountered:
Table 2-2. Hardware Breakpoint Actions
Breakpoint
Resulting Action
Halt
Stops program execution when the breakpoint is encountered.
Note
Displays the breakpoint expression in the Session window each time it is true. Program
execution continues. The display in the Session window is not updated until program
execution stops.
Show
Displays the enabled register/memory set. Program execution continues.
Command
Executes a Debugger command at the breakpoint. Device execution commands, such
as TRACE or GO, will not execute.
Increment[n]
Increments the n counter by one.
11. If the action specified is to execute a command, under Command type the
Debugger command.
12. Click OK.
Motorola
Getting Started
2-17
Starting Execution with Go
2.7.2 To Clear a Hardware Breakpoint
1. From the Execute menu, choose Breakpoints, then select Clear.
The Clear Breakpoints dialog box, shown in Figure 2-7 on page 2-14, displays a
list of all the current breakpoints.
2. Select the breakpoint you want removed so that it is highlighted.
If you are clearing consecutive breakpoints you can click and drag to highlight
more than one breakpoint. Or hold down the CTRL key while clicking on
breakpoints to select more than one.
3. Click OK.
The breakpoints you selected are now deleted.
Breakpoints will not be renumbered. For example, if you have set breakpoints #1,
#2, and #3, and then clear breakpoint #2, the remaining breakpoints will be
numbered #1 and #3.
Notice that breakpoints are indicated in the Assembly window and the Source window (if
applicable). Enabled breakpoints appear in blue. Disabled breakpoints appear in pink.
For more information see section 2.6, “Setting and Clearing Software Breakpoints,”
section 3.10, “Enabling and Disabling Breakpoints,” Chapter 10, “Expressions,” and
section 12.2, “Display the Current Breakpoint.” The command reference line option for
hardware breakpoints is covered in section 13.5, “BREAK - Set, Modify, or Clear
Breakpoints,” in Chapter 13, “Debugger Command Reference.”
2.8 Starting Execution with Go
The most common way to initiate the execution of your program is with go. When you
indicate go to the Debugger, it fetches, decodes, and executes instructions in the exact
manner as a device would if you were debugging an actual device. The go command
executes the program until one of the following occurs:
•
a breakpoint is reached,
•
you indicate stop,
•
or a debug instruction is encountered.
2-18
Suite56 ADS Debugger User’s Manual
Motorola
Starting Execution with Go
2.8.1 To Start Executing Instructions with Go
1. From the Execute menu choose Go. You will see the dialog box in Figure 2-9
Figure 2-9. Executing Instructions with Go
2. Under Go From, choose whether to Go from an address or to Reset.
If you choose Reset, the Debugger simulates the reset sequence in the processor.
The instruction pipeline, instruction counter, and cycle counter will be cleared
before program simulation begins. The device registers are reset and execution
begins at the reset exception address.
3. If you chose to go from an address, under Address, type in the address from which
you want to begin executing instructions. If you leave the address blank, execution
will begin from the current program counter value. If you specify an address, the
instruction pipeline, instruction counter, and cycle counter will be cleared before
program simulation. Execution will begin from the address you specify.
4. Select the Go to Breakpoints checkbox if you want to stop execution at a
particular breakpoint. If selected, all other stop breakpoints will be ignored.
5. Under Break Number select the breakpoint where you want to stop execution. To
see where you have breakpoints set Display the Current Breakpoints in the
breakpoint window.
6. Under Count specify how many times the Debugger should encounter the
breakpoint before stopping. For example, if you set the count to 3, the program
execution will be stopped on the third time that the breakpoint is encountered. The
last instruction executed will be the breakpoint.
7. When all conditions are set, click OK. Execution will begin.
Motorola
Getting Started
2-19
Starting Execution with Go
Notice that during execution, the status bar in the lower left corner of the Debugger
window shows the number of the device where execution is taking place, the PC (program
counter), and the cycle count (updated every 1,000 cycles).
As an alternative, you can start program execution using the GO button located on the
toolbar.
For more information see section 5.1, “Resetting the Device Registers.” Also see
section 13.24, “GO - Execute DSP Program,” in Chapter 13, “Debugger Command
Reference.”
2-20
Suite56 ADS Debugger User’s Manual
Motorola
Chapter 3
Controlling Execution
This chapter includes a description of various functions necessary to control the execution
of a program that you are debugging. The following functions can be used in the execution
of the program: go, step, trace, next, until, break, wait, finish, stop.
3.1 Starting Execution with Go
The most common way to initiate the execution of your program is with go. When you
indicate go to the Debugger, it fetches, decodes, and executes instructions in the exact
manner as a device would if you were debugging an actual device. The go command
executes the program until one of the following occurs:
•
a breakpoint is reached,
•
you indicate stop,
•
or a debug instruction is encountered.
Motorola
Controlling Execution
3-1
Starting Execution with Go
3.1.1 To Start Executing Instructions with Go
1. From the Execute menu choose GO.. The Go dialog box in Figure 3-1 appears.
Figure 3-1. Executing Instructions with Go
2. Under Go From, choose Address or Reset.
If you choose Reset, the Debugger simulates the reset sequence in the processor.
The instruction pipeline, instruction counter, and cycle counter will be cleared
before program simulation begins. The device registers are reset and execution
begins at the reset exception address.
3. If you chose to go from an address, under Address, type in the address from which
you want to begin executing instructions. If you leave the address blank, execution
will begin from the current program counter value. If you specify an address, the
instruction pipeline, instruction counter, and cycle counter will be cleared before
program simulation. Execution will begin from the address you specify.
4. Select the Go to Breakpoint checkbox if you want to stop execution at a particular
breakpoint. If selected, all other stop breakpoints will be ignored.
5. Under Break Number select the breakpoint where you want to stop execution. To
see where you have breakpoints set Display the Current Breakpoints in the
breakpoint window.
6. Under Count specify how many times the Debugger should encounter the
breakpoint before stopping. For example, if you set the count to 3, the program
execution will be stopped on the third time that the breakpoint is encountered. The
last instruction executed will be the breakpoint.
7. When all conditions are set, click OK. Execution will begin.
3-2
Suite56 ADS Debugger User’s Manual
Motorola
Step Through Instructions
Notice that during execution, the status bar in the lower left corner of the Debugger
window shows the number of the device where execution is taking place, the PC (program
counter), and the cycle count (updated every 1,000 cycles).
As an alternative, you can start program execution using the GO button located on the
toolbar.
For more information see section 5.1, “Resetting the Device Registers.” Also see
section 13.24, “GO - Execute DSP Program,” in Chapter 13, “Debugger Command
Reference.”
3.2 Step Through Instructions
You can specify the number of instructions or lines that you would like the Debugger to
execute before stopping.
Performing a step through instructions is similar to performing a trace except that the
display of the registers and memory blocks occurs only after the specified number of lines
or instructions have been executed.
Executing instructions with step is also similar to executing the next instruction. The
important difference between using step as opposed to next is the way subroutines and
macros are handled. (Remember that for the Debugger to recognize macros, the symbolic
debug information for the source code must have been included when it was compiled.)
If one of the instructions being stepped through calls a subroutine or begins execution of a
macro, the instructions of the subroutine or macro are counted towards the number of
instructions that have been stepped. (Some developers refer to this as stepping through the
subroutine.) For example, let’s suppose that you indicate to the Debugger to execute the
next five instructions. Let’s further suppose that the third instruction is a JSR (a jump to a
subroutine) and that the subroutine contains fourteen instructions. Execution will occur in
the following manner:
•
the first two instructions are executed
•
the third instruction (a JSR) calls a subroutine
•
the next two instructions of the subroutine are executed (the rest of the subroutine
will not be executed because a total of five instructions have now been stepped
through)
If by stepping through a subroutine, as in the above example, the end of the subroutine is
not reached you can indicate to the Debugger that it should allow the current function to
finish.
Motorola
Controlling Execution
3-3
Trace the Execution of Instructions
3.2.1 To Step Through Program Instructions
1. From the Execute menu choose Step. The dialog box in Figure 3-2 appears.
Figure 3-2. Step Through Program Instructions
2. Under Device, select the device on which you are debugging.
3. Under Increment, select whether to step by lines or instructions.
(You can only specify lines if the object code includes debugging information.)
4. Under Count, specify the number of lines or instructions to step.
5. Click OK.
Notice that the values in the register window, the memory window, and all other Debugger
windows are updated after the last line or instruction is executed.
As an alternative, you can use the STEP Button on the toolbar to step one instruction or
line at a time.
Using the step command from the command line is covered in section 13.39, “STEP - Step
Through DSP Program,” on page 13-46 of Chapter 13, “Debugger Command Reference.”
3.3 Trace the Execution of Instructions
You can look at a snap shot of the enabled registers and memory after each instruction or
line is executed by tracing program execution.
3-4
Suite56 ADS Debugger User’s Manual
Motorola
Trace the Execution of Instructions
3.3.1 To Trace Program Execution
1. From the Execute menu choose Trace. The dialog box in Figure 3-3 appears.
Figure 3-3. Trace Program Execution
2. Under Device, select the device on which you are debugging.
3. Under Increment select whether to trace each line or instruction.
(You can only specify lines if the object code includes debugging information.)
4. Under Count specify the total number of lines or instructions to trace Execution
will stop after this number of lines/instructions.
5. Click OK.
Notice that the values in the Register window, the Memory window, and other Debugger
windows are updated after each line or instruction is executed. Because these values are
updated at the speed of execution, they will pass by very quickly. In order to review the
values, scroll back through the Session window once execution has stopped. It is often
useful to log output from the Session window log.
Using trace from the command line is covered in section 13.42, “TRACE - Trace Through
DSP Program,” on page 13-48 of Chapter 13, “Debugger Command Reference.”
Motorola
Controlling Execution
3-5
Executing the Next Instruction
3.4 Executing the Next Instruction
You can specify the number of instructions or lines that you would like the Debugger to
execute before stopping. Executing the next specific number of instructions is a quick way
to control execution without having to set a breakpoint.
Executing instructions with next is similar to performing a step through instructions
except that you can only specify the number of lines or instructions, and not cycles. Like
stepping through instructions, the display of the registers and memory blocks occurs only
after the specified number of lines or instructions have been executed.
The important difference between using next as opposed to step is the way subroutines are
handled. If the next instruction to be executed calls a subroutine or begins execution of a
macro, all the instructions of the subroutine or macro are executed before execution is
stopped. The enabled registers, memory, and other updated values are then displayed. (In
order to recognize macros, the symbolic debug information for the program code must be
loaded. The debug information is included in the COFF format .cld files generated using
the Motorola Suite56 Assembler’s -g option.)
3.4.1 To Execute the Next Program Instruction
1. From the Execute menu choose Next. The dialog box in Figure 3-4 appears.
Figure 3-4. Executing the Next Program Instruction
2. Under Increment, select whether to execute by lines or instructions.
3. Under Count, specify the number of lines or instructions to execute
4. Select the checkbox labeled Halt at Breakpoints if you want breakpoints to be
observed. If the checkbox is not selected, breakpoints will be ignored and will not
halt program execution.
5. Click OK.
3-6
Suite56 ADS Debugger User’s Manual
Motorola
Executing the Next Instruction
Notice that the values in the register window, the memory window, and all other Debugger
windows are updated after the last line or instruction is executed.
As an alternative, you can use the Next button on the toolbar to execute the next
instruction or line.
Using next from the toolbar is covered in section 11.4, “Next Button,” on page 11-4.
Using next from the command reference line is coverd in section 13.32, “NEXT - Step
Through Subroutine Calls or Macros,” on page 13-39.
Motorola
Controlling Execution
3-7
Providing an Until Condition
3.5 Providing an Until Condition
You can provide an until condition which will cause the Debugger to execute the
currently loaded program until a specified location is encountered. The location may be
specified as a program line number, an address, or a label.
3.5.1 To Provide an Until Condition
1. From the Execute menu, choose Until. The dialog box in Figure 3-5 appears.
Figure 3-5. Providing an Until Condition
2. Under Device, select the device on which you are debugging.
Type the line, address or label at which to stop execution. (Line numbers and labels
can only be used if the object code includes debugging information.)
To specify an address, include the memory space followed by a colon, followed by
the address. For example, to execute instructions until address $00c103 is reached,
type:
p:$00c103
To specify a line number in the currently loaded source file, just type in the line
number. Or to specify a line number of a particular source file, include the
filename. For example, to execute until line number 20 of a source file named
clrmem.cld located in the working directory, type:
clrmem@20
3. Click OK.
Using until from the command line is covered in section 13.45, “UNTIL - Step Until
Address,” on page 13-50 .
3-8
Suite56 ADS Debugger User’s Manual
Motorola
Software Breakpoints
3.6 Software Breakpoints
Software breakpoints are used to specify that a particular action be taken whenever a
certain condition is met. In this way, software breakpoints are very similar to hardware
breakpoints. However, software breakpoints are more limited than hardware breakpoints
in that:
•
software breakpoints can only be set on the first word of an instruction (they cannot
be set to detect the access of registers or data memory)
•
software breakpoints must be set in RAM (they cannot be set in ROM)
Despite the above limitations, it is recommended that you use software breakpoints
instead of hardware breakpoints whenever possible. Why? Because, effectively only one
hardware breakpoint can be set at a time whereas a virtual unlimited number of software
breakpoints can be set.
Motorola
Controlling Execution
3-9
Software Breakpoints
3.6.1 To Set a Software Breakpoint
1. From the Execute menu, choose Breakpoints, then select Set Software. The Set
Breakpoint dialog box shown in Figure 3-6 appears.
Figure 3-6. Setting a Software Breakpoint
2. Under Breakpoint Number select the number you want to assign to this
breakpoint. The default number that is shown is the next available number.
Breakpoint numbers do not have to be consecutive, they can be assigned arbitrarily.
For example, it may be convenient to allocate breakpoints so that one function is
assigned breakpoints 1 to 10, another 11 to 20, and so on.
3. Under Count specify how many times the Debugger should encounter the
breakpoint before performing the action. For example, if you set the count to 3, the
breakpoint will be triggered the third time that the breakpoint is encountered. Real
time execution will be affected if you set the count to more than one.
4. If you have assigned an input file, you can mark EOF. The breakpoint will be acted
upon when the input file reaches an end-of-file. If you have marked EOF, under
Input File Number select the number of the input file. The input file number is the
number that you designated when you assigned the input file.
3-10
Suite56 ADS Debugger User’s Manual
Motorola
Software Breakpoints
5. Under Type select the type of software breakpoint to set. If you select al, the
breakpoint will always be acted upon. Breakpoint types other than al are
conditional and device specific. See Table 3-1 for a list of software breakpoints.
6. Under Address, type the address where you want the breakpoint to be set. For
example, to set a breakpoint at address $103 in p memory, type: p:$103
Note:
This address must be the first word of an instruction.
Note:
If you have set the breakpoint type (in step 5) to a conditional breakpoint (that
is, any type other than al), the breakpoint can only be set to an address which
contains a nop. Setting the breakpoint to an address which contains any other
opcode will cause your program to execute incorrectly.
7. Under Expression you can type an expression. The expression will be evaluated
when the address you specified is reached. If the expression is true, the breakpoint
will be triggered. If the expression is false, no action is taken and program
execution continues. Be aware that a side effect of evaluating an expression
(whether it is true or false) is that the program will not be executed in real time.
8. Under Action select what action is taken when the breakpoint is encountered:
Table 3-1. Software Breakpoint Actions
Breakpoint
Resulting Action
Halt
Stops program execution when the breakpoint is encountered.
Note
Displays the breakpoint expression in the Session window each time it is true. Program
execution continues. The display in the Session window is not updated until program
execution stops.
Show
Displays the enabled register/memory set. Program execution continues.
Command
Executes a Debugger command at the breakpoint. Device execution commands, such as
TRACE or GO, will not execute.
Increment[n]
Increments the n counter by one.
9. If the action specified is to execute a command, under Command type the
Debugger command.
10. Click OK.
Motorola
Controlling Execution
3-11
Types of Software Breakpoints
3.6.2 To Clear a Software Breakpoint
1. From the Execute menu, choose Breakpoints, then select Clear.
The Clear Breakpoints dialog box (shown in Figure 2-7 on page 2-14) displays a
list of all the current breakpoints.
2. Select the breakpoint you want removed so that it is highlighted.
If you are clearing consecutive breakpoints, you can click and drag to highlight
more than one breakpoint. Or hold down the CTRL key while clicking on
breakpoints to select more than one.
3. Click OK.
The breakpoints you selected are now deleted.
Breakpoints will not be renumbered. For example, if you have set breakpoints #1,
#2, and #3, and then clear breakpoint #2, the remaining breakpoints will be
numbered #1 and #3.
Notice that breakpoints are indicated in the Assembly window and the Source window (if
applicable). Enabled breakpoints appear in blue. Disabled breakpoints appear in pink.
For more information see section 2.7, “Setting and Clearing Hardware Breakpoints,”
section 3.10, “Enabling and Disabling Breakpoints,” on page 3-22, Chapter 10,
“Expressions,” section 12.2, “Display the Current Breakpoint,” on page 12-2, and
section 13.5, “BREAK - Set, Modify, or Clear Breakpoints,” on page 13-10 in Chapter 13,
“Debugger Command Reference.”
3.7 Types of Software Breakpoints
There are several types of software breakpoints that you can set with the Debugger. The
types that are available to you depend on the device on which you are debugging. Look
below for the device that matches your device to see the software breakpoints that are
available to you.
3.7.1 DSP56000, DSP56100, DSP56300, and DSP56600 Families
The DSP56000, DSP56300, and 56600 device families recognize the DEBUGcc opcode,
where cc represents a conditional code. The DEBUGcc opcode is used to indicate that the
device should enter into the debug mode if the specified conditional code (cc) is true. See
Motorola DSP family manual specific to the device you are debugging for more
information on the DEBUGcc and cc opcodes.
3-12
Suite56 ADS Debugger User’s Manual
Motorola
Types of Software Breakpoints
Table 3-2. Software Breakpoints (DEBUGcc) Available on the DSP56000, DSP56100,
DSP56300, and DSP56600
Breakpoint Type (cc)
Meaning
Condition Code Bit(s) *
cc or hs
carry clear
C = 0
cs or lo
carry set
C = 1
ec
extension clear
E = 0
eq
equal
Z = 1
es
extension set
E = 1
ge
greater or equal
N (xor) V = 0
gt
greater than
Z or (N (xor) V) = 0
lc
limit clear
L = 0
le
less or equal
Z or (N (xor) V) = 1
ls
limit set
L = 1
lt
less than
N (xor) V = 1
mi
minus
N = 1
ne
not equal
Z = 0
nr
normalized
Z or (Not U (and) Not E) = 1
pl
plus
N = 0
nn
not normalized
Z or (Not U (and) Not E) = 0
al
always
N.A. (not conditional)
* (and) denotes the logical AND operator
(xor) denotes the logical Exclusive OR operator
or denotes the logical OR operator
Motorola
Controlling Execution
3-13
Types of Software Breakpoints
3.7.2 DSP96002 Device Family
The DSP96002 recognizes the FDEBUGcc and the DEBUGcc opcode, where cc
represents a conditional code. The FDEBUGcc opcode is used to indicate that the device
should enter into the debug mode if the specified floating-point conditional code (cc) is
true. See the DSP96002 User’s Manual for more information on the FDEBUGcc opcode
and the DEBUGcc opcode.
3-14
Suite56 ADS Debugger User’s Manual
Motorola
Types of Software Breakpoints
Table 3-3. Software Breakpoints (FDEBUGcc) Available on the DSP96002
Breakpoint
Type
Meaning
Condition Code Bit(s)
eq
equal
Z = 1
err
error
UNCC or SNAN or OPERR or OVF
or UNF or DZ = 1
ge
greater or equal
NAN or (N and ~Z)= 0
gl
greater or less than
NAN or Z = 0
gle
greater, less or equal
NAN = 0
gt
greater than
NAN or Z or N = 0
inf
infinity
I = 1
le
less or equal
NAN or ~(N or Z) = 0
lt
less than
NAN or Z or ~N = 0
mi
minus
N = 1
ne
not equal
Z = 0
nge
not (greater or equal)
NAN or (N and ~Z) = 1
ngl
not (greater or less)
NAN or Z = 1
ngle
not (greater, less or equal)
NAN = 1
ngt
not greater than
NAN or Z or N = 1
ninf
not infinity
I = 0
nle
not (less than or equal)
NAN or ~(N or Z) = 1
nlt
not less than
NAN or Z or ~N = 1
or
ordered
NAN = 0
pl
plus
N = 0
un
unordered
NAN = 1
For more information see section 3.6, “Software Breakpoints,” and section 3.9, “Types of
Hardware Breakpoints.”
Motorola
Controlling Execution
3-15
Hardware Breakpoints
3.8 Hardware Breakpoints
Hardware breakpoints are used to specify that a particular action be taken whenever a
certain condition is met. In this way, hardware breakpoints are very similar to software
breakpoints. However, there are some differences. Hardware breakpoints:
•
use the OnCE circuitry on the device
•
can break on the execution of an instruction
•
can be set in ROM or RAM
•
can be set to detect an access of data memory
Although hardware breakpoints are more flexible than software breakpoints, you will
want to use hardware breakpoints judiciously. In effect, only one hardware breakpoint can
be enabled at any time.
3.8.1 To Set a Hardware Breakpoint:
1. From the Execute menu, choose Breakpoints, then select Set Hardware. The
dialog box in Figure 3-7 appears.
3-16
Suite56 ADS Debugger User’s Manual
Motorola
Hardware Breakpoints
Figure 3-7. Setting a Hardware Breakpoint
2. Under Type select the type of hardware breakpoint to set. Breakpoint types are
device specific. See Table 3-4 for an explanation of each type of breakpoint.
3. Under Memory Space, select the memory space in which the breakpoint is to be
set.
4. Under First Condition specify the conditions under which the breakpoint occurs.
Under Access indicate what kind of access should be detected by the breakpoint.
For example, if you want the breakpoint to detect when a memory location is read
but not written to, select Read. If you want either a read or a write to be detected,
chose Read/Write, etc.
Under Address Qualifier indicate the qualifier for the address location.
Under Address type the address that the breakpoint references.
5. Under Option, indicate whether a second condition should be considered. And
indicates that both conditions must be met to trigger the breakpoint. Or indicates
that either condition can be met. Then indicates that the First Condition must be
Motorola
Controlling Execution
3-17
Hardware Breakpoints
satisfied followed by the Second Condition. Only indicates that only the first
condition must be met to trigger the breakpoint.
6. Under Second Condition specify the conditions for the second condition. This will
only apply if you have indicated so under Option in step 5.
7. Under Breakpoint Number select the number you want to assign to this
breakpoint. The default number shown is the next available number.
Breakpoint numbers do not have to be consecutive, they can be assigned arbitrarily.
For example, it may be convenient to allocate breakpoints so that one function is
assigned breakpoints 1 to 10, another uses 11 to 20, and so on.
8. Under Count specify how many times the Debugger should encounter the
breakpoint before stopping. For example, if you set the count to 3, the breakpoint
will be triggered the third time that the breakpoint is encountered.
Specifying a count will not affect real time execution.
9. Under Expression you can type an expression. The expression will be evaluated
when the first (and second) condition you specified is satisfied. If the expression is
true, the breakpoint will be triggered. If the expression is false, no action is taken
and program execution continues.
10. Under Action select what action is taken when the breakpoint is encountered.
Table 3-4 lists the possible choices.
Table 3-4. Hardware Breakpoint Actions
Breakpoint
Resulting Action
Halt
Stops program execution when the breakpoint is encountered.
Note
Displays the breakpoint expression in the Session window each time it is true. Program
execution continues. The display in the Session window is not updated until program
execution stops.
Show
Displays the enabled register/memory set. Program execution continues.
Command
Executes a Debugger command at the breakpoint. Device execution commands, such
as TRACE or GO, will not execute.
Increment[n]
Increments the n counter by one.
11. If the action specified is to execute a command, under Command type the
Debugger command.
12. Click OK.
3-18
Suite56 ADS Debugger User’s Manual
Motorola
Hardware Breakpoints
3.8.2 To Clear a Hardware Breakpoint
1. From the Execute menu, choose Breakpoints, then select Clear.
The Clear Breakpoints dialog box (shown in Figure 2-7 on page 2-14) displays a
list of all the current breakpoints.
2. Select the breakpoint you want removed so that it is highlighted.
If you are clearing consecutive breakpoints you can click and drag to highlight
more than one breakpoint. Or hold down the CTRL key while clicking on
breakpoints to select more than one.
3. Click OK.
The breakpoints you selected are now deleted.
Breakpoints will not be renumbered. For example, if you have set breakpoints #1,
#2, and #3, and then clear breakpoint #2, the remaining breakpoints will be
numbered #1 and #3.
Notice that breakpoints are indicated in the Assembly window and the Source window (if
applicable). Enabled breakpoints appear in blue. Disabled breakpoints appear in pink.
For more information see section 2.6, “Setting and Clearing Software Breakpoints,”
section 3.10, “Enabling and Disabling Breakpoints,” Chapter 10, “Expressions,” and
section 12.2, “Display the Current Breakpoint.” The command reference line option for
hardware breakpoints is covered in section 13.5, “BREAK - Set, Modify, or Clear
Breakpoints,” in Chapter 13, “Debugger Command Reference.”
Motorola
Controlling Execution
3-19
Types of Hardware Breakpoints
3.9 Types of Hardware Breakpoints
There are several types of hardware breakpoints that you can set. The types that are
available to you depend on the device on which you are debugging. Table 3-5 through
Table 3-10 provide detailed breakpoint information for each Suite56 device family
supported the by the Suite56 debugger.
Table 3-5. DSP56000 Device Family Hardware Breakpoint Types
Breakpoint Type
Meaning
pcf
break on any Program core fetch (read only)
pcm
break on Program read (fetch or move – read only)
pcfm
break on Program access (fetch or P move – r/w)
pce
break on executed fetch only (read only)
pa
break on Program access (r/w)
xa
break on X data memory access (r/w)
ya
break on Y data memory access (r/w)
Table 3-6. DSP56100 Device Family Hardware Breakpoint Types
Breakpoint Type
Meaning
pcf
break on any Program core fetch (read only)
pcm
break on Program read (fetch or move – read only)
xab1
break on X address bus 1 access
xab2
break on X address bus 2 access
Table 3-7. DSP56300 Device Family Hardware Breakpoint Types
Breakpoint Type
3-20
Meaning
dma
break on DMA access (r, w, or r/w)
pa
break on Program access (r, w, or r/w)
xa
break on X data memory access (r, w, or r/w)
ya
break on Y data memory access (r, w, or r/w)
Suite56 ADS Debugger User’s Manual
Motorola
Types of Hardware Breakpoints
Table 3-8. DSP56600 Family Hardware Breakpoint Types
Breakpoint Type
Meaning
pa
break on Program access (r, w, or r/w)
xa
break on X data memory access (r, w, or r/w)
ya
break on Y data memory access (r, w, or r/w)
Table 3-9. DSP56800 Family Hardware Breakpoint Types
Breakpoint Type
Meaning
pcf
break on any Program core fetch (read only)
pcm
break on Program read (fetch or move – read only)
xab1
break on X address bus 1 access
Table 3-10. DSP96000 Family Hardware Breakpoint Types
Breakpoint Type
Meaning
pcf
break on any Program core fetch (read only)
pcm
break on Program read (fetch or move – read only)
pcfm
break on Program access (fetch or P move – r/w)
pdma
break on Program memory DMA access
xa
break on X data memory access (r/w)
ya
break on Y data memory access (r/w)
xdma
break on X memory DMA access
ydma
break on Y memory DMA access
For more information see section 3.7, “Types of Software Breakpoints,”and section 3.8,
“Hardware Breakpoints.”
Motorola
Controlling Execution
3-21
Enabling and Disabling Breakpoints
3.10 Enabling and Disabling Breakpoints
Breakpoints can be enabled and disabled. While disabled, breakpoints have no effect on
DSP program execution, and do not cause any of the actions associated with the
breakpoint.
1. From the Execute menu, choose Breakpoints, then select Enable or Disable. A
dialog box similar to the one in Figure 3-8 appears.
Figure 3-8. Disable Breakpoints Dialog Box
2. Highlight the breakpoint that you want enabled or disabled.
3. Click OK.
You can see a list of all breakpoints by displaying the current breakpoint. .
The Debugger also indicates breakpoints in the Assembly window and Source window. In
the Assembly window and Source window, enabled breakpoints appear in blue. Disabled
breakpoints appear in pink.
For information about setting breakpoints from the command line, see section 13.5,
“BREAK - Set, Modify, or Clear Breakpoints,” on page 13-10.
See section 3.6, “Software Breakpoints,”and section 3.8, “Hardware Breakpoints,” for
more information about the uses of breaktpoints in debugging with the Suite56 Debugger.
3-22
Suite56 ADS Debugger User’s Manual
Motorola
Using Expressions in Breakpoints
3.11 Using Expressions in Breakpoints
It is possible to use expressions in conjunction with both software breakpoints and
hardware breakpoints. When a breakpoint is reached the expression is evaluated. If the
expression is true, the action indicated by the breakpoint is taken. If the expression is false,
no action is taken and program execution continues
A valid expression can consist of a combination of symbols, constants, operators, and
parentheses. Expressions follow the conventional rules of algebra and Boolean arithmetic
and might contain any combination of integers, floating point numbers, memory space
symbols or register symbols. Table 3-11 lists the operators that can be used in the
breakpoint expression.
Table 3-11. List of Operators
Syntax
Motorola
Description
<
less than
&&
logical "and"
<=
less than or equal to
||
logical "or"
==
equal to
!
logical "negate"
>=
greater than or equal to
&
bitwise "and"
>
greater than
|
bitwise "or"
!=
not equal to
~
bitwise one’s complement
+
addition
^
bitwise "exclusive or"
-
subtraction
<<
shift left
/
division
>>
shift right
Controlling Execution
3-23
Pausing Execution with Wait
Register names can also be used in the expression. A breakpoint expression usually
involves comparison of register or memory values.
C expressions can also be used. Remember to enclose C expressions in curly bracket:
{c_expression}.
You can find more information about expressions in Chapter 10, “Expressions.” You can
find more information about setting breakpoints in section 3.6, “Software Breakpoints,”
on page 3-9 and section 3.8, “Hardware Breakpoints,” on page 3-16.
3.12 Pausing Execution with Wait
You can pause program execution by specifying the number of seconds you want the
Debugger to wait. Execution resumes after the pause.
This is particularly useful when writing a command macro. That is, if you cause the
Debugger to wait while logging commands, you can then save the log file. A command
macro results. The pause that was recorded while logging commands will be replayed
when the macro is executed. This provides a useful way to pause execution so that you can
examine certain values or windows.
3.12.1 To Pause Execution
1. From the Execute menu, choose Wait.
2. Select the number of seconds to pause or click on the checkbox marked Forever to
pause indefinitely.
3. Click OK.
4. An information box appears to let you know that the Debugger is paused. If you
don’t want to wait for the pause to end automatically, you can resume program
execution by clicking on Cancel.
Keep in mind that if you click cancel while recording a command macro that the
cancellation of the pause is not recorded. So, for example, if you specify a wait of
ten seconds and then cancel after three, when the command macro executes, it will
pause for the full ten seconds.
See section 9.1, “Creating and Running a Command Macro,” on page 9-1 for more
information about using macros with the Debugger. To use wait from the command line,
see section 13.48, “WAIT - Wait Specified Time,” on page 13-51.
3-24
Suite56 ADS Debugger User’s Manual
Motorola
Allowing the Current Function to Finish
3.13 Allowing the Current Function to Finish
Sometimes you will find that program execution has stopped while in the middle of
executing a subroutine or function. This might occur for several reasons. It might occur
because you specified that a certain number of steps be executed which happened to end in
the middle of the subroutine. Or an until condition or breakpoint might be reached while
in the middle of a subroutine.
In any instance where the Debugger has stopped execution in the middle of a subroutine or
function, the subroutine or function can be made to finish execution.
3.13.1 To Finish Execution of the Current Function or Subroutine
1. From the Execute menu, choose Finish
The Debugger continues until encountering an RTS instruction.
Execution continues only to the end of the current function. If another function is
encountered during a finish operation, the execution of the function that was
encountered is not completed.
As an alternative, you can also use the Finish button on the toolbar.
To use the finish command from the command line, see section 13.21, “FINISH - Step
Until End of Current Subroutine,” on page 13-28.
More information about the finish command is available in section 3.2, “Step Through
Instructions,” and section 3.4, “Executing the Next Instruction,”
Motorola
Controlling Execution
3-25
Stopping Program Execution
3.14 Stopping Program Execution
You can stop program execution or the execution of a command macro at any time.
3.14.1 To Stop Program or Command Macro Execution
1. From the Execute menu, choose Stop.
Notice that this is the only menu item you can choose while program or command
macro execution is in progress.
Keep in mind that if you began the execution by providing an until condition then
this temporary breakpoint will be cleared.
In the Assembly window (and the Source window if applicable) the next instruction
to be executed is highlighted in red.
When program execution is stopped the Session window will display Simulation
aborted. Notice that the values in the Session window, the Register window, the Memory
window, and all other Debugger windows are updated to reflect the last instruction or line
that was executed.
As an alternative, you can also use the Stop button on the toolbar to stop program
execution.
For more information related to using stop see section 3.5, “Providing an Until
Condition,” and section 5.1, “Resetting the Device Registers,” on page 5-1. To use stop
from the command line, see section 3.14, “Stopping Program Execution.”
3-26
Suite56 ADS Debugger User’s Manual
Motorola
Chapter 4
Object Files and Data Files
This chapter describes how to set and change the path of the working directory and how to
load and save object files.
4.1 Displaying the Current Path
The Suite56 DSP Debugger makes use of two types of paths for saving and accessing
files:
•
•
the working directory
alternate directories
The working directory is the default directory the Debugger uses when searching for an
input file or object file (assuming no path is explicitly specified with the filename).
Alternate directories are also searched, in turn, if an input file or object file are not found
in the working directory.
4.1.1 To Display the Current Paths
1. From the Display menu, choose Path.
2. Open the Session window if not already open. The window in Figure 4-1 appears.
You will see the current working directory and the alternate source paths displayed.
Figure 4-1. Displaying Current Paths
Motorola
Object Files and Data Files
4-1
To Set the Working Directory Path
Keep in mind that a separate directory path is maintained for each device. This means that
as you switch from one device to another, the working directory also changes according to
the current device. The device number of the current device is indicated in the top left
corner of the Session window.
For more information see section 2.2, “Setting and Clearing the Path,” on page 2-2, and
section 7.1, “Setting the Default Device,” on page 7-3. To set or clear the path from the
command line see section 13.34, “PATH - Define File Directory Path,” on page 13-42.
4.2 To Set the Working Directory Path
1. From the File menu choose Path, then select Set. A dialog box similar to the one in
Figure 4-1 appears.
Figure 4-2. Setting the Working Directory Path
2. If appropriate, select another drive from the Volumes menu.
4-2
Suite56 ADS Debugger User’s Manual
Motorola
To Set the Working Directory Path
3. Move up or down the directory tree until the directory you want is in the list of
subdirectories. There are a number of ways to do this. You can:
— move up and down the directory tree with the left arrow and right arrow
buttons;
— move down the tree by double clicking in the list of subdirectories;
— move up the tree by selecting a directory from the drop down box where the
parent directory is displayed;
— select a directory from the History menu, which shows recently selected
directories.
4. Single click on the desired directory from the list of subdirectories so that it is
highlighted.
Notice that the highlighted directory appears in the area labeled Directory
5. Click on Select.
The selected directory is now the working directory.
Note:
From the Display menu, select Path to see the absolute path of the working
directory
4.2.1 To Set an Alternate Path
1. From the File menu choose Path, then select Add.
2. If appropriate, select another drive from the Volumes menu.
3. Move up or down the directory tree until the directory you want is in the list of
subdirectories.
4. Highlight the desired directory by single clicking on it in the list of subdirectories.
5. Click on Select.
The selected directory is now added to the end of the list of alternate paths.
Note:
Motorola
From the Display menu, select Path to see the absolute path of the working
directory
Object Files and Data Files
4-3
Loading Object Files
4.2.2 To Clear the Alternate Paths
1. From the File menu, choose Path, then select Clear Alternate Path List.
The list of alternate paths is cleared for all devices. The path of the working
directory is not cleared.
Keep in mind that a separate working directory is maintained for each device.
However, all devices share the same alternate directory paths. To be safe, always
check the path of the working directory after adding a device or setting the default
device.
Remember that in order to change the path of a device that is not currently the default
device, you must first change the default device; see Section 7.2, “Setting the Default
Device,” on page 7-4. To set the path from the command line, see Section 13.34, “PATH Define File Directory Path,” on page 13-42.
4.3 Loading Object Files
You can load DSP Object Module Format (OMF) files or Common Object File Format
(COFF) files directly into the Debugger memory. OMF files are identified by the .lod
extension. COFF files are identified by the .cld extension. The Motorola Suite56 DSP
Assembler generates both file formats.
You can also generate both of the file formats with the DSP Debugger when saving object
files .
4.3.1 To Load a COFF (.cld) File
1. From the File menu, choose Load, then select Memory COFF.
2. Under Load select memory, debug symbols or both.
The Debugger will process the symbol and line number information contained in a
COFF format object file (.cld file) only if the file was compiled or assembled with
debugging enabled. (In the Motorola DSP Assembler this is represented by the –g
option.)
If symbol information has been loaded, the evaluator will accept symbol names or
source file line numbers and translate them into an associated memory address.
3. Under Filename specify the filename of the object file to load or click on the File
button to browse for the file.
4. Click OK.
If the .cld file is not found in the selected directory, the Debugger will try to load
the file from the working directory. If the file does not exist in the working
directory, the Debugger will try to load the file from the alternate directories. An
error message is displayed if the file is not found in any of these directories.
4-4
Suite56 ADS Debugger User’s Manual
Motorola
Saving Object Files
4.3.2 To Load an OMF (.lod) File
1. From the File menu, choose Load, then select Memory OMF.
2. Specify the filename in the dialog box.
It is not necessary to type the extension with the filename. The Debugger assumes
the .lod extension.
3. Click Open.
Keep in mind that the object file is loaded into the memory of the current device. If you
want to load the file into another device, you must first select that device as the default
device.
For more information abut setting the default device see Section 7.2, “Setting the Default
Device,” on page 7-4 and Section 7.4, “Loading Debugger State Files,” on page 7-7. To
load an OMF file from the command line, see Section 13.29, “LOAD - Load DSP Files,”
on page 13-36.
4.4 Saving Object Files
You can save memory blocks in DSP COFF or ASCII OMF object files. The object files
can be reloaded with the Debugger or used in any other environment where such files are
recognized.
Motorola
Object Files and Data Files
4-5
Saving Object Files
4.4.1 To Save a COFF (.cld) File
1. From the File menu choose Save, then select Memory COFF. The dialog box in
Figure 4-3 appears.
Figure 4-3. Saving a COFF (.cld) File
2. Under Memory Space, select the memory to save.
3. Under Start Address, type the beginning address of the memory block.
4. Under End Address, type the last address of the memory block.
5. Under File Name, type in the filename of the file to save or click on File to browse
for the file.
6. The extension default is .cld.
7. Click OK.
If no directory path is specified, the file will be saved in the working directory. If
the file already exists, you will be prompted to decide whether to overwrite the file
or to append it.
The Debugger does not store symbolic debug information.
4-6
Suite56 ADS Debugger User’s Manual
Motorola
Object Module Format
4.4.2 To Save an OMF (.lod) File
1. From the File menu, choose Save, then select Memory OMF.
2. Under Memory Space, select the memory to save.
3. Under Start Address, type the beginning address of the memory block.
4. Under End Address, type the last address of the memory block.
5. Under File Name, type in the filename of the file to save or click on File to browse
the directories.
The extension default is .lod.
6. Click OK.
If no directory path is specified, the file will be saved in the working directory. If
the file already exists, you will be prompted to decide whether to overwrite the file
or to append it.
For more information about object files, see Section 2.3, “Loading Object Files,” on page
2-5. To save an OMF file from the command line, see Section 13.38, “SAVE - Save
Memory To File,” on page 13-45.
4.5 Object Module Format
The DSP Object Module Format (OMF) is an ASCII file that can be produced by the
Debugger, Motorola’s Suite56 DSP Simulator and also by versions of the Suite56 DSP
Assembler prior to release 4.0. An OMF filename uses the .lod extension.
An OMF file consists of variable-length text records. Records can be defined with a fixed
number of fields or can contain repeating instances of a given field (such as instructions or
data).
Motorola
Object Files and Data Files
4-7
Common Object File Format
4.6 Common Object File Format
The Motorola Suite56 DSP assembler and linker produce a binary object file in a modified
form of the AT&T Common Object File Format (COFF). The DSP common object file
format can also be produced by the Debugger when saving object files . A COFF filename
uses the .cld extension.
COFF is a formal definition for the structure of machine code files. It originated with Unix
System V but has sufficient flexibility and generality to be useful in non-hosted
environments. In particular, COFF supports user-defined sections and contains extensive
information for symbolic software testing and debugging.
The DSP COFF format has been altered to support multiple memory spaces and
normalized to promote transportability of object files among host processors. For more
information about Motorola’s implementation of COFF, please refer to the Motorola
Suite56 DSP Assembler Reference Manual.
For a more general discussion of COFF see Gintaras R. Gircys’ book, Understanding and
Using COFF, O’Reilly & Associates, 1988 (ISBN 0-937175-31-5)
4-8
Suite56 ADS Debugger User’s Manual
Motorola
Chapter 5
Managing Memory and Registers
This chapter discusses changing and displaying both memory and register values. You
will also find information concerning dissasembling code stored in memory and the use of
a watch list.
5.1 Resetting the Device Registers
You can reset the device registers or the entire system at any time.
To reset the device registers:
1. From the Execute menu choose Reset, then select Device.
The device registers and peripherals are now reset to the initialized state of the
device.
To reset the system:
1. From the Execute menu choose Reset, then select System.
This resets the command converter and then resets the target devices, putting the
target system into Debug mode.
To reset the registers from the command line, see see,Section 13.22, “FORCE - Assert
RESET or BREAK on Target,” on page 13-28.
Motorola
Managing Memory and Registers
5-1
Displaying Register Values
5.2 Displaying Register Values
You can display the device registers and memory any time instruction execution is halted.
5.2.1 To Display the Value in a Register
1. From the Windows menu choose Register. The dialog box in Figure 5-1 appears.
Figure 5-1. Open Register Window Dialog Box
2. Select the peripheral that you want to view.
3. Click OK.
The register values for the peripheral that you chose appear in a register window. For
example, if you had chosen to display the register values for the core, you would see a
window similar to the one in Figure 5-2.
Figure 5-2. Displaying the Register Values
5-2
Suite56 ADS Debugger User’s Manual
Motorola
Changing Register Values
Notice that the title bar of the register window indicates:
•
•
•
The device number where the peripheral resides,
the number of the register window. This number is shown because you can display
other register windows for other peripherals.
the type of peripheral. The peripheral type is shown for easy identification. Several
register windows can be open – each corresponding to a different peripheral.
5.3 Changing Register Values
You can change the value of the device registers when instruction execution is halted.
5.3.1 To Change the Value of a Specific Register
1. From the Modify menu choose Change Register. The dialog box in Figure 5-3
appears.
Figure 5-3. Changing the Value of Register
2. Select the register whose value you want to change.
3. Under Value, type in the value to which you want the register to be set.
4. Click OK.
More information about using registers is available in Section 10.3, “Using Register Name
Symbols,” on page 10-3.
To work with registers from the command line, see Section 13.14, “CHANGE - Change
Register or Memory Value,” on page 13-20 ,section 5.2, “Displaying Register Values.”
Motorola
Managing Memory and Registers
5-3
Displaying Memory Values
5.4 Displaying Memory Values
You can display the values in memory whenever instruction execution is halted.
5.4.1 To Display Memory Values
1. From the Windows menu choose Memory The dialog box in Figure 5-4 appears.
Figure 5-4. Open Memory Window Dialog Box
2. From the drop-down list, select the memory space for which you want values
displayed.
3. Click OK.
The memory values for the memory space that you chose appear in a memory window:
For example, if you had chosen to display values in the p memory space, you would see a
window similar to the one in Figure 5-5.
Figure 5-5. Displaying Memory Values
5-4
Suite56 ADS Debugger User’s Manual
Motorola
Displaying Memory Values
Notice that the title bar of the memory window indicates:
•
the device number that you are viewing,
•
the number of the memory window. This is shown because you can display other
memory windows simultaneously.
•
the type of memory space. Again, you could have several memory windows open –
each corresponding to a different memory space.
The addresses of the memory locations are indicated by the left-most column of numbers.
An address in that column is the address of the value immediately to the right (the second
column). In the above example, the first address shown is p:$000000, which contains the
value $0014a0. The first several addresses above are as shown in Table 5-1.
Table 5-1. Sample P Memory Address Locations
Address
Content
p:$000000
$0014a0
p:$000001
$0001e0
p:$000002
$ffff01
p:$000003
$ffff01
p:$000004
$000033
p:$000005
$0000ff
p:$000006
000255
p:$000007
16776961
p:$000008
000255
p:$000009
000255
p:$00000a
$000000
p:$00000b
$000000
p:$00000c
$000000
Notice that the contents of memory are not necessarily displayed as hexadecimal. You can
specify that an address be displayed in another radix by changing the radix. In the above
example, the radix of addresses p:$000006 through p:$000009 is decimal. See section 7.3,
“Changing the Radix,” for more information. To change the radix from the command line,
see section 13.36, “RADIX - Change Input or Display Radix.”
Motorola
Managing Memory and Registers
5-5
Changing Memory Values
5.5 Changing Memory Values
You can change the values in memory whenever instruction execution is halted.
5.5.1 To Change the Value in Memory
1. From the Modify menu choose Change Memory The dialog box in Figure 5-6
appears.
Figure 5-6. Changing the Value in Memory
2. From the drop-down list, select the Memory Space that you want to change.
3. Under Start Address, type the value of the beginning address that you want to
change.
4. Under End Address, type the value of the ending address that you want to change.
5. Under Value, type the value to which the specified addresses should be changed.
Keep in mind that all values, including the starting and ending values will be
changed to the value that you specify.
The format of this value (HEX, decimal, etc.) will automatically be the same as the
current default radix. If you want the format of the value to differ from the default,
you must use the appropriate radix specifier before the number:
$ denotes value as hexadecimal
‘ denotes value as decimal
% denotes value as binary
6. Click OK.
See Section 5.4, “Displaying Memory Values,” on page 5-4 and section 7.3, “Changing
the Radix.” To change the radix from the command line, see Section 13.14, “CHANGE Change Register or Memory Value,” on page 13-20.
5-6
Suite56 ADS Debugger User’s Manual
Motorola
Copying Memory
5.6 Copying Memory
You can copy memory from one location to another, either one address at a time or in
blocks. The source and destination memory maps may be different. This allows you to
move data or program code from one memory map to another or to a different address
within the same memory map.
5.6.1 To Copy Memory from One Block to Another
1. From the Modify menu choose Copy Memory. The dialog box in Figure 5-7
appears.
Figure 5-7. Copy Memory Dialog Box
2. In the section labeled From Memory Space, select the memory space to copy
from. Then type the in the starting address and the ending address of the block that
you want copied.
3. In the section labeled To Memory Space, select the memory space to copy to.
Then type in the starting address to begin copying values.
4. Click OK.
Device and debugger configurations is also discussed in Section 7.3, “Changing the
Radix,” on page 7-5. To copy memory from the command line, see Section 13.15, “COPY
- Copy a Memory Block,” on page 13-21.
Motorola
Managing Memory and Registers
5-7
Disassembling Code Stored in Memory
5.7 Disassembling Code Stored in Memory
You can disassemble instructions that have been stored in memory. This allows you to
review DSP object code in its assembly language mnemonic format. Invalid opcodes are
disassembled to a define constant (DC) mnemonic.
5.7.1 To Disassemble Code Stored in Memory
1. From the Display menu choose Disassemble, then select Memory Block. The
dialog box in Figure 5-8 appears.
Figure 5-8. Disassemble Memory Dialog Box
2. In the drop-down list, select the Memory Space that you want to disassemble.
3. Under Start Address, type the address where you want to begin to disassemble..
4. Under End Address, type in the address where you want to stop disassembling.
5. Click OK.
6. View the Session window. You will see the mnemonics of the memory block that
you specified.
More information about disassembly, see Section 7.3, “Changing the Radix,” on page 7-5
and Section 9.2, “Logging Output from the Session Window,” on page 9-2.To
disassemble from the command line, see Section 13.17, “DISASSEMBLE - Single Line
Disassembler,” on page 13-24.
5-8
Suite56 ADS Debugger User’s Manual
Motorola
Using a Watch List
5.8 Using a Watch List
You can watch the contents of a specific memory location, register, or expression by
setting up a watch list. The watch list is updated every time program execution is stopped.
The expression that you watch can be valid even if it is not calculated during program
execution. C expressions can be used, but must be enclosed in curly brackets:
{c_expression}. Symbolic references may be used if symbols have been loaded from the
object module.
5.8.1 To Add an Item to a Watch List
1. From the Windows menu choose Watch. The dialog box in Figure 5-9 appears.
Figure 5-9. Add Watch Expression to Window Dialog Box
2. Under Window select the window number that you want to assign to the Watch
window. This is useful when you have more than one Watch window open.
3. Under Expression, type the expression that you want to appear in the Watch
window.
4. If the expression is a C expression, enclose it in curly brackets: {c_expression}.
5. Under Radix, select the radix format in which you want the variables displayed.
6. Click OK.
The expression that you specified now appears in a Watch window. If the
expression you type is not valid, you will get an error message explaining why the
expression is not valid.
Keep in mind that a C expression that refers to C variables can only be evaluated in the
context in which the watch is established. That is, the variables in the expression are only
valid while they are in scope. If one of the variables in an expression goes out of scope
Motorola
Managing Memory and Registers
5-9
Using a Watch List
(either because of a function call or return from a function), the value is replaced with the
message Expression out of scope. When all elements of the expression are back in scope,
the value is again displayed.
An expression that has gone out of scope because of a function call can be evaluated and
displayed by selecting the stack frame for the evaluation context. The stack frame
assignment remains in effect only until the next instruction is executed. An expression that
is out of scope because of a function exit cannot be evaluated until the function is again
invoked since the expression’s variables no longer exist.
You can find more information about watch lists in Section 8.1, “Moving Up and Down
the Call Stack,” on page 8-1, in Chapter 10, “Expressions,” and in Section 12.1,
“Displaying the Radix,” on page 12-1. To set up a watch list from the command line, see
Section 13.49, “WATCH - Set, Modify, View, or Clear Watch Item,” on page 13-52.
5-10
Suite56 ADS Debugger User’s Manual
Motorola
Chapter 6
Input and Output Files
The device on which you are debugging your application is of course already in
communication with peripherals, ports, or pins. In addition to these inputs and outputs,
you might find it useful to provide data from an input file and capture output to an output
file. The Suite56 DSP Debugger provides you with the ability to create input and output
files.
The Debugger provides input data and captures output data by using I/O files. These I/O
files transfer data to and from the device. You can specify whether the input data is to
come from a file or from the keyboard (terminal). You can specify output data to be
written to a file or to the Session window.
6.1 How are I/O files formatted?
Input and output is represented in ASCII format, which means that I/O files can be
conveniently edited or printed from a text editor. To understand how I/O files format data,
you should be familiar with these concepts:
•
repeat punctuation
•
comments
•
memory data
6.1.1 Repeat Punctuation
The Debugger provides a way to specify repeated input or output data values and
sequences. A single data value can be repeated by adding the following syntax after a data
item:
#{count}
Enclosing several data items in parentheses indicates that the data items are to be treated
as a group. The entire group can then be repeated by placing #{count} immediately
following the closing parenthesis. The parentheses can be nested. A closing parenthesis
without a following repeat count will cause the data sequence within the parentheses to
repeat forever.
Motorola
Input and Output Files
6-1
How are I/O files formatted?
Example 6-1. Repeating Data Values
1FF#20
Repeats the data item 1FF twenty times.
(CC354 CC333 C7000)
Repeats the data sequence CC354 CC333 C7000 forever.
(1#5 0#5)
Repeats the data sequence 1 1 1 1 1 0 0 0 0 0 forever.
6.1.2 Comments
Any information following a semicolon, up to the end-of-line is considered to be a user
comment and is not interpreted as input data or timing.
Example 6-2. User Comment
FFC 333 972 ;next three p memory data words
The first three data values are applied to the device. The information following the
semicolon is a user comment.
6.1.3 Memory Data
When assigned to a memory location, the input file data value supplies the value that is
read when the Debugger references that memory location. The least significant memory
bit maps to the least significant bit of the data value.
The input data value can be in decimal, binary, hexadecimal, or floating-point form. The
Debugger will interpret the data based on the input radix specified in the input command.
The default input radix is hexadecimal. If a data value contains a decimal point, the data
will be input as a floating point value, overriding the input radix specification. The number
base of data values can also be denoted by preceding the data value with a dollar sign ($),
an apostrophe (‘), or a percent sign (%).
6-2
$
input as hexadecimal
‘
input as decimal
%
input as binary
Suite56 ADS Debugger User’s Manual
Motorola
How are I/O files formatted?
Untimed memory input data values will be applied each time the device performs a read
operation on the memory location. In other words, the input file acts like a stack of input
data; each successive data value is retrieved from the “stack” file when a read operation
occurs.
If a lower case letter t is placed in a data position of the input file, you will be prompted
for the next input data value as described in section 6.1.4, “Terminal Input of Data
Values.”
Output data value can be in decimal, binary, hexadecimal, floating point or string form.
The output radix is specified in the output command. The default output radix is
hexadecimal. The string form of output data uses the value written to the memory location
as the starting address in the same memory space of a zero terminated ASCII character
string. The character string is written to the output file.
Example 6-3. Input Data Values to Memory
7FFF 7F3F 5D3C 7FC3
The untimed memory input file will cause the data sequence 7FFF 7F3F
5D3C 7FC3 to appear during consecutive reads of the specified memory
location.
(1FF 0)
The untimed memory input file will cause the data sequence 1FF 0 to appear
repeatedly during consecutive reads of the specified memory location.
Motorola
Input and Output Files
6-3
Assigning an Input File
6.1.4 Terminal Input of Data Values
There are two levels of terminal data input provided by the Debugger. If the input
command specifies term as the input filename, the Debugger opens an editor, which
allows creation of an input data file without leaving the Debugger. The data file is given a
temporary name, termxxxx.io or termxxxx.tio (xxxx being a numeral between
0000-9999), and is saved on the disk at the termination of the input command. The entire
contents of the input file can be specified in this manner.
A second level of terminal data input allows you to be prompted any time the next input
data value is needed. This method is triggered if the lower case letter t is encountered in
the data field of the input file. This is only valid for the data field, not for the time field.
Each time a t is encountered, you will be prompted for a single data value from the
terminal. Hexadecimal is the default input radix. If you just type the return key at the
prompt, without entering a data value, the previous data value will be repeated. If you type
the esc key at the prompt, an end-of-file status will be simulated and the previous data
value will repeat forever.
You can find more information about changing the radix in Section 7.3, “Changing the
Radix,” on page 7-5.
6.2 Assigning an Input File
You can pass simulated data to the target system by providing an input file. The simulated
data is written from an input file that you provide to an address that you specify.
There is some preparation that you must perform outside of the Debugger in order for the
data from the input file to be written properly. You will need to place a debug instruction
in your program and you will need to set designators in certain registers. You need to do
this so that the Debugger knows when to perform the data transfer, from where to get the
data, how much data to get, and where to put the data.
6.2.1 To Prepare for Input Data to be Received
1. Write to the appropriate register a designator that will indicate the input file number
and the word count of the data that you want to input. (You will assign the input
file number of the input file later, when you open it.) The register to which you
write this information depends on the target device.
6-4
Suite56 ADS Debugger User’s Manual
Motorola
Assigning an Input File
Table 6-1. Input File Numbers for Specific Suite56 DSP Devices
Designate the Input File
Number and Word Count
in Register:
Device
Family
Designate the Input File Number and Word Count
in Register:
DSP56000
X0
File Number in the upper 8 bits; count in the lower 16 bits
DSP56100
X0
File Number in the upper 8 bits; count in the lower 8 bits
DSP56300
X0
File Number in the upper 8 bits; count in the lower 16 bits
DSP56600
X0
File Number in the upper 8 bits; count in the lower 8 bits
DSP56800
X0
File Number in the upper 8 bits; count in the lower 8 bits
DSP96000
R0
File Number in the upper 16 bits; count in the lower 16 bits
2. Write to the appropriate register a designator that indicates the memory space, and
to another register the address where you want the data to be written. Designate the
memory space as follows: 0=p, 1=x, 2=y, 3=l.
Table 6-2. Input File Memory Space and Destination Register
Device
Family
Designate the Memory Space
in Register:
Put the Address Where the Input Data
Will Be Written in Register:
DSP56000
R1
R0
DSP56100
R1
R0
DSP56300
R1
R0
DSP56600
R1
R0
DSP56800
R1
R0
DSP96000
R2
R1
3. Place a debug instruction at an appropriate address in your program. This is the
point in the program where you want the data transfer to take place.
For more information see section 6.3, “Examples of How to Assign an Input File.” Once
the debug instruction is written and the registers set, you can assign the input file.
Motorola
Input and Output Files
6-5
Assigning an Input File
6.2.2 To Assign the Input File
1. From the File menu choose Input, then select Open. The dialog box in Figure 6-1
appears.
Figure 6-1. Providing Input Data
2. Under Input Number select the number you want to assign to this input file. The
default number that is shown is the next available number. Input numbers do not
have to be consecutive, they can be assigned arbitrarily, which means that you can
assign input numbers in any way that helps you organize the sources of the inputs.
3. Under From select the source of the input data. Select File if the input data will
come from an existing file.
Select Terminal if the input data will be entered directly from the keyboard.
4. Under Debug Address, type the address where the debug statement of your
program resides. When executed, this debug statement will indicate to the
Debugger that it should transfer the data from the input file.
The write destination for this data is designated by setting the appropriate registers
as described above.
5. Under Radix select the number system (hexadecimal, decimal, etc.) that the input
data is in.
6. If the input data is coming from a file, under File Name type in the name of the
input file or click on the File button to browse for the file. The default filename
extension is .io.
6-6
Suite56 ADS Debugger User’s Manual
Motorola
Examples of How to Assign an Input File
7. Click OK.
If you are entering the data from the terminal (keyboard), the Interactive Input
dialog box will appear when the debug statement is encountered. The Interactive
Input dialog box will prompt you for the data values. Type in the first data value
and click OK. After entering a value and clicking OK, the Interactive Input
dialog box appears again, ready for the second data value. Continue to enter values
and click OK until you have entered all values. When all values have been entered,
click on Cancel in the Interactive Input dialog box.
A file is created in the working directory that contains the data you entered from the
keyboard. The filename will be similar to term0000.io. You can reuse this file as
you would any other input file.
To assign an input file from the command line see Section 13.27, “INPUT - Assign Input
File,” on page 13-32.
6.3 Examples of How to Assign an Input File
There is some preparation that you must perform outside of the Debugger in order for the
data from an input file to be written properly. All of this preparation can be written into
your program. Your program will tell the Debugger the destination from which the data
should be retrieved, how much data to get, where to put the data, and when to perform the
data transfer
These four pieces of information are communicated by including these four elements in
your program:
1. a designation of the input file number and data length
2. a designation of the memory space to write to
3. the beginning address to write to, and
4. a debug instruction.
The following code snippets demonstrate assembly code that you might use in your
program to indicate these four elements.
Motorola
Input and Output Files
6-7
Examples of How to Assign an Input File
6.3.1 DSP56000 Family
The input file number and the data length must be indicated in the X0 register (24-bit
register). Indicate these by writing the file number in the upper 8 bits and the count in the
lower 16 bits. Then indicate the beginning address in register R0. Then indicate the
memory space in register R1 (0=P, 1=X, 2=Y, 3=L)
Table 6-3. Input File Assembly Code for DSP56000 Family
Operation
Comment
MOVE #$03000c, X0
;input from file #3 a block of 12 words
MOVE #$100,R0
;begin writing data at address $100
MOVE #1,R1
;in X memory space
DEBUG
;enter Debug mode
6.3.2 DSP56100 Family
First, the input file number and the data length must be indicated in the X0 register (16-bit
register). Indicate these by writing the file number in the upper 8 bits and the count in the
lower 8 bits. Then indicate the beginning address in register R0. Then indicate the memory
space in register R1 (0=P, 1=X, 2=Y, 3=L).
Table 6-4. Input File Assembly Code for DSP56100 Family
Operation
6-8
Comment
MOVE #$030c, X0
;input from file #3 a block of 12 words
MOVE #$100,R0
;begin writing data at address $100
MOVE #1,R1
;in X memory space
DEBUG
;enter Debug mode
Suite56 ADS Debugger User’s Manual
Motorola
Examples of How to Assign an Input File
6.3.3 DSP56300 Family
The input file number and the data length must be indicated in the X0 register (24 bit
register). Indicate these by writing the File Number in the upper 8 bits and the count in the
lower 16 bits. Then indicate the beginning address in register R0. Then indicate the
memory space in register R1 (0=P, 1=X, 2=Y, 3=L).
Table 6-5. Input File Assembly Code for DSP56300 Family
Operation
Comment
MOVE #$03000c, X0
;input from file #3 a block of 12 words
MOVE #$100,R0
;begin writing data at address $100
MOVE #1,R1
;in X memory space
DEBUG
;enter Debug mode
6.3.4 DSP56600 Family
The input file number and the data length must be indicated in the X0 register (16 bit
register). Indicate these by writing the File Number in the upper 8 bits and the count in the
lower 8 bits. Then indicate the beginning address in register R0. Then indicate the memory
space in register R1 (0=P, 1=X, 2=Y, 3=L).
Table 6-6. Input File Assembly Code for DSP56600 Family
Operation
Comment
MOVE #$030c, X0
;input from file #3 a block of 12 words
MOVE #$100,R0
;begin writing data at address $100
MOVE #1,R1
;in X memory space
DEBUG
;enter Debug mode
Motorola
Input and Output Files
6-9
Examples of How to Assign an Input File
6.3.5 DSP56800 Family
The input file number and the data length must be indicated in the X0 register (16 bit
register). Indicate these by writing the File Number in the upper 8 bits and the count in the
lower 8 bits. Then indicate the beginning address in register R0. Then indicate the memory
space in register R1 (0=P, 1=X, 2=Y, 3=L).
Table 6-7. Input File Assembly Code for DSP56800 Family
Operation
Comment
MOVE #$030c, X0
;input from file #3 a block of 12 words
MOVE #$100,R0
;begin writing data at address $100
MOVE #1,R1
;in X memory space
DEBUG
;enter Debug mode
6.3.6 DSP96000 Family
The input file number and the data length must be indicated in the X0 register (32 bit
register). Indicate these by writing the File Number in the upper 16 bits and the count in
the lower 16 bits. Then indicate the beginning address in register R0. Then indicate the
memory space in register R1 (0=P, 1=X, 2=Y, 3=L).
Table 6-8. Input File Assembly Code for DSP96000 Family
Operation
Comment
MOVE #$0003000c, X0
;input from file #3 a block of 12 words
MOVE #$100,R0
;begin writing data at address $100
MOVE #1,R1
;in X memory space
DEBUG
;enter Debug mode
For more information see section 6.2, “Assigning an Input File.”
6-10
Suite56 ADS Debugger User’s Manual
Motorola
Assigning an Output File
6.4 Assigning an Output File
You can write data from a target device to a file. The output will be written in ASCII
format and can be written in the radix that you specify.
Before opening an output file, there is some preparation that you must perform outside of
the Debugger in order for the data to be correctly written to the output file. You will need
to place a debug instruction in your program and you will need to set designators in
certain registers. You need to do this so that the Debugger knows when to perform the data
transfer, from where to get the data, how much data to get, and where to put the data.
6.4.1 To Prepare Data to be Written to an Output File
1. Write to the appropriate register a designator that will indicate the output file
number and the word count (length) of the data that you want to write. (You will
assign the output file number later, when you actually open it.) The register to
which you write this information depends on the target device.
Table 6-9. Output File Designators for Specific Suite56 DSP Devices
Device
Family
Designate the Output File
Number and Word Count in
Register:
Designate the Output File Number and the Word
Count (I.e. Length) of the Data as Follows:
DSP56000
X0
File Number in the upper 8 bits; count in the lower 16
bits
DSP56100
X0
File Number in the upper 8 bits; count in the lower 8
bits
DSP56300
X0
File Number in the upper 8 bits; count in the lower 16
bits
DSP56600
X0
File Number in the upper 8 bits; count in the lower 8
bits
DSP56800
X0
File Number in the upper 8 bits; count in the lower 8
bits
DSP96000
R0
File Number in the upper 16 bits; count in the lower 16
bits
2. Write to the appropriate registers a designator that indicates the memory space and
address from where you want the data to be read. Designate the memory space as
follows: 0=p, 1=x, 2=y, 3=l.
Motorola
Input and Output Files
6-11
Assigning an Output File
Table 6-10. Designations for Memory Space and Address Registers
Device
Family
Designate the
Memory Space in
Register:
Put the Address from Where
the Data Will Be Read In
Register:
DSP56000
R1
R0
DSP56100
R1
R0
DSP56300
R1
R0
DSP56600
R1
R0
DSP56800
R1
R0
DSP96000
R2
R1
3. Place a debug instruction at an appropriate address in your program. This is the
point in the program where you want the data transfer to take place.
For more information see section 6.5, “Examples of How to Assign an Output File.” Once
the registers are set and the debug instruction written, you can open the output file.
6.4.2 To Open an Output File
1. From the File menu choose Output, then select Open. The dialog box in
Figure 6-2 appears.
Figure 6-2. Creating an Output File
6-12
Suite56 ADS Debugger User’s Manual
Motorola
Examples of How to Assign an Output File
2. Under Output Number select the number you want to assign to this output. The
default number that is shown is the next available number.
Output numbers do not have to be consecutive, they can be assigned arbitrarily,
which means that you can assign output numbers in any way that helps you
organize the output files.
3. Under To select the destination of the output file.
Select File if the output data is to be written to a file.
Select Terminal if the output data is to be written to the Session window rather
than a file.
4. Under Debug Address type the address where the Debug instruction that will
trigger this data transfer resides.
5. Under Radix select the radix (hexadecimal, decimal, etc.) in which the output data
should be written.
6. If the output data is being sent to a file, under File Name type in the name of the
output file or click on the File button to browse for the file. The default filename
extension is .io. The output file will be in ASCII format.
7. Click OK.
For more information see section 6.5, “Examples of How to Assign an Output File.” To
assign an output file from the command line, see Section 13.33, “OUTPUT - Assign
Output File,” on page 13-40.
6.5 Examples of How to Assign an Output File
There is some preparation that you must perform outside of the Debugger in order for data
to be correctly written to an output file. You will need to place a debug instruction in your
program and you will need to set designators in certain registers. You need to do this so
that the Debugger knows when to perform the data transfer, from where to get the data,
how much data to get, and where to put the data.
These four pieces of information are communicated by including these four elements in
your program:
1. A designation of the output file number and data length,
2. a designation of the memory space to read from,
3. the address to begin reading from, and
4. a debug instruction.
The following code snippets demonstrate assembly code that you might use in your
program to indicate these four elements.
Motorola
Input and Output Files
6-13
Examples of How to Assign an Output File
6.5.1 DSP56000 Family Output
The output file number and the data length must be indicated in the X0 register (24-bit
register). Indicate these by writing the file number in the upper 8 bits and the count in the
lower 16 bits. Then indicate the beginning address in register R0. Then indicate the
memory space in register R1 (0=P, 1=X, 2=Y, 3=L).
Table 6-11. Ouput File Assembly Code for DSP56000 Family
Operation
Comment
MOVE #$03000c, X0
;output to file #3 a block of 12 words
MOVE #$100,R0
;write data from address $100
MOVE #1,R1
;in X memory space
DEBUG
;enter Debug mode
6.5.2 DSP56100 Family Output
First, the output file number and the data length must be indicated in the X0 register (16
bit register). Indicate these by writing the File Number in the upper 8 bits and the count in
the lower 8 bits. Then indicate the beginning address in register R0. Then indicate the
memory space in register R1 (0=P, 1=X, 2=Y, 3=L).
Table 6-12. Output File Assembly Code for DSP56100 Family
Operation
6-14
Comment
MOVE #$030c, X0
;output to file #3 a block of 12 words
MOVE #$100,R0
;write data from address $100
MOVE #1,R1
;in X memory space
DEBUG
;enter Debug mode
Suite56 ADS Debugger User’s Manual
Motorola
Examples of How to Assign an Output File
6.5.3 DSP56300 Family Output
The output file number and the data length must be indicated in the X0 register (24 bit
register). Indicate these by writing the File Number in the upper 8 bits and the count in the
lower 16 bits. Then indicate the beginning address in register R0. Then indicate the
memory space in register R1 (0=P, 1=X, 2=Y, 3=L).
Table 6-13. Output File Assembly Code for DSP56300 Family
Operation
Comment
MOVE #$03000c, X0
;output to file #3 a block of 12 words
MOVE #$100,R0
;write data from address $100
MOVE #1,R1
;in X memory space
DEBUG
;enter Debug mode
6.5.4 DSP56600 Family Output
The output file number and the data length must be indicated in the X0 register (16-bit
register). Indicate these by writing the file number in the upper 8 bits and the count in the
lower 8 bits. Then indicate the beginning address in register R0. Then indicate the memory
space in register R1 (0=P, 1=X, 2=Y, 3=L).
Table 6-14. Output File Assembly Code for DSP56600 Family
Operation
Comment
MOVE #$030c, X0
;output to file #3 a block of 12 words
MOVE #$100,R0
;write data from address $100
MOVE #1,R1
;in X memory space
DEBUG
;enter Debug mode
Motorola
Input and Output Files
6-15
Examples of How to Assign an Output File
6.5.5 DSP56800 Family Output
The output file number and the data length must be indicated in the X0 register (16-bit
register). Indicate these by writing the file number in the upper 8 bits and the count in the
lower 8 bits. Then indicate the beginning address in register R0. Then indicate the memory
space in register R1 (0=P, 1=X, 2=Y, 3=L).
Table 6-15. Output File Assembly Code for DSP56800 Family
Operation
Comment
MOVE #$030c, X0
;output to file #3 a block of 12 words
MOVE #$100,R0
;write data from address $100
MOVE #1,R1
;in X memory space
DEBUG
;enter Debug mode
6.5.6 DSP96000 Family Output
The output file number and the data length must be indicated in the X0 register (32-bit
register). Indicate these by writing the file number in the upper 16 bits and the count in the
lower 16 bits. Then indicate the beginning address in register R0. Then indicate the
memory space in register R1 (0=P, 1=X, 2=Y, 3=L).
Table 6-16. Output File Assembly Code for DSP96000 Family
Operation
Comment
MOVE #$0003000c, X0
;output to file #3 a block of 12 words
MOVE #$100,R0
;write data from address $100
MOVE #1,R1
;in X memory space
DEBUG
;enter Debug mode
For more information see section 6.4, “Assigning an Output File.”
6-16
Suite56 ADS Debugger User’s Manual
Motorola
Chapter 7
Debugger and Device Configurations
You will want to make sure that you have specified a specific DSP configuration for each
device. The internal memory attributes are determined by the selected device
configuration. External memory access is also determined by the device configuration.
However, the effects of writing external RAM, ROM or peripherals can be totally
controlled by you.
Motorola
Debugger and Device Configurations
7-1
To Set the Configuration of a Device
7.1 To Set the Configuration of a Device
1. From the Modify menu select Device. Then choose configure. The dialog box in
Figure 7-1appears.
Figure 7-1. Setting the Configuration of a Device
2. Under Device select the number of the device that you want to configure
3. Under Configure select whether you are designating the Type of the device,
whether it is to be enabled or disabled by indicating On or Off, or indicate that you
want to Remove the device from being part of your target system.
At least one device must be activated at all times; the last device cannot be
removed.
4. Under Device Type select the appropriate device type.
7-2
Suite56 ADS Debugger User’s Manual
Motorola
To Set the Configuration of a Device
5. Under Command Converter select the command converter to which the device is
connected. The ADS supports up to eight command converters on a single
development host. Each command converter supports one JTAG chain which can
serve up to twenty-four devices.
6. Under TMS Chain select the TMS (Test Module Select) line that controls this
device
7. Under Position in TMS Chain select the position that the device occupies in the
JTAG chain The device connected directly to TDO from the command converter is
pos0.
8. Click OK.
The Debugger provides the flexibility for you to define external memory responses by
supplying the C language source code for the external memory functions. The source code
used as a default is contained in the file simvmem.c.
By changing memory values you can change the on-chip bootstrap and data ROM areas.
The bootstrap ROM is specified by using PR: as the memory space designator. The data
ROMs can be specified by XR: or YR:. Loading an assembler output file can also modify
the bootstrap ROM or data ROM areas. The ROM areas can be reinitialized by selecting
Reset from the Execute menu, then selecting State.
For more information see Section 5, “Managing Memory and Registers,” on page 5-1.
Motorola
Debugger and Device Configurations
7-3
Setting the Default Device
7.2 Setting the Default Device
You can specify any device to be the default device. This, of course, is necessary when
you are debugging a system that contains more than one device.
7.2.1 To Set the Default Device
1. From the Modify menu choose Device then select Set Default. The dialog box in
Figure 7-2 appears.
Figure 7-2. Setting the Default Device
2. Under Device select the number of the device that you want to be the default device
(also referred to as the current device).
3. Click OK.
The default device is the device to which commands are applied. When you change the
default device, the Session window and the Command window will automatically change
to reflect the information for the new device. However, other windows such as the
Assembly window, Source window, etc. will not automatically update themselves to
reflect the new device. This allows you to display the information for separate devices in
separate windows at the same. To see the information for the new default device, open
another Assembly window, Source window, etc.
To specify the default device from the command line, see Section 13.16, “DEVICE Select Default Device,” on page 13-22.
7-4
Suite56 ADS Debugger User’s Manual
Motorola
Changing the Radix
7.3 Changing the Radix
You can change the default radix (number base) that the Debugger uses for command
parameters and other values that you input. You can also change the radix used to display
specific registers and memory locations.
As an alternative to changing the default radix, you can also denote the number base of a
value by preceding it with a dollar sign ($), an apostrophe (‘), or a percent sign (%).
$
value is hexadecimal
‘
value is decimal
%
value is binary
The Debugger begins with the default radix set to decimal for input and hexadecimal for
most output. Changing the default input radix is useful because it allows you to enter
values without having to type the radix specifiers before each value.
7.3.1 To Change the Radix of Input
1. From the Modify menu choose Radix then select Set default. The dialog box in
Figure 7-3 appears.
Figure 7-3. Changing the Radix of Input
2. Note that the current default radix is automatically selected.
3. Under Radix select the number system to use. This system will be the default for
values that you provide when performing commands.
4. Click OK.
This change to the input radix does not affect the display radix of registers or
memory.
Motorola
Debugger and Device Configurations
7-5
Changing the Radix
7.3.2 To Change the Radix in which to Display a Register or Memory
Location
1. From the Modify menu choose Radix, then select Set Display. The dialog box in
Figure 7-4 appears.
Figure 7-4. Displaying a Register or Memory Locations
2. Under Radix select the number system to use.
3. Under Registers select the register that will be displayed with the new radix To
select more than one register, hold down the CTRL key while single clicking on the
register names.
4. Under Memory select the memory space and addresses that will be displayed with
the new radix.
5. Click OK.
You have now changed the radix in which the selected registers and memory will
be displayed. This change to the display radix does not, however, affect the input
radix.
To set the input or display radix from the command line, see Section 13.36, “RADIX Change Input or Display Radix,” on page 13-44. You can also find more infomration in
Section 12.1, “Displaying the Radix,” on page 12-1.
7-6
Suite56 ADS Debugger User’s Manual
Motorola
Loading Debugger State Files
7.4 Loading Debugger State Files
You can reset the condition of the Debugger to a previous state. This is done with a
Debugger state file (.adm). The state file acts like an initialization file which includes
information about:
•
the state of all DSP devices in the system, and their device type
•
enabled registers, counters, status registers, peripheral registers, etc.
•
the entire contents of memory,
•
the windows settings, and
•
the Session window output buffer for each device
Essentially, a state file contains all the information needed to exactly duplicate the
condition of the Debugger as it existed when the state file was saved.
This may be used in several ways. For example, if you are in a long development session
and want to take a break, save the Debugger state to a state file so as not to lose your place.
Or if a particular part of a program is proving troublesome, the state may be saved just
before the problem area, simplifying the setup for repeated attempts to isolate the problem.
There are, of course, many reasons for saving the state of the Debugger.
7.4.1 To Load a Debugger State File
1. From the File menu, choose Load, then select State.
2. Specify the name of the state file in the dialog box.
3. Click on Open.
The current state of the Debugger is replaced by the state information in the .adm
file.
For more information see Section 2.3, “Loading Object Files,” on page 2-5.
Motorola
Debugger and Device Configurations
7-7
Changing and Saving Window Preferences
7.5 Changing and Saving Window Preferences
You can save the positions and settings of windows that you have open in the Debugger.
When you restart the Debugger, all window positions and settings will be restored.
7.5.1 To Save Window Settings
1. From the File menu choose Preferences. The dialog box in Figure 7-5 appears.
Figure 7-5. Saving Window Status on Exit
2. Mark the checkbox labeled Save Window Status On Exit.
3. Click OK.
The position and font of each window that is open will be retained after you have exited
the Debugger.
7-8
Suite56 ADS Debugger User’s Manual
Motorola
Chapter 8
Debugging C Source Code
The Debugger provides several features that are specifically used in debugging C source
code. The following topics will help you understand how to best use the Debugger for
debugging C source code. (Remember when you compile your source code to include
debug information.)
•
Moving up and down the Call Stack
•
Displaying the Call Stack
•
Monitoring C Function Calls
•
Enabling/Disabling IO Streams
•
Redirecting an IO Stream
•
Display the TYPE of a C variable or expression
8.1 Moving Up and Down the Call Stack
8.1.1 To Move Up the Call Stack
You can move the current frame up and down the call stack.
1. From the Modify menu choose Up The dialog box in Figure 8-1 appears.
Figure 8-1. Moving Up the Call Stack
2. Under Frames select the number of frames to move up in the stack
3. Click OK.
The frame to which you moved is now the current starting point for evaluations.
Motorola
Debugging C Source Code
8-1
Moving Up and Down the Call Stack
8.1.2 To Move Down The Call Stack
1. From the Modify menu choose Down The dialog box in Figure 8-2 appears.
Figure 8-2. Moving Down the Call Stack
2. Under Frames select the number of frames to move down the stack
3. Click OK.
The frame to which you moved is now the current starting point for evaluations.
To move up and down the call stack from the command line, see Section 13.46, “UP Move Up the C Function Call Stack,” on page 13-51 and Section 13.19, “DOWN - Move
Down the C Function Call Stack,” on page 13-26.
8-2
Suite56 ADS Debugger User’s Manual
Motorola
Displaying the Call Stack
8.2 Displaying the Call Stack
You can display the C function call stack beginning with the frame you specify.
1. From the Display menu choose Call Stack. The dialog box in Figure 8-3 appears
Figure 8-3. Displaying the Call Stack
2. Under Frames, select whether you want to display the innermost or outermost
frames.
3. Under Count, specify the number of frames you want to display.
4. Click OK.
If you are writing a script, it can be useful to use the where command to display the C
function call stack.
To use where from the command line, see Section 13.54, “WHERE - GUI C Call Stack
Window,” on page 13-54.
Motorola
Debugging C Source Code
8-3
Monitoring C Function Calls
8.3 Monitoring C Function Calls
You can monitor the calls that are made by C functions by displaying the Calls window.
The Calls window is updated as each instruction is executed. If the instruction contains no
function call, three question marks are shown ??? to indicate that no function is
recognized.
1. From the Windows menu choose Calls. The dialog box in Figure 8-4 appears.
Figure 8-4. Monitoring C Function Calls
2. Double-click a stack level to select it as the expression context to evaluate
expressions.
Each function call adds another stack frame, each return removes one. Entry #0 is the most
nested function, that is the top entry on the stack, The highest number is the main()
function. Each line of the Calls window shows:
•
a number to indicate the level to which the call is nested,
•
the PC return address (i.e. the address after the function call), and
•
the name of the function.
The top level represents the call that first entered the debug monitor, and so indicates the
next instruction to be executed.
The call stack also indicates the context to use for evaluating C expressions. As each
function may have its own copy of a named variable, it may be necessary to indicate
which instance is required.
To use monitor C function calls from the command line, see Section 13.23, “FRAME Select C Function Call Stack Frame,” on page 13-29 and Section 13.52, “WCALLS - GUI
C Calls Stack Window,” on page 13-54.
8-4
Suite56 ADS Debugger User’s Manual
Motorola
Enabling/Disabling IO Streams
8.4 Enabling/Disabling IO Streams
You can enable or disable stream I/O for C programs that are running on the current
device. The standard stream files are supported: STDIN, STDOUT, and STDERR. Any
references by C programs to these files may be redirected to files on the host.
Stream file handling may be configured independently for each device. Streams handling
is enabled by default. If a C program attempts to access a stream file while it is not enabled
and redirected, the access is ignored. Output is discarded, and a standard value is supplied
as input. To enable or disable the I/O stream:
1. From the File menu choose IO Streams.
2. Select Enable or Disable.
To enable or disable the I/O stream from the command line, see Section 13.40,
“STREAMS - Enable/Disable Handling of I/O for C Programs,” on page 13-47.
Motorola
Debugging C Source Code
8-5
Redirecting an I/O Stream
8.5 Redirecting an I/O Stream
You can redirect an I/O stream from the current device to a file on the host. Each stream
file can be assigned individually; unwanted streams do not have to be redirected.
Streams can be redirected whether stream support is enabled or disabled; however, for the
redirection to be effective, stream operations must be enabled. Disabling stream support
while a stream is redirected does not terminate the redirection. It merely makes it
ineffective until streams are enabled.
8.5.1 To Redirect the I/O Stream
1. From the File menu choose IO Redirect, then select Streams. The dialog box in
Figure 8-5 appears.
Figure 8-5. Redirecting the I/O Stream
2. Under Stream select the type of stream that you want redirected: STDIN,
STDOUT, or STDERR.
3. Under File Name specify the filename to redirect the stream or click on the File
button to browse for the file.
4. Click OK.
8.5.2 To Stop Redirecting the Stream I/O
1. From the File menu choose IO Streams, then select Off.
2. Select the type of stream to stop redirecting.
3. Click OK.
8-6
Suite56 ADS Debugger User’s Manual
Motorola
Displaying the Type of a C Expression
8.5.3 To Display Redirected Stream I/O
1. From the Display menu choose Redirected IO Streams
2. View the Session window. The redirected stream will be listed with the filename to
which the stream are being directed.
To redirect the stream I/O from the command line, see Section 13.37, “REDIRECT Redirect stdin/stdout/stderr for C Programs,” on page 13-44.
8.6 Displaying the Type of a C Expression
You can display a C variable or expression’s type. Keep in mind that you might need to
move up or down the call stack to select the desired expression context. You can also
change the current context when monitoring c function calls.
8.6.1 To Display The Type of a C Variable or Expression
1. From the Display menu choose Type. The dialog box in Figure 8-6. appears
Figure 8-6. Displaying the Type of a C Variable or Expression
2. Type in the expression. Remember to enclose C expressions in curly brackets. For
example:
{gi * i}
3. Click OK.
4. The data type is displayed in the Session window . If the result of the expression is
a storage location (for example, a variable name or an element of an array), the
address of the storage location will be displayed in addition to its data type
To display the type of a C variable from the command line, see Section 13.43, “TYPE Display the Result Type of a C Expression,” on page 13-49.
Motorola
Debugging C Source Code
8-7
Displaying the Type of a C Expression
8-8
Suite56 ADS Debugger User’s Manual
Motorola
Chapter 9
Macros, Scripts, and Log Files
The command macro is a useful tool for performing multiple Debugger commands. The
command macro is useful for performing commonly repeated tasks such as setting the
path, loading source programs, and setting up watch windows. However, a macro can
consist of almost any Debugger commands.
9.1 Creating and Running a Command Macro
The command macro is a standard ASCII text file, and can be created or edited with any
text editor. The macro can also be created by recording commands to a log file.
9.1.1 To Record a Command Macro
1. From the File menu, choose Log, then select Commands.
2. Specify the filename and save.
The default filename extension is .cmd. A different extension can be used, but is
not recommended for the sake of consistency.
If you specify a filename that already exists, you can choose to overwrite the file or
append the new commands to the end of the existing file.
3. The log file is now recording all Debugger commands, whether issued from the
menu bar or from the command line in the Command window. Use the Debugger
commands just as you would during normal program execution.
Note that there is an exception. If you stop program execution while recording
commands, the stop is not recorded. The only way to pause execution from within
a macro is to use step, next, trace, until, wait or a breakpoint.
If you have any question about whether a command can be recorded, think of it this
way: if it appears in the command window, it is recorded.
4. To stop recording, from the File menu choose Log, then select Close.
5. From the dialog box select Commands.
6. Click OK
The command macro is now saved and can be replayed or edited.
Motorola
Macros, Scripts, and Log Files
9-1
Logging Output from the Session Window
9.1.2 To Run a Command Macro
1. From the File menu, choose Macro.
2. Specify the file to run and click Open.
The command macro begins. The commands are displayed in the Command
window as they are executed. The commands are also echoed in the Session
window, along with any output that is generated.
You can stop the execution of the command macro by choosing Stop from the Execute
menu or by clicking on the Stop button on the tool bar.
You can find more information about program exection in Section 3.12, “Pausing
Execution with Wait,” on page 3-24 and in Section 3.14, “Stopping Program Execution,”
on page 3-26 To use command macros from the command line, see Section 13.30, “LOG Log Commands or Session Output,” on page 13-37.
9.2 Logging Output from the Session Window
You can log all output that is displayed in the Session window. This is especially useful if
you are trying to capture information that might span several screens.
9.2.1 To Log Output Displayed in the Session Window
1. From the File menu choose Log, then select Session
2. Specify the filename that you want to give the log file and click OK.
All output that is echoed in the Session window will now also be written to the log
file you specified.
9.2.2 To Stop Logging from the Session Window
1. From the File menu choose Log, then select Close. A dialog box appears.
2. Mark the Session checkbox.
3. Click OK.
9-2
Suite56 ADS Debugger User’s Manual
Motorola
Chapter 10
Expressions
An expression consists of a combination of symbols, constants, operators, and
parentheses. Expressions follow the conventional rules of algebra and Boolean arithmetic.
Expressions might contain any combination of integers, floating-point numbers, memory
space symbols and register symbols.
The Debugger allows the use of expressions for various purposes. Expressions can be used
in most places where a constant is valid. For example, an expression can take the place of
the start and stop location in the specification of an address range. Or, an expression might
be used to indicate the location of a breakpoint. Expressions can also be used in a watch
list. You will find that there are various uses for expressions.
Motorola
Expressions
10-1
Evaluate Expressions
10.1 Evaluate Expressions
You can evaluate DSP assembler expressions and C expressions and write the result to the
Session Window.
1. From the Display menu choose Evaluate. The dialog box in Figure 10-1 appears.
Figure 10-1. Evaluating an Expression
2. Under Expression type the expression that you want to evaluate; if the expression
is a C expression, enclose it in curly braces: {c_expression}
Note that some hexadecimal constants, such as a0 or d1, may also be valid register
names for the target device. It is usually best to precede hexadecimal constants with
a dollar sign ($) to distinguish them from registers that might have the same name.
If there is no dollar sign ($) preceding an hexadecimal number and it is in fact also
the name of a register, the Debugger assumes that you are referring to the register.
3. Under Radix select the radix in which to display the result of the expression.
If All is selected, a C expression will display the type of the expression and the
value in the format that is normal for the expression type.
Selecting All when evaluating a DSP assembler expression will display select
radices depending on the expression itself.
4. Click OK.
The Session window displays the result of your evaluation.
C expressions are evaluated in the context of the current stack frame by default - that is,
the value displayed is that which would have been returned if the expression had been
included in the program at the current execution point. C expressions can be evaluated in
the context of any of the functions on the call path to the current function.
To evaluate expressions from the command line, see Section 13.20, “EVALUATE Evaluate an Expression,” on page 13-27.
10-2
Suite56 ADS Debugger User’s Manual
Motorola
Using Register Name Symbols
10.2 Using Memory Space Symbols
The Debugger interprets a memory space symbol followed by an expression as the
contents of a memory location. The expression following a memory space symbol is
converted to an integer constant in the address range of the DSP.
To see a list of valid memory space prefixes and their corresponding address ranges, from
the command line of the Command window type help mem.
Some memory space symbols, such as p: or x:, require the Debugger to first read the
device Operating Mode Register (OMR). Others, such as xi: or pr:, refer to an exact
memory location regardless of the chip operating mode.
For more information see Section 5, “Managing Memory and Registers,” on page 5-1 and
Section 5.5, “Changing Memory Values,” on page 5-6.
10.3 Using Register Name Symbols
The Debugger interprets a register symbol in an expression as the contents of that register.
To see a list of valid register names for the device that you are targeting, from the
command line of the Command window type help reg.
Note that some hexadecimal constants, such as a0 or d1, may also be valid register names
for the target device. It is usually best to precede hexadecimal constants with a dollar sign
($) to distinguish them from registers that might have the same name.
For more information see Section 5.2, “Displaying Register Values,” on page 5-2 and
Section 7.3, “Changing the Radix,” on page 7-5.
Motorola
Expressions
10-3
Using Assembler Debug Symbols
10.4 Using Assembler Debug Symbols
When loading object files with the Debugger, the symbol and line number information
present in a COFF (.cld) object file are also be loaded. (This requires the object file to have
been assembled with debugging information.) The Debugger will accept symbol names or
source file line numbers and translate them into an associated memory address.
In general a symbol name may be referenced in the Debugger just as it was defined in the
original source file, except for symbol names that conflict with a device’s register name.
In that case the symbol name must be preceded by the @ character.
A symbol name can be further delimited by specifying a containing section name in the
form section_name@symbol_name, with the @ character being used as the separator.
The section name global may be used for the global section. If a symbol is specified
without a preceding section name, the Debugger assumes the section containing the
current pc.
Line numbers can be expressed simply as a decimal integer preceded by the @ character
when referring to a line in the current source file. If an address field is being specified in a
command, the @ character can be omitted. A line number in a particular source file should
be expressed in the form source_filename@line_number.
10-4
Suite56 ADS Debugger User’s Manual
Motorola
Using Assembler Debug Symbols
Table 10-1 provides valid forms of symbol names and line numbers.
Table 10-1. Symbol Names and Line Numbers
Syntax
Description
symbol_name
Translates to the address associated with symbol_name.
Example: change pc lab_d
@symbol_name
Translates to the address associated with symbol_name.
Example: disassemble @start_1
section_name@symbol_
name
Translates to the address associated with symbol_name in section
section_name
Example: display sec3@xdata
@section_name@symbol
_name
Translates to the address associated with symbol_name in section
section_name
Example: display @sec3@xdata
line_number
Translates to the address associated with line_number in the current
source file.
Example: break 30
@line_number
Translates to the address associated with line_number in the current
source file.
Example: change pc @30
source_filename@line
_number
Translates to the address associated with line_number in the named
source file.
Example: change pc test.asm@30
@source_filename@lin
e_number
Translates to the address associated with line_number in the named
source file.
Example: change pc @test.asm@30
source_filename
Translates to the address associated with the first line in the named
source file.
Example: list test.asm
@source_filename
Translates to the address associated with the first line in the named
source file.
Example: list @test.asm
For more information see Section 2.3, “Loading Object Files,” on page 2-5.
Motorola
Expressions
10-5
Using Constants
10.5 Using Constants
Constants represent quantities of data that do not vary in value during the execution of a
program.
10.5.1 Numeric Constants
Numeric constants can be in one of three bases:
•
Binary constants consist of a percent sign (%) followed by a string of binary digits
(0,1). For example:
%11010
%1001100
•
Hexadecimal constants consist of a dollar sign ($) followed by a string of
hexadecimal digits (0-9, A-F or a-f). For example:
$FF
$12FF
$12ff
•
Decimal constants can be either floating point or integer. Integer decimal constants
consist of a string of decimal (0-9) digits. Floating point constants are indicated
either by a preceding, following, or included decimal point or by the presence of an
upper or lower case ’E’ followed by the exponent. The special constants inf and
nan can be used in floating point expressions to represent the IEEE floating point
values of infinity and not-a-number for DSP devices which operate with IEEE
floating point values. For example:
12345(integer)
6E10(floating point)
.6(floating point)
2.7e2(floating point)
A constant can be written without a leading radix indicator by changing the radix. For
example, a hexadecimal constant can be written without the leading dollar sign ($) if the
input radix is set to hex. The default for the input radix is decimal.
For more information see Section 7.3, “Changing the Radix,” on page 7-5.
10-6
Suite56 ADS Debugger User’s Manual
Motorola
Operators in Expressions
10.6 Operators in Expressions
Some operators can be used with both floating-point and integer values. If one of the
operands of the operator has a floating point value and the other has an integer value, the
integer will be converted to a floating point value before the operator is applied and the
result will be floating point. If both operands of the operator are integers, the result will be
an integer value. Similarly, if both the operands are floating point, the result will be a
floating point value.
Operators recognized by the Debugger include the following.
10.6.1 Unary Operators
minus (-)
negate ( ~ ) - Integer only
logical negate (!) - Integer only
The unary negate operator will return the one’s complement of the following operand. The
unary logical negation operator will return an integer 1 if the operand following it is 0 and
will return a 0 otherwise. The operand must have an integer value.
10.6.2 Arithmetic Operators
addition (+)
subtraction (-)
multiplication (*)
division (/)
mod (%)
The divide operator applied to integer numbers produces a truncated integer result. The
mod operator applied to integers will yield the remainder from the division of the first
expression by the second. If the mod operator is used with floating point operands, the
mod operator will apply the following rules:
Y % Z = Y if Z = 0
= X if Z <> 0
where X has the same sign as Y, is less than Z, and satisfies the relationship:
Y = i * Z + X
where i is an integer.
Motorola
Expressions
10-7
Operators in Expressions
10.6.3 Bitwise Operators (Binary)
AND (&) - Integer only
inclusive OR (|) - Integer only
exclusive OR (^) - Integer only
Bitwise operators cannot be applied to floating point operands.
10.6.4 Shift Operators (Binary)
shift right (>>) - Integer only
shift left (<<) - Integer only
The shift right operator causes the left operand to be shifted to the right (and zero-filled)
by the number of bits specified by the right operand. The shift left operator causes the left
operand to be shifted to the left by the number of bits specified by the right operand. The
sign bit will be replicated. Shift operators cannot be applied to floating point operands.
10.6.5 Relational Operators
less than (<)
greater than (>)
equal (==) or (=)
less than or equal (<=)
greater than or equal (>=)
not equal (!=)
Relational operators all work the same way. If the indicated condition is true, the result of
the expression is an integer 1. If it is false, the result of the expression is an integer 0. For
example, if D has a value of 3 and E has a value of 5, then the result of the expression D<E
is 1, and the result of the expression D>E is 0. Each operand of the conditional operators
can be either floating point or integer. Test for equality involving floating point values
should be used with caution, since rounding error could cause unexpected results.
10-8
Suite56 ADS Debugger User’s Manual
Motorola
Operators in Expressions
10.6.6 Logical Operators
Logical AND (&&)
Logical OR (||)
The logical AND operator returns an integer 1 if both of its operands are non-zero;
otherwise, it returns an integer 0.
The logical OR operator returns an integer 1 if either of its operands is non-zero; otherwise
it returns an integer 0. The types of the operands may be either integer or floating point.
Logical operators are primarily intended for use with the Debugger BREAK command.
10.6.7 Operator Precedence
Expressions are evaluated with the following operator precedence:
1. parenthetical expression (innermost first)
2. unary minus, unary negate, unary logical negation
3. multiplication, division, mod
4. addition, subtraction
5. shift
6. less than, greater than, less or equal, greater or equal
7. equal, not equal
8. bitwise AND
9. bitwise EOR
10. .bitwise OR
11. logical AND
12. logical OR
Operators of the same precedence are evaluated left to right. All integer results (including
intermediate) of expression evaluation are 32-bit, truncated integers. Valid operands
include numeric constants, memory addresses, or register symbols. The logical, bitwise,
unary negate unary logical negation and shift operators cannot be applied to floating point
operands. That is, if the evaluation of an expression (after operator precedence has been
applied) results in a floating point number on either side of any of these operators, an error
will be generated.
Motorola
Expressions
10-9
Setting Up and Modifying a Watch list
10.7 Setting Up and Modifying a Watch list
You can watch the contents of a specific memory location, register, or any arbitrary value
or expression by setting up a Watch window. The Watch window displays a list of the
watch items that you have specified. The watch list gets updated every time program
execution is halted (including breakpoints).
The value or expression that you watch can be valid even if it is not calculated during
program execution. C expressions can be used, enclosed in braces: {c_expression}.
Symbolic references can be used if symbols have been loaded from the object module.
The values are re-calculated at each break in execution.
To display a value in a watch list:
1. From the Windows menu choose Watch. The dialog box in Figure 10-2 appears.
Figure 10-2. Displaying a Value in a Watch List
2. Select the window number where you want the expression to appear. You will want
to do this when you have more than one Watch window open.
3. Under Expression, type in the expression that you want to add to the Watch
window.
4. Under Radix, select the radix format in which you want the variables displayed.
5. Click OK.
The expression that you specified now appears in a Watch window: If the
expression you type is not valid, you will get an error message explaining why the
expression is not valid.
10-10
Suite56 ADS Debugger User’s Manual
Motorola
Setting Up and Modifying a Watch list
A C expression which refers to C variables can only be evaluated in the context in which
the watch is established. That is, the expression is only valid when all the variables used in
the expression are in scope. So if one (or more) of the variables in an expression goes out
of scope (either because a function call or return from a function), the value is replaced
with the message Expression out of scope. When all elements of the expression are back in
scope, the value is again displayed.
An expression that has gone out of scope because of a function call can be evaluated and
displayed by selecting the stack frame for the evaluation context. The stack frame
assignment remains in effect only until the next instruction is executed. An expression that
is out of scope because of an exit from a function cannot be evaluated until the function is
called again as its variables no longer exists.
To set a watch list from the command line, see Section 13.49, “WATCH - Set, Modify,
View, or Clear Watch Item,” on page 13-52.
Motorola
Expressions
10-11
Setting Up and Modifying a Watch list
10-12
Suite56 ADS Debugger User’s Manual
Motorola
Chapter 11
Debugger Toolbar
You can use the toolbar to control some program execution. The icons located on the
toolbar duplicate the same kind of controls found under the Execute menu. Using the
toolbar provides a quicker way to do some of these things than using the Execute menu.
The icons on the toolbar are as follows:
.
Go Button
Starts program execution from the next address. All breakpoints are observed
Stop Button
Stops program execution or a command macro, if running.
Step Button
Executes next instruction or line.
Next Button
Executes next instruction or line.
Finish Button
Allows the current function to execute to completion.
Device Button
Allows setting of the default device to which all commands will be directed.
Repeat Button
Repeats the last command in the history buffer.
Reset Button
Resets the current device.
All of these commands are also available from the command line, described in Chapter 13,
“Debugger Command Reference.”
Motorola
Debugger Toolbar
11-1
Go Button
11.1 Go Button
The Go button starts program execution beginning with the next address, Figure 11-1.
Figure 11-1. Go Button
Go is also discussed in Section 3.1, “Starting Execution with Go,” on page 3-1, and in
Section 13.24, “GO - Execute DSP Program,” on page 13-29.
11.2 Stop Button
The Stop button stops program execution or if a command macro is running, stops the
macro. See Figure 11-2.
Figure 11-2. Stop Button
Stop is also dicussed in Section 3.14, “Stopping Program Execution,” on page 3-26.
11-2
Suite56 ADS Debugger User’s Manual
Motorola
Step Button
11.3 Step Button
The Step button executes the next instruction or line. See Figure 11-3.
Figure 11-3. Step Button
If the Source window is open, displaying the program source, the Step button executes
one line of code. Otherwise, the Step button executes one instruction. On encountering a
JSR instruction (a jump to a subroutine), the Debugger begins with the first instruction of
the subroutine, and steps through it one instruction at a time.
To step one instruction at a time from the toolbar:
1. Make sure that program execution is halted and that the Source window is not
open.
2. Click the Step button on the toolbar. The Debugger will execute the next assembly
instruction.
To step one line at a time from the toolbar:
1. Make sure that program execution is halted and that the Source window is open. If
the Source window is not open, the Debugger will automatically execute the next
instruction in the Assembly window rather than then next line in the Source
window.
2. Click the Step button on the toolbar. The Debugger will execute the next
executable line of code in the Source window. (Comments lines in the source code
are ignored.)
Notice that the values in the Register window, the Memory window, and all other
Debugger windows are updated each time you click step.
You can find more information about about the step command in Section 3.2, “Step
Through Instructions,” on page 3-3, and in Section 3.4, “Executing the Next Instruction,”
on page 3-6 . To use step from the command line, see Section 13.39, “STEP - Step
Through DSP Program,” on page 13-46.
Motorola
Debugger Toolbar
11-3
Next Button
11.4 Next Button
The Next button executes the next instruction or line. See Figure 11-4.
Figure 11-4. Next Button
If the next instruction to be executed calls a subroutine or begins execution of a function,
all the instructions of the subroutine or function are executed before stopping. The enabled
registers, memory, and other updated values are then displayed. In order to recognize
functions, the symbolic debug information for the program code must be loaded.
To execute the next instruction from the toolbar:
1. Make sure that program execution is halted and that the Source window is not
open.
2. Click on the Next button on the toolbar
The Debugger will execute the next assembly instruction.
To execute the next line from the toolbar:
1. Make sure that program execution is halted and that the Source window is open. If
the Source window is not open, the Debugger will automatically execute the next
instruction in the Assembly window rather than then next line in the Source
window.
2. Click on the Next button on the toolbar.
The Debugger will execute the next executable line of code in the Source window.
(Comments lines in the source code are ignored.)
Notice that the values in the register window, the memory window, and all other Debugger
windows are updated each time you click on Next.
You can find more information about the next command in Section 3.4, “Executing the
Next Instruction,” on page 3-6. To use next from the command line, see Section 13.32,
“NEXT - Step Through Subroutine Calls or Macros,” on page 13-39.
11-4
Suite56 ADS Debugger User’s Manual
Motorola
Finish Button
11.5 Finish Button
The Finish button allows the current function to execute to completion. See Figure 11-5.
Figure 11-5. Finish Button
When stepping through a program, it is possible that execution will stop in the middle of a
function or subroutine. Clicking on the Finish button completes the execution of the
function or subroutine. The Debugger continues until encountering an RTS instruction. If
another function is encountered during a finish operation, execution continues to the end
of the current function.
You can find more information about the finish command in Section 3.13, “Allowing the
Current Function to Finish,” on page 3-25. To use finish from the command line, see
Section 13.21, “FINISH - Step Until End of Current Subroutine,” on page 13-28.
Motorola
Debugger Toolbar
11-5
Device Button
11.6 Device Button
The Device button allows you to set the default device to which all commands will be
directed. See Figure 11-6.
Figure 11-6. Device Button
The Device button opens a dialog box that allows you to set the default device. This
designates the device to which all commands will be directed.
Notice that when you designate another device as the default device that the Session
window and Command window automatically reflect information for the new device.
However, other windows such as the Assembly window, Source window, Stack window,
etc. must be specifically opened to reflect the information for the new default device.
You can find more information about the device command in Section 7.2, “Setting the
Default Device,” on page 7-4. To use device from the command line, see Section 13.16,
“DEVICE - Select Default Device,” on page 13-22.
11-6
Suite56 ADS Debugger User’s Manual
Motorola
Repeat Button
11.7 Repeat Button
The Repeat button repeats the last command in the history buffer. See Figure 11-7.
Figure 11-7. Repeat Button
The Repeat button repeats the last command in the history buffer - that is, the last
command listed in the Command window. Pressing this button is the same as clicking on
the last command in the Command window and pressing ENTER.
You can find more information about the repeat command in Section 12.3, “Command
Window,” on page 12-3.
Motorola
Debugger Toolbar
11-7
Reset Button
11.8 Reset Button
The Reset button resets the current device. See Figure 11-8.
Figure 11-8. Reset Button
The Reset button resets the current device the same as if you had chosen Reset System
from the Execute menu.
You can find more information about the reset command in Chapter 5, “Managing
Memory and Registers.” To use reset from the command line, see Section 13.22,
“FORCE - Assert RESET or BREAK on Target,” on page 13-28.
11-8
Suite56 ADS Debugger User’s Manual
Motorola
Chapter 12
Displayed Information
This chapter shows you how to display the following information in the Debugger:
• Radix
• Current breakpoint
• Command window
• Session window
• Assembly window
• Source window
• Stack window
12.1 Displaying the Radix
You can display the default radix (number base) that is currently used for command
parameters and other values that you input. That is, the radix that is used when you type a
value into a dialog box or at the command line.
To display the current default radix:
1. From the Display menu, choose Radix.
2. The default radix is displayed in the Session window.
If the default radix for the Debugger is set to decimal, this means that values you enter are
presumed to be decimal, and you don’t need to type a preceding apostrophe (‘). If the
default radix for the Debugger is set to hexadecimal, this means that values can be entered
in hexadecimal without typing a preceding dollar ($). Similarly, if the default radix is
unsigned or binary, their respective specifiers do not need to be typed before the value.
Be careful to distinguish the input radix from the output radix. The default radix refers to
the input radix.
The output radix refers to the display radix and can be different from the input radix. The
output radix is the radix that describes the way values are displayed in the Memory
window, Register window, Watch window, etc. You can change the radix for a particular
register or for a particular memory location by changing the radix.
For more information see Section 7.3, “Changing the Radix,” on page 7-5.
Motorola
Displayed Information
12-1
Display the Current Breakpoint
12.2 Display the Current Breakpoint
It is often useful to display the enabled and disabled breakpoints for the current device by
opening the Breakpoints window.
To display the current breakpoints
1. From the Windows menu, choose Breakpoints. A dialog box shows a list of the
breakpoints set for the current device.
The dialog box in Figure 12-1 shows an example of a list of six breakpoints.
Disabled breakpoints, such as the breakpoint #2, are indicated with the word
disabled.
Figure 12-1. Breakpoints
2. Double click on a breakpoint from the list to toggle it from disabled to enabled, or
from enabled to disabled.
Breakpoints that were set by double clicking on a line in the Source window, such as
breakpoint #5 above, are identified by the line number.
Breakpoints that were set by double clicking on a line in the Assembly window, such as
breakpoint #6 above, are identified by the address.
Breakpoints and their usage are also discussed in Section 2.6, “Setting and Clearing
Software Breakpoints,” on page 2-11, Section 2.7, “Setting and Clearing Hardware
Breakpoints,” on page 2-15, Section 3.10, “Enabling and Disabling Breakpoints,” on page
3-22, Section 12.6, “Source Window,” on page 12-8 , Section 12.5, “Assembly Window,”
on page 12-7
12-2
Suite56 ADS Debugger User’s Manual
Motorola
Command Window
12.3 Command Window
The Command window permits you to enter Debugger commands on a command line. In
this way, the Command window provides an alternative to using the menu bar or the
toolbar. The Command window is also a useful source of information in that it echoes the
commands from the menu bar and from the toolbar. It also provides a source of history.
The command history buffer holds the ten most recent commands. If the last command is
repeated exactly, the duplicate is not stored.
To display the Command window:
1. From the Windows menu, choose Command. See the Command window in
Figure 12-2.
Figure 12-2. Command Window
2. Notice that the device number is indicated. This is the device to which the
commands are applied. In order to affect another device, the default device must be
changed.
The command window also provides access to device specific information such as pin and
port information.
Motorola
Displayed Information
12-3
Session Window
To display device specific information
1. From the command line of the Command window, type:
help
2. A list of help topics is displayed in the Session Window. Check the list for the
device specific information that you are wanting. You might have to scroll back up
the Session window to see the whole list.
3. From the command line of the Command window, type help followed by the name
of the help topic. For example, to list the on-chip io registers and their addresses, on
the command line type:
help io
The help information is displayed in the Session window. Some of this information
can be lengthy, so it might be useful to log the Session window output.
For more information about the command window and its usage, see Section 1.4,
“Entering Commands,” on page 1-7, Section 2.4, “Setting Up the Display Environment,”
on page 2-7, Section 7.2, “Setting the Default Device,” on page 7-4, and Section 9.2,
“Logging Output from the Session Window,” on page 9-2.
12.4 Session Window
The Session window is the main output for the Debugger. The Session window displays:
•
an echo of all commands input at the command line (from the Command Window),
•
output from commands,
•
information from the Display menu,
•
views of source code and assembly code,
•
values in registers and memory locations at breakpoints,
•
values in registers and memory locations after execution is halted, and
•
error messages.
During a typical session, the window might look like the one in Figure 12-3.
12-4
Suite56 ADS Debugger User’s Manual
Motorola
Session Window
Figure 12-3. Session Window
To display the Session window
1. From the Window menu, choose Session.
2. The Session window opens. You will probably have to scroll and resize the
window to be suitably visible.
Note that it is not possible to have more than one Session window open at a time.
The Session window only displays output for the current device. However, each device
writes output to its own buffer. That is, a device retains the contents of the Session
window even when you have named another device as the default device. In order to see
the Session window for a specific device, you must specify that specific device as the
current device.
The Session window buffers the last 100 lines of output. It might be necessary to scroll
through the Session window to see previous output. At times, you might perform a
Motorola
Displayed Information
12-5
Session Window
command that displays more than 100 lines of output to the Session window. In this case
you will want to pause the output to the Session window.
To pause output to the Session window:
1. From the Display menu, choose More. Then select On.
2. The Session window will now pause if more than 100 lines of information are
displayed at once.
For example, if you perform a command such as typing help io from the
command line, it is likely that the resulting output to the Session window will be
greater than 100 lines. The dialog box in Figure 12-4 appears.
Figure 12-4. Pausing Output to the Session Window
3. Click OK to display the next 100 lines in the Session window.
For more information see Section 2.4, “Setting Up the Display Environment,” on page 2-7
and Section 7.2, “Setting the Default Device,” on page 7-4.
12-6
Suite56 ADS Debugger User’s Manual
Motorola
Assembly Window
12.5 Assembly Window
The Assembly window allows you to display and edit the contents of memory, set and
clear breakpoints, and follow program execution. As the program executes, the display is
updated at each break in execution. The next instruction to be executed is always
displayed, highlighted in red.
To use the Assembly window:
1. From the Windows menu, choose Assembly. The Assembly window appears as in
Figure 12-5.
Figure 12-5. Assembly Window
2. To scroll to a specific address, type the address in the box labeled Scroll To
Address and press ENTER.
3. To edit an instruction, single click the mnemonic. Notice that the mnemonic text is
now highlighted. Type the new assembly instruction and press ENTER.
Notice that the next instruction is highlighted. In order to avoid accidentally typing
over that instruction, click on an area outside of the mnemonic.
4. Breakpoints can be set, disabled, or cleared by double clicking an address or label
field.
Double click the address or label to set the breakpoint. Double click again on the
address or label to disable the breakpoint. Double click again on the address or
label to remove the breakpoint.
Enabled breakpoints appear in blue. Disabled breakpoints appear in pink.
Motorola
Displayed Information
12-7
Source Window
The assembly window and its usage are discussed in Section 2.4, “Setting Up the Display
Environment,” on page 2-7, Section 7.2, “Setting the Default Device,” on page 7-4, and in
Section 12.2, “Display the Current Breakpoint,” on page 12-2. To use the assembly
window from the command line, see Section 13.4, “ASM - Single Line Interactive
Assembler,” on page 13-8.
12.6 Source Window
The Source window displays the source code that has been loaded in memory. The source
code may reside in the directory containing the object module or in any of the directories
specified in the path.
To display the Source window:
1. From the Windows menu, choose Source. The Source window indicates the
current program counter (PC) and highlights the corresponding source line in red.
See Figure 12-6.
Figure 12-6. Source Window
2. You can use the Source window to set halt breakpoints. To set or clear a breakpoint
double-click on any line in the Source window.
The breakpoint is added to the breakpoint list, displayed in the breakpoint window
and highlighted blue in the Assembly window.
The Source window and its usage are also discussed in Section 2.2, “Setting and Clearing
the Path,” on page 2-2 and Section 2.4, “Setting Up the Display Environment,” on page
2-7.
12-8
Suite56 ADS Debugger User’s Manual
Motorola
Stack Window
12.7 Stack Window
You can watch the call stack by opening the Stack window.
To display the call stack
1. From the Windows menu, choose Stack.
The call stack will be displayed.
You can find more information about the stack in Chapter 8, “Debugging C Source Code,”
specifically, Section 8.1, “Moving Up and Down the Call Stack,” on page 8-1.
Motorola
Displayed Information
12-9
Stack Window
12-10
Suite56 ADS Debugger User’s Manual
Motorola
Chapter 13
Debugger Command Reference
The following chapter lists and describes the Debugger commands. There are a total of
sixty Debugger commands that can be performed from the command line. (The command
line is a part of the Command Window. These commands, and their syntax, are useful to
know if you are using the command line or if you are writing a command macro.
The Debugger commands can be grouped into six categories:
•
memory/register modification,
•
file I/O,
•
execution control,
•
C Source Code Debug Commands,
•
miscellaneous tasks, and
•
windows controls (used especially in writing command macros)
Memory/Register Modification
The following commands relate to modifying memory and registers. These allow you to:
•
ASSEMBLE (ASM) DSP instructions,
•
CHANGE register or memory locations,
•
COPY a block of memory to a new location,
•
DISASSEMBLE code stored in the device memory,
•
DISPLAY registers and memory values,
•
DISPLAY the Debugger revision number or memory configuration,
•
FORCE the reset of the device,
•
WATCH certain variables and expressions.
Motorola
Debugger Command Reference
13-1
File I/O
The following commands relate to file Input and Output. These allow you to:
•
•
•
•
•
INPUT which allow you to INPUT peripheral or memory location values from a
file,
OUTPUT peripheral or memory location values to a file,
LOAD DSP Assembler object module files or Debugger state files,
LOG Debugger commands, session display output or DSP program execution
profile, and
SAVE Debugger memory to an object module file or the Debugger state to a state
file.
Execution Control
The following commands relate to control of program execution. These allow you to:
•
•
•
•
•
•
•
specify BREAK conditions,
GO until a break condition is met,
STEP a specified number of instructions or cycles before displaying register and
memory changes,
TRACE a specified number of instructions or cycles displaying register and
memory changes at each step,
The NEXT instruction operates essentially the same as the STEP instruction,
except that if the instruction being executed calls a subroutine or function,
execution continues until return from the subroutine or function.
The UNTIL instruction has the effect of setting a temporary breakpoint at a
specified address, executing until a breakpoint is en-countered, then clearing the
temporary breakpoint.
The FINISH instruction proceeds until an RTS instruction is encountered for the
current subroutine.
C Source Code Debug Commands
The following commands relate to debugging C source code. These include:
•
WHERE to display the C function call stack,
•
UP, DOWN and FRAME are used to traverse the call stack,
•
REDIRECT is used to redirect data from stdin/stdout/stderr to files,
•
STREAMS enable the io streams, and
•
TYPE displays the data type of a variable, function or C expression.
13-2
Suite56 ADS Debugger User’s Manual
Motorola
Miscellaneous Tasks
The following commands include miscellaneous tasks:
•
•
•
•
•
•
•
•
•
•
•
•
DEVICE specifies a new device and its device type,
EVALUATE evaluates expressions in five different radices,
HELP displays device specific information in the Session window,
PATH defines the working directory and alternate directories,
QUIT ends a debugging session,
HOST changes the attributes of the Host Interface Card
RADIX specifies the default number base (hex, decimal, etc.) used during
expression evaluation and data entry or data display,
SYSTEM executes an operating system command in two modes,
WAIT specifies a number of seconds to pause execution before proceeding to the
next instruction.
LIST displays a specified source file when symbolic debug is in effect,
VIEW allows selection of the Debugger display mode - Source, Assembly or
Register.
UNLOCK provides password enabling of unannounced device types.
Windows Controls
The following commands control the display of windows and are particularly useful in
writing command macros:
•
•
•
•
•
•
•
•
•
•
•
•
•
WASM opens an assembly window displaying addresses, labels, and mnemonics
WBREAKPOINT opens a breakpoint window displaying current breakpoints
WCALLS opens a C call stack window
WCOMMAND opens a command window
WINPUT opens an input window
WLIST opens a list window displaying contents of a specified file
WMEMORY opens a memory window
WOUTPUT opens an output window
WREGISTER opens a register window
WSESSION opens the Session window
WSOURCE opens a Source window
WSTACK opens a stack window
WWATCH opens a watch window displaying expressions that have been specified
for the watch list
For more information see, Section 9.1, “Creating and Running a Command Macro,” on
page 9-1, Section 13.2, "Command Syntax." , Section 13.3, "Command Parameters: List
of Abbreviations."
Motorola
Debugger Command Reference
13-3
Entering Commands
13.1 Entering Commands
Most of your work with the Debugger will be performed by using the menu bar and the
toolbar. However, you might sometimes find it useful to perform some commands from a
command line. Motorola’s DSP Debugger provides you the option of entering commands
at a command line.
The command line is a part of the Command Window. See Figure 13-1.
Figure 13-1. ADS Debugger Command Window
In the Command window, you will notice that several common commands are displayed
on the help line. The remaining commands can be displayed by pressing the SPACE bar
when the cursor is at the beginning of the command line.
It is not necessary to type the complete command. You only need to type the first one to
three characters of the command for the Debugger to recognize the command. The
minimum number of required characters for each command is highlighted in red on the
help line.
What is the complete syntax for a command? You can display the complete syntax for a
particular command by typing the command (or the required characters) on the command
line and then pressing the SPACE bar. The complete syntax of the command that you
began typing is displayed on the help line.
Any text that follows a semicolon on the command line is considered a user comment.
You might use comments if you were logging output from the Session window or creating
and running a Command Macro
The command that you have typed in on the command line is executed when you press the
ENTER key or the CARRIAGE RETURN key. If the command is not a valid Debugger
13-4
Suite56 ADS Debugger User’s Manual
Motorola
Command Syntax
command, the Debugger interprets the command as the name of a command macro and
executes the macro, if it exists.
For more information see, Section 13, “Debugger Command Reference,” on page 13-1,
Section 13.2, "Command Syntax."
13.2 Command Syntax
The syntax of a Debugger command is written with special punctuation to indicate
command keywords, required or optional fields, repeated fields, and implied actions. For
example, the syntax of the CHANGE, DISPLAY, and WAIT commands look like this:
DISPLAY [ON/OFF/R/W/RW] [reg[_block/_group]/addr[_block]]...
EVALUATE [B(binary)/ D(dec)/ F(float)/ H(hex)/ U(unsigned)]
expression/{c_expression}
WAIT [count(seconds)]
The punctuation of the syntax line includes:
Table 13-1. Command Syntax
Syntax
Motorola
Description
[ ]
Square brackets enclose command parameters that are optional. The
brackets themselves are not entered as a part of the command. For
example, in the WAIT command the count parameter is optional.
/
The slash is used to separate alternative command parameters. You
can only enter one of the parameters in the list. The slash is not
entered as a part of the command. For example, in the EVALUATE
command, the optional first parameter can be one of the following: B,
D, F, H, or U.
()
Parentheses surround a description of an implied action. This is
included to help clarify some of the abbreviations of the command.
Neither the parentheses nor the description inside the parentheses are
entered as part of the command. For example, when entering the
EVALUATE command, the optional first parameter consists of one
letter. The words binary, dec, float, etc. are only in the command
syntax line for clarification.
...
An ellipse (three consecutive periods) indicates that the preceding field
may optionally be repeated. For example, the DISPLAY command can
specify multiple registers.
Debugger Command Reference
13-5
Command Parameters: List of Abbreviations
Table 13-1. Command Syntax
Syntax
CAPS
Description
Capitalized words indicate command keywords. Command keywords
must be entered exactly as shown. The portion of the command
keyword shown in BOLDFACE represents the minimum portion of the
keyword that you must type. The portion of the keyword that is not in
boldface may be typed if desired, but is not required. The Debugger will
automatically type the remainder of a keyword if you type the boldface
characters and then press the SPACE key.
Many of the command parameters, such as addr and reg, are abbreviations. See the
Command Parameters: List of Abbreviations for a list of parameter abbreviations.
For more information see, Section 1.4, “Entering Commands,” on page 1-7 , Section 13.3,
"Command Parameters: List of Abbreviations."
13.3 Command Parameters: List of Abbreviations
The following is a list of abbreviations used for parameters on the command syntax line:
Table 13-2. List of Abbreviations
Abbreviation
13-6
Description
address
An address may be specified as a source file line number or as a
symbol name if a previously loaded COFF object file contains symbolic
debug information.
Otherwise, a memory space designator must be used. To see a list of
the valid memory space prefixes, from the command line of the
Command window type help mem
address_block
addressÖlocation/address#count
bn
Break number. A decimal integer constant in the range 1 to 99.
break_action
H(halt)/In(increment CNTn)/N(note)/S(show)/X [command]
count
Positive integer expression in range 1 to $7fffffff.
dev_list
Device list in the form dvx, dv0..x, dvx,y,z, where x represents a device
number. One or more targets can be addressed this way. For example,
device group 0 through 4 is expressed dv0..4. And the device set of
1,3, and 5 is expressed as dv1,3,5.
dev_num
Device number. Range is dv0 to dv31.
Suite56 ADS Debugger User’s Manual
Motorola
Command Parameters: List of Abbreviations
Table 13-2. List of Abbreviations (Continued)
Abbreviation
Description
dev_type
Device type.
expression
Any arithmetic expression valid for the DSP Assembler. Register
names can also be used in the expression.
c_expression
Any expression valid in the current C program. A c_expression must be
enclosed in curly braces: { }
file
Any valid filename, including relative and absolute paths..
ioradix
-RD(decimal)/-RF(float or fractional)/-RH(hexadecimal)/-RU(unsigned)
location
Integer expression. It will be mapped into the device address range.
For ex-ample, -1 translates to the maximum address.
mode
Device operating mode in the form Mn.
pathname
Any valid pathname.
periph
Valid peripheral names are displayed by the Debugger help periph
command.
pin
Valid pin names are displayed by the Debugger help pin command. A
pin name may optionally be preceded by pin: in order to resolve
conflicts that may exist between pin and register names or constants.
pin_block
pin..pin
port
Valid port names are displayed by the Debuggerr help port command
reg
Valid register names are displayed by the Debugger display all
command. A register name may optionally be preceded by reg: in order
to resolve con-flicts that may exist between register and pin names or
constants.
reg_block
reg..reg
reg_group
periph/all
topic
Help topic keywords used with the HELP command.
For more information see, Section 1.4, “Entering Commands,” on page 1-7 , Section 13.2,
"Command Syntax."
Motorola
Debugger Command Reference
13-7
ASM - Single Line Interactive Assembler
13.4 ASM - Single Line Interactive Assembler
ASM [dev_num] [B(byte wide)] [(beginning at) address]
assembler_mnemonic
The ASM command allows you to create or edit DSP object code programs in memory
using assembly language mnemonics. Each line of source code is immediately converted
into machine language code and stored in the Application Development Module (ADM)
or target system memory. The line of assembly source code is not saved.
The address parameter is optional. The beginning address may be in any of the three (p, x,
or y) memory maps of the DSP.
Note:
The Y memory is only valid for DSP56000 and DSP96002 family members. If
no address is specified, assembly begins in the p (program) memory space using
the current program counter value as the beginning address.
Invoking this command causes existing object code at the beginning address to be
disassembled and displayed on the screen. The user may optionally enter a new Assembler
mnemonic on the command line or edit the existing object code. The Assembler is called
when the carriage return key is entered. If the new instruction cannot be assembled
correctly an error message is displayed on the error line and the cursor is placed at the
point of error.
The B (byte-wide) parameter takes one byte from each memory word starting at the
specified address to build up the instruction word to be displayed. Similarly the assembled
mnemonic instruction is divided into bytes and stored in successive words.
If the interactive Assembler is invoked with the GUI version of the ADS, a dialog box
displays the original instruction at the specified location. To change the instruction and
display the next, type the new instruction and click [OK]. To exit the interactive
Assembler, click [CANCEL]. Any new instruction which has been typed before clicking
[CANCEL] will not be written to the current location.
The Session and Command windows will be written to during interactive Assembler
operations. Both windows display the original ASM command, the Session window
displays each change as it is applied.
13-8
Suite56 ADS Debugger User’s Manual
Motorola
ASM - Single Line Interactive Assembler
Example 13-1. ASM Commands
Command
Explanation
asm p:$50
Start interactive Assembler at program memory address 50 hex of the
current default device.
asm
Start interactive Assembler at current program counter value of the
current default device.
asm myfile.asm@7
Start interactive Assembler at the address corresponding to myfile.asm
line 7.
asm dv3 p:10
Start interactive Assembler at target address #3 program memory
address 10.
asm nop
Overwrite the instruction at the current pc with the specified instruction.
asm x:0 add #<2,a
Store assembled instruction in specified data memory location. This
feature may be useful for patching overlaid programs where overlays are
copied from data to program memory before execution.
asm dv3 b
y:$040100
Perform byte-wide assembly from address $40100 in y memory. Each
byte of the instruction is stored in successive locations, so two or three
locations are required to store each 16- or 24-bit instruction. Even if
assembled into program memory, this code cannot be executed directly; it
is intended for use with code similar to the byte-wide loader in the ROM
bootstrap code. Byte-wide assembly may be used interactively (as in this
example) or to assemble a single instruction.
For more information see, Section 13.5, "BREAK - Set, Modify, or Clear Breakpoints." ,
Section , "CCHANGE - Change Command Converter Memory."
Motorola
Debugger Command Reference
13-9
BREAK - Set, Modify, or Clear Breakpoints
13.5 BREAK - Set, Modify, or Clear Breakpoints
Syntax to clear, enable, or disable breakpoints
BREAK [dev_list] [#bn[,bn,Ö] [OFF/E(enable)/D(disable)]
Syntax for Software Breakpoints
BREAK [dev_list] [#bn] swbp_type address [t(expression)] [count]
[action]
Syntax for Hardware Breakpoints on the DSP56300 and DSP56600 Device Families
BREAK [dev_list] [#bn] [access] [hwbp_type] [addr_qual]
addr[_block]
[break_qual [addr_qual] address] [t(expression) [count]
[action]
Syntax for Hardware Breakpoints on the DSP56000, DSP56100, DSP56800, and
DSP9600 Families
BREAK [dev_list] [#bn] access] [hwbp_type] [addr[_block]] [count]
[action]
The BREAK command can be used to set, clear, enable, and or disable breakpoints.
Breakpoints, when triggered, can cause program execution to halt and the device to enter
the Debug mode of operation. There are two types of breakpoints: hardware breakpoints
and software breakpoints.
Software breakpoints are very similar to hardware breakpoints. However, software
breakpoints are more limited than hardware breakpoints in that:
•
software breakpoints can only be set on the first word of an instruction (they cannot
be set to detect the access of registers or data memory)
•
software breakpoints must be set in RAM (they cannot be set in ROM)
Despite the above limitations, it is recommended that you use software breakpoints
instead of hardware breakpoints whenever possible. This is recommended because, in
effect only one hardware breakpoint can be set at a time whereas a virtual unlimited
number of software breakpoints can be set.
Software Breakpoints
The optional parameter dev_list represents the device or list of devices on which the
breakpoints will be set.
13-10
Suite56 ADS Debugger User’s Manual
Motorola
BREAK - Set, Modify, or Clear Breakpoints
The optional parameter #bn represents a breakpoint number. Breakpoint numbers do not
have to be consecutive, they can be assigned arbitrarily. For example, it may be
convenient to allocate breakpoints so that one function is assigned breakpoints 1 to 10,
another uses 11 to 20, and so on. If no breakpoint number is assigned, the default will be
the next available consecutive number.
The parameter swbp_type represents the software breakpoint type and is required. If you
type al, the breakpoint will always be acted upon. Breakpoint types other than al are
conditional and device specific. See the list of Types of Software Breakpoints for an
explanation of each type of breakpoint.
The parameter address represents the address where the software breakpoint is set. This
parameter is required. For example, to set a breakpoint at address $103 in p memory,
type:
p:$103
IMPORTANT: This address MUST be the first word of an instruction.
Note:
ALSO: If you have provided a swbp_type (breakpoint type), the breakpoint can
ONLY be set to an address which contains a nop. Setting the breakpoint to an
address which contains any other opcode will cause your program to execute
incorrectly.
The optional parameter t(expression) represents a test of the expression within the
parentheses. If the expression is true the breakpoint will cause the action to be performed.
If the expression is false, program execution continues. Be aware that a side effect of
evaluating an expression (whether it is true or false) is that the program will not be
executed in real time. See Using Expressions in Breakpoints for more information.
The optional parameter count represents the number of times the Debugger should
encounter the breakpoint before performing the action. For example, if you set the count to
3, the breakpoint will be triggered the third time that the breakpoint is encountered. Keep
in mind that real time execution will be affected if you set the Count to more than one.
The optional parameter action indicates the action to be taken when the breakpoint is
triggered. If no action is provided, Halt will be assumed as the default. Possible actions
are:
Motorola
Debugger Command Reference
13-11
BREAK - Set, Modify, or Clear Breakpoints
H
Halt. Stops program execution when the breakpoint is
encountered.
N
Note. Displays the breakpoint expression in the Session
window each time it is true. Program execution
continues. The display in the Session window is not
updated until program execution stops.
S
Show. Displays the enabled register/memory set.
Program execution continues.
In
Increment. Increments the CNTn counter by one, where
n equals 1,2, or 3.
Hardware Breakpoints
The optional parameter dev_list represents the device or list of devices on which the
breakpoints will be set.
The optional parameter #bn represents a breakpoint number. Breakpoint numbers do not
have to be consecutive, they can be assigned arbitrarily. For example, it may be
convenient to allocate breakpoints so that one function is assigned breakpoints 1 to 10,
another uses 11 to 20, and so on. If no breakpoint number is assigned, the default will be
the next available consecutive number.
The optional parameter access represents the kind of access that the breakpoint should
detect: r=read, w=write, rw=read or write at the address that you will specify.
The optional parameter hwbp_type refer to the hardware breakpoint type. Breakpoint
types are device specific. See the list of Types of Hardware Breakpoints for an explanation
of each type of breakpoint.
The parameter addr[_block] represents the address where the software breakpoint is
set. An address block can also be provided, in which case an access of any address in the
range of addresses will be detected by the breakpoint. For example, to set a breakpoint that
covers address $103 to $110 in p memory, type:
p:$103..$110
The optional parameter t(expression) represents a test of the expression within the
parentheses. If the expression is true the breakpoint will cause the action to be performed.
13-12
Suite56 ADS Debugger User’s Manual
Motorola
BREAK - Set, Modify, or Clear Breakpoints
If the expression is false, program execution continues. Real time execution of is not
affected. See Using Expressions in Breakpoints for more information.
The optional parameter count represents the number of times the Debugger should
encounter the breakpoint before performing the action. For example, if you set the count to
3, the breakpoint will be triggered the third time that the breakpoint is encountered. Real
time execution will not be affected if you indicate a Count.
The optional parameter action indicates the action to be taken when the breakpoint is
triggered. If no action is provided, Halt will be assumed as the default. Possible actions
are:
H
Halt. Stops program execution when the breakpoint is
encountered.
N
Note. Displays the breakpoint expression in the Session
window each time it is true. Program execution
continues. The display in the Session window is not
updated until program execution stops.
S
Show. Displays the enabled register/memory set.
Program execution continues.
In
Increment. Increments the CNTn counter by one, where
n equals 1,2, or 3.
Table 13-3. Examples of BREAK on DSP devices with OnCE or JTAG/OnCE Ports
Command
Explanation
break
Display all currently enabled breakpoints for all target DSPs.
break dv2
Display currently enabled breakpoints for target DSP address
#2.
break off
Disable all currently enabled breakpoints for the default target
DSP address.
break dv2 off
Disable currently enabled breakpoints for target DSP address
2.
break off 2
Disable breakpoint number 2 of the current default target
address.
Motorola
Debugger Command Reference
13-13
BREAK - Set, Modify, or Clear Breakpoints
Table 13-3. Examples of BREAK on DSP devices with OnCE or JTAG/OnCE Ports
Command
Explanation
break dv2 p:$100
Halt DSP program execution of target DSP address 2 and
display enabled registers and memory when the DSP
instruction at program address 100 hex is reached. This is a
hardware breakpoint which will work with OnCE and
JTAG/OnCE based DSPs.
break p:$30 s
Display enabled registers and memory of the current default
target DSP address and continue program execution when the
DSP instruction at program address 30 hex is reached. This is
a hardware breakpoint which will work with OnCE and
JTAG/OnCE based DSPs.
break dv3 p:$200 t(r0>r1)
h
If the value of R0 is greater than R1 in target DSP address 3
when its DSP instruction at its program counter 200 hex is
reached, halt target DSP address 3. To evaluate whether R0 is
greater than R1, the host computer will set a hardware
breakpoint at address 200 and will interrogate the target DSP
every time a breakpoint occurs at that address. This is a
hardware breakpoint which will work with OnCE and
JTAG/OnCE based DSPs.
break al @32 t({i>10}) h
Break if the program reaches line 32 and the C variable i is
greater than 10.
break le p:$320 h
Halt DSP program execution of default target DSP address
and enter Debug mode when the Z or (N and V) bits of the
CCR are equal to 1 at the address $320 of program memory.
This is a software breakpoint, and testing of the Condition
Code Register is done real-time.
break al p:$320
Halt DSP program execution of default target DSP address
and enter Debug mode unconditionally at the address $320 of
program memory. This is a software breakpoint and must be
placed in SRAM.
break r xa x:300
Halt DSP program execution of the default target DSP address
and enter Debug mode when a read access of X data memory
address 300 occurs. This is a hardware breakpoint which will
work with OnCE and JTAG/OnCE based DSPs.
Examples of BREAK on DSP devices with OnCE Ports
break rw pcfm p:$100 $20
Halt DSP program execution of the default target DSP address and enter the
Debug mode when the 32nd occurrence of a read or write access of a
program core fetch or move occurs at address $100.
break rw pce p:$250
Halt DSP program execution of default target DSP address and enter Debug
mode when a read or write access of program memory address 250 hex
occurs.
13-14
Suite56 ADS Debugger User’s Manual
Motorola
CCHANGE - Change Command Converter Memory
Examples of BREAK on DSP devices with JTAG/OnCE Ports
break r xa > x:104 and < x:110
Halt DSP program execution on default target DSP when a read access of X
memory address range 105 to 109 occurs 1 time.
break rw pa == p:104 or == p:110
Halt DSP program execution on default target DSP when a read or write
access of program memory address 104 or 110 occurs one time.
13.6 CCHANGE - Change Command Converter Memory
CCHANGE [dev_list] [FLAG/XPTR/YPTR/address[_block]] [expression]
CCHANGE - Change Command Conv erter Memory
The CCHANGE command allows you to examine or modify the memory of the OnCE
Command Converter P, X or Y data memory spaces of the DSP56002. This command is
useful if you wish to design and debug OnCE command sequences.
The XPTR is Command Converter x memory location 4 and is used to point to the x
memory area where values read from the target OnCE are to be stored. The YPTR is
Command Converter x memory location 2 and is used to point to the y memory area where
sequences are to start from when issuing a CGO command.
Note that the Command Converter X memory addresses $0 to $7F (hex) are reserved for
use by the Command Converter monitor. These locations should not be changed. For more
details on the usage of these locations refer to the monitor program source listing. P
memory locations $0 to $1B0 (hex) are reserved for the monitor which is boot loaded from
the Command Converter EPROM.
Example 13-2. Examples of the CChange Command
cchange dv2 x:0
Display the current value of X:0 of Command Converter #2 memory and
prompt the user for a new value. Subsequent values may be displayed or
changed by entering a carriage return. To exit this interactive mode, use the
escape key.
cchange y:0..$10 $0
Change the y:0 through y:$10 of the default Command Converter to a value
of 0.
Motorola
Debugger Command Reference
13-15
CDISPLAY - Display Command Converter Flags and Memory
13.7 CDISPLAY - Display Command Converter Flags and
Memory
CDISPLAY [dev_list] FLAG/XPTR/YPTR/address[_block]...
The CDISPLAY command allows you to examine the Command Converter flag register,
Y memory pointer, or the P, X or Y memory values used to transfer OnCE serial command
sequences to the target DSP. These values are displayed in hexadecimal in the Session
window.
Command converter X memory locations 0 to 10 hex are used for temporary storage of
flags and constants.
Example 13-3. CDISPLAY Commands
cdisplay flag
Display the Command Converter flag register. The flag register is used to
store status bits of whether the target DSP is in the Debug mode or User
mode, as well as other Command Converter monitor flags.
cdisplay y:0..$10
Display the Command Converter Y memory space which is used for the
OnCE command sequence transfers to the target DSP.
cdisplay xptr
Display the X memory pointer, which is used to save values read from the
OnCE port when executing OnCE serial sequences.
13.8 CFORCE - Assert Reset or Break on Command
Converter
CFORCE [dev_list] R(reset)/B(break)/D(Debug mode)/U(User mode)
The CFORCE command is used for forcing a hardware reset or hardware interrupt on a
Command Converter. The D option can be used to force the Command Converter into the
Debug mode in the event that the target has entered the Debug mode by some means other
than through the ADS program (such as a DEBUG instruction in the user code).
The U option can be used to force the Command Converter into the User mode in the
event that the target has entered the User mode by some means other than through the
ADS program (such as a push button reset or power-on reset). When using the U or D
arguments, internal flags of the user interface program are also set or cleared.
Caution: Placing the Command Converter in Debug mode when the target is NOT in
Debug mode can cause unexpected results in the ADS.
13-16
Suite56 ADS Debugger User’s Manual
Motorola
CLOAD - Load OnCE Command Sequence
Example 13-4. CFORCE Command
Command
Explanation
cforce dv1 r
Force a hardware reset on Command Converter #1.
cforce b
Force an interrupt (break) on the default Command Converter.
cforce d
Force the default Command Converter into the Debug mode.
cforce u
Force the default Command Converter into the User mode.
13.9 CGO - Execute OnCE Sequence
CGO [dev_list] [(from) address]
The CGO command allows the user to execute OnCE command sequences in the
DSP56002 controller’s Y memory. This command is useful for debugging user defined
OnCE serial command sequences which will be used in a target system. A sequence
memory pointer resides in the DSP56002 controller’s internal X memory at address 2.
This pointer is used as the start location and may be changed using the CCHANGE
command.
Example 13-5. CGO Command
cgo
Execute the OnCE sequence of the default Command Converter starting at
the current address in the Command Converter PTR.
cgo $10
Change the Command Converter PTR to hex 10 and execute the OnCE
sequence of the default Command Converter starting at that address.
13.10 CLOAD - Load OnCE Command Sequence
CLOAD [dev_list] filename
The CLOAD command is used for loading a user defined OnCE serial command sequence
into the Command Converter internal Y memory. The file must be in DSP object module
format (OMF) and have a .lod suffix name. The CLOAD command allows you to write a
OnCE command sequence using the Command Converter monitor program OnCE
sequence format.
Example 13-6. CLOAD Command
cload onceseq.lod
Motorola
Debugger Command Reference
13-17
CSAVE - Save Command Converter Memory to a File
Load the file "onceseq.lod" into the Y memory of the default Command
Converter.
13.11 CSAVE - Save Command Converter Memory to a File
CSAVE [dev_num] address_block filename [-o/-a/-c]
The CSAVE command allows you to save the Command Converter X or Y data memory
to a disk file. This is useful when debugging user defined OnCE command sequences
using the Command Converter monitor program sequence format.
If a file currently exists with the filename specified your will be prompted for an action of
either appending the data to the file, overwriting the file, or aborting the command. You
can include the file action in the command line using the -o (overwrite), -a (append), or the
-c (cancel) argument. These flags are especially useful when using macro command files.
Example 13-7. CSAVE Command
csave dv0..3 y:0..$20 onceseq.lod
Saves the contents of Command Converters 0, 1, 2, and 3 Y memory addresses 0 to
hex 20 to a file named "onceseq.lod".
csave x:$10#10 newdata.lod
Saves the contents of the default Command Converter’s X memory addresses hex 10
through hex 1A to a file named “newdata.lod”.
13.12 CSTEP - Step Through OnCE Sequence
CSTEP [dev_list] [count]
The CSTEP command allows you to execute a group of OnCE serial sequences before
displaying the OnCE register contents. This gives you the opportunity to write and debug
a OnCE command sequence using the Command Converter monitor program sequence
format.
Note that the OPDBR and OPILR registers always display the last values stored after
executing a GO, STEP or TRACE command or after servicing a breakpoint. The values of
these registers will not reflect the changes made to them when executing the CGO,
CSTEP, or CTRACE when doing a display of the OnCE registers.
Also, it is important to remember that writing to the OPDBR register is in effect
manipulating the DSP program controller. Whenever 2-word opcodes are being written to
the OPDBR, it is best to CTRACE or CSTEP 2 before displaying registers.
13-18
Suite56 ADS Debugger User’s Manual
Motorola
CTRACE - Trace Through OnCE Sequence
Example 13-8. CSTEP Command
cstep
Executes one OnCE serial command of the default Command Converter’s Y
memory pointed at by its YPTR. The OnCE registers will be displayed after
the command is executed.
cstep $10
Executes 10 (hex) OnCE serial commands of the default Command
Converter’s Y memory pointed at by its YPTR. The OnCE registers will be
displayed after the 10 (hex) commands have all been executed.
A macro command file can help in single stepping through user defined OnCE sequences
and displaying results. The display of registers after a CSTEP or CTRACE were not
implemented because of the nature of having to access the OPDBR register to retrieve the
register values. An example of a macro file would be the following:
Example 13-9. CSTEP Command in a Macro
cstep 2
;execute 2 OnCE commands then show XPTR and YPTR
cdisplay x:80..90 y:80..9f
;display the Command Converter x and y memory
display
;display the target registers
13.13 CTRACE - Trace Through OnCE Sequence
CTRACE [dev_list] [count]
The CTRACE command allows the user to single step through a OnCE command
sequence in the Command Converter Y memory pointed at by the Command Converter
YPTR. This enables the user to write and debug OnCE command sequences using the
Command Converter monitor program sequence format.
Note that the OPDBR and OPILR registers always display the last values stored after
executing a GO, STEP or TRACE command or after servicing a breakpoint. The values of
these registers will not reflect the changes made to them when executing the CGO,
CSTEP, or CTRACE when doing a display of the OnCE registers.
Also, it is important to remember that writing to the OPDBR register is in effect
manipulating the DSP program controller. Whenever 2-word opcodes are being written to
the OPDBR, it is best to CTRACE or CSTEP 2 before displaying registers.
Motorola
Debugger Command Reference
13-19
CHANGE - Change Register or Memory Value
Example 13-10. CTRACE Command
ctrace 10
Executes 10 OnCE serial commands of the default Command Converter and
displays the OnCE register contents after each command is executed. The
serial commands reside in the Command Converter Y memory and are
pointed to by the Command Converter YPTR register.
A macro command file can help in single stepping through user defined OnCE sequences
and displaying results. The display of registers after a CSTEP or CTRACE were not
implemented because of the nature of having to access the OPDBR register to retrieve the
register values. An example of a macro file would be the following:
Example 13-11. CTRACE Command in a Macro
ctrace 2
cdisplay x:80..90 y:80..9f
display
; single step 2 OnCE commands and
show XPTR and ;YPTR
after each trace.
;display the Command Converter x
and y memory
;display the target registers
13.14 CHANGE - Change Register or Memory Value
CHANGE [dev_list] [reg[_block]/address[_block] [expression]]...
The CHANGE command allows you to examine or modify values contained in registers or
memory. Memory blocks can be initialized to a particular value by including an end
address. If the command is entered without a value, the register or memory location of the
current default target DSP address will be displayed with its current value on the
command line. You will then be prompted for a new value.
Multiple changes can be specified in a single command line. Each specified destination
(block) must be followed by the value of the expression to be assigned to it.
An interactive mode of register or memory display and change can be started by
specifying a single register or memory location without an associated expression. In this
mode each register or memory location can be examined and optionally modified. To
change the register or memory location contents and display the next register or location,
type the new value followed by carriage return. Subsequent or previous memory locations
or register names can be examined and changed if required by typing, respectively,
Up-Arrow (Ctrl-U) or Down-Arrow (Ctrl-N). Typing a new value followed by Up- or
Down-arrow does not change the open location. Pressing the Esc key causes the
interactive CHANGE command to terminate.
13-20
Suite56 ADS Debugger User’s Manual
Motorola
COPY - Copy a Memory Block
CAUTION
Be aware that some peripheral registers contain handshake bits that
change state when they are read. Reading these registers can interfere with
the proper operation of the peripheral when returning to the user’s program.
The Session and Command windows are written during interactive change operations.
Both windows display the original CHANGE command, the Session window displays
each change as it is made.
Example 13-12. CHANGE Command
Command
Explanation
change
Displays the current default target DSP address’s register values
individually starting with register a. You will be prompted to enter
new values.
change x:$55
Displays x memory location hexadecimal 55 of the current
default target DSP address and prompt the user for a new value.
Subsequent or previous memory locations may be examined
and changed using the up arrow key for the previous address
and down arrow for the next address.
change dv3 pc
Display the current value of the program counter on target DSP
address 3 and prompt the user for a new value. Subsequent or
previous register values may be examined and changed using
the up arrow key for the previous address and down arrow for
the next address.
change p:$20 $123456
Change the current default target DSP address’s p memory
address hexadecimal 20 to hexadecimal 123456.
change r0..r7 0
p:$30..$300 0 x:$fffe
$55 pc ‘100
Change the current default target DSP address’s registers r0 to
r7 to 0, p memory addresses 30 hex to 300 hex to 0, x memory
address fffe hex to 55 hex and the program counter to 100
decimal.
change dv1,3,5 r0..r7 0
p:$1000..$2000 0
Change target DSP addresses 1,3 and 5 registers r0 to r7 to 0
and their program memory addresses 1000 hex to 2000 hex to a
value of 0.
change xdat..xdat+5 35
Change memory block beginning at the address corresponding
to symbolic label xdat and ending at xdat + 5 to decimal value
35.
13.15 COPY - Copy a Memory Block
COPY (from)[dev_num] address[_block] (to) address
The COPY command allows you to copy memory blocks from one location to another.
The source and destination memory maps can be different. This allows you to move data
or program code from one memory map to another or to a different address within the
Motorola
Debugger Command Reference
13-21
DEVICE - Select Default Device
same memory map. The COPY command allows the copying of program or data blocks
within a single target DSP device. To transfer information from one target device to
another, use the SAVE command to create an object file, which may then be loaded into
the destination device.
Example 13-13. COPY Command
Command
Explanation
copy p:0..30 p:100
Copy the data in current default target DSP address program
memory starting at 0 and ending at 30 to program memory
starting at 100.
copy dv3 p:0..30 dv2 p:100
Copy the data in target DSP address number 3 program
memory starting at 0 and ending at 30 to target DSP address
number 2 program memory starting at 100.
copy x:0#100 p:0
Copy one hundred memory locations beginning at x memory
location 0 to p memory beginning at location 0.
copy x:$100..$200 x:$150
Copy the data in the current default target DSP address X
memory starting from hex $200 down to hex $100 and put the
data in the current default target DSP address X memory
starting at hex $250 down to hex $150. Whenever the
addresses of the source and destination overlap, the source
end address will be used and the addresses will be
decremented rather than incremented.
copy xdat..xdat+40 ydat
Copy 40 memory locations beginning at the address
corresponding to symbolic label xdat to the block beginning at
address corresponding to symbolic label ydat.
13.16 DEVICE - Select Default Device
DEVICE [dev_list [device_type/ON/OFF/X]]
DEVICE [dev_num] [chain_num] [tms_num] [chain_pos] [device_type]
DEVICE cc_num tms_num chain_pos IR count
The DEVICE command allows you to:
•
Select the current device for command input and session output
•
Activate one or more of the target devices controlled by the ADS.
•
Specify the device type of each target device
•
List the type and status of each device
•
Specify the position of devices in a JTAG chain
•
Specify non-Motorola devices in a JTAG chain
•
Enable and disable each device
13-22
Suite56 ADS Debugger User’s Manual
Motorola
DEVICE - Select Default Device
•
Deactivate a device and deallocate all associated structures
The command line prompt displays the number of the currently selected device. At
start-up, device DV0 is activated and selected as the current device.
•
device_type specifies which type of DSP is being emulated. If omitted, a default
value will be selected, depending on the device family in use. Use DEVICE
command for a list of supported device types.
•
ON makes the specified device(s) active for program execution
•
OFF suspends program execution for the specified device. The state of the device is
not otherwise changed.
•
X deactivates the device and discards all associated structures. If the X parameter is
used for the current device, another device will become the current device. At least
one device must be activated at all times; the last device may not be deactivated.
•
JTAG parameters—The ADS supports up to eight command converters on a single
development host. Each Command Converter supports one JTAG chain that can
service up to twenty-four devices. The DEVICE command associates each device
in any position in the JTAG chain with an ADS device number (dvn). The ADS
only performs debugging operations on Motorola DSP devices. However, to
support target systems incorporating other devices, the DEVICE command also
permits the specification of the JTAG instruction register length so such devices
may be handled correctly.
– DVn—Specifies the device number to be used to access the device described by
the remainder of the parameters. (0..31)
– CCn—Specifies the Command Converter to which the device is connected (0..7)
– TMSn—Specifies which TMS (Test Mode Select) line controls this device (0..1);
Command Converter revision 6 only supports TMS0.
– POSn—Specifies which position the device occupies in the JTAG chain. The
device connected directly to TDO from the Command Converter is position 0. (0 £
n)
– IR n—Specifies the length of the instruction register for unsupported devices. (2
£ n)
The defaults for the above parameters are as follows: CCn defaults to the device
number DVn and all other parameters default to zero.
Motorola
Debugger Command Reference
13-23
DISASSEMBLE - Single Line Disassembler
Example 13-14. DEVICE Command
Command
Explanation
device
Display all activated target DSP addresses and device
types, and lists all supported family members.
device dv0..2 on
Activate target DSP address 0, target DSP address 1,
and target DSP address 2.
device dv0,3 off
Deactivate target DSP address 0 and target DSP address
3.
device dv2
Select target DSP address 2 as the default target DSP for
command entry.
device dv1 x
Deactivate target DSP address 1 and discard all
associated data structures. If this was the selected
device, select another.
device dv12 cc3 pos2 56301
Specifies that device DV12 refers to a DSP56301, which
is controlled by Command Converter #3, occupying the
third (0,1,2...) position in the chain. TMS0 is used by
default.
device cc3 tms0 pos1 ir 3
The device on Command Converter 3, TMS chain 0,
position 1 is not to be used in this development session. It
has an instruction register 3 bits wide. Note that no device
number may be specified, and that all fields are required.
Note:
The instruction register length must not be specified for a device which has
been allocated an ADS device number.
13.17 DISASSEMBLE - Single Line Disassembler
DISASSEMBLE [dev_list] [B(byte wide)][address[_block]]
The DISASSEMBLE command allows the user to review DSP object code in its assembly
language mnemonic format. All invalid opcodes will display "DC" for define constant.
The b (byte-wide) parameter constructs the instruction words by taking one byte from
each word of memory, starting from the specified address.
Example 13-15. DISASSEMBLE Command
Command
disassemble
13-24
Explanation
Disassemble a page of instructions pointed at by the user
interface program disassembler counter of the current
default target DSP address. A counter maintains the last
instruction disassembled so subsequent instructions may
be disassembled by merely entering a carriage return to
execute the same instruction again.
Suite56 ADS Debugger User’s Manual
Motorola
DISPLAY - Display Register or Memory
Example 13-15. DISASSEMBLE Command
Command
Explanation
disassemble p:0..20
Disassemble program memory address block 0 to 20 of
the current default target DSP address.
disassemble dv2 x:$50#10
Disassemble ten instructions of the target DSP address 2
starting at x memory map 50 hex.
disassemble lab_1..lab_2
Disassemble memory address block beginning at the
address corresponding to symbolic label lab_1 and
ending at lab_2.
disassemble b y:$1000#$40
Disassemble forty instructions starting at address
y:$1000. The instruction words are constructed by taking
one byte from each location; thus depending on the target
processor, two or three locations are required to hold
each instruction word.
13.18 DISPLAY - Display Register or Memory
DISPLAY [W(executing targets)/[dev_list] V(ADS user interface program
version)]
DISPLAY [dev_list] [ON/OFF] [reg[_block/_group]/address[-_block]]...
The DISPLAY command allows the user to examine the contents of a register group
and/or memory block in the radix specified by the RADIX command. The default display
radix is hexadecimal. It may also be used to enable or disable particular registers or
memory locations for automatic display when executing debug commands.
Entering the command with no parameters will cause the display of all enabled registers
and memory blocks. Registers and memory blocks may be enabled or disabled by entering
the command with one of the "enable" keywords (i.e., ON or OFF) prior to the register
and/or memory list. The keywords have the following meaning:
•
ON = Enable display of the following registers and memory locations.
•
OFF = Disable display of the following registers and memory locations.
Entering the DISPLAY command with only a register or memory list causes immediate
display of the listed registers and memory locations without affecting their "enable" status.
Several register group names have been predefined and may be used in the display list to
enable, disable or display all of the registers in the group. The list of group names
available depends on the target device. For a list of the peripheral names available with a
particular ADS system, use the command HELP periph.
CAUTION
Some peripheral registers contain handshake bits that change state
when they are read. Reading these registers can interfere with the proper
operation of the peripheral within the user program.
Motorola
Debugger Command Reference
13-25
DOWN - Move Down the C Function Call Stack
Example 13-16. DISPLAY Command
Command
Explanation
display
Display all currently enabled registers and
memory of the current default target DSP
address.
display on
Enable all programming model registers for
display on the current default target DSP
address.
display p:0..300
Display p memory addresses 0 through 300 of
the current default target DSP address.
display on p:0..20 x:30..40
x:$100
Display enable p memory address block 0 to 20,
x memory address block 30 to 40 and X memory
address hexadecimal 100 of the current default
target DSP address.
display dv2 p:30..50
Display p memory address block 30 to 50 of
target DSP address 2.
display w
Display all target DSP addresses that are
currently executing user programs.
display v
Display the user interface program and
Command Converter monitor program revision
numbers.
display on host
Display enable the host peripheral registers.
display on all
Display enable all programming model and
peripheral registers.
display X:0..$100
Display the values of x memory locations 0 to
100 hex.
13.19 DOWN - Move Down the C Function Call Stack
DOWN [dev_list] [n]
The DOWN command is used to move down the call stack. It can be used in conjunction
with the WHERE, FRAME, and UP commands to display and traverse the C function call
stack. After entering a new call stack frame using DOWN, that call stack frame becomes
the current scope for evaluation. In other words, for C expressions, the EVALUATE
command acts as though this new frame is the proper place to start looking for variables.
Example 13-17. DOWN Command
down
Move down the call stack by one stack frame.
down 2
13-26
Suite56 ADS Debugger User’s Manual
Motorola
EVALUATE - Evaluate an Expression
Move down the call stack by two stack frames.
13.20 EVALUATE - Evaluate an Expression
EVALUATE [dev_list]
B(binary)/D(decimal)/F(float/fract.)/H(hex)/U(unsigned)]
expression/{c_expression}
The EVALUATE command is used as a calculator for evaluating arithmetic expressions
or for converting values from one radix to another. The result of the expression evaluation
is displayed in the specified radix. If a radix is not specified in the EVALUATE command
line, the current default radix (specified by the RADIX command) will be used. An
expression consists of an arithmetic combination of operators and operands. An operand
may be a register name, a memory location, or a constant value. For example, A2
evaluates to the contents of register A2. To evaluate A2 as hexadecimal, a dollar sign must
precede the value. The same holds for the values A0, A1, A2, B0, B1, and B2.
The order of evaluation of an expression’s operators will be associated from left to right.
Parenthesis may be used to force the order of evaluation of the expression. A more
extensive discussion of the expressions which are valid for the EVALUATE command is
in the DSP Assembler Reference Manual (Section 3). The valid symbols for an expression
are listed in the description of the BREAK command.
Example 13-18. EVALUATE Command
Command
Explanation
evaluate ro+p:$50
Add the value in r0 register to the value in program memory
address hexadecimal 50 of the current default target DSP
address and display the result using the default radix.
evaluate dv4 r0+p:$1000
Add the value in r0 register of target DSP address 4 to the
value in its program memory address hexadecimal 1000 and
display the result using the default radix.
evaluate b $345
Convert hexadecimal 345 to binary and display the result.
evaluate h %10101010&p:r0
Calculate the bitwise AND of program memory address
specified by the value in r0 register and the binary value
10101010 and display the result in hexadecimal.
evaluate $a0+$b0
Calculate the sum of hexadecimal a0 plus hexadecimal b0.
evaluate {count}
Display the value of the C variable count.
evaluate {count+max}
Evaluate the sum of the C variables count and max, and
display the result.
Motorola
Debugger Command Reference
13-27
FINISH - Step Until End of Current Subroutine
Example 13-18. EVALUATE Command
Command
Explanation
evaluate {lookup(i)}
Call the C function lookup from the command line, with the
argument i. Display the result of calling the function.
13.21 FINISH - Step Until End of Current Subroutine
FINISH [dev_list]
The FINISH command executes instructions until a Return-To-System (RTS) instruction
is executed within the current subroutine. The ADS interface program simply steps,
checking if any instruction is an RTS. If so, that RTS is executed, and instruction
execution halts immediately afterward. While stepping, if a branch to subroutine or jump
to subroutine instruction is encountered, tests for the RTS instruction are suspended until
execution resumes at the address following the subroutine call.
Example 13-19. FINISH Command
finish
Finish the current subroutine continuing from the current address until an
RTS is executed.
13.22 FORCE - Assert RESET or BREAK on Target
FORCE[dev_list] R(reset to Debug mode)/B(break)/RU(reset to User
mode)/S(System)
The FORCE command asserts a hardware reset or asserts a debug request on one or more
target systems. This command is useful for reinitializing all registers, as well as
peripherals to their Reset state or when the user wishes to halt real-time executing of the
target DSP to interrogate its registers and/or memory. All communication with the target
DSP program model must be done while the target DSP is in the Debug mode of
operation. Asserting a debug request is only required once to enter the Debug mode.
Exiting the Debug mode is accomplished via a GO, TRACE, or STEP command, or a
FORCE RU.
The B(break) argument asserts a debug request on the DSP and the register values will not
be altered. Program execution can be resumed after a break by using a GO command. The
R(reset to Debug mode) argument asserts the debug request on the DSP after the RESET
pin is asserted and continues asserting the debug request until after the RESET pin is
de-asserted, thus bringing the DSP into the Debug mode of operation at reset.
13-28
Suite56 ADS Debugger User’s Manual
Motorola
GO - Execute DSP Program
The RU (reset to User mode) argument asserts the RESET on the DSP pin only and does
not assert a debug request, thus bringing the DSP out of reset into the mode specified by
the external mode pins (which can be set by the user). The S (System) argument causes a
CFORCE R followed by a FORCE R of the devices specified in the command. This
command basically resets the Command Converter and then the target putting it into the
Debug mode of operation.
Example 13-20. FORCE Command
Command
Explanation
force r
Force a reset on the current default target DSP address. This command will
destroy the contents of some registers since a hardware reset initializes them
automatically.
force b
Force the current default target DSP address into the Debug mode of operation.
Program execution will halt and the DSP will enter the Debug mode waiting for
command entry from the Host computer via the OnCE debug port.
force dv1,4,5 b
Force target DSPs 1, 4, and 5 to halt DSP program execution and enter the
Debug mode of operation for user commands.
force ru
Reset the default target DSP into the User mode specified by its mode pins.
13.23 FRAME - Select C Function Call Stack Frame
FRAME [dev_list] [#fn]
The FRAME command is used to select the current call stack frame. It can be used in
conjunction with the WHERE, DOWN, and UP commands to display and traverse the C
function call stack. After entering a new call stack frame using FRAME, that call stack
frame becomes the current scope for evaluation. In other words, for C expressions, the
EVALUATE command acts as though this new frame is the proper place to start looking
for variables.
Example 13-21. FRAME Command
frame #2
Select call stack frame number two.
frame #0
Select call stack frame number zero (innermost frame).
13.24 GO - Execute DSP Program
GO [dev_list] [(from)location/R(reset)] [[#break_number]
[:(occurrence)count]]
Motorola
Debugger Command Reference
13-29
HELP - ADS Debugger Help
The GO command initiates program execution of DSP code. It can be used to start
multiple ADMs or target systems simultaneously. The Command Converter monitor
passes control to the user program on the ADM or target system until a breakpoint is
reached or a break is asserted with the FORCE command. The GO command can be used
to resume execution after a force break.
Invoking the command with no argument will start execution at the current program
counter value. Enabled break-points are examined at the end of every instruction cycle. If
an address argument is included, program execution begins at the address specified. The
R(reset) parameter will cause program execution to start from the user defined reset
exception.
The optional #break_number parameter may be used to cause the code execution to halt
only if that particular breakpoint condition occurs. All other breakpoint conditions are
ignored. The optional :count parameter may be used to cause the code execution to halt
only if the breakpoint has occurred a specified number of times. The occurrence count
may only be used with the break_number parameter.
Example 13-22. GO Command
go dv0,1
Start DSP program execution from the current address specified by the
program counter of target DSP addresses 0 and 1. The target DSP addresses
will stop at the first occurrence of any breakpoint set and report to the user
the register results.
go $100
Start DSP program execution at program memory address hex.100 of the
current default target DSP address.
go 100 #5 :3
Start DSP program execution at location 100 (default radix) of the current
default target DSP address and halt on the third occurrence of breakpoint
number 5.
13.25 HELP - ADS Debugger Help
HELP [dev_num] [command/reg] [command] ?
The HELP command allows the user to review the Application Development System
command set or a particular command’s description. The HELP line for command entry is
designed so that a minimum amount of documentation is required to use the ADS interface
program.
13-30
Suite56 ADS Debugger User’s Manual
Motorola
HOST - Change HOST Interface Address
Invoking the command with a command name causes a summary of that command’s
parameters with a brief description and example to be displayed on the screen. If no
command name parameter is included, the entire command set is displayed.
The HELP command may also be used to review the register names and bit descriptions of
peripheral control registers. Invoking the command with a register name causes the
register contents of the default or selected target DSP address to be displayed on the
screen.
Help for a particular command can also be obtained by entering the command and a
question mark "?".
Example 13-23. HELP Command
Command
Explanation
help
Display a summary of the available commands with their arguments.
help a
Display a summary of the ASM command, its arguments, and some examples.
help dv1 omr
Display a description of the OMR bits of target DSP address #1.
help oscr
Display a description of the OSCR bits of the default target DSP address.
break ?
Display a summary of the BREAK command, its arguments, and some examples.
13.26 HOST - Change HOST Interface Address
HOST [IO PC IO addr] [TIMEOUT value]
The HOST command allows the user to reconfigure the Host Interface card I/O address or
set the time-out count for interaction with ADMs or target systems. The I/O address may
be started at $100, $200, or $300 only on the IBM-PC interface.
The TIMEOUT argument is used to change the host timeout value. In order for the user
interface to avoid becoming hung up, it limits the time it will wait for the Command
Converter to respond. If the Command Converter does not respond within this limit, an
error message will be displayed. The default value of the timeout is 1 second.
Example 13-24. HOST Command
host
Display the current Host Interface Card address and timeout count being
used.
host timeout 3
Motorola
Debugger Command Reference
13-31
INPUT - Assign Input File
Change the host timeout to 3 seconds.
host io $200
Change the PC Host Interface address to $200.
Note:
Changing the Host Interface address should be done only after changing JG1 of
the IBM-PC Interface Card, otherwise the target DSP address will not respond
to the user interface commands.
13.27 INPUT - Assign Input File
INPUT [dev_list] [#(file number)] [OFF/[address TERM/filename
[-rd/-rf/-rh/-ru]]]
The INPUT command opens an input file which will pass data to a target device. The
Debugger begins the transfer of data when the program in the device memory executes a
DEBUG instruction residing at a specific address. There is no limit on the number of input
files that can be open.
The optional parameter dev_list represents the device or list of devices on which the
command will be performed.
The optional parameter #(file number) represents the number to assign or that has been
assigned to an input file.
The optional parameter OFF closes the input file designated by #(file number). If no file
number is indicated, all open input files are closed.
The address parameter is required when opening an input file. This address represents the
address where the DEBUG instruction resides.
The TERM parameter is required to create an input file; the contents of which are typed in
at the keyboard. The input data is in ASCII. Alternatively, an existing input file can be
opened by providing a filename. The input, whether from the keyboard or from a file, can
be expressed in hexadecimal (-rh), decimal (-rd), unsigned (-ru), or floating point (-rf). If
no radix is specified, hexadecimal is assumed as the default.
There is some preparation that you must perform outside of the Debugger in order for the
data from the input file to be written properly. You will need to place a DEBUG
instruction in your program and you will need to set designators in certain registers. You
need to do this so that the Debugger knows when to perform the data transfer, from where
to get the data, how much data to get, and where to put the data.
13-32
Suite56 ADS Debugger User’s Manual
Motorola
INPUT - Assign Input File
1. Write to the appropriate register a designator that will indicate the Input File
Number and the word count of the data that you want to input. (You will assign the
Input File Number to the input file later, when you open it.) The register to which
you write this information depends on the target device.
Device
Family
Designate the Input
File Number and word
count in register:
Designate the Input File Number and the
word count (i.e. length) of the data as
follows:
DSP56000
X0
File Number in the upper 8 bits; count in
the lower 16 bits
DSP56100
X0
File Number in the upper 8 bits; count in
the lower 8 bits
DSP56300
X0
File Number in the upper 8 bits; count in
the lower 16 bits
DSP56600
X0
File Number in the upper 8 bits; count in
the lower 8 bits
DSP56800
X0
File Number in the upper 8 bits; count in
the lower 8 bits
DSP96000
R0
File Number in the upper 16 bits; count
in the lower 16 bits
2. Write to the appropriate register a designator that indicates the memory space, and
to another register the address where you want the data to be written. Designate the
memory space as follows: 0=p, 1=x, 2=y, 3=l.
Device
Family
Designate the
Put the address where the input
memory space in register: data will be written in register:
DSP56000
R1
R0
DSP56100
R1
R0
DSP56300
R1
R0
Motorola
Debugger Command Reference
13-33
INPUT - Assign Input File
DSP56600
R1
R0
DSP56800
R1
R0
DSP96000
R2
R1
3. Place a DEBUG instruction at an appropriate address in your program. This is the
point in the program where you want the data transfer to take place.
Once the registers are set and the DEBUG instruction written, you can assign the input file
with the INPUT command.
Command Examples
Example 13-25. INPUT Command
Command
Explanation
input
Displays the currently open input files for the current device.
input dv2 p:200 data.io
Opens "data.io" file for input to device #2. Note: p:200 is the address where
the DEBUG instruction resides.
input dv2 off
Closes all current input data files assigned to device #2.
input dv1 #3
Displays the filename of Input File Number 3 for Device #1.
input p:400 data.io -rf
Opens the file "data.io" for input to the default device; in fractional radix. Note:
p:400 is the address where the DEBUG instruction resides.
input p:600 term
Creates a input file called "term". The file number defaults to the next available
consecutive number. Note: p:600 is the address where the DEBUG instruction
resides.
The Debugger provides a way to specify repeated input values and sequences very similar
to the DSP Simulator. A single data value may be repeated by specifying #count following
the data item. A group of data items may be indicated by enclosing the group in
parentheses. The entire group may then be repeated by placing #count immediately
following the closing parenthesis. The parentheses may be nested. A closing parenthesis
without a following repeat count will cause the data sequence within the parentheses to
repeat forever.
Example 13-26. Examples of Input File Data
$ABCF
A single data item $ABDF
1FF#20
13-34
Suite56 ADS Debugger User’s Manual
Motorola
LIST - List Source File Lines
Repeat the data item 1FF twenty times.
(CC 50)#5
Repeat the sequence of data pairs CC 50 five times.
There are two levels of terminal data input capability provided by the ADS Debugger. If
the INPUT command specifies term as the input filename, the ADS program enters a
resident editor which allows creation of an input data file. The data file is given a
temporary name, termxxxx.io (xxxx=0000-9999), and is saved on the disk at the
termination of the INPUT command. The entire contents of the input file may be specified
in this manner, including any of the valid fields specified above.
A second level of terminal data input allows the user to be prompted any time the next
input data value is needed. This method is triggered if the lower case letter t is encountered
in the data field of the input file. Each time a t is encountered, the user will be prompted
for a single data value from the terminal. The ADS Debugger will read the input data
using the radix option specified in the INPUT command. Hexadecimal is the default input
radix.
Example 13-27. Examples of Terminal Input Within an Input File
t#30
Request the next thirty input values from the user interactively or until an
ESCAPE character is entered.
(t)
All input values are to come from the user interactively until ESC is pressed.
For more information see, Section 6.3, “Examples of How to Assign an Input File,” on
page 6-7
13.28 LIST - List Source File Lines
LIST [+/-/./addr]
The LIST command displays source lines or disassembled instructions from the specified
source file, or beginning at the specified address. The current display mode determines
whether a source file or assembly mnemonics will be displayed. If the Debugger is in the
Register display mode, this command will switch it to the Source display mode and
display the source file lines associated with the specified address or line number. If the
display mode is already source or assembly, the display mode is not altered. The
Assembly display mode displays disassembled instructions corresponding to the specified
address or line number.
Motorola
Debugger Command Reference
13-35
LOAD - Load DSP Files
The next or previous pages of the currently displayed source file may be selected by
specifying + or –, rather than a specific address or line number. In addition, the source or
assembly associated with the current execution address may be selected by specifying.
(period) or by using the LIST command without a parameter.
Example 13-28. LIST Command
Command
Explanation
list 20
List source or assembly corresponding to line 20 of the current source file.
list test.asm@20
List source or assembly corresponding to line 20 of the source file
test.asm.
list test.asm
List source or assembly corresponding to line 1 of the source file test.asm.
list +
Display the next page of the current source file or assembly.
list
Display source or assembly corresponding to the current execution
address.
list–
Display the previous page of the current source file or assembly.
list lab_1
List source or assembly corresponding to symbolic address lab_1.
13.29 LOAD - Load DSP Files
LOAD [dev_list] [B(byte wide) address_offset] (from) file
LOAD [dev_list] [S(state)/M(memory-only)/D(debug symbols-only)] (from)
file
The LOAD command transfers DSP Macro-Assembler object files to the target DSP
memory. The object module format (OMF) is defined in Appendix A, the Common Object
File Format (COFF) is defined in Appendix B. Programs are loaded into the memory map
and address specified by each data record. A directory path may be specified with the
filename.
If only the file parameter is specified, then the user interface program assumes that the file
is an OMF file. The object file may be in either the special ASCII OMF format, or in the
DSP COFF format generated by the DSP Macro-Assembler. An OMF file may be created
by using the DSP Macro-Assembler, or by using the SAVE command, or by some user
generated method. If no filename suffix is specified, a OMF format .lod file is searched
first and if not found, then a COFF format .cld file is searched. Loading a COFF format
file replaces the target DSP symbolic debug information unless the M option is specified.
Programs are loaded into the memory map and address specified by each data record. A
directory path may be specified with the filename. The default path for each target DSP
address can be changed with the PATH command.
13-36
Suite56 ADS Debugger User’s Manual
Motorola
LOG - Log Commands or Session Output
If S is specified as the second of three parameters, the ADS interface program will load
filename as an ADS state file. The ADS state file may be created using the SAVE s
command. Loading the ADS state changes all ADS setups as well as registers and
memory, to the previous definition saved in the state filename. If no filename suffix is
specified, .adm is assumed.
If M is specified as the second parameter, the ADS interface program will load object file
filename, .cld or .lod, without modifying the target DSP symbolic debug information.
If D is specified as the second parameter, the ADS will load only the symbolic debug
information from the object file filename. The device memory contents are not altered.
Only the COFF format files (.cld suffix) are supported by this option.
If B is specified as the second parameter, the third parameter must be an address offset
which is added to the OMF data record start address where data is to be loaded. The file
must be in OMF and will be loaded byte wide sequentially incrementing the address
counter on each byte load. The low order byte will be loaded first and the high order byte
will be loaded last in each word. This is similar to the byte wide loading format of the
bootstrap loader program on the DSP. This feature allows users to download programs
into RAM and debug bootloader or overlay programs.
Example 13-29. LOAD Command
Command
Explanation
load source\testloop.lod
Load "testloop.lod" file from directory "source".
load lasttest
Load "lasttest.lod" file from current directory. If not found look
for lastltest.cld and load
load s lunchbrk
Load "lunchbrk.adm", ADS state.
load m test.cld
Load the COFF format test.cld file, ignoring any symbolic debug
information in it.
load d test.cld
Load the symbolic debug information from the COFF format
test.cld file, ignoring the memory contents of the file.
load b 300 bootprog.lod
Load the bootprog.lod file writing the least significant byte first
and most significant byte last into each consecutive memory
location of the target. The 300 argument is an address offset to
be added to the starting location of memory specified in the
data record.
13.30 LOG - Log Commands or Session Output
LOG [dev_list] [OFF] [C(commands)/S(session)] [filename] [-o/-a/-c]
Motorola
Debugger Command Reference
13-37
MORE - Enable/Disable Session Paging
LOG [dev_list] [OFF] V(source display status line)
The LOG command allows the user to record command entries only, or record all session
display output to a file. Recording of commands only is useful as a method of generating
macro command files. Recording all session display output provides a convenient way for
the user to review the results of an extended sequence of commands. The user would
otherwise only have access to the last 100 lines of output on the terminal. Since the output
log files are in ASCII format, they may easily be printed or reviewed using an editor
program.
Entering the LOG command with no parameters will cause a display of the currently
opened log filenames. The keyword OFF is used to terminate logging. The C and S key
characters are used to specify whether the logfile will contain only commands (C), or all
session output (S).
The suffixes .cmd and .log are added, respectively, to the commands-only or session
filename if no other suffix is specified. The default file path for each target DSP can be
changed with the PATH command. If a file currently exists with the filename specified the
user will be prompted for an action of either appending the data to the file, overwriting the
file, or aborting the command. The selection of the file action may be included in the
command line using the -o (overwrite), -a (append), or the -c (cancel) argument.
Example 13-30. LOG Command
Command
Explanation
log
Display currently opened log files.
log s
\debugger\session1
Log all display entries to filename "session1.log" in directory
"debugger"
log c macro1
Log all commands to filename "macro1.cmd".
log off c
Terminate command logging.
log off
Terminate all logging.
log c macro1 -a
Log all commands to filename macro1.cmd. If a file with that
name currently exists cancel the execution of the command.
13.31 MORE - Enable/Disable Session Paging
MORE [OFF]
13-38
Suite56 ADS Debugger User’s Manual
Motorola
NEXT - Step Through Subroutine Calls or Macros
The MORE command allows the user to enable or disable the paging of data on the
session window. This is particularly useful when displaying large amounts of data and you
wish to examine the data page by page.
The paging feature is turned off by default and data will scroll vertically across the screen
when it is larger than the size of the screen.
Example 13-31. MORE Command
more
Turn on session display paging control.
more off
Disable Session display paging control (reset or default state).
13.32 NEXT - Step Through Subroutine Calls or Macros
NEXT [dev_list] [count] [LI(lines)/IN(inst)]
The NEXT command functions the same as the STEP command, except that if the next
instruction to be executed calls a subroutine or begins execution of a macro, all the
instructions of the subroutine or macro are executed before stopping to display the enabled
registers. In order to recognize macros, the symbolic debug information for the program
code must be loaded. The debug information is included in the COFF format .cld files
generated using the Assembler’s –g option.
The optional count value enables repeating of the NEXT command the specified number
of times before execution terminates. All breakpoints are ignored while the NEXT
command is executing.
Example 13-32. NEXT Command
next
Step over subroutine calls or macros or otherwise just advance one
instruction and display the enabled registers and memory blocks.
next 10
Execute the equivalent of 10 NEXT instructions, halting to display the
enabled registers and memory blocks only after the tenth invocation.
next 10 li
Step over the 10 next source lines (if there is a source file associated with the
current program counter).
Motorola
Debugger Command Reference
13-39
OUTPUT - Assign Output File
13.33 OUTPUT - Assign Output File
OUTPUT [dev_list] [#(file number)... OFF]
OUTPUT [dev_list] [#(file number)] address filename/TERM [-rd/-rf/-rh/-ru]
[-o/-a/-c]
The OUTPUT command opens disk files that will accept data from the target DSP.
The optional parameter dev_list represents the device or list of devices on which the
command will be performed.
The optional parameter #(file number) represents the number to assign to an output file;
or, if referencing an existing file, the number that has been assigned to an output file.
The optional parameter OFF closes the output file designated by #(file number). If no file
number is indicated, all open output files are closed.
The address parameter is required when opening an output file. This address represents
the address where the DEBUG instruction which will trigger the data transfer resides.
To open an output file you must use the OUTPUT command with either the filename
parameter or the TERM parameter. If a file currently exists with the filename specified
with the filename parameter, you will be prompted for an action of either appending the
data to the file, overwriting the file, or aborting the command. The selection of the file
action may be included in the command line using the –o (overwrite), -a (append), or the
-c (cancel) flag. This is useful when executing macro command files.
The TERM parameter assigns the output to the display terminal rather than a file. The
input data is in ASCII. The input, whether from the keyboard or from a file, can be
expressed in decimal (-rd), floating point (-rf), hexadecimal (-rh), or unsigned (-ru). If no
radix is specified, hexadecimal is assumed as the default.
Before opening an output file, there is some preparation that you must perform outside of
the Debugger in order for the data to be correctly written to the output file. You will need
to place a DEBUG instruction in your program and you will need to set designators in
certain registers. You need to do this so that the Debugger knows when to perform the data
transfer, from where to get the data, how much data to get, and where to put the data. To
prepare data to be written to an output file:
1. Write to the appropriate register a designator that will indicate the Output File
Number and the word count (length) of the data that you want to write. (You will
13-40
Suite56 ADS Debugger User’s Manual
Motorola
OUTPUT - Assign Output File
assign the Output File Number later, when you actually open it.) The register to
which you write this information depends on the target device.
Device
Family
Designate the Output
File Number and word
count in register:
Designate the Output File Number and
the word count (i.e. length) of the data as
follows:
DSP56000
X0
File Number in the upper 8 bits; count in
the lower 16 bits
DSP56100
X0
File Number in the upper 8 bits; count in
the lower 8 bits
DSP56300
X0
File Number in the upper 8 bits; count in
the lower 16 bits
DSP56600
X0
File Number in the upper 8 bits; count in
the lower 8 bits
DSP56800
X0
File Number in the upper 8 bits; count in
the lower 8 bits
DSP96000
R0
File Number in the upper 16 bits; count
in the lower 16 bits
2. Write to the appropriate registers a designator that indicates the memory space and
address from where you want the data to be read. Designate the memory space as
follows: 0=p, 1=x, 2=y, 3=l.
Device
Family
Designate the
memory space in
register:
Put the address from where
the data will be read in
register:
DSP56000
R1
R0
DSP56100
R1
R0
DSP56300
R1
R0
Motorola
Debugger Command Reference
13-41
PATH - Define File Directory Path
DSP56600
R1
R0
DSP56800
R1
R0
DSP96000
R2
R1
3. Place a DEBUG instruction at an appropriate address in your program. This is the
point in the program where you want the data transfer to take place.
For more information see the Examples of How to Assign an Output File. Once the
registers are set and the DEBUG instruction written, you can open the output file.
OUTPUT Command Examples
Table 13-4. OUTPUT Command
Command
Explanation
output
Display all output files currently open for all target
devices.
output dv2 p:300 admout
Open file "admout.io" for logging of device #2 outputs.
Note: p:300 is the address where the DEBUG opcode is
to reside.
output dv2 off
Close file currently open for device #2 outputs.
output p:500 outfile.io -rd
Open file "outfile.io" for logging of default device outputs
in decimal radix. Note: p:500 is the address where the
DEBUG opcode is to reside.
output #2 p:700 term
Open file number 2 for the current device as the
terminal. Note: p:700 is the address where the DEBUG
opcode will reside.
13.34 PATH - Define File Directory Path
PATH [dev_list] [pathname]
PATH + pathname[,pathname,...]
PATH –
The PATH command allows the user to pre-define a directory path for file I/O for each
target DSP address. This enables the user to effectively partition data files for each target
DSP address in their appropriate subdirectory. Once a file is opened for INPUT,
OUTPUT, SAVE, or LOGging, subsequent changes to the path will not affect the opened
file. To change the path, the file must be closed and reopened with the new path name. The
user may still override the default path by explicitly specifying a pathname as a prefix to
the filename in any of the commands which reference a file.
13-42
Suite56 ADS Debugger User’s Manual
Motorola
QUIT - Quit Debugger Session
Alternate source pathnames may be specified using the PATH + form of the command.
Each time the command is issued, the specified pathname, or comma-separated list of
pathnames, is added to the current list. When searching for files, the ADS user interface
program will search first using the default pathname specified for the current device, then
in each of the alternate source pathnames, in the order that they were specified.
Example 13-33. PATH Command
Command
Explanation
path
Display the path for the current default target DSP address.
path dv1..4 \;
Define a path to the root directory for target DSP addresses 1,
2, 3, and 4. All subsequent commands with filename arguments
will have this path string preceded to the filename when making
an operating system call.
path + ..\test
Add pathname ..\test to the list of alternate source pathnames.
path + ..\test,..\help
Add pathnames ..\test+ and +..\help to the list of alternate
source pathnames.
path –
Clear the list of alternate source pathnames.
13.35 QUIT - Quit Debugger Session
QUIT [E(enable)/D(disable)]
The QUIT command passes control back to the operating system and closes all logging
files, assignment files, and macro files currently open. Use the SYSTEM command to exit
the ADS program temporarily.
QUIT enable and QUIT disable control the action taken by the ADS if an error occurs
during the execution of a macro command. QUIT enable specifies that the macro
command is aborted and the ADS quits immediately with a non-zero exit status. QUIT
disable specifies that the ADS does not exit.
Example 13-34. QUIT Command
quit
Close all currently open files and return to the Operating System. Target
DSP may be left running until the program is re-entered.
quit e
Specify that errors in a macro command will cause the ADS to exit with a
non-zero status. The ADS does ont exit when this commend is performed.
Motorola
Debugger Command Reference
13-43
RADIX - Change Input or Display Radix
13.36 RADIX - Change Input or Display Radix
RADIX [dev_list][B(bin)/D(dec)/F(flt)/H(hex)/U(uns)]
[reg[_block]/address[_block]]
The RADIX command allows the user to change the default number base for command
entry. Hexadecimal constants may always be specified by preceding the constant by a
dollar sign ($). Likewise, a decimal value may be specified by preceding the constant with
a grave accent (‘). Note: The default radix is hexadecimal when the user interface program
is initially invoked.
This means that hexadecimal constants must be entered with a preceding dollar sign.
Changing the default radix allows the user to enter constants in the chosen radix without
typing the radix specifiers before each constant.
The RADIX command also allows the user to select the display radix of registers and/or
memory. The default display radix for registers and memory is hexadecimal. The use of
the values of hex A or B require the $ preceding the value, otherwise the values will be
evaluated as the contents of the registers A or B, respectively.
Example 13-35. RADIX Command
Command
Explanation
radix
Display the default radix currently enabled.
radix h
Change default radix entry to hexadecimal Hexadecimal constant entries no
longer require a preceding dollar sign, but any decimal constants will
require a preceding grave accent (‘).
radix f a
Change the default display radix for the long register a to display a
fractional value whenever the a register is displayed.
radix u x:100..200
Enable the display radix for X data memory block 100 to 200 to be unsigned
when displayed on the screen.
13.37 REDIRECT - Redirect stdin/stdout/stderr for C
Programs
REDIRECT [dev_list] STDIN OFF/file
REDIRECT [dev_list] STDOUT/STDERR OFF/file [-A/-O/-C]
REDIRECT [dev_list] [OFF]
The REDIRECT command is used to redirect the stdin/stdout/stderr for C programs. It
allows the user to redirect stdin from a file, and redirect stdout/stderr to files. No stream
file redirection occurs while stream option is disabled.
Note:
13-44
No I/O processing or handling of redirection occurs if the streams option has
been disabled. See STREAMS for more information.
Suite56 ADS Debugger User’s Manual
Motorola
SAVE - Save Memory To File
Example 13-36. REDIRECT Command
Command
Explanation
redirect
Display the redirect list, which shows each of the three
streams that can be redirected, along with to where they are
being redirected.
redirect DV0,3,4,5 off
Cancel all stream redirection for specified target devices.
redirect stdin input
Redirect the C stdin (standard input) stream from the file
input.cio (.cio is the default extension).
redirect stdout output txt
Redirect the C stdout (standard output) stream to the file
output.txt.
redirect stderr errors
Redirect the C stderr (standard error) stream to the file
errors.cio.
redirect stdout output -o
Redirect the C stdout stream to the file output cio, overwriting
the file if it already exists.
redirect stdout output -a
Redirect the C stdout stream to the file output cio, appending
to the end of the file if it already exists.
redirect stdout output -c
Redirect the C stdout stream to the file output.cio, but don’t
redirect if the file already exists.
13.38 SAVE - Save Memory To File
SAVE [dev_num] S(state)/address_block... filename [-o/-a/-c]
The SAVE command allows creation of an ADS state file from the current ADS state, or
creation of an OMF file from specified memory blocks. If S is specified as the second
parameter, an ADS state file is created. It contains the entire ADS state, including memory
contents, breakpoint settings and the current pointer position of any open files. This file is
in an internal format that is efficient for the ADS Interface program to store and load (see
the LOAD s command description). The default suffix for an ADS state filename is .adm.
If memory blocks are specified (instead of S) the specified memory areas are stored in
Macro_Assembler object module format so the file may be reloaded with the LOAD
command. The default suffix for an OMF file is .lod. If a filename suffix of ..cld is
explicitly specified, a COFF file will be created.
If a file currently exists with the filename specified the user will be prompted for an action
of either appending the data to the file, overwriting the file, or aborting the command.
The selection of the file action may be included in the command line using the –o
(overwrite), -a (append), or the -c (cancel) argument. This is useful when executing macro
command files.
Motorola
Debugger Command Reference
13-45
STEP - Step Through DSP Program
Example 13-37. SAVE Command
save p:0..$ff x:0..$20 session1
Save all three memory maps to OMF file "session1.lod" of the current
default target DSP address. Prompt for required action if file already exists.
save s lunchbrk
Save the default ADS state to filename "lunchbrk.adm". Prompt for required
action if file already exists.
save dv1 s lunchbrk.e1 -o
Save the target DSP address 1 state to filename "lunchbrk.e1". Overwrite the
current file lunchbrk.e1 if it exists.
13.39 STEP - Step Through DSP Program
STEP [dev_list] [count] [LI(source lines)/IN(instructions)]
The STEP command allows the user to execute count instructions or C source lines before
displaying the enabled registers and memory blocks. This command gives the user a quick
way to specify execution of a number of instructions without having to set a breakpoint. It
is similar to the TRACE command except that display occurs only after the count number
of cycles or instructions have occurred.
Note that the address of the first instruction that is to be executed is in the OnCE Program
Address Bus Decode Register (OPABD). If the Program Counter is changed before a
TRACE or STEP command is issued, the address of the Program Counter Register points
to the instruction to be executed.
CAUTION
DSP5616x: When single stepping through a BRKcc instruction and the condition is true, the
instruction immediately following the BRKcc instruction will be displayed by the ADS but will not
be executed. Instead, the DSP will correctly execute the instruction at LA + 1. Single-stepping
Tcc, REPcc or REP instructions with initial loop counter equal to zero may cause incorrect DSP
operation.
The main difference between the TRACE and STEP commands is the OnCE port trace
counter is armed to trace one instruction in the Trace mode. The STEP command arms the
trace counter with the count instructions to be executed in real time before re-entering the
Debug mode of operation and displaying the enabled registers and memory.
13-46
Suite56 ADS Debugger User’s Manual
Motorola
SYSTEM - Execute Operating System Commands
Example 13-38. STEP Command
Command
Explanation
step
Step one instruction at the current target DSP address and display enabled
registers and memory blocks.
step $50
Execute hex $50 instructions and then display the enabled registers and
memory blocks.
step 3 li
Step over the next 3 source lines (for a source file associated with the current
program counter).
step dv2,5 5
Execute 5 instructions on target DSP addresses 2 and 5 simultaneously and
display the enabled registers and memory blocks of each when they have
each completed their 5 instructions.
13.40 STREAMS - Enable/Disable Handling of I/O for C
Programs
STREAMS [dev_num] [ENABLE/DISABLE]
The STREAMS command is used to enable and disable the handling of input and output
on the host side for C programs. By default, it is enabled. When enabled all input and
output that is done in the C program running on the DSP is handled on the host side. So for
example, when an fopen() call is made in the C program running on the DSP call, the host
software intercepts the call and does the fopen() on the host side.
Example 13-39. STREAMS Command
streams e
Enable handling of C input/output. All input/output calls done in a C
program running on the DSP will be handled by the host software (e.g.
fopen(), fwrite(), printf(), etc.).
streams d
Disable handling of C input/output.
13.41 SYSTEM - Execute Operating System Commands
SYSTEM [-C(continue immediately)] [system_command [argument_list]]
The SYSTEM command allows operating system commands to be executed. The
operating system commands may be executed as subprocesses of the ADS interface
program or may be executed independently by temporarily exiting the ADS interface
program. Invoking this command with no arguments will cause the ADS Interface
Program to pass control to the Operating system but stay resident. To re-enter the ADS
Motorola
Debugger Command Reference
13-47
TRACE - Trace Through DSP Program
Interface Program the EXIT command must be invoked from the operating system
command line.
Operating System commands invoked from within the ADS Interface program will not be
logged to the screen buffer for review. When a SYSTEM command is specified on the
system command line, the user is prompted to Hit return to continue... before control
returns to the ADS. This allows the user to inspect the command output before it is
destroyed. The command argument –C (continue immediately) causes control to return to
the ADS without prompting the user. This may be useful in macro commands, allowing
system commands to be used without requiring operator intervention.
Example 13-40. SYSTEM Command
system
Temporarily exit the ADS interface program and go to the Operating System
To re-enter the ADS interface program invoke the EXIT command. All
previous setups will not be altered.
system dir
Invoke the directory Operating System command from within the ADS
Interface program:
system
dir *.io
del he.io
exit
Create a MS-DOS shell and temporarily exit the ADS user interface
program. Execute two MS-DOS commands and re-enter the ADS user
interface program using the EXIT command. The current state as well as
opened files of all target DSP addresses will remain the same.
system -c del e:\temp\*.lod
Delete the specified temporary files and continue without issuing the
continuation prompt.
13.42 TRACE - Trace Through DSP Program
TRACE [dev_list] [count]/[LI(source lines)/IN(instructions)]
The TRACE command gives a snap shot of each instruction during program execution.
This single stepping capability displays the enabled registers and memory blocks after
each instruction until count instruction or C source lines are decremented to zero. To
execute an instruction requires exiting the Debug mode of operation and entering the User
13-48
Suite56 ADS Debugger User’s Manual
Motorola
TYPE - Display the Result Type of a C Expression
mode of operation so that the instruction pipeline may be restored and any result of the
traced instruction and subsequent instructions update the pipeline and machine state.
Note: The address of the instruction that is to be traced is in the OnCE Program Address
Bus Decode Register (OPABD). If the program counter is changed before a TRACE or
STEP command is issued, the address of the program counter register will point to the
instruction to be traced.
When single stepping through the BRKcc instruction and the condition is true, the
instruction immediately following the BRKcc instruction is displayed by the ADS but is
be executed. Instead, the DSP correctly executes the instruction at LA + 1. Single-stepping
a Tcc, REPcc, or REP instruction with initial loop counter equal to zero may cause
incorrect DSP operation.
The main difference between the TRACE and STEP commands is the OnCE port trace
counter is armed to trace one instruction in the Trace mode. The STEP command arms the
trace counter with the count instructions to be executed in real time before re-entering the
Debug mode of operation and displaying enabled registers and memory.
Example 13-41. TRACE Command
Command
Explanation
trace
Execute one instruction and display the enabled registers and memory
blocks.
trace 20
Execute 20 instructions and display the enabled registers and memory blocks
after each instruction.
trace 5 li
Execute the next 5 lines of source, and display enabled registers and
memory blocks after each line.
trace dv2,4 5
Execute 5 instructions on target DSP address 2 and target DSP address 4
from their current program counter and display their enabled registers and
memory blocks after each instruction.
13.43 TYPE - Display the Result Type of a C Expression
TYPE [dev_list] {c_expression}
The TYPE command is used to display the result type of a C expression. If result of the
expression is a storage location (e.g., just a variable name, or an element of an array), it
will display the address of the storage location, in addition to its data type.
Example 13-42. TYPE Command
type {count}
Display the type and location of the variable count.
Motorola
Debugger Command Reference
13-49
UNLOCK - Unlock Password Protected Device Type
type {0.5+i}
Display the type of the given expression.
13.44 UNLOCK - Unlock Password Protected Device Type
UNLOCK dev_type password
The UNLOCK command provides password enabling for emulation of unannounced
device types. Once unlocked, the device type may be selected with the DEVICE
command.
Example 13-43. UNLOCK Command
unlock 56002 x51-234
Enable device type 56002 for simulation using the password x51-234.
13.45 UNTIL - Step Until Address
UNTIL [dev_list] addr/line_number/address_label
The UNTIL command sets a temporary breakpoint at the specified line or address, then
steps until that breakpoint. It then clears the temporary breakpoint and displays the
enabled registers and memory blocks in the same manner as the STEP command.
The addr parameter may be expressed as a line number in the program source file.
Specification of a line number is valid only if the symbolic debug information has been
loaded from a COFF format .cld file. The debug information is generated using the
Assembler’s –g option. Line numbers may be specified as filename@line_number for a
line number in a particular file or simply by line_number for line numbers in the currently
displayed file.
All other breakpoints are ignored while the UNTIL command is executing.
Example 13-44. UNTIL Command
until 20
Go until the instruction associated with line 20 in the current file is reached.
until p:$50
Go until the instruction at hexadecimal address p:50 is reached.
until lab_2
Go until the instruction at label lab_2 is reached.
13-50
Suite56 ADS Debugger User’s Manual
Motorola
WAIT - Wait Specified Time
13.46 UP - Move Up the C Function Call Stack
UP [dev_list] [n]
The UP command is used to move up the call stack. It can be used in conjunction with the
WHERE, FRAME, and DOWN commands to display and traverse the C function call
stack.
After entering a new call stack frame using UP, that call stack frame becomes the current
scope for evaluation. In other words, for C expressions, the EVALUATE command acts as
though this new frame is the proper place to start looking for variables.
Example 13-45. UP Command
up
Move up the call stack by one stack frame
up 3
Move up the call stack by three stack frames.
13.47 VIEW - Select Display Mode
VIEW [A(assembly)/S(source)/R(register)]
The VIEW command changes the ADS display mode. There are three display modes:
Assembly, Source, and Register. If the VIEW command is entered with a parameter, the
specified display mode is selected. When no parameter is entered, the display mode cycles
to the next display mode in the following order: Source—Assembly—Register. The same
results can be obtained by typing Ctrl-w.
Example 13-46. VIEW Command
Command
Explanation
view
Cycle to the next display mode among Source Assembly and Register modes.
view s
Select Source display mode.
view a
Select Assembly display mode.
view r
Select Register display mode.
13.48 WAIT - Wait Specified Time
WAIT [[dev_list] B(break)]/count(seconds)]
The WAIT command pauses for count seconds or until the user types any key before
continuing to the next command. If the WAIT command is entered without a count
Motorola
Debugger Command Reference
13-51
WATCH - Set, Modify, View, or Clear Watch Item
parameter, the command will terminate only if the user types a key. This instruction is
useful when executing a macro file and the current display on the screen needs to be
examined before executing further instructions from the macro file. The B option causes a
pause until all of the specified devices have entered the Debug mode. This option is useful
when executing a macro file where the devices must hit breakpoints or complete steps or
traces before the next command is accepted.
Example 13-47. WAIT Command
wait
Wait for a key stroke from the keyboard before executing any further
instructions.
wait 10
Wait ten seconds before executing another command from the keyboard.
wait dv0..3 b
Wait until devices 0,1,2 and 3 have all entered the debug mode.
13.49 WATCH - Set, Modify, View, or Clear Watch Item
WATCH [dev_list] [#wn] [radix] reg/addr/expression/{c_expression}
WATCH [dev_list] [#wn] OFF
The WATCH command is used to add, modify, view, and clear watch items. Watch items
are on a watch list that gets displayed every time the user does a trace, or a breakpoint is
hit. Additionally, any time a user types WATCH without any parameters, the watch list is
displayed.
Example 13-48. WATCH Command
Command
Explanation
watch r0
Add register r0 to the watch list
watch x:0
Add x:0 to the watch list
watch
{(count+1)%total}
Add the given C expression to the watch list
watch h {count/2}
Add the given C expression to the watch list with display radix hex.
watch b {flag}
Add the given C variable to the watch list with display radix binary.
watch r0+x:0
Add the expression r0+x:0 to the watch list
13-52
Suite56 ADS Debugger User’s Manual
Motorola
WBREAKPOINT - GUI Breakpoint Window
Example 13-48. WATCH Command
Command
Explanation
watch
Display the watch list
watch #3 off
Remove item number three from the watch list
watch off
Remove all items from the watch list
13.50 WASM - GUI Assembly Window
WASM [dev_list] [OFF]
WASM is a GUI command that opens an assembly window. Multiple device windows
may be opened for debugging target systems with multiple DSPs.
Example 13-49. WASM Command
wasm
Open an assembly window for the current device.
wasm dv0..1
Open an assembly window for devices dv0 and dv1.
wasm off
Close the assembly window or the current device.
13.51 WBREAKPOINT - GUI Breakpoint Window
WBREAKPOINT [dev_list] [OFF]
WBREAKPOINT is a GUI command that opens a breakpoint window. Multiple device
windows may be opened for debugging target systems with multiple DSPs.
Example 13-50. WBREAKPOINT Command
wbreakpoint
Open a breakpoint window for the current device.
wbreakpoint dv0,3,4
Open a breakpoint window for the listed devices.
wbreakpoint off
Close the breakpoint window for the current device.
Motorola
Debugger Command Reference
13-53
WCALLS - GUI C Calls Stack Window
13.52 WCALLS - GUI C Calls Stack Window
WCALLS [dev_list] [OFF]
WCALLS is a GUI command that opens a C call stack window. Multiple device windows
may be opened for debugging target systems with multiple DSPs.
Example 13-51. WCALLS Command
wcalls
Open a C call stack window for the current device.
wcalls off
Close the C call stack window for the current device.
13.53 WCOMMAND - GUI Command Window
WCOMMAND [OFF]
WCOMMAND is a GUI command that opens the Command window. Only one
Command window may be opened even for debugging target systems with multiple DSPs.
The Command window is shared between all target DSP devices. All commands affect the
current default device unless specifically addressed to other device(s). The prompt on the
command entry line indicates the current default device.
Example 13-52. WCOMMAND Command
wcommand
Open a Command window
wcommand off
Close the Command window
13.54 WHERE - GUI C Call Stack Window
WHERE [dev_list] [[+/-]n]
WHERE is a GUI command that displays the C function call stack. Multiple device
windows may be opened for debugging target systems with multiple DSPs.
Example 13-53. WHERE Command
where
Display the call stack
where3
Display the three innermost frames in the call stack
13-54
Suite56 ADS Debugger User’s Manual
Motorola
WLIST - GUI List Window
where-5
Display the five outermost frames in the call stack
13.55 WINPUT - GUI File Input Window
WINPUT [dev_list] [OFF]
WINPUT is a GUI command that opens an input window. The input window lists all
simulated input assignments for the specified device. Multiple device windows may be
opened for debugging target systems with multiple DSPs.
Example 13-54. WINPUT Command
winput
Open an input window for the current device.
winput off
Close the input window for the current device.
13.56 WLIST - GUI List Window
WLIST [win_num] [OFF]
WLIST is a GUI command that opens a list window. A list window is used to view a test
file within the ADS environment. Multiple list windows may be opened for viewing
multiple text files.
Example 13-55. WLIST Command
Command
Explanation
wlist lfile.1st
Open a list window with the text file lfile.1st displayed.
wlist win2 lfile.1st
Open a list window with a window number of 2 with text lfile.txt
displayed. If list window 2 already exists, replace the contents with
lfile.1st.
wlist win2 off
Close list window number 2.
wlistoff
Close all open list windows.
wlist win3
Open a list window with a window number of 3 with no text file
displayed.
Motorola
Debugger Command Reference
13-55
WMEMORY - GUI Memory Window
13.57 WMEMORY - GUI Memory Window
WMEMORY [dev_list] [win_num] [space [addr]/[OFF]]
WMEMORY is a GUI command that opens a memory window. Multiple device windows
may be opened for viewing and changing separate memory areas and spaces at the same
time, and for debugging target systems with multiple DSPs. The memory window is
positioned initially to view the address specified by the addr field. The addr field may also
be used in conjunction with the space field to select the exact memory space required.
Example 13-56. WMEMORY Command
Command
Explanation
wmemory pi
Open a memory window for the internal program (pi) memory space for the
current device.
wmemory xi 0
Open a memory window for the xi memory space containing address 0 for the
current device.
wmemory dv2 win3 x
$4100
Open a memory window for memory space x with a window number of 3 for the
current device. Scroll window to display address $4100.
wmemory off
Close all memory windows for the current device.
wmemory win3 off
Close memory window 3 for the current device.
13.58 WOUTPUT - GUI File Output Window
WOUTPUT [dev_list] [OFF]
WOUTPUT is a GUI command that opens a file output window. The output window
displays the simulated output assignments for the specified device. Multiple output
windows may be opened for debugging target systems with multiple DSPs.
Example 13-57. WOUTPUT Command
woutput
Open an output window for the current device.
woutput dv1 off
Close the output window for the device dv1.
13.59 WREGISTER - GUI Register Window
WREGISTER [dev_list] [win_num] [OFF]
13-56
Suite56 ADS Debugger User’s Manual
Motorola
WSOURCE - GUI Source Window
WREGISTER is a GUI command that opens a register window. Multiple register
windows may be opened to display and change separate blocks of registers at the same
time. Multiple device windows may be opened for debugging target systems with multiple
DSPs.
Example 13-58. WREGISTER Command
wregister
Open a register window for the current device.
wregister win3
Open a register window with a window number of 3 for the current device.
wregister dv1 off
Close all register windows for the device dv1.
13.60 WSESSION - GUI Session Window
WSESSION [OFF]
The WSESSION command opens a Session window. Only one Session window may be
opened even for debugging target systems with multiple DSPs. All session output from all
target devices is written to the Session window. A message is output to indicate which
target device produced the following output.
Example 13-59. WSESSION Command
wsession
Open a Session window for the current device.
wsession off
Close the Session window
13.61 WSOURCE - GUI Source Window
WSOURCE [dev_list] [OFF]
The WSOURCE command opens a Source Code window. Multiple device windows may
be opened for debugging target systems with multiple DSPs.
Example 13-60. WSOURCE Command
wsource
Open a Source window for the current device.
wsource off
Motorola
Debugger Command Reference
13-57
WSTACK - GUI Stack Window
Close the Source windows for the current device.
13.62 WSTACK - GUI Stack Window
WSTACK [dev_list] [OFF]
The WSTACK command opens a Device Stack window. Multiple device windows may
be opened for debugging target systems with multiple DSPs.
Example 13-61. WSTACK Command
wstack
Open a Stack window for the current device.
wstack off
Close the Stack window for the current device.
13.63 WWATCH - GUI Watch Window
WWATCH [dev_list] [win_num] [#wn] [radix] reg/addr/expression
WWATCH [dev_list] [win_num] [#wn] [OFF]
The WWATCH command opens a Watch window Multiple device windows can be
opened for debugging target systems with multiple DSPs.
Example 13-62. WWATCH Command
Command
Explanation
wwatch r0
Opena Watch window for the current device with the register r0 displayed. If the
window already exists, add r0 to the list of watched items.
wwatch x:$100
Open a Watch window for the current device with the memory location x:$100
displayed. If the window already exists, add x:$100 to the list of watched items.
wwatch r2+3
Open a Watch window for the current device with the expression r2+3 displayed. If
the window already exists, add r2+3 to the list of watched items.
wwatch win2 r0
Open a Watch window for the current device with a window number of 2 with the
register r0 displayed. If the window already exists, add r0 to the list of watched
items.
wwatch off
Close all Watch windows for the current device.
wwatch win3 off
Close Watch window 3 for the current device.
wwatch #2 off
Remove watch element #2 from first Watch window’s list of watched elements.
13-58
Suite56 ADS Debugger User’s Manual
Motorola
WWATCH - GUI Watch Window
Example 13-62. WWATCH Command
Command
wwatch win4 #2 off
Motorola
Explanation
Remove watch element #2 from Watch window 4’s list of watched elements.
Debugger Command Reference
13-59
WWATCH - GUI Watch Window
13-60
Suite56 ADS Debugger User’s Manual
Motorola
Chapter 14
Library Functions
The ADSDSP emulator package includes several libraries of functions which were used to
build the emulator. These libraries allow the user to build his own customized emulator
and integrate it with his unique project. The source code for many of the ADSDSP
functions is provided, including the code for the main entry point, the code for the terminal
I/O functions, and example code for a non-display version of the emulator. The source
code can be modified to create an emulator customized for a particular application.
A custom emulator may be built with or without display support. Omitting display support
reduces the program size by about half, but sacrifices the screen output facilities used in
the ADS; omitting the display also sacrifices the user interface and command parsing and
execution routines (which rely on the display routines). A non-display ADS may be used
to provide direct program control of the hardware by calling the low-level routines,
creating reports and activity logs using standard C functions. Omitting display support
does not preclude the use of the standard C input/output functions or the creation of an
alternative user interface.
The rest of the chapter covers various aspects of the specification and use of the libraries:
•
Section 14.1, "ADS Object Library Files," lists and groups the functions
•
Section 14.2, "Library Function Descriptions," defines each function
•
Section 14.3, "Emulator Screen Management Functions," defines the display
(terminal I/O) functions
•
Section 14.4, "Non-Display Emulator," discusses display and non-display
support
•
Section 14.5, "Multiple Device Emulation," describes the emulation of multiple
DSP devices
•
Section 14.6, "Reserved Function Names," lists reserved function names
•
Section 14.7, "Emulator Global Variables," describes global data used by the
emulator
•
Section 14.8, "Modification of Emulator Global Structures," covers tailoring
items in the global structures
Motorola
Library Functions
14-1
ADS Object Library Files
14.1 ADS Object Library Files
The following sections describe the different types of object library files.
14.1.1 Ads Object Library Entrypoints
The library functions are listed below. They are divided into groups by their function
name prefix. The prefix indicates to which part of the ADS they belong, and indicates if
they are available in the display or non-display versions of the emulator.
•
ads_
ADS-specific routines; both versions
•
dspd_
driver level; not for use by user code; both versions
•
spd_cc_ Command Converter driver level; not for use by user code; both
•
dspt_
DSP device dependent routines; both versions
•
dsp_
both versions
•
dsp_cc_ Command Converter routines; both versions
•
sim_
display only; user interface routines
The driver-level routines (both those referred to above and those documented in the rest of
this chapter) are not intended to be called by emulator code. They are designed to be called
(directly or indirectly) by the interface routines. They are documented so that the user can
rewrite them to drive alternate emulator hardware. Other lower-level functions mentioned
in this chapter are not intended to be called by user code; these functions are not
documented and are specified by the prefixes dspl_, siml_ and dsptl_.
14.1.2 Library Entrypoints Listed By Prefix
The following sections list the different routines.
14.1.2.1 ADS Specific Utility Routines
Table 14-1 lists ADS specific utility routines:
Table 14-1. ads_—ADS-Specific Utility Routines
Routine
Description
ads_cache_registers(devn);
Read OnCE and core registers from device
ads_startup(devp, devtype);
Initialize ADS database and driver
14-2
Suite56 ADS Debugger User’s Manual
Motorola
ADS Object Library Files
14.1.2.2 Command Converter Driver Level Routines
Table 14-2 lists command converter driver level routines.
Table 14-2. dspd_cc_—Command Converter Driver Level Routines
Routine
Description
dspd_cc_architecture
(devn, device_type);
Initialize Command Converter for DSP family
dspd_cc_read_flag
(devn, flag, value);
Read Command Converter flag word
dspd_cc_read_memory(devn, mem,
addr, count, value);
Read from Command Converter memory
dspd_cc_reset(devn);
Reset Command Converter
dspd_cc_revision
(devn, revstring);
Read Command Converter revision number
dspd_cc_write_flag
(devn, flag, value);
Write Command Converter flag word
dspd_cc_write_memory(devn, mem,
addr, count, value);
Write to Command Converter memory
14.1.2.3 Driver Level Routines
Table 14-3 lists driver level routines:
Table 14-3. dspd_—Driver Level Routines
Routine
Description
dspd_break(devn, command);
Force running DSP into debug mode
dspd_check_service_request
(devn);
See if DSP is requesting service from host
dspd_fill_memory(devn, mem, addr,
count, value);
Initialize DSP memory buffer to single value
dspd_go(devn, opcode, operand);
Begin execution on target DSP device
dspd_jtag_reset(devn, reset_type);
Reset JTAG communications
dspd_read_core_registers
(devn, reg_num, count, value);
Read core registers from DSP device
Motorola
Library Functions
14-3
ADS Object Library Files
Table 14-3. dspd_—Driver Level Routines (Continued)
Routine
Description
dspd_read_memory(devn,
mem_space, addr, count, value);
Read memory block from DSP device
dspd_read_once_registers
(devn, reg_num, count, value);
Read once registers from DSP device
dspd_reset(devn, reset_mode);
Reset specified DSP device
dspd_status(devn, mode);
Determine DSP status
dspd_write_core_registers
(devn, reg_num, count, value);
Write core registers to DSP device
dspd_write_memory(devn, mem_space,
addr, count, value);
Write to memory in DSP device
dspd_write_once_registers
(devn, reg_num, count, value);
Write once registers from DSP device
14.1.2.4 DSP Device Specific Routines
Table 14-4 lists DSP device specific routines:
Table 14-4. dspt_—DSP Device Specific Routines
Routine
Description
dspt_masm_xxxxx
(mnemonic, ops, err);
Assemble mnemonic string to ops
dspt_unasm_xxxxx
(ops, sr, omr, sdbp);
Disassemble DSP opcodes
14.1.2.5 Command Converter Interface Routines
Table 14-5 lists command converter interface routines:
Table 14-5. dsp_cc_—Command Converter Interface Routines
Routine
Description
dsp_cc_fmem(device, mtype, addr,
count, value);
Fill Command Converter memory block
dsp_cc_go(devn);
Start program on Command Converter
dsp_cc_ldmem(devn, loadfn);
Load Command Converter Memory from file
14-4
Suite56 ADS Debugger User’s Manual
Motorola
ADS Object Library Files
Table 14-5. dsp_cc_—Command Converter Interface Routines (Continued)
Routine
Description
dsp_cc_reset(device);
Reset Command Converter
dsp_cc_revision
(devn, revstring);
Read Command Converter Monitor Revision
dsp_cc_rmem
(device, mtype, addr, value);
Read Command Converter Memory
dsp_cc_rmem_blk(device, mtype,
addr, count, value);
Read Command Converter memory block
dsp_cc_wmem
(device, mtype, addr, value);
Write Command Converter memory
dsp_cc_wmem_blk(device, mtype,
addr, count, value);
Write Command Converter memory block
14.1.2.6 ADS Interface Routines
Table 14-6 lists ADS interface routines:
Table 14-6. dsp_—ADS Interface Routines
Routine
Description
dsp_alloc(nbytes,clearmem);
Allocate Memory
dsp_check_service_request
(devn);
Determine if device is requesting service
dsp_findmem(devn,memname,map);
Get map index for memory prefix
dsp_findreg
(devn,regname,pval,rval);
Get peripheral and register index
dsp_fmem
(devn,map,addr,blocksz,val);
Fill memory block with a value
dsp_free(devn);
Free memory allocated for a DSP device
dsp_free_mem(cp);
Free memory block
dsp_go(devn);
Initiate program execution
dsp_go_address(devn, addr);
Initiate program execution from addr
dsp_go_reset(devn);
Initiate program execution after reset
Motorola
Library Functions
14-5
ADS Object Library Files
Table 14-6. dsp_—ADS Interface Routines
Routine
Description
dsp_init(devn);
Initialize selected device
dsp_ldmem(devn,filename);
Load device memory from filename
dsp_load(filename);
Load all device states from filename
dsp_new(devn,device_type);
Create new DSP device
dsp_path
(path,base,suffix,new_name);
Create filename from path, base and suffix
dsp_realloc(mem_blk, nbytes);
Reallocate memory block
dsp_reset(devn);
Reset specified DSP device
dsp_rmem
(devn,map,addr,mem_val);
Read DSP memory map addr to mem_val
dsp_rmem_blk
(devn,map,addr,count,value);
Read Block of DSP Memory Locations
dsp_rreg
(devn,periphn,regn,regval);
Read DSP peripheral register to regval
dsp_save(filename);
Save the state of all devices to filename
dsp_spath(base, sufx, retn);
Search path for specified file
dsp_startup();
Initialize emulator structures
dsp_status(devn, mode);
Determine DSP Device Status
dsp_step(devn, step);
Execute counted instructions
dsp_stop(devn);
Force DSP device into Debug Mode
dsp_unlock
(device_type,password);
Unlock password protected device type
dsp_wmem(devn,map,addr,val);
Write DSP memory map addr with val
dsp_wmem_blk
(devn,map,addr,count,value;
Write DSP Memory Block
dsp_wreg
(devn,periphn,regn,regval);
Write DSP peripheral register with regval
14-6
Suite56 ADS Debugger User’s Manual
Motorola
Library Function Descriptions
14.1.2.7 User Interface Routines
Table 14-7 lists user interface routines:
Table 14-7. sim_—User Interface Routines
Routine
Description
sim_docmd(devn,command_string);
Perform emulator command on DSP device
sim_gmcmd(devn,command_string);
Get Command String from Macro File
sim_gtcmd(devn,command_string);
Get Command String from Terminal
14.2 Library Function Descriptions
The following sections defines and describes each library function.
14.2.1 ads_cache_registers—Cache OnCE and Core Registers
#include "simcom.h"
#include “protocom.h”
int ads_cache_registers(device_index)
int device;/* device affected by command */
ads_cache_registers() caches all OnCE and core registers on the target device
device_index to ensure the integrity of values returned by dsp_rreg().
This routine must always be called before calling dsp_rreg() each time the device
returns to debug mode. If it is not called, the values returned by dsp_rreg() may be
unreliable.
The return value is TRUE on successful completion, FALSE otherwise. See Example 14-1.
Motorola
Library Functions
14-7
Library Function Descriptions
Example 14-1. ads_cache_registers()
/* cache registers */
#include “simcom.h”
#include "protocom.h"
int devn = 0;
int periphnum_pc, regnum_pc;
unsigned long pc_value;
int status;
/* Find register reference numbers */
status=dsp_findreg(devn,"pc”,&periphnum_pc,®num_pc)
status=dsp_check_service_request(devn)
/* Is device requesting service? */
ckerr(status);
if (status)
/* Yes, so... */
{
status=ads_cache_registers(devn);/* cache the registers */
/* get pc addr for service request */
status=dsp_rreg(devn,periphnum_pc,regnum_pc,&pc_value);
}
14.2.2 ads_startup—Initialize ADS Database and Driver
#include “simcom.h”
#include “protocom.h”
int ads_startup(devp, devtype)
char *devp;/* device driver name (UNIX) or board address (PC) */
int devtype;/* Device family */
ads_startup() initializes the device driver and allocates certain ADS data structures.
devp points to a character string containing the name of the device driver on UNIX™
systems, or the board address on PC systems (DOS or WINDOWS). devtype indicates
which family of DSP devices is being used.
ads_startup() must be called before calling dsp_startup().
Valid values for devtype are:
• ADSP56000
• ADSP56300
• ADSP96000
The function return value is TRUE on successful completion, FALSE otherwise. See
Example 14-2.
14-8
Suite56 ADS Debugger User’s Manual
Motorola
Library Function Descriptions
Example 14-2. ads_startup()
/* Initialize ADS software (PC)*/
#include “simcom.h”
#include “protocom.h”
int status;
status=ads_startup(“100”, ADSP56000);
/* Initialize ADS software (UNIX™)*/
#include “simcom.h”
#include “protocom.h”
int status;
status=ads_startup(“/dev/mdsp0”, ADSP56000);
14.2.3 dspd_break—Force Running DSP into Debug Mode
#include “cc.h”
#include “simcom.h”
#include “driver.h”
int dspd_break(device_index, command)
int device_index;/* DSP device to be affected by command */
int command;/* command to be sent to DSP device */
dspd_break() forces the target device device_index into debug mode, using the
method specified by the parameter command.
Valid values for command are:
•
DSP_JTAG_BREAK—used for devices with JTAG port
•
DSP_ONCE_BREAK—used for devices with OnCE port
The function returns DSP_OK if the operation succeeds, DSP_ERROR otherwise. See
Example 14-3.
Motorola
Library Functions
14-9
Library Function Descriptions
Example 14-3. dspd_break()
/* Force
#include
#include
#include
DSP into debug mode */
"cc.h"
"simcom.h"
"driver.h"
int devn;
int break_status;
devn=0;
dsp_new(devn,"56002");/* Allocate structure for device 0, a 56002
*/
.....
break_status=dspd_break(devn,DSP_ONCE_BREAK)/* Force device into
DEBUG mode */
14.2.4 dspd_cc_architecture—Initialize Command Converter for
DSP Family
#include "driver.h"
int dspd_cc_architecture(device_index, device_type)
int device_index;/* DSP device affected by command */
int device_type;/* Type of DSP device */
This function initializes the Command Converter device_index for the target
architecture specified by device_type. The device attached to the Command Converter
may be any member of the specified DSP family. See Example 14-4.
Valid values for device_type are:
• DSP_CC_56000
• DSP_CC_56300
• DSP_CC_96000
Example 14-4. dspd_cc_architecture()
/* Initialize Command Converter for device 0, a 56002 */
#include "driver.h"
int devn, status;
devn=0;
status=dspd_cc_architecture(devn,DSP_CC_56000);/* setup CC for 56K
family */
dsp_new(devn,"56002");/* Allocate structure for device 0, a 56002 */
14-10
Suite56 ADS Debugger User’s Manual
Motorola
Library Function Descriptions
14.2.5 dspd_cc_read_flag—Read Command Converter Flag Word
#include "cc.h"
#include "simcom.h"
#include "driver.h"
int dspd_cc_read_flag(device_index, flag, value)
int device_index;/* Command Converter affected by command */
int flag;/* Specify flag to read */
unsigned long *value;/* Location to receive flag value */
dspd_cc_read_flag() reads flag word flag from Command Converter
device_index, storing the value obtained in the location pointed to by value.
Valid values for flag are:
•
•
•
•
•
•
•
•
DSP_CC_FLAGS
DSP_CC_STATUS
DSP_CC_XPTR
DSP_CC_YPTR
DSP_CC_DEVICE_ADDRESS
DSP_CC_CLOCK_RATE
DSP_CC_DEVICE_COUNT
DSP_CC_DEVICE_ACTIVE
The function returns DSP_OK on success, DSP_ERROR otherwise. See Example 14-5.
Example 14-5. dspd_cc_read_flag()
/* Read Command Converter flag word */
#include "cc.h"
#include "simcom.h"
#include "driver.h"
int status, flag_value, devn;
devn=0;
status=dspd_cc_read_flag(devn, DSP_CC_XPTR, &flag_value);
Motorola
Library Functions
14-11
Library Function Descriptions
14.2.6 dspd_cc_read_memory—Read from Command Converter
Memory
#include "simcom.h"
#include "driver.h"
#include "cc.h"
int dspd_read_memory(device_index, mem_space, address, count, value)
int device_index;/* Command Converter affected by command */
int mem_space;/* Memory space to read */
unsigned long address;/* Address of first location to read */
unsigned long count;/* Number of locations to read */
unsigned long *value;/* Address of buffer to receive read values */
dspd_cc_read_memory() reads a block of memory starting at address address, length
count, in memory space mem_space on Command Converter device_index. The
values read are stored in the buffer pointed to by value.
Valid values for mem_space are:
• DSP_CC_PMEM
• DSP_CC_XMEM
• DSP_CC_YMEM
The return value is DSP_OK for success, DSP_ERROR if the transaction fails. See
Example 14-6.
Example 14-6. dspd_cc_read_memory()
/* Read memory block from Command Converter*/
#include "simcom.h"
#include "driver.h"
#include "cc.h"
int devn, status;
unsigned long read_addr, read_len;
unsigned long *read_buf;
devn=0;
read_buf = (unsigned long *)dsp_alloc(100*sizeof(unsigned long));
read_addr=0x0400l;
read_len=100l;
status=dspd_cc_read_memory(devn,DSP_CC_PMEM,read_addr,read_len,read_bu
f);
14-12
Suite56 ADS Debugger User’s Manual
Motorola
Library Function Descriptions
14.2.7 dspd_cc_reset—Reset Command Converter
#include "simcom.h"
#include "driver.h"
int dspd_cc_reset(device_index)
int device_index;
dspd_cc_reset() resets the Command Converter device_index.
The return value is DSP_OK for success, DSP_ERROR if the reset fails. See Example 14-7.
Example 14-7. dspd_cc_reset()
/* Reset Command Converter */
#include "simcom.h"
#include "driver.h"
int devn, status;
devn=0;
status=dspd_cc_reset(devn);
14.2.8 dspd_cc_revision—Read Command Convertor Revision
Number
#include "simcom.h"
#include "driver.h"
int dspd_cc_revision(device_index, revstring)
int device_index;/* Command Converter affected by command */
char *revstring;/* pointer to buffer to receive revision number string
*/
dspd_cc_revision() returns a text string containing the version number of the
monitor for Command Converter device_index in the buffer pointed to by
revstring.
The message is created with the format:
"Command Converter monitor revision {%4.2f}"
The return value is DSP_OK for success, DSP_ERROR if the reset fails. See Example 14-8.
Motorola
Library Functions
14-13
Library Function Descriptions
Example 14-8. dspd_cc_revision()
/* Read CC monitor revision number */
#include "simcom.h"
#include "driver.h"
int devn, status;
char *rev_buf;
devn=0;
rev_buf = (unsigned long *)dsp_alloc(100*sizeof(char));
status=dspd_cc_revision(devn,rev_buf);
14.2.9 dspd_cc_write_flag—Write Command Converter Flag Word
#include "cc.h"
#include "simcom.h"
#include "driver.h"
int dspd_cc_write_flag(device_index, flag, value)
int device_index;
int flag;
unsigned long value;
dspd_cc_write_flag() writes to flag word flag on Command Converter
device_index, fetching the value from the location pointed to by value.
Valid values for flag are:
•
DSP_CC_FLAGS
• DSP_CC_STATUS
•
•
•
•
•
•
DSP_CC_XPTR
DSP_CC_YPTR
DSP_CC_DEVICE_ADDRESS
DSP_CC_CLOCK_RATE
DSP_CC_DEVICE_COUNT
DSP_CC_DEVICE_ACTIVE
The function returns DSP_OK on success, DSP_ERROR otherwise. See Example 14-9.
14-14
Suite56 ADS Debugger User’s Manual
Motorola
Library Function Descriptions
Example 14-9. dspd_cc_write_flag()
/* Write
#include
#include
#include
Command Converter flags */
"cc.h"
"simcom.h"
"driver.h"
int devn, status;
devn=0;
status=dspd_cc_write_flags(devn,DSP_CC_YPTR,0x0400l);
14.2.10 dspd_cc_write_memory—Write to Command Converter
Memory
#include "simcom.h"
#include "driver.h"
#include "cc.h"
int dspd_write_memory(device_index, mem_space, address, count, value)
int device_index;/* Command Converter affected by command */
int mem_space;/* Memory space to write */
unsigned long address;/* Address of first location to write */
unsigned long count;/* Number of locations to write */
unsigned long *value;/* Address of buffer of values to write */
dspd_cc_write_memory() writes a block of memory starting at address address,
length count, in memory space mem_space on Command Converter device_index.
The values read are retrieved from the buffer pointed to by value.
Valid values for mem_space are:
•
DSP_CC_PMEM—program memory
•
DSP_CC_XMEM—X data memory
•
DSP_CC_YMEM—Y data memory
The return value is DSP_OK for success, DSP_ERROR if the transaction fails. See
Example 14-10.
Motorola
Library Functions
14-15
Library Function Descriptions
Example 14-10. dspd_cc_write_memory()
/* Write
#include
#include
#include
memory block to Command Converter*/
"simcom.h"
"driver.h"
"cc.h"
int devn, status;
unsigned long write_addr, write_len;
unsigned long *write_buf;
devn=0;
write_buf = (unsigned long *)dsp_alloc(100*sizeof(unsigned long));
get_values_in(write_buf, 100l)/* fetch values to write... */
write_addr=0x0400l;
write_len=100l;
status=dspd_cc_write_memory(devn,DSP_CC_PMEM,write_addr,write_len,writ
e_buf);
14.2.11 dspd_check_service_request—Check for Service Request
#include "simcom.h"
#include "driver.h"
int dspd_check_service_request(device_index)
int device_index;/* DSP index affected by command */
dspd_check_service_request() checks to see if the target device device_index
is requesting service from the host computer
The return value is TRUE if the device is requesting service, FALSE if it is not requesting
service, and DSP_ERROR if the function cannot complete successfully. See
Example 14-11.
14-16
Suite56 ADS Debugger User’s Manual
Motorola
Library Function Descriptions
Example 14-11. dspd_check_service_request()
/* Check to see if a DSP device is requesting service */
#include "simcom.h"
#include "driver.h"
int devn;
int status;
devn=0;
dsp_new(devn,"56002");/* Allocate structure for device 0, a 56002 */
.....
/* wait for device to request service */
while ((status=dspd_check_service_request(devn))==FALSE);
if (status==DSP_ERROR)
return(DSP_ERROR);
/* device requested service. Now find out why..... */
14.2.12 dspd_fill_memory—Initialize DSP Memory Buffer to Single
Value
#include "simcom.h"
#include "driver.h"
int dsp_fill_memory(device_index,mem_space,address,count,value)
int device_index;/* index of DSP device affected by command */
int mem_space;/* memory space to fill */
unsigned long address;/* address of start of memory block */
unsigned long count;/* length of memory block */
unsigned long value;/* fill value */
dspd_fill_memory() initializes a block of memory on the specified DSP device
device_index to the specified value. count locations starting at address are filled
with value.
Valid values for mem_space are:
•
P_MEM—program memory
•
X_MEM—X data memory
•
Y_MEM—Y data memory
The return value is DSP_OK for success, DSP_ERROR if the transaction fails. See
Example 14-12.
Motorola
Library Functions
14-17
Library Function Descriptions
Example 14-12. dspd_fill_memory()
/* clear P memory on DSP device 1 */
#include "simcom.h"
#include "driver.h"
int devn;
int status;
devn=0;
dsp_new(devn,"56002");/* Allocate structure for device 0, a 56002 */
/* init buffer to ’no value’ */
status=dsp_fill_memory(devn,X_MEM,0x0100l,0x144l,0xffffffl)
14.2.13 dspd_go—Begin Execution on Target DSP Device
#include "simcom.h"
#include "driver.h"
int dspd_go(device_index, opcode, operand)
int device_index;/* Index of DSP device affected by command */
unsigned long opcode;/* values to load into pipeline */
unsigned long operand;/* before starting program execution */
dspd_go() is called to start program execution on the target device device_index.
The target device’s pipeline is loaded with the parameters opcode and operand, and the
device is forced to start executing.
The values loaded into the pipeline via opcode and operand should be the values saved
from the pipeline when the device entered debug mode; if execution is required to
continue from a specific address, the values loaded should form a long jump instruction to
the required execution start address:
opcode:opcode for long jump to required execution start address.
Symbolic names are defined for JUMP opcodes for the device
families in simcom.h.
operand:address of long jump target (execution start address)
The function returns DSP_OK on successful completion, DSP_ERROR otherwise. See
Example 14-13.
14-18
Suite56 ADS Debugger User’s Manual
Motorola
Library Function Descriptions
Example 14-13. dspd_go()
/* Start
#include
#include
#include
execution from address 0x1000 */
"simcom.h"
"protocom.h"
"driver.h"
int err, status, devn;
devn=0;
err=dsp_load("lunchbrk.adm");/* reload devices and program data */
status=dspd_go(devn, DSP_LONGJUMP_56K, 0x1000l); /* & execute from
0x1000 */
14.2.14 dspd_jtag_reset—Reset JTAG Communications
#include "simcom.h"
#include "driver.h"
int dspd_jtag_reset(device_index, reset_type)
int device_index;/* device affected by command */
int reset_type;/* type of reset to perform */
dspd_jtag_reset() resets the JTAG TAP controller for the device device_index.
reset_type may be set to:
•
DSP_JTAG_RESET_HARDWARE—Force reset by asserting trst pin on JTAG port
•
DSP_JTAG_RESET_SOFTWARE—Force reset by toggling tms pin on JTAG port
until the JTAG TAP controller state machine returns to its reset state.
The function returns DSP_OK if the operation succeeds, DSP_ERROR otherwise. See
Example 14-14.
Example 14-14. dspd_jtag_reset()
/* reset JTAG communications with */
#include "simcom.h"
#include "driver.h"
int devn;
int status;
devn=0;
dsp_new(devn,"96002");/* Allocate structure for device 0, a 96002 */
status=dspd_jtag_reset(devn, DSP_JTAG_RESET_HARDWARE)
Motorola
Library Functions
14-19
Library Function Descriptions
14.2.15 dspd_read_core_registers—Read Core Registers from
DSP Device
#include "adsreg56.h"
#include "simcom.h"
#include "driver.h"
int dspd_read_core_registers(device_index, reg_num, count, value)
int device_index;/* Index of DSP device affected by command */
int reg_num;/* First register to read */
unsigned long count;/* Number of registers to read */
unsigned long *value;/* Pointer to area to receive register values */
dspd_read_core_registers() reads count core registers starting at register
reg_num for target device device_index, storing the values in the memory pointed to
by value.
The order of the registers is specified in the header file adsregXX.h
Note:
Calling order is important. dspd_read_once_registers() must be called
before calling dspd_read_core_registers(). If the calling order is
reversed, the values in the OnCE registers will have been altered.
Some registers, for example the a register, may be too large to be held in a single location.
These registers are also defined as a number of smaller registers, a0, a1, and a2. Such
registers require an element in the value array for the compound register, and one for each
of its component parts. The value returned for the compound register is undefined. Each of
the component values is returned, and must be assembled by the calling program if the
value of the compound register is required. The return value is DSP_OK if the operation
succeeds, DSP_ERROR if it fails. See Example 14-15.
Example 14-15. dspd_read_core_registers()
/* Read core registers */
#include "adsreg56.h"
#include "simcom.h"
#include "driver.h"
int devn, status;
unsigned long count_once, buf_once[15], count_core,
buf_core[ADSCOREMAX];
devn=0;
dsp_new(devn,"56002");/* Allocate structure for device 0, a 56002 */
count_once=15;/* all OnCE registers */
count_core = ADSCOREMAX;/* all core registers */
/* get OnCE first, then core */
status=dspd_read_once_registers(devn, OSCR, count_once, buf_once);
status=dspd_read_core_registers(devn, ADS_A, count_core, buf_core);
14-20
Suite56 ADS Debugger User’s Manual
Motorola
Library Function Descriptions
14.2.16 dspd_read_memory—Read Memory Block from DSP Device
#include "simcom.h"
#include "driver.h"
int dspd_read_memory(device_index, mem_space, address, count, value)
int device_index;/* Index of DSP device affected by command */
int mem_space;/* Memory space to read */
unsigned long address;/* Address of first location to read */
unsigned long count;/* Number of locations to read */
unsigned long *value;/* Pointer to area to receive memory values */
dspd_read_memory() reads count words of memory from the DSP device in memory
space mem_space starting at address address, and stores them in the memory pointed to
by value.
Valid values for mem_space are:
•
P_MEM—program memory
•
X_MEM—X data memory
•
Y_MEM—Y data memory
The return value is set to DSP_OK if the operation succeeds, DSP_ERROR if it fails. See
Example 14-16
Example 14-16. dspd_read_memory()
/* Read DSP memory block */
#include "simcom.h"
#include "driver.h"
int devn, status;
unsigned long x_mem_buf[0x100];
devn=0;
dsp_new(devn,"56002");/* Allocate structure for device 0, a 56002 */
.....
/* Read back work buffer */
status = dspd_read_memory(devn, X_MEM, 0x0000l, 0x0100l, x_mem_buf)
Motorola
Library Functions
14-21
Library Function Descriptions
14.2.17 dspd_read_once_registers—Read OnCE Registers from
DSP Device
#include "adsreg56.h"
#include "simcom.h"
#include "driver.h"
int dspd_read_once_registers(device_index, reg_num, count, value)
int device_index;/* Index of DSP device affected by command */
int reg_num;/* First once register to read */
unsigned long count;/* Number of registers to read */
unsigned long *value;/* Pointer to area to receive register values */
dspd_read_once_registers() reads count OnCE registers starting from register
reg_num from target device device_index and stores the values in the memory pointed
to by value.
The order of the registers is specified in the header file adsregXX.h.
Note:
Calling order is important. dspd_read_once_registers must be called
before calling dspd_read_core_registers. If the calling order is reversed,
the values in the OnCE registers will have been altered.
The function returns DSP_OK on success, DSP_ERROR otherwise. See Example 14-17.
Example 14-17. dspd_read_once_registers()
/* Read once registers */
#include "adsreg56.h"
#include "simcom.h"
#include "driver.h"
int devn, status;
unsigned long count_once, buf_once[15], count_core,
buf_core[ADSCOREMAX];
devn=0;
dsp_new(devn,"56002");/* Allocate structure for device 0, a 56002 */
count_once=15;
count_core = ADSCOREMAX;
status=dspd_read_once_registers(devn, OSCR, count_once, buf_once);
status=dspd_read_core_registers(devn, ADS_A, count_core, buf_core);
14-22
Suite56 ADS Debugger User’s Manual
Motorola
Library Function Descriptions
14.2.18 dspd_reset—Reset DSP Device to Debug or User Mode
#include "simcom.h"
#include "driver.h"
int dspd_reset(device_index, reset_mode)
int device_index;/* Index of affected DSP device */
int reset_mode;/* type of reset to perform */
dspd_reset() resets the target device device_index. The device may be reset into
debug mode or user mode, based on the value of reset_mode.
Valid values for reset_mode are:
•
DSP_RESET_DEBUG—reset device into debug mode
•
DSP_RESET_USER—reset device into user mode
The function returns DSP_OK on success, DSP_ERROR otherwise. See Example 14-18.
Example 14-18. dspd_reset()
/* Place DSP device 3 into debug mode */
#include "simcom.h"
#include "driver.h"
int devn, status;
devn=0;
dsp_new(devn,"56002");/* Allocate structure for device 0, a 56002 */
status = dspd_reset(devn, DSP_RESET_DEBUG);/* Reset device into DEBUG
mode */
14.2.19 dspd_status—Determine DSP Status
#include "driver.h"
#include "simcom.h"
int dspd_status(device_index, mode)
int device_index;/* DSP device affected by command */
int *mode;/* address of buffer to receive device status */
dspd_status() places the execution status of the target device device_index in the int
pointed to by mode.
Valid values for *mode are:
•
DSP_USER_MODE—device is executing a user program
•
DSP_DEBUG_MODE—device is in debug mode
The function returns TRUE on success, or FALSE otherwise. See Example 14-19.
Motorola
Library Functions
14-23
Library Function Descriptions
Example 14-19. dspd_status()
/* determine status of DSP 0 */
#include "driver.h"
#include "simcom.h"
int devn, status;
int device_mode;
devn=0;
dsp_new(devn,"56002");/* Allocate structure for device 0, a 56002 */
status = dspd_status(devn, &device_mode);/* get device status */
14.2.20 dspd_write_core_registers—Write Core Registers to DSP
Device
#include "adsreg56.h"
#include "simcom.h"
#include "driver.h"
int dspd_write_core_registers(device_index, reg_num, count, value)
int device_index;/* Index of DSP device affected by command */
int reg_num;/* First once register to write */
unsigned long count;/* Number of register words to write */
unsigned long *value;/* Pointer to area holding register values */
dspd_write_core_registers() writes count core registers starting at reg_num to
target device device_index. The values written are taken from the memory pointed to
by value.
The order of the registers is specified in the header file adsregXX.h
Some registers, for example the a register, may be considered to be an entity in its own
right, or a number of smaller registers, that is a0, a1,and a2. Such registers require an
element in the value array for the compound register, and one for each of its component
parts. The value for the compound register is ignored. Each of the component values is
loaded, thereby changing the value of the compound register.
The function returns DSP_OK on success, DSP_ERROR otherwise. See Example 14-20.
14-24
Suite56 ADS Debugger User’s Manual
Motorola
Library Function Descriptions
Example 14-20. dspd_write_core_registers()
/* Write
#include
#include
#include
core registers */
"adsreg56.h"
"simcom.h"
"driver.h"
int devn, status;
unsigned long core_reg_values[15];
devn=0;
dsp_new(devn,"56002");/* Allocate structures for device 0, a 56002 */
.
.
./* write all core registers from buffer */
status=dspd_write_core_registers(devn, ADS_A, 15l, core_reg_values)
14.2.21 dspd_write_memory—Write to Memory in DSP Device
#include "simcom.h"
#include "driver.h"
int dspd_write_memory(device_index, mem_space, address, count, value)
int device_index;/* Index of DSP device affected by command */
int mem_space;/* Memory space to write */
unsigned long address;/* Address of first location to write */
unsigned long count;/* Number of locations to write */
unsigned long *value;/* Pointer to area holding memory values */
dspd_write_memory() writes count words of memory in the DSP device. The values
are taken from the buffer pointed to by value.
Valid values for mem_space are:
•
P_MEM—program memory
•
X_MEM—X data memory
•
Y_MEM—Y data memory
The return value is set to DSP_OK if the operation succeeds, DSP_ERROR if it fails. See
Example 14-21.
Motorola
Library Functions
14-25
Library Function Descriptions
Example 14-21. dspd_write_memory()
/* Write DSP memory block */
#include "simcom.h"
#include "driver.h"
int devn, status;
unsigned long x_mem_buf[0x100];
devn=0;
dsp_new(devn,"56002");/* Allocate structure for device 0, a 56002 */
status = dspd_write_memory(devn, X_MEM, 0x0400l, 0x0100l,
&x_mem_buf[0])
14.2.22 dspd_write_once_registers—Write OnCE Registers to
DSP Device
#include "adsreg56.h"
#include "simcom.h"
#include "driver.h"
int dspd_write_once_registers(device_index, reg_num, count, value)
int device_index;/* Index of DSP device affected by command */
int reg_num;/* First once register to write */
unsigned long count;/* Number of registers to write */
unsigned long *value;/* Pointer to area holding register values */
dspd_write_once_registers() writes count OnCE registers starting at register
reg_num to the target device device_index. The values written are taken from the
memory pointed to by value.
The order of the registers is specified in the header file adsregXX.h.
The function returns DSP_OK on success, DSP_ERROR otherwise. See Example 14-22.
Example 14-22. dspd_write_once_registers()
/* Write
#include
#include
#include
once registers */
"adsreg56.h"
"simcom.h"
"driver.h"
int devn, status;
unsigned long once_reg_values [15];
devn=0;
dsp_new(devn,"56002");/* Allocate structure for device 0, a 56002 */
.
.
./* write all OnCE registers from buffer */
status=dspd_write_once_registers(devn, OSCR, 15l, once_reg_values)
14-26
Suite56 ADS Debugger User’s Manual
Motorola
Library Function Descriptions
14.2.23 dspt_masm_xxxxx—Assemble DSP Mnemonic
#include "proto56n.h"/* n= k,1,3,8 */
#include "proto96k.h"
int dspt_masm_xxxxx(mnemonic,ops,error_ptr)
char *mnemonic;/* Pointer to assembler mnemonic string */
unsigned long *ops;/* Array for words of assembled code */
char **error_ptr;/* Will point to message if an error occurs */
dspt_masm_xxxxx() invokes the single line assembler to assemble a DSP mnemonic. It
returns one of the following integer codes:
•
–1 An error occurred. The user supplied error pointer error_ptr will point to a
message that explains the error.
•
0 The line mnemonic provided was a comment
•
1 The mnemonic assembled correctly and required 1 word of code. The code will
be in the ops[0] location.
•
2 The mnemonic assembled correctly and required 2 words of code. The first
word will be placed in ops[0], the second in ops[1].
•
3 The mnemonic assembled correctly and required 3 words of code. The first
word will be placed in ops[0], the second in ops[1], the third in ops[2].
Note:
The xxxxx in the function name should be replaced by a device family number.
It should be 56k for the 56000 family devices, 56n00 for the 56n00 family
devices and 96k for the 96000 family devices. See Example 14-23.
Example 14-23. dspt_masm_xxxxx()
/* Assemble the instruction "move r0,r1" */
#include "proto56k.h"
unsigned long opcodes[3];
char *error_ptr;
int retval;
retval=dspt_masm_56k("move r0,r1",&opcodes[0],&error_ptr);
Motorola
Library Functions
14-27
Library Function Descriptions
14.2.24 dspt_unasm_xxxxx—Disassemble DSP Mnemonics
#include "proto56n.h"/* n= k,1,3,8 */
#include "proto96k.h"
int dspt_unasm_xxxxx(ops,return_string,sr,omr,gdbp)
unsigned long *ops;/* Pointer to opcodes to be disassembled */
char *return_string;/* Pointer to return character buffer */
unsigned long sr;/* Value of device status register */
unsigned long omr;/* Value of device operating mode register */
char *gdbp;/* Return value reserved for use by debugger*/
dspt_unasm_xxxxx() disassembles ops[0] (and possibly ops[1] and ops[2] if ops
[0] requires a second or third word) and places the disassembled mnemonic in the
return_string buffer supplied by the user. If correct disassembly requires a device
status register and/or operating mode register value, the values should be provided in the
sr and omr parameters. The gdbp parameter is a pointer reserved for use by the symbolic
debugger; it should be NULL for other applications.
The mnemonic may require as many as 120 characters of return buffer. The function
returns the number (1 to 3) of words consumed by the disassembly. It returns 0 for illegal
opcodes and a return string containing a DC directive.
Note:
The xxxxx in the function name should be replaced by a device family number.
It should be 56k for the 56000 family devices, 56n00 for the 56n00 family
devices, and 96k for the 96000 family devices. See Example 14-24.
Example 14-24. dspt_unasm_xxxxx()
/* Disassembly of the opcode representing NOP */
#include "proto56n.h"
unsigned long ops[3];/*Instruction words to be disassembled.*/
char return_string[120];/*The return mnemonic goes here.*/
int numwords;/*Number of operands used by disassembler.*/
ops[0]=0L;
ops[1]=0L;
ops[2]=0L;
numwords=dspt_unasm_56k(ops,return_string,0L,0L,NULL);
/* Now numwords==1, return_string=="nop" */
14.2.25 dsp_alloc—Allocate Memory
The routines dsp_alloc, dsp_free_mem and dsp_realloc are replacements for the
standard C functions malloc, free and realloc. They are used in much the same way
as the standard functions, for allocating space for structures, buffers, etc. These functions
are used in the debugger libraries; they must also be used exclusively in the user debugger
code. Any attempt to use the standard routines will have unpredictable results.
14-28
Suite56 ADS Debugger User’s Manual
Motorola
Library Function Descriptions
#include "simcom.h"
#include "protocom.h"
void *dsp_alloc(nbytes,clearmem)
unsigned int nbytes;/* Number of bytes to allocate */
int clearmem;/* Clear allocated memory */
dsp_alloc() allocates the number of bytes of memory specified in nbytes. The
memory block allocated is aligned for use as any data type. If clearmem is true (nonzero),
the allocated memory is cleared to zero.
The address of the allocated buffer is returned as the return value, type void*.
If the requested memory cannot be allocated, the error message "Insufficient
memory: dsp_alloc" is output, and the return value is the NULL pointer. See
Example 14-25.
Example 14-25. dsp_alloc()
/* Allocate temporary buffer of 50 int. Buffer is cleared. */
#include "simcom.h"
#include "protocom.h"
int *tbptr
tbptr = (int *) dsp_alloc(50*sizeof(int), 1)
if (tbptr == NULL)
{...handle error...
14.2.26 dsp_cc_fmem—Fill Command Converter Memory with a Value
#include "simcom.h"
#include "protocom.h"
#include "cc.h"
#include "coreaddr.h"
int dsp_cc_fmem(device, mtype, address, count, value)
int device;/* Command Converter affected by command */
enum memory_map mtype;/* Memory space to fill */
unsigned long address;/* Address of start of memory block */
unsigned long count;/* Length of memory block */
unsigned long *value;/* Fill value */
dsp_cc_fmem() initializes a block of memory in the Command Converter device
starting at address address, length count, in address space mtype with the value
pointed to by value.
Valid values for mtype are:
• DSP_CC_YMEM
• DSP_CC_XMEM
• DSP_CC_PMEM
Motorola
Library Functions
14-29
Library Function Descriptions
The return value is TRUE for success, FALSE otherwise. If the return value is FALSE, then
some but not all of the specified locations may have been changed. See Example 14-26.
Example 14-26. dsp_cc_fmem()
/* Initialize CC statistics buffer */
#include "simcom.h"
#include "protocom.h"
#include "cc.h"
#include "coreaddr.h"
int devn, fill_value, status;
devn=0;
dsp_new(devn,"56002");/* Allocate structure for device 0, a 56002 */
fill_value=0;
dsp_cc_fmem(devn, DSP_CC_XMEM, 0xe410l, 0x20l, &fill_value)
14.2.27 dsp_cc_go—Start Command Converter Program Execution
#include "simcom.h"
#include "protocom.h"
int dspd_cc_go(device_index)
int device_index;
dsp_cc_go() starts the Command Converter for the target device device_index
executing from the address indicated by the current program counter.
The return value is TRUE for success, FALSE otherwise. See Example 14-27.
Example 14-27. dsp_cc_go()
/* Start CC running */
#include "simcom.h"
#include "protocom.h"
int devn, status;
devn=0;
dsp_new(devn,"56002");/* Allocate structure for device 0, a 56002 */
status = dspd_cc_go(devn);/* Start Command Converter monitor */
14-30
Suite56 ADS Debugger User’s Manual
Motorola
Library Function Descriptions
14.2.28 dsp_cc_ldmem—Load Command Converter Memory from File
#include "simcom.h"
#include "protocom.h"
int dsp_cc_ldmem(device_index, loadfn)
int device_index;/* Command Converter affected by command */
char *loadfn;/* Name of file to be loaded */
dsp_cc_ldmem() loads memory in the Command Converter device_index from the
file loadfn. This is a lower-level routine which does not call the user-level filename
routines; loadfn must contain the fully-specified name of the file to be opened. The file
is OMF format; the file extension should be .lod
The return value is TRUE on successful completion, FALSE otherwise. See
Example 14-28.
Example 14-28. dsp_cc_ldmem()
/* Load Command Converter memory from file */
#include "simcom.h"
#include "protocom.h"
int devn, status;
devn=0;
dsp_new(devn,"56002");/* Allocate structure for device 0, a 56002 */
status = dsp_cc_ldmem(devn,"c:\dspdev\bin\loadfile.lod");
14.2.29 dsp_cc_reset—Reset Command Converter
#include "simcom.h"
#include "protocom.h"
int dsp_cc_reset(device)
int device;/* CC device affected by command */
dsp_cc_reset() resets the Command Converter device. Function
dspd_cc_architecture() is called to configure the Command Converter for the type
of DSP device attached.
This procedure may be called as part of the initialization procedures to guarantee the
Command Converter is in a known state, to recover from a lockup, or at any other time
when the Command Converter needs to be restarted.
The return value is TRUE if the operation succeeds, FALSE otherwise. See Example 14-29.
Motorola
Library Functions
14-31
Library Function Descriptions
Example 14-29. dsp_cc_reset()
/* reset Command Converter */
#include "simcom.h"
#include "protocom.h"
int devn, status;
devn=0;
dsp_new(devn,"56002");/* Allocate structure for device 0, a 56002 */
status= dsp_cc_reset(devn);/* reset the Command Converter for device 0
*/
14.2.30 dsp_cc_revision—Read Command Converter Monitor
Revision
#include "simcom.h"
#include "protocom.h"
int dspd_cc_revision(device_index, revstring)
int device_index;/* Command Converter affected by command */
char *revstring;/* receives CC monitor revision string */
dsp_cc_revision() interrogates the Command Converter device_index to
determine the monitor revision, and returns a formatted string in revstring containing
the monitor revision.
The format used to create the revstring is:
"Command Converter monitor revision {%4.2f}"
The return value is TRUE on successful completion, FALSE otherwise. See
Example 14-30.
Example 14-30. dsp_cc_revision()
/* obtain Command Converter monitor revision number */
#include "simcom.h"
#include "protocom.h"
int devn, status;
char revision_string[80];
devn=0;
dsp_new(devn,"56002");/* Allocate structure for device 0, a 56002 */
status = dspd_cc_revision(devn, revision_string);
14-32
Suite56 ADS Debugger User’s Manual
Motorola
Library Function Descriptions
14.2.31 dsp_cc_rmem—Read Command Converter Memory
#include "simcom.h"
#include "protocom.h"
#include "cc.h"
#include "coreaddr.h"
int dsp_cc_rmem(device, mtype, address, value)
int device;/* Command Converter affected by command */
enum memory_map mtype;/* Memory space to read */
unsigned long address;/* Address of location to read */
unsigned long *value;/* Target location for read value */
dsp_cc_rmem() reads one location from the Command Converter device, memory
space mtype, address address, and stores the value in the location pointed to by value.
Valid values for mtype are:
• DSP_CC_YMEM
• DSP_CC_XMEM
• DSP_CC_PMEM
The return value is TRUE on successful completion, FALSE otherwise. See
Example 14-31.
Example 14-31. dsp_cc_rmem()
/* Read location from Command Converter memory */
#include "simcom.h"
#include "protocom.h"
#include "cc.h"
#include "coreaddr.h"
int devn, status;
enum memory_map read_memtyp,/* memory space to read */
unsigned long read_address,/* address of location to read */
read_store;/* location to hold read value */
devn=0;
dsp_new(devn,"56002");/* Allocate structure for device 0, a 56002 */
read_memtyp = DSP_CC_XMEM;/* set memory space for read */
read_address=0x0040l;/* set read address */
/* read required location */
status = dsp_cc_rmem(devn, read_memtyp, read_address, &read_store);
Motorola
Library Functions
14-33
Library Function Descriptions
14.2.32 dsp_cc_rmem_blk—Read Command Converter Memory
Block
#include "simcom.h"
#include "protocom.h"
#include "cc.h"
#include "coreaddr.h"
int dsp_cc_rmem_blk(device, mtype, address, count, value)
int device;/* Command Converter affected by command */
enum memory_map mtype;/* Memory space to read */
unsigned long address;/* Address of location to read */
unsigned long count/* number of locations to read */
unsigned long *value;/* Target location for read value */
dsp_cc_rmem_blk() reads count locations from the target Command Converter
device, memory space mtype, address address, and stores the values in the buffer
pointed to by value.
Valid values for mtype are: DSP_CC_YMEM, DSP_CC_XMEM, and DSP_CC_PMEM.
The return value is TRUE on successful completion, FALSE otherwise. See
Example 14-32.
Example 14-32. dsp_cc_rmem_blk()
/* Read memory block from Command Converter memory */
#include "simcom.h"
#include "protocom.h"
#include "cc.h"
#include "coreaddr.h"
int devn, status;
enum memory_map read_memtyp;/* memory space to read */
unsigned long read_address,/* address of first location to read */
read_length,/* number of locations to read */
read_store[1024];/* buffer to hold read values */
devn=0; /* set device number */
dsp_new(devn,"56002");/* Allocate structure for device 0, a 56002 */
read_memtyp = DSP_CC_XMEM;/* set memory space */
read_addr=0x0040l;/* start address */
read_length=55l;/* and block length */
/* now read the memory block into read_store */
status = dsp_cc_rmem_blk(devn, read_memtyp, read_addr, read_length,
read_store);
14-34
Suite56 ADS Debugger User’s Manual
Motorola
Library Function Descriptions
14.2.33 dsp_cc_wmem—Write Command Converter Memory
#include "simcom.h"
#include "protocom.h"
#include "cc.h"
#include "coreaddr.h"
int dsp_cc_wmem(device, mtype, address, value)
int device;/* Command Converter affected by command */
enum memory_map mtype;/* Memory space to write */
unsigned long address;/* Address of location to write */
unsigned long *value;/* Source location for value to write */
dsp_cc_wmem() writes one location in the Command Converter device, memory space
mtype, address address, using the value in the location pointed to by value.
Valid values for mtype are:
• DSP_CC_YMEM
• DSP_CC_XMEM
• DSP_CC_PMEM
The return value is TRUE on successful completion, FALSE otherwise. See
Example 14-33.
Example 14-33. dsp_cc_wmem()
/* Write
#include
#include
#include
#include
to a location in Command Converter memory */
"simcom.h"
"protocom.h"
"cc.h"
"coreaddr.h"
int devn, status;
enum memory_map write_memtyp,/* memory space to write */
unsigned long write_address,/* address of location to write */
write_store;/* location to hold value to write */
devn=0;
dsp_new(devn,"56002");/* Allocate structure for device 0, a 56002 */
write_memtyp = DSP_CC_XMEM;/* set memory space for write */
write_address=0x0040l;/* set write address */
/* write required location */
status = dsp_cc_wmem(devn, write_memtyp, write_address, &write_store);
Motorola
Library Functions
14-35
Library Function Descriptions
14.2.34 dsp_cc_wmem_blk—Write Command Converter Memory
Block
#include "protocom.h"
#include "cc.h"
#include "coreaddr.h"
int dsp_cc_wmem_blk(device, mtype, address, count, value)
int device;/* Command Converter affected by command */
enum memory_map mtype;/* Memory space to write */
unsigned long address;/* Address of location to write */
unsigned long count/* number of locations to write */
unsigned long *value;/* Source buffer for write values */
dsp_cc_wmem_blk() writes count locations in the Command Converter device,
memory space mtype, address address, and obtaining the values from the buffer pointed
to by value.
Valid values for mtype are: DSP_CC_YMEM, DSP_CC_XMEM, and DSP_CC_PMEM.
The return value is TRUE on successful completion, FALSE otherwise. See
Example 14-34.
Example 14-34. dsp_cc_wmem_blk()
/* Write
#include
#include
#include
#include
several locations from Command Converter memory */
"simcom.h"
"protocom.h"
"cc.h"
"coreaddr.h"
int devn, status;
enum memory_map write_memtyp;/* memory space to write */
unsigned long write_addr,/* address of first location to write */
write_length,/* number of locations to write */
write_store[1024];/* buffer holding values to write*/
devn=0; /* set device number */
dsp_new(devn,"56002");/* Allocate structure for device 0, a 56002 */
write_memtyp = DSP_CC_XMEM;/* set memory space */
write_addr=0x0040l;/* start address */
write_length=55l;/* and block length */
/* now write the memory block to device 0*/
status=dsp_cc_wmem_blk(devn, write_memtyp, write_addr, write_length,
write_store);
14-36
Suite56 ADS Debugger User’s Manual
Motorola
Library Function Descriptions
14.2.35 dsp_check_service_request—Check for Service Request
#include "simcom.h"
#include "protocom.h"
int dsp_check_service_request(device_index)
int device_index;/* device affected by operation */
dsp_check_service_request() checks to see if the target device device_index is
requesting service from the host computer, that is, checks to see if the target device is in
Debug Mode.
The return value is TRUE if the device is requesting service, FALSE if it is not, and
DSP_ERROR if the function cannot complete successfully. See Example 14-35.
Example 14-35. dsp_check_service_request()
/* Check if device 0 is requesting service */
#include "simcom.h"
#include "protocom.h"
int devn = 0;
int ok;
dsp_new(devn,"56002");/* Allocate structure for device 0, a 56002 */
ok = dsp_cc_reset(devn);/* reset Command Converter */
ok = dsp_reset(devn);/* and device 0 to debug mode*/
ok = dsp_check_service_request(devn)/* Is device ’devn’ requesting
service? */
14.2.36 dsp_findmem—Get Map Index for Memory Prefix
#include "simcom.h"
#include "protocom.h"
#include "coreaddr.h"
dsp_findmem(device_index,memory_name,memory_map)
int device_index;
/* DSP device to be affected by command */
char *memory_name;/* memory space name */
enum memory_map *memory_map;/* return memory map type */
dsp_findmem() searches the dt_var.mem structure for device device_index for a
match to the memory_name string provided in the function call. If a match is found,
dsp_findmem()returns the memory map maintype structure value through the
memory_map parameter and 1 as the function return value; otherwise it just returns 0 as
the function return value.
For a list of memory names use the emulator help mem command. See Example 14-36
Motorola
Library Functions
14-37
Library Function Descriptions
Example 14-36. dsp_findmem()
/* Get map index for memory space "P" */
#include "simcom.h"
#include "protocom.h"
#include "coreaddr.h"
int devn;
enum memory_map map;
int ok;
devn=0;
dsp_new(devn,"56002");/* Allocate structure for device 0, a 56002 */
ok=dsp_findmem(devn,"P",&map)/* Get memory map index for "P" memory */
14.2.37 dsp_findreg—Get Peripheral and Register Index
#include "simcom.h"
#include "protocom.h"
dsp_findreg(device_index,reg_name,periph_number,reg_number)
int device_index;
/* DSP device index to be affected by command */
char *reg_name;/* register name */
int *periph_number;/* return peripheral index */
int *reg_number;/* return register index */
dsp_findreg() searches the dt_var.periph structures for a match to the reg_name
string provided in the function call. If a match is found, dsp_findreg() returns the
peripheral index through periph_number, the register number through the reg_number
parameter, and 1 as the function return value; otherwise it just returns 0 as the function
return value.
You may also use the emulator "help reg" command to obtain a list of the valid
periph_num and reg_num values, and reg_val size for each register. See
Example 14-37.
Example 14-37. dsp_findreg()
/* Get peripheral index and register number for register ’n3’ */
#include "simcom.h"
#include "protocom.h"
int devn;
int regnum, pnum;
int ok;
devn=0;
dsp_new(devn,"56002");/* Allocate structure for device 0, a 56002 */
ok=dsp_findreg(devn,"n3",&pnum,®num);/* Get index for "n3" register
*/
14-38
Suite56 ADS Debugger User’s Manual
Motorola
Library Function Descriptions
14.2.38 dsp_fmem—Fill Memory Block with a Value
#include "simcom.h"
#include "protocom.h"
#include "coreaddr.h"
dsp_fmem(device_index,memory_map,address,block_size,value)
int device_index;/* DSP device to be affected by command */
enum memory_map memory_map;/* memory designator */
unsigned long address;/* DSP memory start address to write */
unsigned long block_size;/* Number of locations to write */
unsigned long *value;/* Pointer to value to write to memory location */
dsp_fmem() initializes a block of DSP memory with a single value.
The memory_map parameter is a memory type that selects the appropriate dt_memory
structure from dt_var.mem for the selected device device_index. These structures are
described in the simdev.h file which is included with the emulator. The memory_map
parameter can be obtained with the function dsp_findmem() by using the memory name
as a key. Use the emulator help mem command for a list of valid memory names. The
memory_map enum is memory_map_ concatenated with a valid memory map name. As
an example, memory_map_pa refers to off chip pa memory on the 96002 device.
If the selected memory map requires two word values, the least significant word should be
at the value location and the most significant word at the value + 1 location. See
Example 14-38.
Example 14-38. dsp_fmem()
/* Write
#include
#include
#include
300 locations beginning at P:$200 with the value 4 */
"simcom.h"
"protocom.h"
"coreaddr.h"
int devn;
unsigned long address, memval, blocksize;
address=0x200L;
blocksize=300;
memval=4L;
devn=0;
dsp_new(devn,"56002");/* Allocate structure for device 0, a 56002 */
dsp_fmem(devn,memory_map_p,address,blocksize,&memval);
Motorola
Library Functions
14-39
Library Function Descriptions
14.2.39 dsp_free—Free a Device Structure
#include "simcom.h"
#include "protocom.h"
dsp_free(device_index)
int device_index;
/* DSP device index to be affected by command */
dsp_free() frees all allocated memory associated with a device structure for
device_index, and closes any open files associated with the device structure. See
Example 14-39.
Example 14-39. dsp_free()
/* Create three new device structures, then get rid of device 2. */
#include "simcom.h"
#include "protocom.h"
ads_startup("100",ADSP56000);
dsp_startup();
dsp_new(0,"56002");/* Allocate structure for device 0, a 56002 */
dsp_new(1,"56002");/* Allocate structure for device 1, a 56002 */
dsp_new(2,"56002");/* Allocate structure for device 2, a 56002 */
dsp_free(1);/* Free structure for device 1 */
14.2.40 dsp_free_mem—Free Memory Block
The routines dsp_alloc, dsp_free_mem and dsp_realloc are replacements for the
standard C functions malloc, free, and realloc. They are used in much the same way
as the standard functions, for allocating space for structures, buffers, etc. These functions
are used in the debugger libraries; they must also be used exclusively in the user debugger
code. Any attempt to use the standard routines will have unpredictable results.
#include "simcom.h"
#include "protocom.h"
void dsp_free_mem(cp)
char *cp/* pointer to memory block to be freed */
dsp_free_mem() releases a memory block previously allocated with dsp_alloc(). Its
argument cp is the address of the data block. See Example 14-40.
14-40
Suite56 ADS Debugger User’s Manual
Motorola
Library Function Descriptions
Example 14-40. dsp_free_mem()
/* Allocate and release memory block */
#include "simcom.h"
#include "protocom.h"
int *buffer;
int i;
buffer = (int *) dsp_alloc(sizeof(int)*10, 0)
/* Use the buffer */
for (i=0; i<10; i++)
buffer[i]++;
/* And discard it */
dsp_free_mem((char*)buffer);
14.2.41 dsp_go—Initiate DSP Program Execution
#include "simcom.h"
#include "protocom.h"
int dsp_go(device_index)
int device_index;/* DSP device to start executing */
dsp_go() starts the target device device_index to begin executing, in real time, from
the address specified by the current program counter.
The function returns TRUE on successful completion, FALSE otherwise. See
Example 14-41.
Example 14-41. dsp_go()
/* start DSP 0 executing */
#include "simcom.h"
#include "protocom.h"
int devn, status;
char *load_fname="filter2.cld";
devn=0;
dsp_new(devn,"56002");/* Allocate structure for device 0, a 56002 */
status = dsp_ldmem(devn,load_fname);/* load program into memory */
status = dsp_go(devn);/* start program execution */
Motorola
Library Functions
14-41
Library Function Descriptions
14.2.42 dsp_go_address—Initiate Program Execution from Address
#include "simcom.h"
#include "protocom.h"
dsp_go_address(device_index, address)
int device_index;/* DSP device affected by command */
unsigned long address;/* address from which to start executing */
dsp_go_address() causes the target device device_index to begin executing, in real
time, from the address specified by address.
The function returns TRUE on success, FALSE otherwise. See Example 14-42.
Example 14-42. dsp_go_address()
/* Start execution from specified address */
#include "simcom.h"
#include "protocom.h"
int devn, status;
char *load_fname="filter2.cld";
devn=0;
dsp_new(devn,"56002");/* Allocate structure for device 0, a 56002 */
status=dsp_ldmem(devn,load_fname);/* load program into memory */
status=dsp_go_address(devn,0x1400l);/* start program execution */
14.2.43 dsp_go_reset—Initiate Program Execution after Device
Reset
#include "simcom.h"
#include "protocom.h"
dsp_go_reset(device_index)
int device_index;/* DSP device affected by command */
dsp_go_reset() causes the target device specified by device_index to be reset into
User Mode. Execution starts at the reset value for pc.
To place a device into debug mode, see dsp_reset().
The function returns TRUE on success, FALSE otherwise. See Example 14-43.
14-42
Suite56 ADS Debugger User’s Manual
Motorola
Library Function Descriptions
Example 14-43. dsp_go_reset()
/* Initiate program execution by reset */
#include "simcom.h"
#include "protocom.h"
int devn, status;
char *load_fname="filter2.cld";
devn=0;
dsp_new(devn,"56002");/* Allocate structure for device 0, a 56002 */
status=dsp_ldmem(devn,load_fname);/* load program into memory */
status=dsp_go_reset(devn);/* start program execution after device reset
*/
14.2.44 dsp_init—Initialize a Single DSP Device Structure
#include "simcom.h"
#include "protocom.h"
dsp_init(device_index)
int device_index;
/* DSP device index to be affected by command */
dsp_init() initializes a device device_index to the same state that existed following
the dsp_new() call which created it. It is equivalent to performing the emulator FORCE
S command. All memory spaces are cleared, the registers are reset, breakpoints and
input/output file assignments are cleared. See Example 14-44.
Example 14-44. dsp_init()
/* re-initialize a device */
#include "simcom.h"
#include "protocom.h"
dsp_new(0,"56002");/* Create new DSP structure */
.
.
.
dsp_init(0);/* Re-initialize device 0 */
14.2.45 dsp_ldmem—Load DSP Memory from OMF or COFF File
#include "simcom.h"
#include "protocom.h"
int dsp_ldmem(device_index,filename)
int device_index;/* DSP device index to be affected by command */
char *filename;/* Full pathname of OMF format file to be loaded */
dsp_ldmem() loads the memory space of a specified DSP device device_index from
an object file filename. The file may be created as the output from the DSP Macro
Assembler, or by using the Emulator save command; it may be either COFF format or
Motorola
Library Functions
14-43
Library Function Descriptions
".lod" format. In order to specify a COFF format file, the filename suffix must be ".cld". A
filename with any other suffix is assumed to be in ".lod" format.
This is a lower level function that does not invoke the user interface modules for pathname
and automatic ".lod" suffix extension. The entire pathname must be specified.
The function returns 1 if the load is successful, 0 if an error occurred loading the file. See
Example 14-45.
Example 14-45. dsp_ldmem()
/* Create DSP device structures for a three device emulation. */
#include "simcom.h"
#include "protocom.h"
int devn;
int err;
for (devn=0;devn<3;devn++)
dsp_new(devn,"56002");/* Create new DSP structures */
/* Load device 1 with a program named filter2.lod.*/
err=dsp_ldmem(1,"c:\p42\bin\filter2.lod");
14.2.46 dsp_load—Load All DSP Structures from State File
#include "simcom.h"
#include "protocom.h"
int dsp_load(filename)
char *filename;/* Full name of State File to be loaded */
dsp_load() loads the emulator state of all devices from a specified emulator state file
filename. It is not necessary to allocate the device structures prior to calling dsp_load.
This function does not invoke the user interface modules for pathname and automatic
".adm" suffix extension; the entire filename must be specified.
dsp_load returns 1 if the load was successful, 0 if there was an error. See Example 14-46.
Example 14-46. dsp_load()
/* Load the emulator state from the file ’lunchbreak.adm’ */
#include "simcom.h"
#include "protocom.h"
int err;
ads_startup("100",ADSP56000);
dsp_startup();
err=dsp_load("lunchbrk.adm");
14-44
Suite56 ADS Debugger User’s Manual
Motorola
Library Function Descriptions
14.2.47 dsp_new—Create New DSP Device Structure
#include "simcom.h"
#include "protocom.h"
dsp_new(device_index,device_type)
int device_index;/* DSP device index to be affected by command */
char *device_type;/* Name corresponding to DSP device type */
dsp_new() creates a new DSP structure that represents a DSP device, device_index,
and initializes it. It will be necessary to use the dsp_unlock() function call prior to
dsp_new() if the selected device_type is password protected. See Example 14-47.
Example 14-47. dsp_new()
/* Create DSP device structures for a three device emulation. */
#include "simcom.h"
#include "protocom.h"
int devn;
ads_startup("100",ADSP56000);
dsp_startup();
for (devn=0;devn<3;devn++)
dsp_new(devn,"56002");/* Create new DSP structures */
14.2.48 dsp_path—Construct Filename
#include "simcom.h"
#include "protocom.h"
dsp_path(path_name,base_name,suffix,new_name)
char *path_name;/* Directory pathname */
char *base_name;/* Base filename to be appended to path_name */
char *suffix;/* Suffix string to be appended to base_name */
char *new_name;/* Pointer to return buffer for constructed pathname */
dsp_load() constructs a fully-specified path and filename from the user-provided
path_name, base_name, and suffix. The constructed filename is returned in
new_name.
If base_name begins with a pathname separator or with a device designator, path_name
will not be prefixed to base_name. If base_name already ends with "." and some
filename extension, the string in suffix will not be appended. See Example 14-48.
Motorola
Library Functions
14-45
Library Function Descriptions
Example 14-48. dsp_load()
/* Load file filter2.lod from the current working directory for device
0. */
#include "simcom.h"
#include "protocom.h"
#include "simdev.h"
extern struct dev_const dv_const;/* emulator device structures */
char newfn[80];
dsp_new(0,"56002");/* Create new DSP structure */
/*
/*
/*
/*
/*
Create file name from: */
Path specified in device structure dv_const.sv[0]->pathwork */
created by "path..." command */
Base file name filter2 */
Filename suffix .lod. Note the "." is not explicitly specified.*/
dsp_path(dv_const.sv[0]->pathwork,"filter2","lod",newfn);
dsp_ldmem(0,newfn); /* Load file into DSP device 0 */
14.2.49 dsp_realloc—Reallocate Memory Block
The routines dsp_alloc, dsp_free_mem and dsp_realloc are replacements for the
standard C functions malloc, free, and realloc. They are used in much the same way
as the standard functions, for allocating space for structures, buffers, etc. These functions
are used in the debugger libraries, and must also be used exclusively in the user debugger
code. Any attempt to use the standard routines will have unpredictable results.
#include "simcom.h"
#include "protocom.h"
void *dsp_realloc(mem_blk, nbytes)
char *mem_blk;/* Address of existing allocated block */
unsigned int nbytes;/* Required size of memory block */
dsp_realloc() changes the size of a memory block mem_blk previously allocated with
dsp_alloc() to the specified size nbytes. The address of the reallocated block may not
be the same as the address of the original block. The contents of the original block are
preserved— completely if the block size is increased, or appended to the end of the new
block if the block size is reduced. If the requested block cannot be allocated, the original
block is unchanged. See Example 14-49.
14-46
Suite56 ADS Debugger User’s Manual
Motorola
Library Function Descriptions
Example 14-49. dsp_realloc()
/* increase buffer size */
#include "simcom.h"
#include "protocom.h"
int status;
char *bufptr;
/* Allocate temporary buffer of 50 characters. Buffer is cleared. */
bufptr = (char *) dsp_alloc(50*sizeof(char), 1)
if (bufptr == NULL)
{...handle error...}
.
.
.
/* increase buffer size to 82 characters, preserving contents */
bufptr = (char *) dsp_realloc(bufptr, 82*sizeof(char))
14.2.50 dsp_reset—Reset Specified DSP Device
#include "simcom.h"
#include "protocom.h"
int dsp_reset(device_index)
int device_index;/* Index of affected DSP device */
dsp_reset() resets the target device device_index into Debug mode. To reset a
device into User mode, see dsp_go_reset().
The function returns TRUE on success, FALSE otherwise. See Example 14-50.
Example 14-50. dsp_reset()
/* Place DSP device 3 into debug mode */
#include "simcom.h"
#include "protocom.h"
int devn, status;
devn=3;
dsp_new(devn,"56002");/* Create new DSP structure */
/* ensure device in known state */
status = dsp_reset(devn);/* Reset device into DEBUG mode */
Motorola
Library Functions
14-47
Library Function Descriptions
14.2.51 dsp_rmem—Read DSP Memory Location
#include "simcom.h"
#include "protocom.h"
#include "coreaddr.h"
int dsp_rmem(device_index,memory_map,address,return_value)
int device_index;
/* DSP device to be affected by command */
enum memory_map memory_map;/* memory designator */
unsigned long address;/* DSP memory address to read */
unsigned long *return_value;/* Returned memory value (or values) */
dsp_rmem() reads the contents of a selected DSP memory location specified by
memory_map and address, and writes it to return_value. If the memory_map
implies a two-word value, the least significant word will be returned to return_value,
and the most significant word will be returned to the return_value+1 location. This
function also returns a flag that indicates whether or not the memory location exists. It
returns 1 if the location exists, 0 otherwise.
The memory_map parameter selects the appropriate dt_memory structure from
dt_var.mem for the selected device. These structures are described in the simdev.h file
which is included with the emulator. The memory_map parameter can be obtained with
the function dsp_findmem() by using the memory name as a key. Use the emulator help
mem command for a list of valid memory names. The memory_map enum is
memory_map_ concatenated with a valid memory name. As an example,
memory_map_pa refers to off chip pa memory on the 96002 device. See Example 14-51.
Example 14-51. dsp_rmem()
/* Read X memory location 100 from device 0. */
#include "simcom.h"
#include "protocom.h"
#include "coreaddr.h"
unsigned long address;
unsigned long memval;
int devn;
int ok;
devn=0;
dsp_new(devn,"56002");/* Allocate structure for device 0, a 56002 */
address=100L;
ok=dsp_rmem(devn,memory_map_x,address,&memval);
14-48
Suite56 ADS Debugger User’s Manual
Motorola
Library Function Descriptions
14.2.52 dsp_rmem_blk—Read Block of DSP Memory Locations
#include "simcom.h"
#include "protocom.h"
#include "coreaddr.h"
int dsp_rmem_blk(device_index,memory_map,address,count,return_value)
int device_index;
/* DSP device to be affected by command */
enum memory_map memory_map;/* memory designator */
unsigned long address;/* DSP memory address to read */
unsigned long count;/* number of memory locations to read */
unsigned long *return_value;/* Returned memory value(s) */
dsp_rmem_blk() reads count locations starting at address from memory
memory_map in device device_index and writes it to the memory block pointed to by
return_value. If memory_map implies a two word value, the values are returned in
order, with the low-order half of the first word followed by the high-order half, then the
low-order half of the second word. For word n (counting from 0) in the memory block, the
low-order value is stored in return_value[2*n], the high-order value in
return_value[2*n+1]. The function return value indicates whether the memory
locations exist. It returns 1 if all the locations exist, 0 otherwise. The memory_map
parameter selects the appropriate dt_memory structure from dt_var.mem for the selected
device. These structures are described in the simdev.h file. The memory_map parameter
can be obtained with the function dsp_findmem() by using the memory name as a key.
Use the emulator help mem command for a list of valid memory names. The
memory_map enum is memory_map_ concatenated with a valid memory name. See
Example 14-52.
Example 14-52. dsp_rmem_blk()
/* Read 20 X memory locations starting at 100 from device 0. */
#include "simcom.h"
#include "protocom.h"
#include "coreaddr.h"
unsigned long address;
unsigned long count;
unsigned long memval[20];
int devn;
int ok;
devn=0;
dsp_new(devn,"56002");/* Allocate structure for device 0, a 56002 */
address=100L;
count=20L;
ok=dsp_rmem(devn,memory_map_x,address,count,&memval[0]);
Motorola
Library Functions
14-49
Library Function Descriptions
14.2.53 dsp_rreg—Read a DSP Device Register
#include "simcom.h"
#include "protocom.h"
dsp_rreg(device_index,periph_num,reg_num,reg_val)
int device_index;
/* DSP device index to be affected by command */
int periph_num;/* DSP peripheral number */
int reg_num;/* DSP register number */
unsigned long *reg_val;/* Return register value goes here */
dsp_rreg() reads a register specified by periph_num and reg_num from device
device_index and stores the value in the location pointed to by reg_val. Registers
which return more than one word as the register value will return the least significant word
in reg_val[0], or the most significant word in reg_val[1].
Use the emulator "help reg" command to obtain a list of the valid periph_num and
reg_num values, and reg_val size for each register. Also, dsp_findreg() can be
used to obtain the peripheral and register number by using the register name as a key. See
Example 14-53.
Example 14-53. dsp_rreg()
/* Read register r3 from device 0, a 56002. Use dsp_findreg to obtain
the */
/* peripheral and register numbers corresponding to the register name
"r3". */
#include "simcom.h"
#include "protocom.h"
int devn;
int periph_num, reg_num;
unsigned long regval;
devn=0;
dsp_new(devn,"56002");/* Allocate structure for device 0, a 56002 */
if (dsp_findreg(devn,"r3",&periph_num,®_num))
dsp_rreg(devn,periph_num,reg_num,®val);
14.2.54 dsp_save—Save All DSP Structures to State File
#include "simcom.h"
#include "protocom.h"
int dsp_save(filename)
char *filename;/* Full name of State File to be saved */
dsp_save saves all DSP device structures to an emulation state file. This function does
not invoke the user interface functions which provide pathname and.adm suffix extension,
so the entire filename must be specified. The function returns 1 if the save is successful, 0
if an error occurs when saving the file. This function will call the function
dspl_xmsave() as one of the steps of saving the DSP structure. See Example 14-54.
14-50
Suite56 ADS Debugger User’s Manual
Motorola
Library Function Descriptions
Example 14-54. dsp_save
/* Save debugger status in file lunchbreak.adm */
#include "simcom.h"
#include "protocom.h"
int ok;
dsp_new(0,"56002");/* Allocate structure for device 0, a 56002 */
dsp_new(1,"56002");/* Allocate structure for device 1, a 56002 */
/* Save device 0 and 1 to state file lunchbrk.adm. */
ok=dsp_save("lunchbrk.adm");
14.2.55 dsp_spath—Search Path for Specified File
#include "simcom.h"
#include "protocom.h"
int dsp_spath(base, sufx, retn)
char *base;/* Ptr to base file name */
char *sufx;/* Ptr to file extension */
char *retn;/* Ptr to buffer to receive completed file name */
dsp_spath() takes the base filename *base and suffix *sufx supplied as arguments,
and searches the working directory and alternate source paths until the required file is
found.
The working directory is searched first, then each of the alternate source directories in the
order in which the paths were specified. The search terminates immediately if a match is
found. If multiple files exist on the search path with the same name, the only way to access
files after the first file encountered in the search path is to specify the full path explicitly in
the input filename *base.
If a match is found, the filename return buffer *retn contains the fully-specified
filename. *retn is used as working storage and will be changed whether or not a match is
found.
This function returns TRUE if the file is found, FALSE otherwise. See Example 14-55.
Motorola
Library Functions
14-51
Library Function Descriptions
Example 14-55. dsp_spath()
/* find required file on search path*/
#include "simcom.h"
#include "protocom.h"
int devn, status;
char full_name[80];
devn=0;
dsp_new(devn,"56002");/* Allocate structure for device 0, a 56002 */
sim_docmd(devn, "path c:\work\temp");/* set up working directory */
sim_docmd(device_index, "path + c:\work\bin");/* and alternate source
path */
/* find first occurrence of ’myfile’ on path */
status = dsp_spath("myfile", "lod", full_name);
14.2.56 dsp_startup—Initialize DSP Structures
#include "simcom.h"
#include "protocom.h"
int dsp_startup();
dsp_startup() initializes general DSP structures which are not device specific. It
should be called once (and only once) during program initialization before any calls to
ads_startup() and dsp_new(). See Example 14-56.
Example 14-56. dsp_startup()
/* startup */
#include "simcom.h"
#include "protocom.h"
ads_startup("100",ADSP56000);
dsp_startup();/* Initialize DSP structures */
dsp_new(0,"56002");/* Allocate structure for device 0, a 56002 */
dsp_new(1,"56002");/* Allocate structure for device 1, a 56002 */
14-52
Suite56 ADS Debugger User’s Manual
Motorola
Library Function Descriptions
14.2.57 dsp_status—Determine DSP Device Status
#include "simcom.h"
#include "protocom.h"
int dsp_status(device_index, mode)
int device_index;/* DSP device affected by command */
int *mode;/* address of buffer to receive device status */
dsp_status() places the execution status of the target device device_index in the int
pointed to by *mode.
Valid values for *mode are:
•
DSP_USER_MODE—device is executing a user program
•
DSP_DEBUG_MODE—device is in debug mode
The function returns TRUE on success, or FALSE otherwise. See Example 14-57.
Example 14-57. dsp_status()
/* determine status of DSP 0 */
#include "simcom.h"
#include "protocom.h"
int devn, status;
int device_mode;/* receive mode of device 0 */
devn=0;
dsp_new(devn,"56002");/* Allocate structure for device 0, a 56002 */
.
.
.
status = dsp_status(devn, &device_mode); /* get current mode for device
0 */
14.2.58 dsp_step—Execute Counted Instructions
#include "simcom.h"
#include "protocom.h"
dsp_step(device_index, step)
int device_index;/*
unsigned long step;
dsp_step() causes the target device specified by device_index to execute step
instructions. The device then returns to Debug mode.
Note:
Motorola
A success return code means the Command Converter has been instructed to
make the target device execute the required number of instructions. It is
necessary to call dsp_check_service_request() to find out when the
target device has executed the instruction and returned to Debug mode.
Library Functions
14-53
Library Function Descriptions
The function returns TRUE on successful completion, FALSE otherwise. See
Example 14-58.
Example 14-58. dsp_step()
/* Execute 1 DSP instruction on device 0 */
#include "simcom.h"
#include "protocom.h"
int devn, status;
unsigned long step_count;
devn = 0;
dsp_new(devn,"56002");/* Allocate structure for device 0, a 56002 */
step_count = 1l;
status = dsp_step(devn, step_count);
14.2.59 dsp_stop—Force DSP Device into Debug Mode
#include "simcom.h"
#include "protocom.h"
dsp_stop(device_index)
int device_index;/* DSP device affected by command */
dsp_stop() forces the device device_index into Debug mode.
The function returns TRUE on successful completion, FALSE otherwise. See
Example 14-59.
Example 14-59. dsp_stop()
/* force DSP device to debug mode */
#include "simcom.h"
#include "protocom.h"
int devn, status;
devn = 0;
dsp_new(devn,"56002");/* allocate structure for device 0, a 56002 */
.
.
.
status = dsp_ldmem(devn,"x14.lod");/* load program file */
status = dsp_go(devn);/* start the device running user program */
.
...later...
.
status = dsp_stop(devn);/* stop the device now */
.
.
status = ads_cache_registers(devn); /* cache regs on entry to debug
mode */
14-54
Suite56 ADS Debugger User’s Manual
Motorola
Library Function Descriptions
14.2.60 dsp_unlock—Unlock Password Protected Device Type
#include "simcom.h"
#include "protocom.h"
dsp_unlock(device_type, password)
char *password;/* Pointer to string containing password */
char *device_type;/* Name corresponding to DSP device type */
dsp_unlock() provides the password for protected device_types. It must be used
prior to the dsp_new() function call if the device_type is password protected. See
Example 14-60.
Example 14-60. dsp_unlock()
/* Create a device emulation of the password protected 56001 device */
#include "simcom.h"
#include "protocom.h"
int devn;
ads_startup("100",ADSP56000);
dsp_startup();
devn=0;
dsp_unlock("56001","x51-234"); /* provide password for device */
dsp_new(devn,"56001");/* Create structures for protected device type*/
14.2.61 dsp_wmem—Write DSP Memory Location
#include "simcom.h"
#include "protocom.h"
#include "coreaddr.h"
dsp_wmem(device_index,memory_map,address,value)
int device_index;/* DSP device to be affected by command */
enum memory_map memory_map;/* memory designator */
unsigned long address;/* DSP memory address to write */
unsigned long *value;/* Pointer to value to write to memory location */
dsp_wmem() writes a selected DSP memory location.
The memory_map parameter selects the appropriate dt_memory structure from
dt_var.mem for the selected device. These structures are described in the simdev.h file
which is included with the emulator. The memory_map parameter can be obtained with
the function dsp_findmem by using the memory name as a key. Use the emulator help
mem command for a list of valid memory names. Valid memory_map values are
memory_map_ concatenated with a valid memory name. As an example,
memory_map_pa refers to off chip pa memory on the 96002 device.
Motorola
Library Functions
14-55
Library Function Descriptions
If the selected memory map requires two word values, the least significant word should be
at the value location and the most significant word at the value+1 location. See
Example 14-61.
Example 14-61. dsp_wmem()
/* Write
#include
#include
#include
a zero value to address P:200 in device 0 */
"simcom.h"
"protocom.h"
"coreaddr.h"
int devn;
unsigned long address, memval;
address=200L;
memval=0L;
devn=0;
dsp_new(devn,"56002");/* Allocate structure for device 0, a 56002 */
dsp_wmem(devn,memory_map_p,address,&memval);
14.2.62 dsp_wmem_blk—Write DSP Memory Block
#include "simcom.h"
#include "protocom.h"
#include "coreaddr.h"
dsp_wmem_blk(device_index,memory_map,address,count,value)
int device_index;/* DSP device to be affected by command */
enum memory_map memory_map;/* memory designator */
unsigned long address;/* DSP memory address to write */
unsigned long count;/* Number of locations to write */
unsigned long *value;/* Pointer to value to write to memory location */
dsp_wmem_blk() writes count locations starting at address in memory space
memory_map in device device_index, with values taken from the memory block
pointed to by value.
If memory_map implies a two-word value, the values will be retrieved from value in
order, with the low-order half of the first word followed by the high-order half, then the
low-order half of the second word, etc. Thus for word n (counting from 0) in the memory
block, the low-order value is taken from value[2*n], the high-order value from
value[2*n+1].
The memory_map parameter selects the appropriate dt_memory structure from
dt_var.mem for the selected device. These structures are described in the simdev.h file
which is included with the emulator. The memory_map parameter can be obtained with
the function dsp_findmem() by using the memory name as a key. Use the emulator help
mem command for a list of valid memory names. Valid memory_map values are
14-56
Suite56 ADS Debugger User’s Manual
Motorola
Library Function Descriptions
memory_map_ concatenated with a valid memory name. As an example,
memory_map_pa refers to off-chip pa memory on the 96002 device. See Example 14-62.
Example 14-62. dsp_wmem_blk()
/* Copy 100 values in X:$c400 to P:$a000 */
#include "simcom.h"
#include "protocom.h"
#include "coreaddr.h"
int devn;
unsigned long address, count, memval[100];
memval=0L;
devn=0;
dsp_new(devn,"56002");/* Allocate structure for device 0, a 56002 */
address=0xc400;
dsp_rmem(devn,memory_map_x,address,100L,&memval[0]); /* fetch 100
values */
address=0xa000;
/* from X:$c400 */
dsp_wmem(devn,memory_map_p,address,100L,&memval[0]); /* and write to
P:$a000 */
14.2.63 dsp_wreg—Write a DSP Device Register
#include "simcom.h"
#include "protocom.h"
dsp_wreg(device_index,periph_num,reg_num,reg_val)
int device_index;
/* DSP device index to be affected by command */
int periph_num;/* DSP peripheral number */
int reg_num;/* DSP register number */
unsigned long *reg_val;/* Value to be written to register */
dsp_wreg() writes a selected register in the a DSP device.
Use the emulator "help reg" command to obtain a list of the valid periph_num and
reg_num values, and reg_val size for each register. Also, the function
dsp_findreg() can be used to obtain the peripheral and register number by using the
register name as a key.
If a register requires more than one word to represent the data value the least significant
word should be at [reg_val], with more significant words at [reg_val+1], etc. See
Example 14-63.
Motorola
Library Functions
14-57
Library Function Descriptions
Example 14-63. dsp_wreg()
/* Write value 100 to pc register in device 0. Use dsp_findreg to
determine
device and register numbers for pc. */
#include "simcom.h"
#include "protocom.h"
int devn;
int periph_num, reg_num;
unsigned long regval;
devn=0;
dsp_new(devn,"56002");/* Allocate structure for device 0, a 56002 */
regval=100L;
if (dsp_findreg(devn,"pc",&periph_num,®_num))
dsp_wreg(devn,periph_num,reg_num,®val);
14.2.64 sim_docmd—Execute Emulator User Interface Command
#include "simcom.h"
#include "protocom.h"
sim_docmd(device_index,command_string)
int device_index;/* DSP device index to be affected by command */
char *command_string;/* User interface command to be executed */
sim_docmd() executes any emulator command that the emulator normally accepts from
the terminal. ADSDSP normally calls sim_gtcmd() to get a valid command string from
the terminal, then calls sim_docmd() to execute it. The device_index determines
which DSP device (in a multiple DSP emulation) is affected by the command execution.
The devices are numbered 0,1,2...n-1 in an n-device system, so be very careful, for
example, to use 0 for the device_index parameter in a single device system.
If the command_string begins macro execution, the selected device structure
in_macro flag will be set by sim_docmd(). ADSDSP retrieves valid commands from
the macro file by calling sim_gmcmd() as long as the in_macro flag is set. The
commands are still executed by sim_docmd(), whether they come from the terminal or a
macro file.
Some commands initiate device execution (such as go or trace). The target executes until
execution of a breakpoint or the completion of the requested number of instruction steps.
See Example 14-64.
14-58
Suite56 ADS Debugger User’s Manual
Motorola
Library Function Descriptions
Example 14-64. sim_docmd()
/* Use sim_docmd to execute device 0 from address P:40 to breakpoint at
P:80 */
#include "simcom.h"
#include "protocom.h"
int devn;
devn=0;
dsp_new(devn,"56002");/* Allocate structure for device 0, a 56002 */
sim_docmd(devn,"change pc $40");/* Change device 0 pc register to $40
*/
sim_docmd(devn,"break h P:$80");/* Set a breakpoint for device 0 */
sim_docmd(devn,"go");/* Begin execution of device 0 */
14.2.65 sim_gmcmd—Get Command String from Macro File
#include "simcom.h"
#include "protocom.h"
sim_gmcmd(device_index,command_string)
int device_index;
/* DSP device index to be affected by command */
char *command_string; /* Pointer to return buffer for command line */
sim_gmcmd() reads the next emulator command string from a macro file. The
sim_docmd() function will normally determine that a command is a macro, open the
macro file, and set the device structure sim_const.in_macro flag. The sim_gmcmd()
function returns the next line from the open macro file each time it is called. It will clear
the in_macro flag at the end of macro execution or if an invalid macro command is
processed. The command_string buffer should be at least 80 characters. See
Example 14-65.
Example 14-65. sim_gmcmd()
/* Execute the macro command file startup.cmd on DSP device structure 0.
*/
#include "simcom.h"
#include "protocom.h"
#include "simusr.h"
extern struct sim_const sv_const;/* Emulator device structures */
char command_string[80];
int devn;
devn=0;
dsp_new(devn,"56002");/* Create new DSP structure */
sim_docmd(devn,"startup");/* Begin the startup macro */
while (sv_const.in_macro){/* Until end of macro file */
sim_gmcmd(devn,command_string);/* Get command from macro file */
sim_docmd(devn,command_string);/* Execute command string */
}
Motorola
Library Functions
14-59
Emulator Screen Management Functions
14.2.66 sim_gtcmd—Get Command String from Terminal
#include "simcom.h"
#include "protocom.h"
sim_gtcmd(device_index,command_string)
int device_index;
/* DSP device index to be affected by command */
char *command_string; /* Pointer to return buffer for command line */
sim_gtcmd() gets the next command string from the terminal in an interactive mode.
The command line editing, command expansion, and on-line help functions are invoked
by this terminal command input function. The command string is fully checked for errors
prior to returning. The command_string buffer should be at least 80 characters. See
Example 14-66.
Example 14-66. sim_gtcmd()
/* Get and execute emulator commands for device until a go type command
is */
/* entered. */
#include "simcom.h"
#include "protocom.h"
#include "simusr.h"
extern struct sim_const sv_const;/* Emulator device structures */
char command_string[80];
int devn;
devn=0;
dsp_new(devn,"56002");/* Create new DSP structure */
while (!sv_const.sv[devn]->stat.executing){/* Check for go. If not, */
sim_gtcmd(devn,command_string);/* Get command and */
sim_docmd(devn,command_string);/* Execute command */
}
14.3 Emulator Screen Management Functions
The following sections describe functions which are provided in source code form in the
emulator package in the file scrmgr.c. These functions define all the operations associated
with emulator terminal I/O. The code includes conditionally compiled sections for
MSDOS, UNIX, and VMS. The code is provided to allow customizing of the emulator
terminal I/O for a particular environment. The user may, for example, wish to redefine the
control characters used by the emulator so that they map to some particular terminal.
Table 14-8 is a quick reference list of the emulator screen management functions:
14-60
Suite56 ADS Debugger User’s Manual
Motorola
Emulator Screen Management Functions
Table 14-8. Emulator Screen Management Functions
Function
Description
simw_ceol();
Clear to end of line
simw_ctrlbr();
Check for Ctrl-C signal
simw_cursor(line,column);
Move cursor to specified line, column
simw_endwin();
End the emulator display
simw_getch();
Non-translated keyboard input
simw_gkey();
Translated keyboard input
simw_putc(c);
Output character to terminal
simw_puts
(line,column,text,flag);
Output string to terminal at line and column
simw_redo(device);
Repaint screen with output from device
simw_redraw(count);
Redraw screen after scrolling count
simw_refresh();
Screen update after buffering output
simw_scrnest();
Nest output buffering another level
simw_unnest();
Pop output buffering one level
simw_winit();
Initialize window parameters
simw_wscr
(string,commandflag);
Write string and perform logging functions
14.3.1 simw_ceol—Clear to End of Line
simw_ceol()
This function must clear the display from the current column to the end of line, then return
the cursor to the previous position.
14.3.2 simw_ctrlbr—Check for CtrL-C Signal
simw_ctrlbr()
This function must check for the occurrence of a Ctrl-C signal from the terminal. If the
Ctrl-C signal occurs, it sets a flag for the active breakpoint DSP (defined by
sv_const.breakdev). It returns the sim_var.stat.CTRLBR flag for the current
device. This allows the program to select the device that will halt in response to the Ctrl-C
signal from the keyboard in a multiple device emulation.
Motorola
Library Functions
14-61
Emulator Screen Management Functions
14.3.3 simw_cursor—Move Cursor to Specified Line and Column
simw_cursor(line,column)
This function must move the cursor to the specified line and column and update the
sim_const.curline and sim_const.curclm variables.
14.3.4 simw_endwin—End Emulator Window
simw_endwin()
This function is normally called when returning to the operating system level from the
emulator. It must terminate any special processing associated with terminal I/O for the
emulator and clear the display.
14.3.5 simw_getch—Non-Translated Keyboard Input
simw_getch()
This function gets a single character in a non-translated mode from the terminal. It is not
used much by the emulator—only when returning from the execution of the system
command prior to the time when the emulator’s special terminal I/O processing is
reinitialized.
14.3.6 simw_gkey—Translated Keyboard Input
simw_gkey()
This function gets a keystroke from the terminal and maps it to one of the accepted
internal codes used by the emulator. The internal codes are defined in simusr.h. This
function should not output the character to the terminal. This function is a good candidate
for modification if you want to change the set of input control characters used by the
emulator.
14.3.7 simw_putc—Output Character to Terminal
simw_putc(c)
char c;
This function outputs the character in the variable c at the current cursor and column
position. It advances and updates the sim_const.curclm variable. This function is not
used often by the emulator, and it is not very time critical when it is used, so the emulator
implementation is just to call simw_puts() after creating a temporary string from the
character c.
14-62
Suite56 ADS Debugger User’s Manual
Motorola
Emulator Screen Management Functions
14.3.8 simw_puts—Output String to Terminal
simw_puts(line,column,text,flag)
int line;/* Move cursor to this line for output */
int column;/* Move cursor to this column for output */
char *text;/* Text string to be output */
int flag;/* 0=non-bold, 1=bold on/off by {}, 2=all bold */
This function outputs the string in text to the terminal at the specified line and
column. Highlighting of output can be enabled either by setting the flag parameter to 2
or by enclosing text in curly braces and setting the flag parameter to 1.
14.3.9 simw_redo—Repaint Screen with Output from Device
simw_redo(device)
int device;
/* Use screen buffer from this device to repaint screen
*/
This function repaints the screen from a device screen buffer. It is normally only called
when reentering the emulator following a system command, after loading the device state
with the load s filename command, or after switching devices in a multiple device
emulation with the device command.
14.3.10 simw_redraw—Redraw Screen after Scroll Count
simw_redraw(count)
int count;
/* Number of lines to scroll before repainting the screen
*/
This function scrolls up or down count lines in the display buffer, then redisplays the text
in the buffer at that position. This function only displays the text that is in the scrolling
portion of the display.
14.3.11 simw_refresh—Screen Update after Buffering Output
simw_refresh()
The emulator buffers screen output in implementations other than MSDOS in order to
decrease the time spent repainting the screen. This provides a fixed display effect for
consecutive trace commands. The simw_refresh() function will take care of refreshing
the screen following buffering of screen output. It also resets the sim_const.scrnest
variable to 0 to coincide with the non-buffered status of the screen following the refresh.
14.3.12 simw_scrnest—Increase Screen Buffering One Level
simw_scrnest()
This function increments a counter to signify the screen output buffering level. The
companion simw_unnest() and simw_refresh() functions provide the output
Motorola
Library Functions
14-63
Non-Display Emulator
buffering operations for the emulator. The sim_const.scrnest variable is incremented
each time this function is called.
14.3.13 simw_unnest—Decrease Screen Buffering One Level
simw_unnest()
This function decrements the sim_const.scrnest variable each time it is called. If the
screen buffering level drops below one, simw_unnest() will call simw_refresh() to
update the screen.
14.3.14 simw_winit—Initialize Window Parameters
simw_winit()
This function initializes any screen or keyboard parameters that are required for the
emulator terminal I/O environment. It is called whenever the emulator is entered from the
operating system level, which includes the initial emulator entry and re-entry following
the system command.
14.3.15 simw_wscr—Write String and Perform Logging
simw_wscr(text,command_flag)
char *text;/* Text string to write to screen */
int command_flag;/* Flag 1=string is a command, 0= not a command */
This function outputs the string text to the terminal above the command line after
scrolling the display up one line. It also takes care of writing the text string to the proper
log files specified by the emulator log s or log c commands, depending on flag.
14.4 Non-Display Emulator
The emulator package contains object libraries which support both display and nondisplay versions of the emulator. The library nwads contains functions available to the
non-display version of the emulator. The library wwads contains functions that may only
be used in a display version of the emulator. For each device type there are also display
and non-display device-specific libraries named wwxxxxx and nwxxxxx where the xxxxx
is the device number.
The source code contained in anwdsp.c can be linked with the nwxxxxx and nwsim
libraries to create a non-display version of the emulator. Elimination of the user interface
functions cuts the code size of the emulator almost in half. However, all of the functions
listed in Section 14.3, "Emulator Screen Management Functions," and
sim_docmd(), sim_gmcmd() and sim_gtcmd() described in Sections Section
14.2.64, "sim_docmd—Execute Emulator User Interface Command," , Section
14.2.65, "sim_gmcmd—Get Command String from Macro File," , Section 14.2.66,
14-64
Suite56 ADS Debugger User’s Manual
Motorola
Non-Display Emulator
"sim_gtcmd—Get Command String from Terminal," , are sacrificed. The remainder
of the functions in Section 14.2 are available in the non-display emulator libraries.
Some major features of the emulator are eliminated by the loss of the sim_docmd()
function. In particular, there are no low-level entry points provided to set a breakpoint or
to assign input or output files to DSP memory. However, the basic functions required to
create a device, load a program, execute the code, and test or modify device registers are
all still available. The use of these basic functions to support breakpoints is discussed in
Section 14.4.4, "Testing Breakpoint Conditions," . In addition, the dsp_save()
function provides the capability to save the state of the non-display version. The state file
can later be reloaded by a display version of the emulator for visual examination of the
registers and memory contents.
The following sections cover several topics that concern the non-display version of the
emulator. Section 14.4.1, "Creating a New Device," deals with creating a new device.
Section 14.4.2, "Loading Program Code or Device State," describes how to load a
program or state file. Section 14.4.3, "Executing Device Instructions," describes how
to execute device cycles. Section 14.4.4, "Testing Breakpoint Conditions," describes
how to test breakpoint conditions.
14.4.1 Creating a New Device
The simcom.h file defines the maximum number of DSP devices in the constant
DSP_MAXDEVICES. A new device can be created and numbered from 0 to
DSP_MAXDEVICES-1. The structures are allocated by calls to the dsp_new() function
described in Section 14.2.47, "dsp_new—Create New DSP Device Structure," .
The following C source code illustrates the steps necessary to create 3 DSP devices. Note
that the numbers used for device number (0, 1, 2 below) reflect the device numbers set up
on the target hardware, and do not need to be consecutive. See Example 14-67.
Example 14-67. Device Structures Creation
ads_startup("100",ADSP56000);
dsp_startup();
dsp_new(0,"56002");/* Allocate structure for device 0, a 56002 */
dsp_new(1,"56002");/* Allocate structure for device 1, a 56002 */
dsp_new(2,"56002");/* Allocate structure for device 2, a 56002 */
14.4.2 Loading Program Code or Device State
The display version of the emulator provides the high level sim_docmd() function
interface. It allows the user to simply execute the high level load or load s emulator
commands to load program code or a emulator state file. The non-display version of the
emulator makes use of the lower level function calls, dsp_ldmem() and dsp_load(), to
Motorola
Library Functions
14-65
Non-Display Emulator
accomplish the same results. They are described in Section 14.2, "Library Function
Descriptions," . The major difference from their high-level counterparts is that no
filename expansion is provided in the lower level calls. The program code loaded by the
dsp_ldmem() function may be any COFF format or OMF format file. The OMF format
is created as the output of versions of the Macro Assembler prior to release 4.0 and of the
Emulator save command. The COFF format files are the output of the Macro Assembler
beginning with release 4.0, or those saved by the Emulator save command with the suffix
".cld".The Emulator state loaded by the dsp_load() function may have previously been
saved by a display or non-display version of the emulator. The formats are the same. The
dsp_save() function is provided as a low-level entry point that saves the Emulator state
for a non-display version of the Emulator. It is the same function that is called during
execution of the high level save s command, which is only available in the display version.
The only limitation is that the full save filename must be specified. No automatic
expansion is done for the working path or filename suffix as in the higher level emulator
calls. The dsp_save() function is described in Section 14.2.54, "dsp_save—Save All
DSP Structures to State File," .
14.4.3 Executing Device Instructions
After creating a new device—as described in Section 14.4.1, "Creating a New Device,"
—and loading a program or state file—as described in Section 14.4.2, "Loading
Program Code or Device State," —the emulator is ready to execute the program code.
Execution begins at the start address specified in the load file, or continues from the
previous location in an emulator state file. The user’s code may select a new execution
address by writing register "pc" using the dsp_wreg() function, or with
dsp_go_address().
14.4.4 Testing Breakpoint Conditions
The command line interface in the display version of the emulator provides facilities to
specify breakpoint conditions. When the breakpoint condition is met during user program
execution, the emulator displays the enabled registers (assuming the breakpoint action is
halt). The non-display emulator does not provide a way to specify breakpoint conditions.
It is up to the user’s code to examine device registers or memory conditions and decide
whether or not to continue execution. The device registers and memory can be examined
using the dsp_rreg() and dsp_rmem() functions. The emulator hardware executes
independently of the emulator control software. After successfully completing a call to
initiate instruction execution (e.g. dsp_go_address(), dsp_go, dsp_step()), the
device executes until a termination condition is encountered.
14-66
Suite56 ADS Debugger User’s Manual
Motorola
Non-Display Emulator
Termination conditions include:
•
Hardware breakpoint condition satisfied
•
DEBUG instruction executed
•
Specified number of instructions executed in dsp_step
•
Call to dsp_reset, etc.
When the device stops executing, the function dsp_check_service_request()
returns TRUE. It is then the responsibility of the user program to determine the reason for
the service request. Hardware breakpoints are described in the appropriate hardware
documentation and are not covered here.
Software breakpoints are caused by executing conditional or unconditional DEBUG
instructions. These instructions must be inserted into the user DSP code. This may be
achieved in several possible ways (not all of which are suitable for production code):
•
Hard-coded DEBUG instructions included in the DSP code.
•
NOP instructions in code which may be overwritten with DEBUG instructions.
•
Save instruction word and overwrite with an unconditional DEBUG instruction.
MUST be the first word of multi-word instructions.
It is the responsibility of the user code to retain the addresses of the DEBUG instructions
and carry out the desired checks and actions when they are encountered.
In the first two possibilities, no special action is needed to continue program execution. A
call to dsp_go() or dsp_step() will resume device execution at the location following
the DEBUG instruction. Although inappropriate for production code, this approach is
simple.
With the third approach, it is necessary to restore the original instruction before
continuing, and then reinstate the breakpoint as necessary. The full operation of setting
and handling the breakpoint is outlined below:
1. Save contents of breakpoint location(s).
2. Overwrite with DEBUG instruction(s).
3. Start execution with call to dsp_go().
4. Repeatedly call dsp_check_service_request() until return value is TRUE.
5. Save registers with ads_cache_registers().
6. Read pc address.
7. Check for breakpoint address and carry out required checks and actions.
Motorola
Library Functions
14-67
Multiple Device Emulation
8. Write the saved instruction word back to memory.
9. Reset the pc register to the breakpoint address.
10. Execute 1 instruction with dsp_step.
11. Repeatedly call dsp_check_service_request() until return value is TRUE.
12. Continue from (2) above.....
Note:
This is only a general outline and may need to be modified for specific
circumstances.
Consideration always needs to be given to the case where the first instruction to be
executed is itself the target of a breakpoint. In this case, step over that instruction before
inserting the DEBUG instructions. Adding or deleting of breakpoints needs to be handled.
Steps (4) and (11) above do not need to be tight loops. Calls to
dsp_check_service_request() may be made at convenient points in other
processing to determine when the device is ready.
14.5 Multiple Device Emulation
The ADSDSP emulator may be used to emulate a single DSP device or multiple devices.
As many devices as are required by the target configuration may be configured using the
device command or dsp_new function(). The following sections describe some
details about the way the emulator handles multiple devices. Section 14.5.1, "Allocation
and Initialization of Multiple Devices," describes the required steps to allocate and
initialize multiple DSP structures. Section 14.5.2, "Controlling Multiple DSP Devices,"
describes the method of controlling multiple devices. Section 14.5.3, "Multiple DSP
Emulator Display," describes display of device output in the multiple device
environment.
14.5.1 Allocation and Initialization of Multiple Devices
Most of the higher level emulator functions require a device index as one of the
parameters. The emulator uses the device index to select a previously allocated DSP
structure. The DSP structures are allocated dynamically by calling the dsp_new()
function for each device. The device type is also selected in the dsp_new() function call.
In the display version of the emulator, the device command handles the details of calling
dsp_new(). The proper sequence of instructions necessary to allocate three DSP devices
is shown below.
14-68
Suite56 ADS Debugger User’s Manual
Motorola
Multiple Device Emulation
ads_startup("100",ADSP56000);
dsp_startup();
dsp_new(0,"56002");/* Allocate structure for device 0, a 56002 */
dsp_new(1,"56002");/* Allocate structure for device 1, a 56002 */
dsp_new(2,"56002");/* Allocate structure for device 2, a 56002 */
14.5.2 Controlling Multiple DSP Devices
Each target device operates independently under the control of the ADSDSP emulator.
The basic execution sequence for a single target device is unchanged:
1. Initialize DSP device.
2. Load memory.
3. initialize breakpoints as desired.
4. initiate execution (dsp_go(), dsp_step(), etc.).
5. If desired, interrupt execution with dsp_reset() or dsp_stop().
6. call dsp_check_service_request() to detect return to Debug Mode.
When controlling multiple devices, all devices require initialization as above. Whenever a
device starts executing, as a result of a command like step or a function call like
dsp_go(), execution starts immediately for the specified device and continues
independently of the ADS. Each device must be started by a separate command or
function call. Execution continues until an event in the device causes the device to enter
Debug Mode, such as reaching a breakpoint or the required number of instructions being
executed, or the ADS stops execution for a target, with a force b command or a call to
function dsp_stop(). All other devices will continue executing while that device is
being serviced. The emulator needs to check each device to see if it has entered Debug
Mode by calling dsp_check_service_request() for each executing device in turn.
This may be coded as a tight loop for maximum response, or interleaved with other
activity as required.
14.5.3 Multiple DSP Emulator Display
The emulator display functions are contained in the source file scrmgr.c in the emulator
package. This code supports the scrolling virtual screen for the ADS. The supplied display
code uses a single window. The lines above the command line form a scrolling region in
which session output is displayed. The command line, error line, and help line are the
three bottom lines of the display. The default size of the scroll buffer holds 100 lines of
output. As each device causes output to the screen, a message is output specifying which
device caused the output. The device command allows the user to switch the displayed
device. When it switches to a new device, it refreshes the entire screen from the device’s
display buffer.
Motorola
Library Functions
14-69
Reserved Function Names
14.6 Reserved Function Names
The public function names used in the emulator all begin with the prefixes dsp_, ads_, or
sim_. Functions which begin with sim_ are only available when a display version of the
emulator is created. Functions which begin with dsp_ and ads_ are available to both
display and non display versions. The screen management functions all begin with simw_.
In general, functions which begin with dsp_ or sim_ are higher level functions available
for direct reference from the user’s code; those beginning with dspd_, dspl_ or siml_
are meant only for internal use by the emulator. The higher level functions and the screen
management functions are documented in Section 14.2, "Library Function
Descriptions," and Section 14.3, "Emulator Screen Management Functions," . The
public functions are listed in the file named global.sym which is included with the
distribution.
14.7 Emulator Global Variables
In order to reduce conflicts with user variable names, the emulator global variables have
been grouped together into several large structures. In general, the structure names
beginning with s are used defined in simusr.h and are only used in the display version of
the emulator; while those beginning with d are defined in simdev.h and are used by both
the display and non-display versions of the emulator. The prefixes st_ and dt_ are used
for structure names of device-type structures, that is structures which must be defined for
each device type. The prefixes sim_ and dev_ are used for structure names of general
device or simulation structures.
Global variable names may have a prefix dx_, dv_, sx_, or sv_. The prefix dx_ is used
for variables of dt_ structures. The prefix dv_ is used for variables of dev_ structures.
The prefix sx_ is used for variables of st_ structures. The prefix sv_ is used for variables
of sev_ structures. A list of emulator global variables is included in the distribution file
named global.sym.
14-70
Suite56 ADS Debugger User’s Manual
Motorola
Modification of Emulator Global Structures
14.8 Modification of Emulator Global Structures
The source file simglob.c, which is included in the emulator package, contains the global
structures sv_const and dv_const. There are some useful modifications, described
below, that can be made to the constant definitions at the beginning of simglob.c. The
simglob.c module must then be recompiled and relinked using the make file provided with
the emulator package.
•
DSP_MAXDEVICES—This define constant determines the maximum number of
devices that can be allocated using the emulator’s device command. As a default it
is set to 32.
•
DSP_CMDSZ—This define constant determines the size of the previous command
stack. The emulator commands are stored in the stack and can be reviewed using
the Ctrl-f and Ctrl-b key entries. As a default the previous command stack size is
set to 10.
•
DSP_WINSZ—This define constant determines the size of the screen buffer that is
maintained and displayed by the scrmgr.c functions. It specifies the number of
display lines that will be allocated for each device as they are created with the
emulator device command. The user can use the Ctrl-u, Ctrl-t, Ctrl-v, and Ctrl-d
key sequences to review display lines that have scrolled off the screen. This
constant should not be set to a value smaller than the number of lines in the display
window.
Motorola
Library Functions
14-71
Modification of Emulator Global Structures
14-72
Suite56 ADS Debugger User’s Manual
Motorola
Index
Symbols
abbreviations 13-6
.adm 14-44, 14-50
ads_cache_registers 14-7
ads_startup 14-8
alternate directories 4-1
assembly 12-7, 13-51, 13-53
assign 6-4, 6-5, 6-6, 6-11, 6-13, 13-32, 13-33, 13-34,
13-40, 13-41, 13-42
reset 14-31
command entry
command line editing 14-60
expansion 14-60
macro file 14-58, 14-59
terminal 14-58, 14-60, 14-61
command execution
macro file 14-58, 14-59
trace mode 14-63
Command Window 12-3, 12-4, 13-54
commands 9-1, 9-2, 12-3, 13-38, 13-47, 13-48, 13-54
system 14-62, 14-63
comment
from dspt_masm 14-27
configure 7-2
constants 10-6
copy 5-7
count 13-51
CTRL-C 14-61
B
D
break 2-15, 3-16, 3-20, 3-21, 13-10, 13-13, 13-14,
13-15, 13-28, 13-53
breakpoint 2-12, 2-13, 2-14, 2-16, 2-17, 2-18, 3-10,
3-11, 3-12, 3-17, 3-18, 3-19, 3-20, 3-22, 12-2,
13-50, 13-53
continue 14-67
testing 14-58, 14-66
breakpoints 2-15, 2-16, 2-17, 2-18, 3-16, 3-18, 3-19,
3-20, 3-22, 12-2, 13-10, 13-11, 13-12, 13-13,
13-52
button 11-2, 11-3, 11-4, 11-5, 11-6, 11-7, 11-8
data 13-32, 13-33, 13-34, 13-35, 13-40, 13-41, 13-42
debugging 8-1, 10-4
decimal 13-44
default 7-4
device 6-1, 7-1, 7-2, 7-3, 7-4, 11-6, 13-50
device mode 14-23, 14-37
directories 4-1
directory 2-2, 2-3, 2-4, 4-1, 4-2, 4-3, 4-4, 13-42, 13-43
disable 3-22, 8-5
disassemble 5-8
display 2-8, 8-7, 10-10, 12-1, 12-2, 13-36, 13-39,
13-51, 13-54, 13-55
display support 14-1
divide 10-7
down 8-1, 8-2, 13-51
dsp_alloc 14-28, 14-29
dsp_cc_fmem 14-29
dsp_cc_go 14-30
dsp_cc_ldmem 14-31
dsp_cc_reset 14-31
dsp_cc_revision 14-32
dsp_cc_rmem 14-33
dsp_cc_rmem_blk 14-34
dsp_cc_wmem 14-35
dsp_cc_wmem_blk 14-36
dsp_check_service_request 14-37, 14-53
$ 13-44
.adm 7-7, 13-45
.cld 4-6, 13-37, 13-45
.cmd 13-38
.lod 4-7, 13-36, 13-37, 13-45
.log 13-38
A
C
C functions 8-4
C source code 8-1
call stack 8-3, 12-9
chain 7-3
change 7-5, 7-6, 13-31, 13-32
.cld 14-44, 14-66
close 13-43, 13-53, 13-54, 13-55, 13-56, 13-57, 13-58
.cmd 14-59
COFF 4-5, 13-36, 13-37, 13-45
command converter
flag word 14-11, 14-14
monitor revision 14-32
Motorola
Index-1
dsp_findmem 14-37
dsp_findreg 14-8, 14-38
dsp_fmem 14-39
dsp_free 14-40
dsp_free_mem 14-40
dsp_go 14-41
dsp_go_address 14-42
dsp_go_reset 14-42
dsp_init 14-43
dsp_ldmem 14-43
dsp_load 14-44
dsp_new 14-10, 14-45, 14-65
dsp_path 14-45
dsp_realloc 14-46
dsp_reset 14-47
dsp_rmem 14-48
dsp_rmem_blk 14-49
dsp_rreg 14-8, 14-50
dsp_save 14-50
dsp_spath 14-51
dsp_startup 14-52
dsp_status 14-53
dsp_step 14-53
dsp_stop 14-54
dsp_unlock 14-55
dsp_wmem 14-55
dsp_wreg 14-57
dspd_break 14-9
dspd_cc_architecture 14-10
dspd_cc_read_flag 14-11
dspd_cc_read_memory 14-12
dspd_cc_reset 14-13
dspd_cc_revision 14-13
dspd_cc_write_flag 14-14
dspd_cc_write_memory 14-15
dspd_check_service_request 14-16
dspd_fill_memory 14-17
dspd_go 14-18
dspd_jtag_reset 14-19
dspd_read_core_registers 14-20, 14-22
dspd_read_memory 14-21
dspd_read_once_registers 14-20, 14-22
dspd_reset 14-23
dspd_status 14-23
dspd_write_core_registers 14-24
dspd_write_memory 14-25
dspd_write_once_registers 14-26
dspt_masm_xxxxx 14-27
dspt_unasm_xxxxx 14-28
execute 2-19, 3-2, 3-3, 3-4, 3-5, 3-6, 3-7, 3-8, 3-24,
3-25, 3-26, 13-39, 13-46, 13-47, 13-48, 13-49
exit 13-43
expressions 8-7, 10-1, 10-2, 10-6, 10-9, 10-10, 13-27
F
file i/o
commands 14-58, 14-59
filename 14-46
memory 14-66
state file 14-44, 14-50, 14-65
filename 13-42, 13-43
filename suffixes
.adm 14-44, 14-50
.cld 14-44, 14-66
.cmd 14-59
.lod 14-31, 14-44
files 4-5, 6-1
finish 3-25, 11-5, 13-28
force 13-28, 13-29
format 6-1
frame 8-3 , 8-4, 13-29, 13-51
function 13-54
function library
filenames 14-64
function name prefixes 14-2
global variables 14-70
G
GO 2-17, 2-18, 2-19, 2-20, 3-1, 3-2, 3-3, 3-18, 11-2,
13-30
H
hardware 2-15, 2-16, 3-16, 3-17
help 12-4, 13-30, 13-31
hexadecimal 13-44
host 13-31, 13-32
I
I/O 6-1, 8-5, 8-6, 13-44
initialization
window parameters 14-64
input 6-1, 6-2 , 6-3, 6-4 , 6-5, 6-6 , 6-7, 6-8, 6-9, 6-10,
13-32, 13-33, 13-34, 13-35, 13-45, 13-47, 13-55
instruction 13-46, 13-47, 13-48, 13-49
introduction 10-1
E
J
enable 3-22, 8-5
evaluate 10-2, 13-27, 13-28
JTAG reset types 14-19
Index-2
Suite56 ADS Debugger User’s Manual
Motorola
L
P
list 13-35, 13-36, 13-52, 13-53, 13-55
load 2-5, 2-6, 4-4, 4-5, 7-7, 13-36, 13-37, 13-45
lock 13-50
.lod 14-31, 14-44
log 9-1, 9-2, 13-38
page 13-39
parameters 13-6
password 13-50
path 2-2, 2-3, 2-4, 4-1, 4-2, 4-3, 4-4, 13-42, 13-43
pathname 13-42, 13-43
pause 3-24
point 8-1, 8-2
position 7-3
preferences 7-8
M
macro command file
execution 14-58, 14-59
in_macro 14-58, 14-59
macros 13-39
memory 5-4, 5-5, 5-6, 5-7, 5-8, 7-1, 7-3, 10-3, 13-44,
13-45, 13-46, 13-50, 13-56
allocate 14-46
allocation 14-28, 14-29
deallocate 14-40
get map index 14-37
load 14-31, 14-43
load state 14-44
read 14-12, 14-21, 14-33, 14-34, 14-48, 14-49
write 14-15, 14-17 , 14-25, 14-29, 14-35, 14-36,
14-39, 14-55
modify 5-3, 7-4, 7-5, 7-6
monitor 8-4
more 13-39
move 8-1, 8-2
multiple devices 14-68
device index 14-58
halting 14-61
N
next 3-6, 3-7, 11-4, 13-39
non-display emulation
library file 14-64
library restrictions 14-64
loading program code 14-65
number system 7-5, 7-6
nwads 14-64
O
object files 13-36
OMF 4-5, 4-7, 13-36, 13-37, 13-45, 13-46
open 13-53, 13-54, 13-55, 13-56, 13-57, 13-58
operating system 13-47 , 13-48
operators 10-7, 10-8, 10-9
output 6-1, 6-3, 6-11, 6-12, 6-13, 6-14, 6-15, 6-16,
9-2, 12-4, 12-5, 12-6, 13-40, 13-41, 13-42, 13-45,
13-47, 13-56, 13-57
Motorola
Q
quit 13-43
R
radix 7-5, 7-6, 12-1, 13-44
redirect 8-6, 13-44, 13-45
registers 5-2, 5-3, 10-3, 13-44, 13-50, 13-57
get index 14-38
read 14-20, 14-22, 14-50
write 14-24, 14-26, 14-57
repeat 11-7
reset 2-2, 7-7, 11-8, 13-28, 13-29
result 13-49
RTS 13-28
S
save 4-5, 4-6, 4-7, 13-45, 13-46
screen buffer 14-63
Screen management functions 14-60
scrmgr.c 14-69
scroll 13-39
session 9-2, 12-4, 12-5, 12-6, 13-38, 13-39, 13-57
set 7-4
sim_gmcmd 14-59
sim_gtcmd 14-60
simw_ceol 14-61
simw_ctrlbr 14-61
simw_cursor 14-62
simw_endwin 14-62
simw_getch 14-62
simw_gkey 14-62
simw_putc 14-62
simw_puts 14-63
simw_redo 14-63
simw_redraw 14-63
simw_refresh 14-63
simw_scrnest 14-63
simw_unnest 14-64
simw_winit 14-64
Index-3
simw_wscr 14-64
source 8-1, 12-8, 13-51, 13-57, 13-58
source code 8-1, 12-8, 13-57
stack 8-1, 8-2, 8-3, 8-4, 12-9, 13-29, 13-51, 13-54,
13-55, 13-58
start 2-19, 2-20, 3-2, 3-3, 13-30
start execution 14-41, 14-42 , 14-53
state file 7-7, 13-45
stderr 13-44, 13-45
stdin 13-44, 13-45
stdout 13-45
step 3-3, 3-4, 3-6, 11-3, 13-39, 13-46, 13-47, 13-49
stop 3-26, 11-2
stop execution 14-54
stream 8-5, 8-6, 8-7, 13-44, 13-45, 13-47
streams 8-5, 8-6, 8-7, 13-44, 13-45, 13-47
subroutine 13-28 , 13-39
symbols 10-3
system 13-47, 13-48
wsession 13-57
wsource 13-57
wstack 13-58
wwads 14-64
wwatch 13-58, 13-59
T
TMS 7-3
toolbar 11-1, 11-3, 11-4, 11-6
trace 3-5, 13-46, 13-48, 13-49
type 8-7, 13-49, 13-50
U
unlock 13-50
unsigned 13-44
until 3-8, 13-50
up 8-1, 13-51
V
variable 8-7
view 13-51, 13-55
W
wait 3-24, 13-51, 13-52
watch 2-10, 2-11, 5-9, 10-10, 10-11, 13-52, 13-53,
13-58, 13-59
wcalls 13-54
wcommand 13-54
where 13-54, 13-55
window 7-8, 12-4, 12-5 , 12-6, 12-7, 12-8, 13-53,
13-54, 13-55, 13-56, 13-57, 13-58, 13-59
winput 13-55
wlist 13-55
wmemory 13-56
working directory 2-2, 2-4, 4-3, 4-4
woutput 13-56
wregister 13-57
Index-4
Suite56 ADS Debugger User’s Manual
Motorola